

Abstract
The NADase Sarm1 has emerged as an important modulator of programmed axonal degeneration over the past decade but it’s mode of activation within the cell is not clearly understood. Sarm1 is predominantly expressed in the neurons, kidney and liver but the non-neuronal regulation of Sarm1 remains relatively unexplored. Here we demonstrate that treatment of the human embryonic kidney cell line HEK293 cells with the mitochondrial complex I inhibitor rotenone, induced early loss of NAD+ that preceded induction of Sarm1, a primary mediator of rotenone induced cell death. Interestingly, replenishing NAD+ levels by PARP inhibition, a major NAD+ consumer within the cell, not only restored mitochondrial homeostasis but also prevented subsequent Sarm1 induction by rotenone. These early changes were further marked by a distinct subcellular localization pattern of Sarm1 in the nucleus and the mitochondria that was accompanied by significantly reduced cell death. Taken together, our study provides the first preliminary evidence of temporal regulation of endogenous Sarm1 by fluctuating NAD+ levels induced by rotenone that may act as a “biological trigger” of Sarm1 activation. This also points towards an important understanding on how PARP inhibitors like PJ34 could be repurposed in the treatment of Sarm1 mediated mitochondrial deficiency disorders.
Introduction
Mitochondrial Complex I deficiency has been reported in a number of diseases with mitochondrial disorders and has been strongly linked to patients with Parkinson’s disease (PD) (Schapira et al., 1990; Keeney et al., 2006; Distelmaier et al., 2009). Rotenone, a lipophilic insecticide, has been shown to be a potent inhibitor of mitochondrial complex I (Ueno et al., 1996; Li et al., 2003). Several studies have indicated that rotenone mediated cell death is associated with mitochondrial depolarization, DNA damage and ROS formation that corroborates with similar observation in other mitochondrial complex I deficiency disorders (Tada-Oikawa et al., 2003; Tsujimoto and Shimizu, 2007; Liu et al., 2016; Pal et al., 2014). So, how this mitochondrial dysfunction induced by rotenone correlates with cell death? Our previous study has indicated that the TLR adaptor protein Sarm1 plays a pivotal role in this process as Sarm1 knockdown showed a significant reduction in rotenone induced cell death in SH-SY5Y cells (Sur et al., 2018). Sarm1 is a NAD+-hydrolyzing enzyme that upon activation causes loss of NAD+ resulting in severe energy depletion within the axons with subsequent induction of axonal degeneration (Gerdts et al., 2015; Summers et al., 2016; Essuman et al., 2017). Although Sarm1 has emerged as an important regulator of programmed axonal destruction, how the expression and subcellular localization of endogeneous Sarm1 is regulated within the cell is not well defined till date. Further, the non-neuronal regulation of this protein is understudied. Since Sarm1 and rotenone induced cell death seems to be intricately linked, we envisioned that this may serve as an excellent cellular model to understand how this protein is endogenously regulated during mitochondrial complex I deficiency disorders.
In SH-SY5Y cells, Sarm1 was shown to be induced six hours post rotenone treatment and this delayed induction could not be well explained (Sur et al., 2018). In a recent study, addition of rotenone induced pathological axon degeneration and was accompanied by increase in cADPR levels, an indicator of Sarm1 activation (Hughes et al., 2021) within 3 h of treatment. Taken together, these studies strongly indicate that buildup of cellular stress following rotenone treatment may act as an early ‘trigger’ of Sarm1 activation and removal of this trigger may prevent Sarm1 induction and subsequent cell death. Hence the next pertinent question was to decipher whether a single molecule or a cumulative phenomenon acted as a biological trigger of Sarm1 activation within the cells.
Although the NADase Sarm1 has been shown to mediate rotenone induced cell death, it is not known how NAD+ levels are regulated upon rotenone treatment of cells and their role in the regulation of mitochondrial homeostasis. Recent reports have emerged that indicates NAD+, an essential cellular co-factor, to be a key determinant of mitochondrial health and homeostasis (Loreto et al., 2020; Hwang and Hwang, 2017) and decides cell fate by participating in cell death networks like apoptosis, autophagy or parthanatos (Amjad et al., 2021; Hsieh et al., 2020; Cantó, Menzies and Auwerx, 2015). Under situations of stress that induces mitochondrial damage, a process termed ‘mitophagy’ is initiated to remove these damaged organelles and restore cellular homeostasis. It has been suggested that accumulation of damaged mitochondria arising due to incomplete clearance by mitophagy is associated with rapid cell death in cells lacking a functional autophagy machinery (Ashrafi and Schwarz, 2013; Scheibye-Knudsen et al., 2012). However, no evidence linking loss of NAD+ function and defective mitochondrial clearance by autophagy have emerged so far in the context of mitochondrial complex I inhibition mediated by rotenone. Studies on rotenone mediated autophagy are inconclusive (Mader et al., 2012; Zeng et al., 2019) and it is unclear whether defective mitochondrial clearance by mitophagy plays a determining role in rotenone induced cell death. Cumulatively, these observations leads to the interesting speculation whether loss of NAD+ following rotenone treatment results in an incomplete clearance of dysfunctional mitochondria by a defective autophagy machinery. This, in turn, may build up the cellular stress leading to Sarm1 activation which may then act as the final trigger of rotenone-induced cell death. Autophagy is one of the major sources of replenishing cellular energy levels following stress (Guo et al., 2016; Singh and Cuervo, 2011) and a defective autophagy machinery may lead to further energy depletion within these cells which may account for the time lag between rotenone treatment and Sarm1 induction.
The two main classes of enzymes that are responsible for maintaining intracellular NAD+ pool are the NAD+ consuming enzymes Sirtuins and PARPs (Verdin, 2015; Imai and Guarente, 2014). While the short-term activation of PARPs triggering a DNA damage response is considered to be crucial for maintaining cellular homeostasis, prolonged activation of PARPs causes rapid degradation of NAD+ and eventual cell death (Mashimo et al., 2021; Komulainen et al., 2021). We show here for the first time that rotenone treatment resulted in an early loss of NAD+ that may act as the ‘biological trigger’ of Sarm1 activation and subsequent cell death. This NAD+ loss was accompanied by early mitochondrial dysfunction and a defective autophagic flux that was followed by Sarm1 induction. Interestingly, replenishing NAD+ levels by pre-incubation of cells with the PARP inhibitor PJ34 restored cellular NAD+ levels and significantly reduced Sarm1-induced cell death. To obtain a generalized overview of rotenone-mediated Sarm1 regulation, we have primarily conducted our study in the HEK293 cell line which was shown to express endogeneous Sarm1 (Carlsson, Ding and Byrne, 2016) and compared the results with the neuronal SH-SY5Y cell lines. To further test our hypothesis, we extended out finding in a previously established rotenone model of Drosophila and our results showed reversal of rotenone-induced locomotor deficits in the presence of another PARP inhibitor Olaparib in the flies. Thus, results generated from this study not only provides the first evidence of regulation of endogeneous Sarm1 by fluctuating NAD+ levels but may also open up the exciting opportunity of repurposing PARP inhibitors in the treatment of Sarm1-induced
pathological conditions and mitochondrial complex I deficiency disorders.
Results
Rotenone induced cell death in HEK293, 3T3 cells and SH-SY5Y cells in a dose and time dependent manner that was independent of caspase-3 activation
Mitochondrial complex I is the first point of entry of electrons to the electron transport chain and its inhibition has been implicated in different pathological conditions like PD (Perales-Clemente et al., 2010). Here we attempted to gain a comprehensive mechanistic insight in rotenone-mediated cell death in two routinely used non neuronal cell lines HEK-293 and NIH 3T3 cells and compared the results with the neuronal cell line SH-SY5Y. Our results indicate that rotenone induced cell death in a dose and time-dependent manner in both HEK-293 and 3T3 cells (Fig. 1 A and B). However, a several fold higher dose (50 μM) was required in 3T3 cells compared to HEK-293 cells where almost 40% cell death was achieved at a dose as low as 500 nM in 24 h. In comparison to the HEK293 cells, in the neuronal cell line SH-SY5Y, a dose of 5 μM (10 times higher dose) could induce 30-40% cell death in these cells at 24 h (Fig. 1C) that led to retraction of the cellular processes at 24 h post treatment (Fig. 1D). Due to its greater susceptibility to mitochondrial complex I inhibition, we further evaluated the status of apoptosis in HEK293 cells following rotenone treatment. Rotenone treatment in HEK293 cells resulted in caspase-3 activation as indicated by increased accumulation of active caspase-3 in the cells treated with 500 nM of rotenone (Fig. 1E). However, contrary to our expectation, prior incubation with the PAN caspase inhibitor Z-VAD-FMK followed by rotenone treatment did not reverse rotenone-induced cell death (Fig. 1F) indicating that caspase activation is not the sole factor driving rotenone induced cell death which prompted us to perform an in-depth analysis of the underlying mechanism leading to rotenone induced cell death in HEK293 cells and compared it to the neuronal SH-SY5Y cells.

(A, B, and C) MTT assay of cells treated with indicated doses of rotenone in HEK293 (A), 3T3 (B) and SH-SY5Y (C) cells (D) SH-SY5Y cells treated with 2.5 µM of rotenone for 24 h and stained with anti-tubulin antibody to visualize the neurite processes following rotenone treatment and the results were compared with DMSO control samples. Scale bar represents 10 μm (E) Representative confocal images of HEK293 cells stained with anti-active Caspase 3 antibody (red) and DAPI (blue) in the presence of rotenone or DMSO control. Scale bar represent 25 μm. The right panel represents the percentage of active-caspase positive cells in the presence of DMSO or 500 nM rotenone and results are representative of five individual fields (F) HEK293 cells were pre-incubated with the pan-caspase inhibitor Z-VAD-(OMe)-FMK (20 µM) for 1 h prior to rotenone (500 nM) treatment and cell viability was measured by MTT assay.All results are representative of atleast three independent experiments.
Rotenone induced cell death is accompanied by mitochondrial dysfunction but is independent of ROS production in HEK293 cells
Cytochrome c released from damaged or leaky mitochondria stimulates the cleavage of caspase-3 to its active form (Ott et al., 2002). Since we observed caspase-3 activation we undertook a detailed analysis of mitochondrial status following rotenone treatment. Although apoptosis was induced at a later time point (24 h) in HEK293 cells, we observed mitochondrial membrane depolarization in these cells as early as 4 h post-rotenone treatment as observed by staining with the cell permeant dye, TMRM, that accumulates only in active mitochondria (Fig. 2A). Further, live staining with mitotracker green (that localizes to the mitochondria irrespective of mitochondrial membrane potential) showed loss in mitochondrial puncta structure (as indicated by arrows) in rotenone treated cells but the mitochondria stained brighter (Fig. 2B) compared to untreated controls which could be indicative of accumulation of damaged mitochondria in these cells. It is well established that mitochondrial damage leads to increased ROS production (Zorov, Juhaszova and Sollott, 2014) which causes further mitochondrial damage that perpetuates ROS production in rotenone treated cells. Rotenone has been shown to induce cellular ROS generation but the source of this ROS is not well defined in HEK293 cells. Conforming to previous reports, we observed an increase in total ROS levels in rotenone treated HEK-293 cells in a time-dependent manner (increased accumulation at 24 h) and prior incubation with the anti-oxidant NAC significantly (P<0.001) reduced ROS generation both at 6 and 24 h post treatment (Fig. 2C) in these cells. To understand the source of ROS in these cells, we further analyzed the status of mitochondrial ROS and observed an increase in mitochondrial ROS levels as indicated by increased Mitosox staining following rotenone treatment (Fig. 2D) as early as 4 h post-treatment. Interestingly, although there was heightened ROS production following rotenone treatment, rotenone mediated cell death was independent of ROS production as prior incubation with NAC did not significantly (P value 0.1) reversed the ongoing cell death process in HEK293 cells (Fig. 2E). This strongly indicates that heightened ROS production may be the effect of accumulation of damaged mitochondria and may not be the sole driver of rotenone induced cell death.

(A) (Left panel) Immunofluorescence analysis of HEK293 cells incubated with 100 nM TMRM to assess the mitochondrial membrane depolarization in DMSO control and rotenone treated cells at 4 h post rotenone treatment. Scale bar represents 10 μm (Right panel) Corrected total cell fluorescence (CTCF) values of TMRM intensity of control vs rotenone treated cells (B) (Left panel) Immunofluorescence analysis of HEK293 cells stained with 100 nM of Mitotracker Green at 4 h post rotenone treatment and compared with control cells. Arrows indicated intact or disrupted mitochondrial punctas (Right panel) Corrected total cell fluorescence (CTCF) values of TMRM intensity of control vs rotenone treated cells (C) Relative fluorescence intensity (RFI) as a measure of ROS production in HEK293 cells with and without pre-incubation with 1mM NAC followed by rotenone treatment. Total ROS level was measured by H2DCF-DA assay and fluorescence intensities were measured at Ex/Em: 492/527 nm (D) Visualization of mitochondrial ROS production in HEK293 cells by staining with the mitochondria specific ROS indicator Mitosox red at 4 h post rotenone treatment. Images are representative of cells in culture (E) MTT assay of HEK293 cells in the presence or absence of NAC pre-treatment followed by rotenone treatment for 24 h.
Autophagy precedes apoptosis in rotenone treated cells but not completed due to reduced autophagic flux
Loss of mitochondrial membrane potential and accumulation of damaged mitochondria that resulted in increased ROS production could be due to a defective mitochondrial turnover via autophagy. To correlate mitochondrial dysfunction and increased ROS production in HEK293 cells, we were inclined to check the status of autophagy in these cells. Microtubule-associated protein 1 light chain 3 B (LC3B) and p62/sequestosome 1 are two widely used autophagy markers. Upon autophagic induction LC3B-I is converted into its lipidated LCB-II form and p62 via its interaction with LC3B-II targets ubiquitinated substrates to the autophagosome (Pankiv et al., 2007). Our results showed an increase in p62 accumulation (an indicator of defective autophagic flux) in rotenone treated HEK293 cells as early as 4 h post-treatment (Fig. 3A) that preceded induction of cell death via apoptosis (Fig. 3G). Co-staining with endogenous LC3B showed higher nuclear LC3B staining in rotenone treated cells as compared to the control cells and co-localization with p62 as indicated by arrows (Fig. 3A right panel). Rotenone treatment of SH-SY5Y cells also indicated a defect in the autophagy machinery following rotenone treatment as there was increased accumulation of p62 (red staining) in these cells (Fig. 3B). Western blot analysis in these cells also confirmed increased LC3B degradation and accumulation of p62 alongwith increased levels of ATG7, a mediator of autophagosomal biogenesis which remained high even at 24 h post treatment further indicating defect in the completion of the autophagic process (Fig. 3C). We next sought to understand whether p62 accumulation following rotenone treatment was due to decreased autophagosome-lysosome fusion or defect in autophagic flux. For this, cells were transfected with the mCherry-GFP-LC3 plasmid and since GFP signal is lost under the acidic environment of the lysosome, the mCherry positive cells confirms a functional autophagic flux within the cells. Transfection with mCherry-GFP-LC3 showed increased accumulation of yellow puncta in rotenone treated cells as opposed to the red puncta (Fig. 3D) indicating it is not autophagosome formation but rotenone induced a defect in autophagic flux. Real time analysis of key autophagy genes revealed several fold higher induction of the early autophagy genes (Atg) (Fig. 3E) as compared to the DMSO treated control cells but reduced expression of the late autophagy genes like Ulk1 (unc-51-like kinase 1) that plays an important role in the formation of autophagosome. To detect whether there was mitochondrial turnover within the lysosome, co-immunostaining was performed with mitotracker green and lysotracker red. Very little co-localization was evident between mitotracker and lysotracker staining in rotenone treated cells at 4 h post treatment (Fig. 3F) that may point towards a defective mitochondrial turnover and no significant change in the co-localization pattern between DMSO control and rotenone treated cells were observed (Fig. 3F; Fig. S1A). To confirm that induction of the initial autophagy event following rotenone treatment preceded apoptosis, we stained the cells with the apoptosis inducing factor-1 (AIF-1) which translocated from the mitochondria to the nucleus and induced apoptotic cell death (Bano and Prehn, 2018). As indicated in Fig. 3G, no AIF-1 translocation to the nucleus was observed in the rotenone treated cells even at 6 h post-treatment indicating that loss of mitochondrial homeostasis and autophagic defect is triggered prior to apoptosis induction.

(A) Immunofluorescence assay of HEK293 cells stained with anti-LC3B (red), anti-p62 (green) antibodies and DAPI (blue) to compare the expression and localization of the autophagy marker proteins followed by rotenone treatment. Scale bar represents 25 μm in the left panel. The indicated cells in the left hand panel are cropped to show the single cell localization of these proteins (left hand panel) (B) Immunofluorescence assay of SH-SY5Y cells with anti-p62 (red), anti-Tubulin (green) antibodies and DAPI (blue) to assess p62 accumulation following rotenone treatment (5 μM) for 24 h (C) Immunoblot analysis of whole cell lysates of DMSO control and rotenone treated (24 h) SH-SY5Y cells probed with the autophagy marker proteins LC3B, p62, ATG7. β-actin was used as loading control and the densitometric analysis to determine the relative expression of the protein with respect to the loading control was performed in Image J software (lower panel) (D) Autophagic flux determination in HEK293 cells with transient transfection with mCherry-EGFP-LC3B plasmid for 24 h followed by rotenone treatment for 4 h. GFP loses the green signal in the acidic environment of the lysosome leading to predominant red signal of the mCherry protein. Strong co-localization of mcherry with GFP is indicative of defective fusion of autophagosome with the lysosome (E) Relative fold change of mRNA expression of autophagy gene in rotenone treated (24 h) HEK293 cells by qRT-PCR with respect to DMSO treated control samples. Gapdh was used as an internal control (F) Representative confocal images of Mitotracker (green) and Lysotracker (red) localization 4 h post rotenone treatment in HEK293 cells. Scale bar represents 50 μm (G) Immunofluorescence assay of HEK293 cells with anti-AIF antibody (red), Mitotracker green and DAPI (blue) to assess the translocation of AIF from the mitochondria to the nucleus following rotenone treatment for 6 h. Data are representative of at least two or three independent experiments per panel.
Rotenone treatment results in depletion of cellular NAD+ levels and downstream induction of the NADase Sarm1
Since rotenone-induced autophagy did not go to completion, we asked whether energy deficits within the cells played a role in the process by preventing autophagic degradation of damaged mitochondria via the lysosomal pathway. Accumulating recent evidence indicates that cellular NAD+ homeostasis is intricately associated with functional autophagy (Understanding et al., 1999) which further helps the cells to adapt to energy deprivation by obtaining energy from autophagic degradation products. Our results suggested that rotenone treatment reduces NAD+/NADH ratio thus decreasing total cellular NAD+ levels in HEK293 cells at 24 h post rotenone treatment (Fig. 4A). Our previous report has suggested that the NADase Sarm1 is required for rotenone induced cell death in SH-SY5Y cells (Sur et al., 2018) but the mechanism behind this induction remains poorly understood. In agreement with our previous results in SH-SY5Y cells, we observed increased Sarm1 expression at 24 h post-rotenone treatment in the HEK293 cells (Fig. 4B) but there was no induction of Sarm1 levels at an earlier time point (4 h) (Fig. 4B) indicating that mitochondrial dysfunction and deregulation of autophagy machinery occurred prior to Sarm1 induction in these cells. We also observed increased Sarm1 expression in 3T3 cells (Fig. 4C) but the levels were several folds lower than HEK293 cells which may account for greater resistance of these cells to rotenone induced cell death. Since Sarm1 has been shown to stabilize on depolarized mitochondria (Murata et al., 2013), we proceeded to check its localization at the various subcellular fractions. We show here for the first time that rotenone treatment induced translocation of Sarm1 to the mitochondrial fraction (Fig. 4D) at 24 h post treatment and staining with anti-Sarm1 antibody showed punctas similar to mitochondria (indicated by yellow arrow) as compared to a predominantly diffused staining in the DMSO treated controls (Fig. 4E). Further, the Sarm1 staining appeared brighter in rotenone treated cells which could either be indicative of its increased accumulation at the damaged mitochondria as previously indicated with mitotracker green staining. Interestingly, we also observed a previously unreported nuclear localization of endogenous Sarm1 (Fig. 4D, right hand panel and Fig. 4E, white arrows) following rotenone treatment at 24 h post treatment and the implication of this enhanced subcellular localization needs to be explored further. It is to be noted that immunostaining with Sarm1 antibody indicated increased levels of the Sarm1 protein in HEK293 cells following rotenone treatment (Fig. 4E) in addition to the mRNA induction. Interestingly, the staining pattern of overexpressed full-length Sarm1 (FLAG-Sarm1) had a pattern distinct from the endogenous protein following rotenone treatment where majority of the protein could be seen to be concentrated at the nuclear periphery Fig. S2; lower panel). This is in agreement with a previous report where overexpressed eGFP-tagged Sarm1 in HEK293 cells localizes to the nucleus and stabilizes the nuclear lamin scaffold in response to pro-inflammatory stimuli (Sethman and Hawiger, 2013).

(A) Determination of NAD+/NADH ratios by fluorimetric assay in HEK293 cells 24 h post rotenone treatment. Data sets were compared with DMSO treated controls. (B and C) qRT-PCR analysis of Sarm1 gene expression at 6 h and 24 h post rotenone treatment in HEK293 (B) and 6 h in 3T3 cells (C). Gapdh was used as an internal control (D) Immunoblot analysis of translocation of Sarm1 in the mitochondrial and nuclear fractions in control and rotenone treated cells 24 h post treatment. The purity level of the isolated fractions were confirmed by probing with anti-COX IVB for mitochondria and anti-Lamin A/C for the nuclear fraction (E) Immunofluorescence analysis of endogenous Sarm1 (red) in the presence or absence of rotenone. The nuclear localization (DAPI staining) of the protein is shown in white arrows in both the DMSO control and rotenone treated cells. (F) Immunoblot analysis of the autophagy marker LC3B in HEK293 cells transiently transfected with FL-SARM and N-TIR-Sarm1 for 48 h and β-actin as a loading control. Transfection was confirmed by immunostaining with anti-FLAG antibody (red) and the results were compared with the untransfected controls. (G) HEK293 cells were pre-incubated with 1mM NR followed by rotenone treatment for 24 h or intermittent replenishment with NR at the times indicated and MTT assay was conducted to analyze percent cell death. Data are representative of at least two or three independent experiments per panel.
Since we observed autophagy preceding apoptosis in rotenone treated cells and Sarm1 was a key mediator of the cell death process, we evaluated the role of Sarm1 in autophagy induction. Overexpression of FLAG-tagged Sarm1 and its TIR domain (that mediates the NADase activity of Sarm1) in HEK293 cells did not result in degradation of LC3B as indicated by the absence of LC3B-II bands (Fig. 4F Upper panel) in Sarm1 overexpressed cells. Transfection of Sarm1 in these cells was confirmed by staining of cells with the anti-FLAG antibody (Fig. 4F Lower panel).
It has been previously shown that exogeneous addition of the NAD+ precursor nicotinamide riboside (NR) reverses axonal degeneration induced by overexpressed Sarm1 (Sasaki et al., 2016). To understand whether NR had a similar effect on rotenone induced cell death in HEK293 cells, we pre-incubated the cells with 1 mM NR for 1 h followed by addition of rotenone for 24 h. Our results indicate that pre-incubation with NR had little or no effect on rotenone induced cell death (Fig. 4G). We hypothesized that NR is probably being rapidly used up and hence cannot combat the early NAD+ loss that is further exacerbated following Sarm1 activation. Hence, we exogenously added NR at 6 h (around the time of Sarm1 induction) to the cells that were previously pre-incubated with NR followed by rotenone treatment. We also supplemented NR at low doses (0.5 mM) at 3 h and 6 h to avoid the accumulation of NMN (nicotinamide mononucleotide) due to excess NR supplementation. However, supplementing NR at different time points and with different doses had no significant effect on rotenone induced cell death in the HEK293 cells (Fig. 4G). This result shows that there is a differential regulation of the endogeneous versus overexpressed Sarm1 in HEK293 cells and point towards a previously unknown mechanism of enodogeneous Sarm1 regulation.
PARP inhibition by PJ34 replenishes cellular NAD+ levels and prevents rotenone induced cell death and Sarm1 induction in both HEK293 and SH-SY5Y cells
It is becoming increasingly evident that NADH levels and the OXPHOS system are intricately linked to each other (Bose et al., 2003). Since no significant reversal of cell death was observed following NR replenishment in these cells, we hypothesized that there could exist a previously unidentified mode of modulation of NAD+ level following rotenone treatment. To understand this further, we speculated whether the NAD+-consuming enzymes of the cells like PARP1 and Sirt1 have any role in rotenone mediated cell death. Interestingly, prior incubation of cells with the PARP1 inhibitor PJ34 significantly (P<0.001) reversed rotenone induced cell death (Fig. 5A). There was a differential expression pattern of the genes involved in NAD+ metabolism pathway especially that of Nmnat1 and Nmnat2 (key enzymes implicated in the regulation of Sarm1 mediated axonal degeneration) (Fig. S3 A-E). On the other hand, the Sirtuin1 inhibitor EX527 had no such effect on rotenone mediated cell death (Fig. S4A). To understand whether PJ34 had a similar effect on other inhibitors of the mitochondrial OXPHOS system, HEK-293 cells were treated with the mitochondrial complex III and V inhibitor Antimycin and Oligomycin respectively which revealed that PJ34 had no effect in the reversal of cell death induced by these inhibitors (Fig. S4 B-C).

(A) Cell viability was measured using MTT assay in HEK293 cells pre-incubated for 1 h with 25 µM of the PARP inhibitor PJ-34 followed by 500 nM of rotenone treatment for 24 h and the results were compared with untreated control cells (B) Determination of NAD+/NADH ratios by fluorimetric assay in HEK293 cells 2 and 4 h post rotenone treatment in the presence or absence of PJ34 (C) qRT-PCR analysis of Sarm1 mRNA expression with or without prior treatment with 25 µM PJ-34 followed by 24 h of rotenone treatment. (D) Cell viability was measured using MTT assay in SH-SY5Y cells pre-incubated for 1 h with 50 or 100 µM of the PARP inhibitor PJ-34 followed by 5 µM of rotenone treatment for 24 h and the results were compared with untreated control cells (E) Immunofluorescence analysis of endogenous Sarm1 (red) in rotenone treated SH-SY5Y cells the presence or absence of PJ-34. The nucleus was stained with DAPI (blue). Scale bar represents 25 μm (F) (Left panel) Immunoblot analysis of DNA damage and apoptosis marker proteins H2AX and cleaved Parp1 respectively in rotenone treated cells with or without prior treatment with PJ-34. GAPDH served as loading control. (Right panel) Densitometric analysis to determine the relative expression of the proteins with respect to the loading control was performed in Image J software. Data are representative of at least two or three independent experiments per panel.
The reversal of rotenone-induced cell death by PJ34 was consistent with the fact that pre-incubation of cells with PJ34 followed by rotenone treatment restored cellular NAD+ levels at 4 h post treatment (Fig. 5B) indicating that reduction in NAD+ levels was a key player in rotenone induced cell death. It should be noted here that loss of NAD+ was observed as early as 2 h in rotenone treated cells and at a time when Sarm1 was not induced in these cells. In line with this observation, we next sought to analyze whether reversal of cell death and restoration of cellular NAD+ levels by PJ34 correlated with Sarm1 induction. Interestingly, real-time analysis of PJ34 treated cells followed by rotenone treatment resulted in a prominent decrease in expression of Sarm1 even at 24 h post treatment (Fig. 5C). These results are exciting and point towards a novel regulation of endogenous Sarm1 by fluctuating NAD+ levels. To further confirm the importance of NAD+ replenishment in the reversal of rotenone induced cell death, we analyzed the role of PJ34 in the neuronal cell line SH-SY5Y and a significant (P<0.001) restoration of cell death following prior incubation with PJ34 was also observed in these cells. However, a dose dependent analysis revealed that a higher does (50–100 μM) of PJ34 was required to achieve this reversal as compared to 25 μM in HEK293 cells. We further observed a reduction in the Sarm1 protein levels alongwith reduced nuclear localization in these cells in the presence of PJ34 (Fig. 5E). These observations strongly indicate that these distinct nuclear localization patterns is linked to Sarm1 induced cell death regulation following rotenone treatment and id dependent on NAD+ levels the mechanism of which needs to be evaluated further.
PARP is a DNA damage sensor and it has recently been shown that there is increased localization of PARP1 to H2AX.2 enriched chromatin damage sites (Sharma et al., 2019). Since phosphorylated H2AX.2 is a histone marker of DNA double strand breaks (Kuo and Yang, 2008) we hypothesized that its status might be an indirect indicator of PARP hyperactivation following rotenone induced DNA damage. Our results show that there is increased level of phosphorylated H2AX (p-Ser 139) in the presence of rotenone, the level of which is significantly decreased following pre-incubation with PJ34 and subsequent rotenone treatment (Fig. 5F). This reduction in DNA damage alongwith the reversal mediated by PJ34 suggests that normalization of PARP activity in the presence of rotenone may prevent early NAD+ loss and subsequent Sarm1 activation, a fact that is strengthened by the recent structural insights indicating that NAD+ bound at the ARM domain of purified Sarm1 protein is an allosteric inhibitor of Sarm1 activity.
PJ34 restores mitochondrial homeostasis and prevents accumulation of damaged mitochondria in rotenone treated HEK293 cells
Since we hypothesized that accumulation of damaged mitochondria could be one of the key features of early accumulating stress that leads to Sarm1 induction, we checked the status of mitochondria in rotenone treated cells exposed to PJ34. Pre-incubation with PJ34 prevented early loss of mitochondrial membrane potential (Fig. 6A) and reduced mitochondrial ROS (Fig. 6B) as early as 4 h post rotenone treatment. We also observed a significant decrease in the total cellular ROS levels induced by rotenone in the presence of PJ34 (Fig. 6C) that strengthened our hypothesis of damaged mitochondrial accumulation induced by rotenone that stimulated ROS production in these cells. To confirm this further, we co-stained rotenone treated cells pre-incubated with PJ34 with Mitotracker red and Lysotracker green. Two populations of cells were observed at 6 h as indicated in Fig. 6D. Cells showed intact mitochondrial staining as indicated by mitotracker green staining in rotenone treated cells in the presence of PJ34 (Fig. 6D upper panel). However, it was interesting to note increased co-localization of mitotracker green and lysotracker red in these cells (Fig. 6D lower panel) indicating improved lysosomal turnover of damaged mitochondria as indicated by arrows. This was also confirmed by the Pearson’s correlation coefficient (PCC) where there was a significant increase in the mitochondrial co-localization with the lysosomes (Fig. 6D, right panel) following PJ34 treatment in the presence of rotenone.

(A) Immunofluorescence analysis of HEK293 cells incubated with TMRM to assess the mitochondrial membrane depolarization in control and rotenone treated cells in the presence or absence of PJ34 at 4 h post rotenone treatment. Scale bar represents 25 μm (B) Visualization of mitochondrial ROS production in HEK293 cells by staining with the mitochondria specific ROS indicator Mitosox red at 4 h post rotenone treatment in the presence or absence of PJ34. (C) Measurement of total ROS level byH2 DCF-DA assay and at Ex/Em: 492/527 nm to compare the overall ROS production in rotenone treated cells in the presence of absence of PJ34 (D) Immunofluorescence analysis of HEK293 cells co-stained with mitotracker green and lysotracker red at 24 h post rotenone treatment to compare the co-localization of the mitochondria with the lysosome in the presence or absence of PJ-34. Scale bar represents 25 μm (upper panel) and 6 μm (lower panel). The arrow represents the co-localization in rotenone + PJ34 treated cells and the degree of co-localization was quantified using Pearson’s correlation coefficient (PCC) analysis (right panel).
Since PARP1 inhibition by PJ34 improved mitochondrial turnover within the lysosomes which may subsequently lead to restoration of mitochondrial homeostasis, we sought to analyze the status of autophagy following PARP1 inhibition. Both Western blot and confocal microscopy analysis revealed a decrease in the levels of LC3B (Fig. S5A) and reduced signal strength of LC3B (indicated by white arrows) in the nucleus (Fig. S5B) 4 h following rotenone treatment in the presence of PJ34. This was also accompanied by reduction in p62 accumulation (green signal; Fig. S5B) in HEK293 cells treated with rotenone in the presence of PJ34. To understand whether functional autophagic machinery is required for PJ34 mediated protection from rotenone induced cell death, cells were treated with chloroquine (an inhibitor of lysosomal acidification) and no reversal of cell death by PJ34 was observed in the presence of these inhibitors (Fig. S5C). Interestingly, stimulation of autophagy by rapamycin also could not overcome rotenone induced cell death (Fig. S5D). Collectively, these results suggest that functional autophagy is intricately linked with Sarm1-mediated cell death in rotenone treated cells that can be alleviated by PJ34 by restoring cellular NAD+ levels and cannot be achieved by stimulating autophagy alone.
PARP inhibition by Olaparib restores rotenone induced locomotor deficits in Drosophila melanogaster
To understand the physiological relevance of PARP inhibition in rotenone induced pathological conditions, we extended our data in the fruitfly Drosophila melanogaster. Our previous study has shown progressive locomotor deficits accompanied by dSarm induction in w1118 flies exposed to rotenone (Sur et al., 2018). Since rotenone treatment in cells showed an early decrease in NAD+ levels, we undertook to analyze the levels of NAD+ in 1-day old flies exposed to 200 μM of rotenone. We observed a moderate decrease in the NAD+ levels in the brain of flies at 20-days post exposure (Fig. 7B). We further asked whether replenishing NAD+ levels via PARP inhibition could alter the rotenone-induced locomotor deficits as observed in these flies. The PARP inhibitor Olaparib has shown promise as an anti-cancer chemotherapeutic drug and is sold under the trade name Lynparza to treat ovarian cancer. Due to its known prospect in drug repurposing, we selected Olaparib for PARP inhibition in our fly studies. We first conducted a dose dependent analysis of Olaparib due to the unavailability of such data in flies and measured its effect on fly survival and selected the doses 50 and 100 μM for further analysis with rotenone. Our results indicated that 1-day old flies exposed to 100 μM olaparib in the presence of 200 μM of rotenone (Fig. 7A) exhibited significant reversal in their climbing ability at 5, 10 and 20-days post exposure (Fig. 7 C-D). We further observed heightened survival of flies in the presence of 100 μM Olaparib in the presence of rotenone at 5, 10 and 20-days post exposure (Fig. E-G). This is the first observation of the effect of PARP inhibition by Olaparib in the reversal of rotenone induced locomotor deficits especially in the more susceptible aged flies (20-day old) and further highlights the importance of PARP inhibitors in modulating rotenone induced pathology.
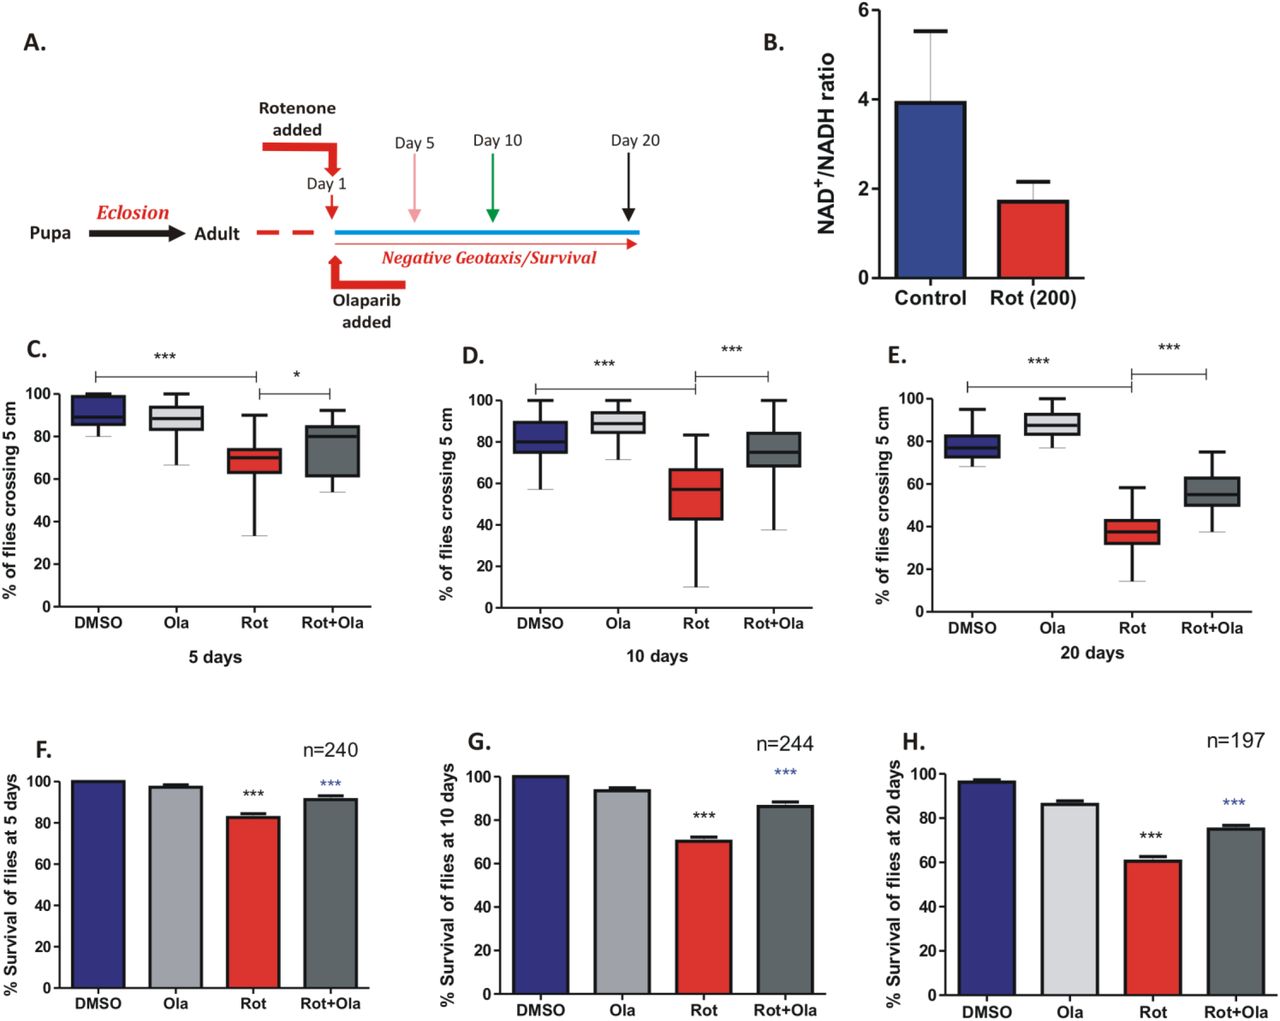
(A) Schematic representation of the experimental setup in Drosophila (B) Measurement of NAD+/NADH ratio in the 1-day old fly brains at 20-days post exposure (C-E) Negative geotaxis assay of 1-day old flies at 5 (C), 10 (D) and 20 (E) days post exposure with DMSO, olaparib (100 μM), rotenone (200 μM) and rotenone + olaparib (F-H) Survival assay of flies exposed as described in C-E. *** denotes significance between DMSO control and rotenone exposed flies and *** denotes significance between rotenone and rotenone + olaparib exposed flies. Results are representative of three independent set of experiments.
Discussion
Mitochondrial health and homeostasis is vital towards cell survival and dysregulation of mitochondrial function has been linked to several diseases ranging from neurodegenerative disease to cancer. The pesticide rotenone inhibits mitochondrial complex I activity and in our previous report we have shown that Sarm1 is an important mediator of rotenone-induced cell death (Sur et al., 2018). So, is there a point of convergence between mitochondrial dysfunction and Sarm1 activation in the rotenone-induced cell death process? Apart from inducing dopaminergic neuronal loss, rotenone has been shown to induce cell death in a variety of non neuronal cell population. However, the non neuronal function of Sarm1 as well as its mode of activation following rotenone treatment is not well explored. Since there is a time lag between rotenone treatment and Sarm1 induction, here we attempted to gain a comprehensive insight into how Sarm1 is activated within the cells using both non-neuronal HEK293 cells and the neuronal SH-SY5Y cells. HEK293 cell is a routinely used human embryonic kidney cell line that has been shown to express endogenous Sarm1 (Carty et al., 2006) and has been extensively used for studies involving the overexpressed protein. Since we observed a higher susceptibility of HEK293 to rotenone induced cell death, we exploited this cellular model further to understand the temporal link between mitochondrial dysfunction induced by rotenone, mechanism of Sarm1 activation and subsequent cell death.
Rotenone induces loss of mitochondrial membrane potential and stimulates the production of mitochondrial ROS. Generation of ROS in damaged mitochondria maybe perpetuated in these cells if these damaged organelles are not effectively cleared primarily via autophagy (often termed as “mitophagy”). One important gap in knowledge that exists is how this autophagy induction correlates with mitochondrial homeostasis and whether there exists a temporal regulation of these events before apoptosis sets in. Studies in rotenone model have overlooked this time-dependent regulation and autophagic induction was solely restricted to LC3B degradation assay. However, whether this LC3B was cleared via the stimulation of the autophagic flux has not been clearly indicated. To delineate this temporal regulation, we conducted a time-dependent analysis in HEK293 cells and observed an early defect in mitochondrial homeostasis that led to heightened ROS production that could not be ameliorated by the ROS scavenger NAC. This clearly implied that accumulating mitochondrial damage overrode the scavenging capacity of NAC in these cells and the disintegrated but the intense puncta staining pattern of the mitochondria further strengthened this observation. A further analysis of the autophagy machinery clearly indicated that there exists a defect in autophagy flux following rotenone treatment that may lead to an ineffective clearance of damaged mitochondria leading to the buildup of stress within the cells within 4 h of rotenone treatment. Apart from the early defect in autophagic flux, we observed an increased accumulation of endogenous LC3B within the nucleus of rotenone treated cells. Such localization was not observed in the overexpressed LC3 (mCherry-GFP-LC3) which formed puncta typical of autophagic vacuoles within the cytoplasm following rotenone treatment. Such enhanced nuclear localization of endogenous LC3 is previously unreported and is an interesting outcome of rotenone induced autophagic defect that needs to be explored further.
Apart from the clearance of damaged organelles like mitochondria within the cells, the role of autophagy in cellular energy homeostasis is emerging. The catabolism of autophagosome has been linked to the rescuing of cells from energy deprivation by supplying energetic substrate and ATP (Loos et al., 2013). Hence the question automatically arises whether accumulation of damaged mitochondrial and defective autophagic flux contribute to an early energy deprived state following rotenone treatment or vice versa? It has been recently highlighted that the oxidation state of the important cellular co-factor nicotinamide dinucleotide (NAD) undergoes alteration following metabolic stress (Verdin, 2015) but how NAD+ levels may directly contribute to the driving of the autophagic flux is not clearly defined. The only direct evidence linking NAD+ levels to mitochondrial homeostasis has been studied in the context of Werner’s syndrome where the authors demonstrate that augmentation of NAD+ leads to improved lifespan via the restoration of mitophagy (Fang et al., 2019). Although we hypothesized that the NAD+ levels could drop following the activation of Sarm1 NADase activity, the timing of Sarm1 expression and these early defects could be not explained. Hence we undertook a time dependent analysis of NAD+ levels following rotenone treatment. Contrary to our expectation, we observed an early loss of NAD+ levels prior to Sarm1 induction in these cells following rotenone treatment. This early loss of NAD+ could not be reversed by replenishing the NAD+ pool with prior incubation with nicotinamide riboside (NR), a precursor of NAD. NR has a short half-life and it could be rapidly used up in the cells thus becoming unavailable at the later time points when the NADase activity of Sarm1 is activated. However, intermittent replenishment with NR only slightly reversed rotenone induced cell death strongly indicating that other factors contributed to the rapid NAD+ loss within these cells.
Besides the NADase Sarm1 and CD38, the protein deacylase family of Sirtuins and PARPs are known NAD+ consuming enzymes within the cells. Hyperactivation of PARP1 has been shown to impede autophagy due to consumption of NAD+ and blocking Sirt1 function, a key regulator of autophagy (Jang, Hwang and Kim, 2020). Here we hypothesized whether blocking PARP1 activity could restore NAD+ levels and provide sufficient energy to drive autophagic clearance of damaged mitochondria. We observed that prior incubation with the PARP1 inhibitor PJ34 but not the Sirt1 inhibitor EX527 significantly reversed rotenone induced cell death. PJ34 not only prevented depletion of cellular NAD+ levels following rotenone treatment but also stimulated the autophagic flux and restored mitochondrial homeostasis. Further, in line with our hypothesis, abrogating this early accumulating energy depleted state prevented Sarm1 mRNA induction and reduction in Sarm1 protein levels in the presence of PJ34 that could explain the reversal of Sarm1 mediated cell death. Sarm1 possess an N-terminal mitochondrial localization signal and rotenone induced the translocation of Sarm1 to the mitochondria. What was unexpected was the distinct nuclear localization pattern of Sarm1 in the presence of rotenone that was completely abrogated in the presence of PJ34. Quite interestingly, the recent Cryo EM studies on Sarm1 structure and function has shown the presence of an autoinhibitory ARM domain that remains bound to NAD+ and prevents the activation of the NADase containing TIR domain of SARM1 (Jiang et al., 2020; Sporny et al., 2020). Hence, in line with this observation, it is possible that early loss of NAD+ in the presence of rotenone could overcome this autoinhibition leading to activation of the Sarm1 NADase activity and ultimately leading to apoptosis.
Taken together, this is the first major finding that correlates in vivo loss of cellular NAD+ levels with the regulation of endogenous Sarm1 in both neuronal and non-neuronal cell lines. This is strengthened by the fact that inhibiting PARP reverses rotenone induced locomotor deficits in flies as well. Thus, this study also provides a very important lead in the understanding the role of PARP1 inhibitors in modulating cellular energy homeostasis via regulation of autophagy and mitochondrial function as described in the proposed model (Fig. 8). No study has previously analyzed the temporal regulation of Sarm1 activation and this could be an important step towards our understanding of the metabolic regulation of mitochondrial function, the autophagy-apoptosis network and Sarm1 activation mediated by the mitochondrial complex I inhibitor, rotenone.

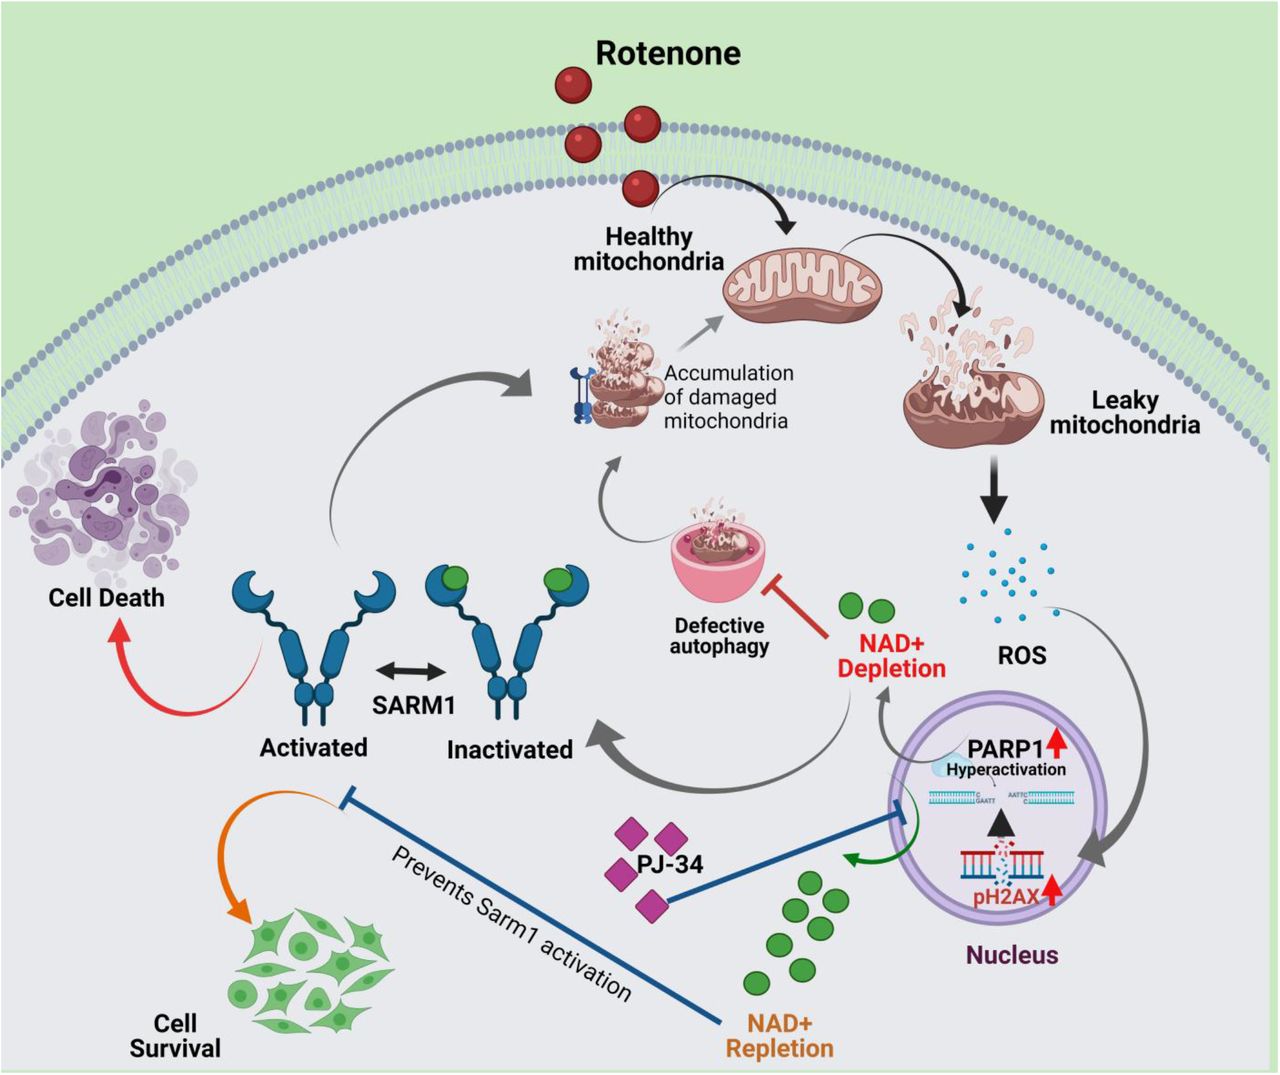
Addition of rotenone to the cells results in mitochondrial depolarization and generation of reactive oxidative species (ROS). Excess ROS production leads to nuclear DNA damage and PARP1 activation that leads to depletion of NAD+. This early loss of NAD+ blocks autophagic flux resulting in accumulation of damaged mitochondria, thus perpetuating further ROS production. In a vicious cycle this causes further DNA damage, PARP1 hyperactivation and subsequent NAD+ loss. This loss of NAD+ is predicted to remove the allosteric inhibition on the pro-apoptotic protein Sarm1 thus activating it. Sarm1 localizes to the depolarized mitochondria and induces subsequent cell death. Prior incubation with the PARP inhibitor, PJ-34 replenishes cellular NAD+ levels, restores mitochondrial homeostasis and prevents Sarm1 upregulation in the cells thus preventing rotenone induced cell death. (Created with BioRender.com)
Materials and Methods
Cell lines, antibodies and chemicals
HEK293 cells were obtained from the laboratory of Abhik Saha (Presidency University Kolkata, India), SH-SY5Y cells were obtained from Oishee Chakrabarti (Saha Institute of Nuclear Physics, Kolkata) and 3T3 cells obtained from Shubhra Majumder (Presidency University, Kolkata). The cells were maintained in Dulbecco’s modified Eagle’s medium (DMEM) (Gibco, Life Technologies) supplemented with 10% fetal bovine serum (FBS) (Invitrogen) and 1% Penicillin-Streptomycin Solution (Sigma).
Mouse monoclonal antibodies against β-actin (ab8224), p62 (ab56416) and LC3 A/B (ab128025), CoX IV (ab16056), Apoptosis and DNA Damage [H2A.X (S139) + cleaved PARP1 + Anti-GAPDH] (ab131385) western blot cocktail and rabbit polyclonal antibody against anti-cleaved caspase-3 (ab2302) were obtained from Abcam. Rabbit polyclonal antibody for AIF (4642) was obtained from Cell Signaling Technology Inc. and rabbit polyclonal antibodies against Sarm1 was obtained from GeneTex for western blot analysis and Sarm1 (D2M5I) for staining was obtained from Cell Signaling Technology Inc. Rabbit polyclonal antibodies against FLAG (F1804) was purchased from Sigma. The antibody for the protein MANLAC2 (Lamin A/C) was developed by Morris, G.E. [DHSB Hybridoma product MANLAC2 (10F8)] and obtained from the Developmental Studies Hybridoma Bank.
Mitochondrial complex I inhibitor rotenone (Sigma), pan caspase inhibitor Z-VAD (OMe)-FMK (Abcam), PARP-1 inhibitor, PJ-34 hydrochloride (Abcam), SIRT1 inhibitor EX-527 (Abcam), autophagy inhibitor Chloroquine diphosphate salt (Sigma), the autophagy stimulator Rapamycin (Abcam) were used in this study at the indicated doses. Nicotinamide riboside (NR) was procured from ChromaDex, USA.
Cell viability Assay
Cells were cultured in 24-well plates and after 24 h were treated with rotenone at the indicated doses. In some experiments, cells were pre-incubated for 1 h with either PJ-34, EX-527, Chloroquine, Rapamycin, Z-VAD-FMK or NR prior to the addition of rotenone. Wells in triplicate were incubated with the MTT reagent (Sigma) at the specific time points at a concentration of 0.5 mg/ml. Following 3 h of incubation, the MTT solution was aspirated and the cells were lysed in DMSO and the formation of formazan in each well was determined in a plate reader (BioTek-Synergy) at an absorbance of 540 nm. All results were compared to DMSO treated controls or the solvent used for the assay.
Plasmid and siRNA transfection
Cells were seeded at a density of 0.4 x 10⁵ cells/well, 24 h prior to transfection. Cells were transfected with pCMV6-Sarm1 with C-terminal Myc-DDK tag (a kind gift from Dr. Karin Peterson, Rocky Mountain Laboratories, NIAID, NIH, USA) or Flag-NTIR-Sarm1 with Lipofectamine 2000 (Invitrogen), for 48 h using the manufacturer’s protocol. To measure the status of autophagy, HEK-293 cells were transfected with mCherry-GFP-LC3 (a kind gift from Rupak Datta, IISER Kolkata) for 24 hours followed by treatment with rotenone for 24 h.
siRNAs for PARP1 (#6304, Thermo Fisher Scientific) was purchased from Cell Signaling. HEK293 cells were transfected with siRNA (100 nM) for 24 h followed by treatment with rotenone for 24 h. Cell viability was assessed in this cells as described previously and results compared with control siRNA (#6568, Thermo Fisher Scientific) treated cells.
Isolation of Nuclear fraction
SH-SY5Y cells were grown in 100 mm plates and following treatment, cells were collected at the specific time points and centrifuged at 850 x g for 2 minutes. To the pellet, 300 μl of Buffer A (10mM HEPES pH 7.9, KCl, MgCl2, Sucrose, Glycerol) with Triton X-100 was added and allowed to incubate for 5 minutes on ice and centrifuged at 2,000 x g for 5 minutes at 4°C. The supernatant containing cytosol was kept aside and 300 μl of Buffer A without Triton X-100 was added to the pellet and centrifuged at 2,000 x g for 5 min at 4°C. To the pellet 300 μl of Buffer B (0.5 M EDTA pH 8, 0.5 M EGTA pH 8) was added and allowed to incubate for 30 minutes on ice and centrifuged at 2,000 x g for 5 minutes at 4°C. The pellet containing the isolated nucleus was lysed in 300 μl of Buffer A without Triton X-100 was to extract the nuclear proteins. The lysate was boiled in 4 X Laemmli buffer and subjected to immunoblot analysis.
Isolation of Mitochondrial fraction
Mitochondrial fraction was isolated using mitochondria isolation kit (Thermo Scientific) by following manufacturer’s protocol. Briefly, cells were seeded at a density of 1.5 x 10⁶ in 100 mm plates 24 h prior to treatment. After treatment, cells were harvested at 850 x g for 2 minutes. 200 µl of reagent was added to the pellet followed by 5 sec vortexing and 2 mins incubation in ice. 10 µl reagent B was added followed by 5 sec vortexing and 5 minutes incubation in ice. Finally, reagent C was added to it and centrifuged at 700 x g, for 10 minutes at 4°C. The supernatant was collected to a fresh tube and centrifuged at 12000 x g for 15 minutes at 4°C. Mitochondrial protein was extracted from the pellet using M-PER protein extraction reagent (Pierce, Thermo Fisher Scientific).
Whole cell extracts and Immunoblot Analysis
Cells were cultured in 6-well plates at a cell density of 0.8 x 10⁶ per well 24 h prior to treatment as indicated. Following treatment, cells were lysed in lysis buffer (150mM NaCl, 1% NP-40, 50mM Tris pH 8.0) containing a protease inhibitor cocktail (Pierce, Thermo Fisher Scientific) for the preparation of whole cell extracts. Protein concentration was estimated using the Bradford assay kit (Bio-Rad) and 15 μg of protein/well were resolved on 12% SDS-PAGE and subsequently analyzed by immunoblot analysis. Bands were detected by a chemiluminescent ECL system (Bio-Rad) and quantified by Image J software.
Immunofluorescence assay
12 mm Cover slips were placed in 24-well plates and coated with Geltrex (Thermo Scientific) for 1 h before seeding. Cells were seeded at a density of 0.03 x 10⁶ cells/well 24 h prior to the treatment. Following treatment, cells were washed with 1x PBS and fixed with solution containing 4% paraformaldehyde and 0.2% Triton-X-100 for 10 min followed by blocking with 5% NDS buffer (normal donkey serum, 0.05% Triton-X-100 and 0.2 M Glycine) at room temperature for 30 min. The cells were incubated with primary antibody at 4°C overnight followed by incubation with secondary antibody (Alexa flour 488 or Alexa flour 594) for 1 h at room temperature. Nucleus was stained with DAPI (Bio-Rad) for 5 min and mounted with Fluoroshield Mounting Medium (Abcam) and sealed for analysis. In case of live staining the cells were seeded in grooved 35 mm plates (Nunc) at a density of 0.04 x 10⁶. After treatment, cells were incubated with Lysotracker red DND9 (Life technologies), Mitotracker green FM (Life technologies), TMRM (Sigma) and Mitosox red (Life technologies) at 37°C for 15 min and then washed with 3x times in fresh DMEM followed by incubation with Hoechst 33342 (Sigma) for 5 min and further analysed. All images were acquired by DMi8 confocal laser scanning microscope (Leica-microsystems) and images were analyzed using image J software.
NAD+/NADH Assay
The total NAD concentration, NAD+/NADH ratio and the concentration of total NAD+ and NADH was determined by NAD/NADH fluorometric assay kit from Abcam (ab176723) following manufacture’s protocol. The concentration of each component was calculated from the standard curve obtained by the standard solutions provided in kit. The increase in the fluorescence intensities were measured in a microplate reader (Synergy H1, Biotek) at Ex/Em=540/590. As per manufacturer’s instruction, respective concentrations were calculated by the equations described in the protocol: Total (NAD/NADH) = (B/V) x D where B = total NAD/NADH amount in the sample well (µM), V=sample volume added in the sample wells (25µl), D= sample dilution factor (150 µl). The NAD+ concentration was calculated with the same method from the same standard curve.
Measurement of total cellular ROS
Intracellular ROS was measured by using the H2DCF-DA (Sigma, D6883) reagent. Following treatment, cell lysates were prepared using a NP-40 lysis buffer and H2DCF-DA was added at a concentration of 50 µM and incubated for 1 h. Fluorescence intensities were measured at Ex/Em: 492/527 nm using a plate reader (BioTek - Synergy).
Real-Time PCR
RNA samples were collected from the cells and RNA was isolated using Trizol (Sigma) reagent as per the manufacturer’s protocol and 1 μg of isolated total RNA was digested with DNase I (NEB). cDNA was prepared from the total RNA using Reverse Transcription Supermix (BIO-RAD) and oligo dT primer. Real-time PCR was performed on CFX96 Real-Time System (BIO-RAD) using the SsoFast EvaGreen Supermix (BIO-RAD) following the manufacturer’s instructions. The relative exression of mRNA was normalized to the housekeeping gene Gapdh and the results were expressed as fold change (CT) as compared to the control levels.
Fly experiment
W1118 flies were a generous gift from Dr. Rupak Dutta, IISER Kolkata. Both male and female flies were grown at 22° C and 12-h light/dark cycle in standard cornmeal-starch diet and changed every 3-5 days. Rotenone and Olaparib were freshly prepared as 100 mM stock solution in DMSO. Flies were transferred to rotenone or Olaparib containing fresh medium every 2-3 days to assay for survival and locomotor deficits. 1-day old flies were generated in regular medium and transferred to DMSO, only rotenone or rotenone and Olaparib containing fresh medium. The number of total flies in each vial was counted at the beginning of each experiment and the dead/alive files were counted at 5, 10 and 20 days to calculate the percentage of survival for each set. The negative geotaxis assay was performed as previously described (Sur et al., 2018). Flies were transferred into a vertical glass climbing vial (length, 25cm; diameter, 3cm) and after a ten-minute acclimation period, the vials were tapped three times to initiate the assay. After 10 s, the percentage of flies crossing the 5 cm mark was noted for each trial. This procedure was repeated a total of ten times. All behavioral experiments were performed at room temperature under standard light conditions.
Statistical Analysis
Statistical analysis was performed using GraphPad Prism version 7.00 for Windows (GraphPad Software, La Jolla, CA, USA). The results are presented as mean ± SEM (standard error of mean) of at least three independent experiments performed in triplicate. Statistical significance was measured by one-way analysis of variance (ANOVA) and using Bonferroni post test wherever applicable. Asterisks indicate levels of significance (*p <0.05, **p <0.01 and ***p < 0.001).
Conflict of Interest
The authors declare no conflict of interest

Pearson’s correlation coefficient (PCC) of mitotrcker/lysotracker (A) and AIF/DAPI (B) to quantify the co-localization pattern following rotenone treatment.

Immunofluorescence analysis of cells transfected with FLAG-tagged full length Sarm1 for 24 h followed by rotenone(500 nM) treatment for 24 h. Results were compared with DMSO treated but transfected cells. Scale bars represent 10 μm.

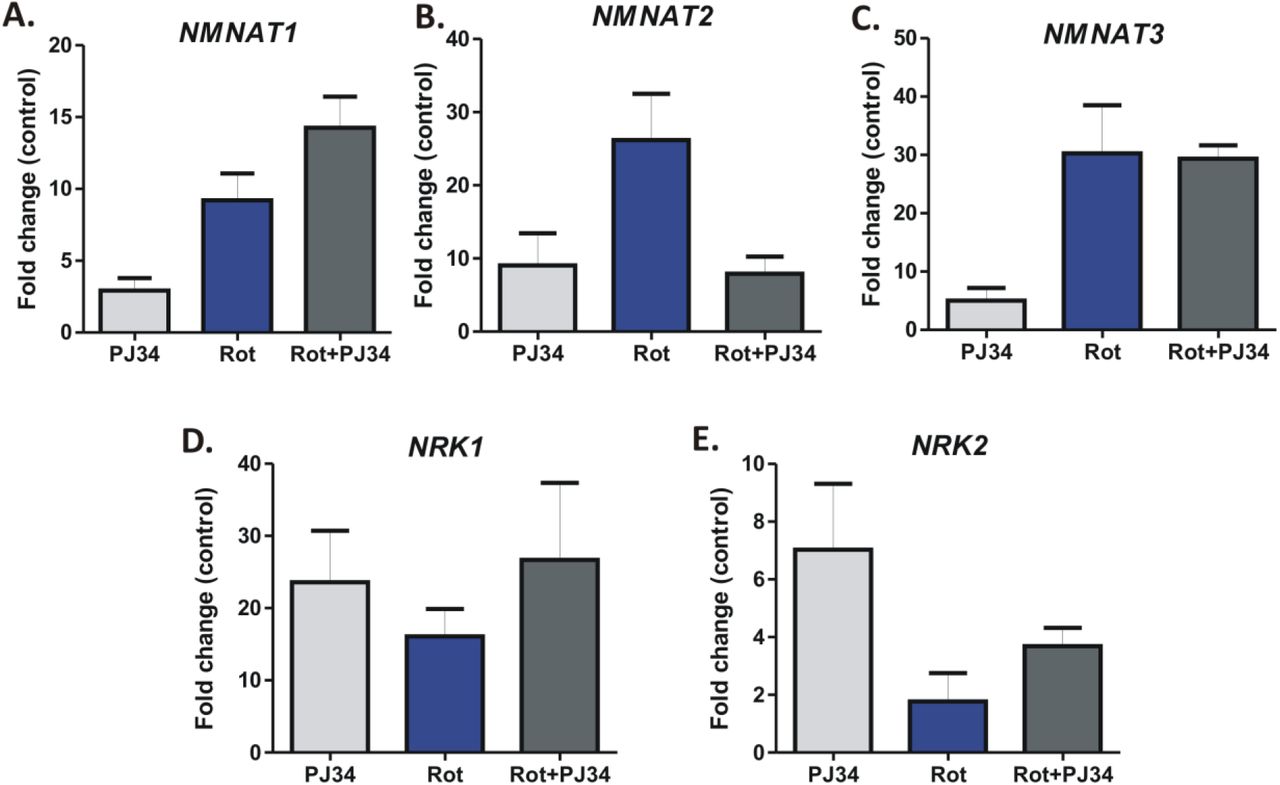
(A-E). qRT-PCR analysis of the fold change in gene expression of Nmanat1 (A), Nmnat2 (B), Nmnat3 (C), Nrk1 (D) and Nrk2 (E) at 24 h post rotenone treatment in HEK293 with respect to DMSO treated controls. Gapdh was used as an internal control for the analysis.

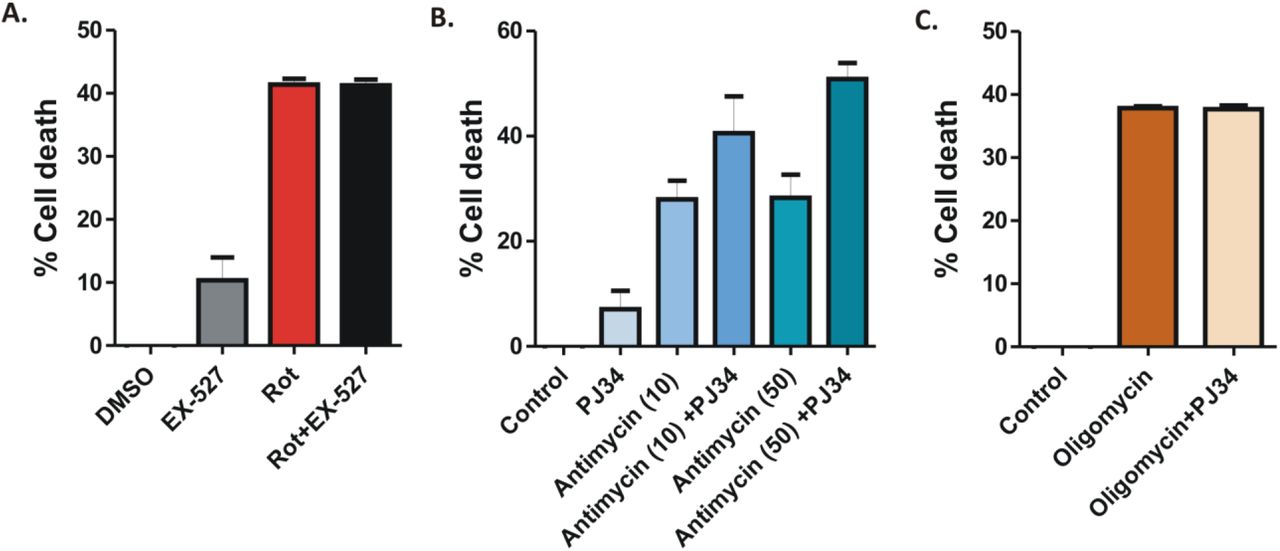
(A) Cell viability assay in the presence of Sirt1 inhibitor EX-527 (25 µM) in HEK293 cells. Cells were pre-incubated with EX-527 for 1 h followed by rotenone treatment for 24 h. The percentage of cell death was determined by the OD540 values in an MTT assay (B-C) Cell viability assay in HEK293 cells pre-incubated with 25 µM PJ-34 for 1 h followed by treatment with the mitochondrial complex III inhibitor Antimycin A (10 µM and 50 µM) (B) and the mitochondria complex V inhibitor Oligomycin (500nM) (C). The percentage of cell death was determined by the OD540 values in an MTT assay (D) siRNA mediated knock-down of PARP1. Cells were incubated with 100 nM of Parp1-siRNA for 24 h followed by rotenone treatment for 24 h. The percentage of cell death was determined by MTT assay.

(A) Immunoblot analysis of the autophagy marker protein LC3B in HEK293 cells treated with rotenone (24 h) in the presence or absence of PJ34. β-actin was used as a loading control (B) HEK293 cell co-stained with anti-LC3B (red) and anti-p62 (green) and nuclear stain DAPI (blue) to visualize the localization of autophagy marker proteins post rotenone treatment. Results were compared with DMSO control and PJ-34 treated cells (C) Cell viability assay in the presence of autophagic inhibitor chloroquine (50 µM) with or without incubating the cells with PJ-34 prior to rotenone treatment (D) Cell viability assay in cells pre-incubated with the autophagy inducer Rapamycin (200 nM) prior to rotenone treatment for 24 h.
Acknowledgements
The authors thank Shubhra Majumder for technical help with the microscopic studies. The authors also thank Karin Peterson and Rupak Datta for critical review of the manuscript. The work was funded by extramural funding from Dept. of Biotechnology, India (#BT/PR10983/BRB/10/1282/2014) and FRPDF scheme, Presidency University to PM. AS is a recipient of UGC-NET Fellowship [F.16-6(Dec.2016)/2017(NET)].
References


