

Abstract
Fluorescence dilution approaches can detect bacterial cell division events, and can detect if there are differential rates of cell division across individual cells within a population. This approach typically involves inducing expression of a fluorescent protein, and then tracking partitioning of fluorescence into daughter cells. However, fluorescence can be diluted very quickly within a rapidly replicating population, such as pathogenic bacterial populations replicating within host tissues. To overcome this limitation, we have generated a revTetR reporter construct, where mCherry is constitutively expressed, and repressed by addition of tetracyclines, resulting in fluorescence dilution within defined timeframes. We show that mCherry signal is diluted in replicating populations, and that mCherry signal accumulates in growth-inhibited populations, including during exposure to inhibitory concentrations of antibiotics and during nitric oxide exposure. Furthermore, we show that tetracyclines can be delivered to the mouse spleen during Yersinia pseudotuberculosis infection. We defined a drug concentration that results in even exposure of cells to tetracyclines, and used this system to visualize cell division within defined timeframes post-inoculation. revTetR mCherry signal did not appear enriched in a particular spatial location within replicating centers of bacteria. However, the addition of a NO-sensing reporter (Phmp::gfp) showed that heightened NO exposure correlated with heightened mCherry signal, suggesting decreased cell division within this subpopulation. This revTetR reporter will provide a critical tool for future studies to identify and isolate slowly replicating bacterial subpopulations from host tissues.
Introduction
Bacterial growth and metabolism have been the focus of decades of research, in part because we need to learn more about the pathways utilized by bacteria for growth to be able to target these essential processes with antibiotics or novel therapeutics. It is also well appreciated that bacteria with slowed metabolic rates are less susceptible to antibiotics (1-4). Earlier studies focused on growth of bacteria and antibiotic susceptibility under different laboratory conditions (1, 5-7); more recently, there has been a focus on studying bacterial growth and metabolism within host tissues, to more closely approximate bacterial growth conditions at the point where antibiotics or other therapeutics would be administered (8-10). Importantly, bacterial pathogens may utilize a range of different nutrients for growth within host tissues, and individual bacteria, or subsets of bacteria, may concurrently utilize different metabolites to promote their growth (10-14). Some of these substrates may support faster bacterial replication rates, and others, slower replication rates. Nutrient availability and the presence of host-derived antimicrobials, in addition to interactions with different immune cells subsets, can also generate complex microenvironments within host tissues, which can result in differences in growth rates across bacterial populations (12, 15-18).
When treating a bacterial infection, differences in bacterial growth rates can dramatically impact antibiotic efficacy. Slow-growing subsets of bacteria are inherently less susceptible to antibiotic treatment, due to decreased metabolic rates (1, 3, 4). This is termed antibiotic tolerance, a transient, phenotypic change in a subset of bacterial cells within a population, which alters antibiotic susceptibility (19, 20). Many of these experiments have been performed in bacteriological media, so it still remains largely unclear which pathways promote decreased antibiotic susceptibility and slowed growth within host tissues. To identify these pathways, investigators will need to isolate antibiotic tolerant cells from the host environment for downstream analyses. The specific bacterial pathways linked to tolerance may depend in part on the antibiotic and the mode of action, or the environment around the bacteria during the antibiotic exposure (18, 21, 22).
Molecular tools currently exist to identify and isolate slow-growing bacterial cells (8, 23-26), but there are also limitations with some of these approaches that need to be addressed to apply them within the host environment. One of the main approaches is utilizing fluorescence dilution to identify individual cells that have divided within a certain timeframe. Typically, fluorescence dilution approaches involve inducing expression of a fluorescent protein then removing the inducer, and detecting changes in the amount of fluorescent protein within cells as a readout for cell division events and protein partitioning into daughter cells (27, 28). Many research groups have successfully utilized this approach to identify dividing and non-dividing bacterial cells, by inducing fluorescent expression prior to introducing bacteria into tissue culture or infection models (27-30). For some bacterial infection models, this approach can easily be applied, because the size of the colonizing population of bacteria is relatively large, and the number of cell division events within host tissues is relatively small (24, 25, 27). However, in other infection models, only a few bacterial cells establish infection, and these cells go on to replicate many times, which would quickly dilute out fluorescent signals (17, 31-33). Furthermore, it is difficult to deliver inducer compounds into host tissues at sufficient levels to modulate gene expression, and more challenging to remove these compounds to allow for subsequent fluorescence dilution.
Yersinia pseudotuberculosis is an enteric pathogen that spreads systemically from intestinal tissues to colonize deep tissue sites, such as the spleen (34-36). There is a strong population bottleneck within intestinal tissues, and few bacterial cells spread systemically to colonize deep tissue sites (37). Within deep tissues, individual bacteria found clonal clusters of replicating extracellular bacteria, termed microcolonies or pyogranulomas (17, 38, 39). Microcolonies can grow to contain hundreds to thousands of bacteria within a single replication site, despite recruitment of circumscribing layers of neutrophils and monocytes (17, 39, 40). Recent studies have shown that subpopulations of bacteria are present within microcolony structures, and that subsets of bacteria stressed by the presence of nitric oxide (NO) preferentially survive treatment with doxycycline, suggesting they may represent a slow-growing subset of cells (17, 22). However, it has been difficult to determine growth rates in this model system, since fluorescence dilution approaches cannot typically be used when the bacterial population contracts and expands so dramatically.
To overcome these limitations, we have generated a revTetR reporter construct, where exposure to tetracyclines will inhibit additional fluorescent gene expression, resulting in fluorescence dilution. This construct will promote fluorescent signal accumulation in non-dividing cells, and fluorescent protein will be diluted into dividing cells, thus allowing us to differentiate between dividing and non-dividing subpopulations of bacteria. Tetracyclines can also easily be delivered into our mouse model of Yersinia pseudotuberculosis systemic infection (22), which allows us to visualize fluorescence dilution as a measure of cell division at specific stages of infection and within specific timeframes. Here, revTetR allows us to ask if responses to host-derived stresses, specifically nitric oxide (NO), impacts in vivo cell division rates. This reporter construct will be a useful tool for future studies to isolate and characterize bacterial subpopulations with differential growth rates.
Results
The revTetR reporter can be used to visualize differential bacterial growth rates in vitro with mCherry fluorescence dilution
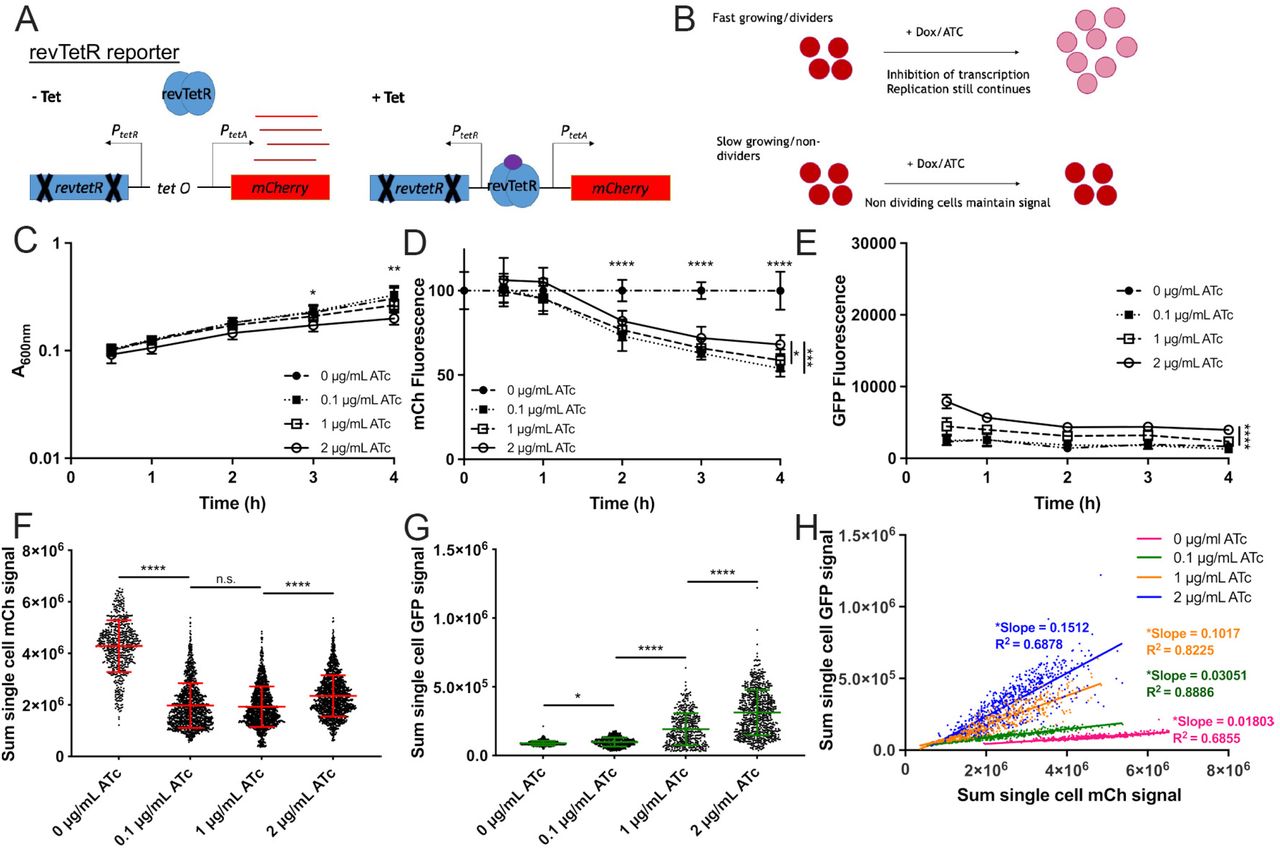
To detect differential cell division rates within host tissues, we generated a fluorescence dilution reporter system by modifying our recently described TetON fluorescent reporter with stable mCherry (tetR::PtetA::mCherry) (22). The revTetR reporter (revtetR::PtetA::mCherry) was constructed by introducing two mutations (E15A and L17G) into the wild-type tetR gene. These two mutations were predicted to cause a reversal of TetR activity resulting in repression of PtetA specifically in the presence of tetracycline and tetracycline derivatives (41, 42). Therefore, revTetR is a tetracycline-responsive reporter that allows cells to constitutively express mCherry in the absence of tetracycline derivatives, and subsequent addition of tetracyclines should inhibit additional mCherry transcription (Figure 1A). This reporter can be used to compare growth rates of bacteria via a fluorescence dilution approach (27, 28). For example, in cultures treated with tetracycline, fast-growing cells will continue to divide, and the existing mCherry signal will be partitioned between daughter cells with every replication event (Figure 1B). However, slow-growing or nondividing cells will not go through the same number of replication events and therefore will not undergo fluorescence dilution (Figure 1B).

(A) The revTetR reporter was created by introducing two mutations (E15A and L17G) in the wild-type tetR sequence, which results in constitutive mCherry expression in the absence of tetracyclines (-Tet). Tetracycline addition (+Tet) promotes revTetR binding and repression of mCherry transcription. (B) After tetracycline addition (+Dox/ATc), fast-growing/dividing bacteria (top row, red circles) will partition mCherry equally into daughter cells with each cell division event, resulting in dilution. Slow-growing/non-dividing cells will retain a high level of mCherry (bottom row). Exponential phase cultures of the revTetR dps strain were treated with the indicated ATc doses at 0h (hours, h), aliquots were taken at the indicated timepoints to detect (C) optical density by absorbance (A600nm), (D) mCh fluorescence (normalized by dividing total fluorescence by OD values, untreated value set to 100%), and (E) GFP fluorescence normalized to OD. (C-E): Data shown from 9 replicates. (F) Cells treated with the indicated doses of ATc for 4h were fixed for fluorescence microscopy. Sum single cell mCherry signal is shown. (G) Sum single cell GFP signal is shown. (H) Correlation plot depicting single cell sum mCherry and sum GFP signals. (F-H): Data shown from three biological replicates. Mean and standard deviation are shown. Statistics: (C-E) Two-way ANOVA with Tukey’s multiple comparison test, comparisons made between 2µg/ml and other groups; (F-G) Kruskal-Wallis one-way ANOVA with Dunn’s post-test; (H) linear regression with R2 value and slope of best-fit line, significantly non-zero slope indicates values are correlated. ****p<.0001, **p<.01, *p<.05, n.s.: not-significant.
To confirm that the mCherry fluorescence from the revTetR reporter dilutes into actively dividing cells, we generated a reporter strain containing the revTetR reporter alongside a plasmid containing dps::gfp-ssrA (revTetR dps) (16). Dps, a ferritin-like iron-sequestering protein, accumulates within bacteria in stationary phase in response to multiple different stresses and protects DNA from oxidative damage (43-45). Therefore, revTetR dps should detect slow-growing cells within the population with GFP signal (16), and allow us to compare this to mCherry levels from revTetR. Exponential phase revTetR dps cells were treated with increasing doses of anhydrotetracycline (ATc), a tetracycline derivative that binds TetR or revTetR but has limited ribosomal targeting (46, 47). Aliquots of each sample were measured for optical density or absorbance (A600nm) and fluorescence using a microplate reader. The absorbance values increased across all treatment groups, and ATc did not have a detrimental effect upon growth rate with either 0.1µg/ml or 1µg/ml treatment (Figure 1C). However, 2µg/ml ATc treatment did slightly inhibit growth, resulting in significantly lower OD values at 3h and 4h post-treatment (hours, h). mCherry fluorescence values were normalized to cell number by dividing the background-subtracted fluorescence value from each well by the corresponding OD value. The resulting value was further normalized to the untreated sample value for each time point (set at 100%). Following 2h of ATc treatment, all treated groups had significantly reduced mCherry fluorescence relative to untreated cells (Figure 1D). This was consistent with a predicted 1.5-2h cell division rate during growth at 37°C based on absorbance (Figure 1C). At 4h post-treatment, the fluorescence signal for all treated groups decreased by approximately 40% relative to the signal of the untreated group, showing that ATc successfully induces dilution of mCherry with each replication event (Figure 1D). We noted that 2µg/ml ATc treatment resulted in significantly higher mCherry (Figure 1D) and dps reporter signal (Figure 1E) relative to 0.1µg/ml and 1µg/ml treatment, again suggesting the dose may slightly inhibit growth, and providing evidence that slowed growth can be detected by an increase in mCherry signal.
Heterogeneity within each sample was further represented at the single-cell level. Cells from the final time point (4h) were fixed and imaged using fluorescence microscopy, and analyzed for single cell fluorescence measurements. The average signal of the untreated group (0µg/ml) was significantly higher than the average signal of the group treated with the lowest dose of ATc (0.1µg/ml), again showing that signal dilution was successful (Figure 1F). 1µg/ml ATc treated cells had mCherry fluorescence similar to the 0.1µg/ml treated group. However, at the highest dose of ATc (2µg/ml), the average mCherry signal signficantly increased (Figure 1F), and we found there were also significant increases in dps reporter expression with increasing doses of ATc (Figure 1G), suggesting that high concentrations of ATc may have an inhibitory effect on bacterial cells. Slower growing cells with heightened dps reporter expression should also exhibit heightened revTetR mCherry signal, and we confirmed these signals were correlated under all treatment conditions, based on significantly non-zero slopes of linear regression best-fit lines (Figure 1H). Collectively these data indicate that revTetR fluorescence is accumulating in slow-growing cells, and that actively growing cells are partitioning mCherry into daughter cells, resulting in significant decreases in mCherry signal.
Growth inhibition with doxycycline promotes mCherry fluorescence accumulation
To further test whether growth-inhibited cells exhibit heightened revTetR mCherry fluorescence, cells of the revTetR dps strain were sub-cultured to exponential phase and treated with increasing doses of the antibiotic, doxycycline (Dox). Aliquots of each sample were measured for optical density (OD) by absorbance (A600nm) and fluorescence at hourly timepoints using a microplate reader. Cells exposed to 1µg/mL Dox had significantly decreased growth rate, however the doses less than 1µg/ml (0.01-0.1µg/ml) were subinhibitory, and did not impact growth (Figure 2A). mCherry fluorescence was initially heightened with 1µg/ml Dox treatment (Figure 2B), and dps reporter signal was slightly, but not significantly, elevated (Figure 2C), consistent with growth inhibition at this treatment concentration. Three hours after treatment, the mCherry signal in all treatment groups was significantly below untreated values, including the 1µg/ml treatment group (Figure 2B), suggesting that growth may resume after initial growth inhibition. Single cell analysis was performed by fluorescence microscopy, and single cell fluorescence levels were graphed for each treatment group. Dilution of mCherry signal could be seen with treatment of 0.01µg/mL Dox, but as the dosage increased, the mean mCherry signal within cells increased, indicating signal accumulation and stalled growth (Figure 2D). The mCherry fluorescent signal was significantly higher in cells treated with 1µg/ml Dox compared to untreated cells (0µg/ml), suggesting that growth inhibition resulted in significant mCherry revTetR fluorescence accumulation. Again, we observed a correlation between dps reporter signal and revTetR mCherry signal under all treatment conditions, confirming that slower growing cells have heightened revTetR fluorescence (Figure 2E).

Exponential phase cultures of the revTetR dps strain were treated with the indicated doses of doxycycline (Dox) at 0h (hours, h), aliquots were taken at the indicated timepoints to detect (A) optical density by absorbance (A600nm), (B) mCh fluorescence (normalized by dividing total fluorescence by OD values, untreated value set to 100%), and (C) GFP fluorescence normalized to OD. (A-C): Data shown from 9 replicates. (D) Cells treated with the indicated doses of Dox for 4h were fixed for fluorescence microscopy. Sum single cell mCherry signal is shown. (E) Correlation plot depicting single cell sum mCherry and sum GFP signals. (D-E): Data shown from three biological replicates. Mean and standard deviation are shown. Statistics: (A-C) Two-way ANOVA, Tukey’s multiple comparison test, comparisons shown between untreated (0µg/ml) and 1µg/ml Dox; (D) Kruskal-Wallis one-way ANOVA with Dunn’s post-test; (E) linear regression with R2 value and slope of best-fit line, significantly non-zero slope indicates values are correlated. ****p<.0001, ***p<.001, **p<.01, *p<.05, n.s.: not-significant.
Gentamicin treatment confirms mCherry fluorescence levels are heightened in growth arrested cells
Although subinhibitory treatments with tetracyclines result in fluorescence dilution in actively dividing cells, we observed quite a bit of heterogeneity in revTetR mCherry fluorescence at the single cell level. To address the high variability of data from the previous fluorescence dilution experiments, we used a short gentamicin treatment to inhibit growth and synchronize the cell cycle of sampled populations before removing the antibiotic to allow growth to resume. Gentamicin was chosen for these experiments because it is an aminoglycoside that targets the ribosome to inhibit bacterial growth, but does not interact with revTetR. We initially tested three concentrations of gentamicin to identify a concentration that might synchronize the bacterial population: 5µg/ml, 10µg/ml, and 40µg/ml; we added gentamicin at 0h, and then monitored growth based on absorbance in the presence of gentamicin. 5µg/ml did not significantly impact growth, while 40µg/ml resulted in growth inhibition, and 10µg/ml had an intermediate effect on growth (Figure 3A). Only the 40µg/ml dose resulted in an increase in mCherry fluorescence, which was apparent after 1h treatment (Figure 3B), and so we chose to perform subsequent experiments with the inhibitory 40µg/ml dose for only an hour incubation, anticipating that cells would resume growth after washing out gentamicin and adding cells to fresh media. revTetR dps cells were treated with gentamicin for 1 hour, washed with fresh media to allow their growth to resume, and then treated with ATc (1µg/ml). OD and fluorescence were measured up to 4h post ATc treatment. The sum mCherry fluorescence (total fluorescence per cell) was significantly higher in the gentamicin-treated sample immediately prior to ATc treatment, however there was still high variability in mCherry expression, suggesting gentamicin treatment did not promote uniform mCherry accumulation (Figure 3C). Additionally, cells treated with gentamicin did not resume growth following treatment based on OD measurements (Figure 3D). Consistent with this, mCherry signal was only slightly lower in gentamicin-treated cells treated with ATc, suggesting very little growth 4h following gentamicin treatment (Figure 3E). Cells that were not treated with gentamicin exhibited normal growth, and significant fluorescence dilution with ATc treatment (Figure 3E). These data suggest that growth arrest does result in significant mCherry signal accumulation, but the addition of gentamicin prior to ATc treatment did not reduce variability in mCherry signal at the single cell level.

Overnight cultures of the revTetR dps strain were diluted 1:100 and treated with the indicated doses of gentamicin at 0h (hours, h), aliquots were taken at the indicated timepoints to detect (A) optical density by absorbance (A600nm) and (B) mCherry (mCh) fluorescence, normalized by dividing total fluorescence by OD values. Mean and standard deviation are shown. (C) Exponential phase cultures of the revTetR dps strain were treated with 40µg/ml gentamicin (gent) 1h, and an aliquot of cells were fixed for fluorescence microscopy. Sum single cell mCherry signal is shown. Median value/group is highlighted. (D) After 1h gentamicin treatment, cultures of the revTetR dps strain were treated with 1µg/ml ATc at 0h, and aliquots were taken at the indicated timepoints to detect optical density by absorbance (A600nm). Mean and standard deviation are shown. (E) Cells incubated +/-ATc for 4h were fixed for fluorescence microscopy. Sum single cell mCherry signal is shown. Median value/group is highlighted. Data shown from three biological replicates. Statistics: (B) Two-way ANOVA, Tukey’s multiple comparison test, comparisons shown between untreated (0µg/ml) and 40µg/ml gent; (C) Mann-Whitney; (E) Kruskal-Wallis one-way ANOVA with Dunn’s post-test; ****p<.0001, ***p<.001, **p<.01, *p<.05.
Nitric oxide-stressed cells divide at a slower rate than unstressed cells
It has been shown recently that exposure to nitric oxide (NO) results in cell division arrest, through collapse of the FtsZ cell division machinery (48). Our results have also suggested NO-stressed Yersinia pseudotuberculosis preferentially survive doxycycline treatment during growth in the mouse spleen (22), which is consistent with a hypothesis that NO causes cell division arrest within host tissues, and subsequently promotes decreased antibiotic susceptibility.
Cells containing the revTetR reporter and Phmp::gfp (revTetR Phmp::gfp) were treated with the slow-releasing NO donor compound DETA-NONOate for 1h, then further treated with ATc (1µg/ml). The Phmp::gfp reporter was used to detect NO exposure, and to mark the level of stress experienced by individual cells, which can be variable across the population in response to DETA-NONOate (16, 17). Aliquots were taken every 2h after ATc treatment, and fixed cells were imaged using fluorescence microscopy at the indicated timepoints (Figure 4A). Images were subsequently quantified for single-cell fluorescence measurements. Growth inhibition due to treatment with the NO donor, DETA-NONOate, was confirmed (Figure 4B); induction of hmp above the baseline level in response to the NO donor was also confirmed across all treatment groups (Supplemental Figure 1). When comparing cells treated with NO and ATc, we found the revTetR mCherry fluorescence remained high and actually increased between 2h and 4h ATc treatment, consistent with growth inhibition in the presence of NO (Figure 4C). In contrast, cells grown in the absence of NO treatment had a significant drop in mCherry fluorescence between 2h and 4h, suggesting significant levels of cell division events within this timeframe (Figure 4C). Consistent with previous literature, these results indicate that NO treatment results in growth arrest, and reduced levels of cell division events (48).

(A) Schematic of experimental design. Overnight cultures of the revTetR Phmp::gfp strain were diluted 1:100 and grown for 1h prior to NO donor addition, then cultured one addition hour in the presence (+NO) or absence (-NO) of NO. Cultures were then split, and either treated with 1µg/ml ATc (+ATc) or left untreated (-ATc). (B) Aliquots were taken at the indicated timepoints to detect optical density by absorbance (A600nm). Mean and standard deviation are shown. (C) Aliquots of cells were fixed at the indicated timepoints after ATc addition for fluorescence microscopy. Sum single cell mCherry signal is shown. Median value/group is highlighted. (D) Correlation plots depicting single cell sum mCherry and mean GFP signals. Comparisons were made for NO-treated cells (+NO) in the presence (+ATc) and absence (-ATc) of ATc, cells were imaged at the indicated timepoints after ATc addition. Values were normalized to the max signal intensity detected in samples, which is represented as a value of 1.0. All data shown represents three biological replicates. Statistics: (B) Two-way ANOVA, Tukey’s multiple comparison test, comparisons shown between untreated (-NO) and NO donor treated (+NO) samples; (C) Kruskal-Wallis one-way ANOVA with Dunn’s post-test; (D) linear regression with R2 value and slope of best-fit line, significantly non-zero slope indicates values are correlated. ****p<.0001, *p<.05, n.s.: not-significant.
To determine if cell division occurred in cultures despite NO stress, and whether heightened hmp reporter signal correlated with heightened revTetR mCherry signal, single cell mCherry and GFP levels from NO-treated cells were compared in the presence and absence of ATc treatment using correlation plots. At the time of ATc treatment (0h) the bacterial populations were very similar in fluorescence, as expected (Figure 4D). At 2h post-Atc addition, there was a correlation between mCherry and GFP levels independent of ATc treatment, and extensive overlap within the cell populations, suggesting few cell division events within this timeframe (Figure 4D). However, at 4h post-ATc treatment, there was a clear decrease in mCherry fluorescence, suggesting cell division had occurred despite NO treatment, and there was a positive correlation between mCherry and GFP levels in NO-stressed cells treated with ATc, which was lost in -ATc samples (Figure 4D). These data suggest that while NO-treated cells can continue to replicate after treatment, cells experiencing higher levels of stress, as evidenced by higher hmp reporter signal, completed fewer cell division events over the timecourse than cells experiencing lower levels of stress.
Low doses of doxycycline and anhydrotetracycline diffuse evenly across microcolonies and do not inhibit bacterial growth
One of the major goals for generating the revTetR reporter was to set-up a system to detect bacterial cell division events within host tissues over defined periods of time. To do this, we would need to administer tetracyclines during infection, and ensure that the dosage used would not impact bacterial growth, and also diffuse evenly across microcolonies to allow for accurate detection of signal dilution and cell division. We have previously developed a model of doxycycline treatment of Y. pseudotuberculosis infection, and found that a single 40mg/kg injection of doxycycline significantly reduces bacterial CFUs and also accumulates at a higher concentration at the periphery of microcolonies (22). We hypothesized that lowering the tetracycline dose may allow us to administer sub-inhibitory levels of antibiotic that would still modulate the revTetR reporter, while allowing for more even diffusion of the antibiotic across microcolonies.
To identify a tetracycline concentration that results in equal diffusion across microcolonies, a previously characterized reporter, PtetA::mCherry-ssrA (TetON), was used for tetracycline detection (22). The TetON reporter contains the wild-type tetR gene; addition of tetracyclines induce the production of mCherry, and therefore levels of mCherry can be used as a readout for antibiotic exposure (Figure 5A). C57BL/6 mice were inoculated intravenously with the TetON gfp+ strain, which has constitutive expression of GFP alongside the TetON reporter, allowing for visualization of relative reporter expression. A single dose of 4mg/kg Dox or 4mg/kg ATc was administered intraperitoneally at 48 hours post-inoculation. This timepoint was chosen for antibiotic administration since we can detect subsets of bacteria responding to host-derived nitric oxide at this timepoint, thus allowing us to ask whether stressed subpopulations of bacteria are dividing more slowly than unstressed bacteria.
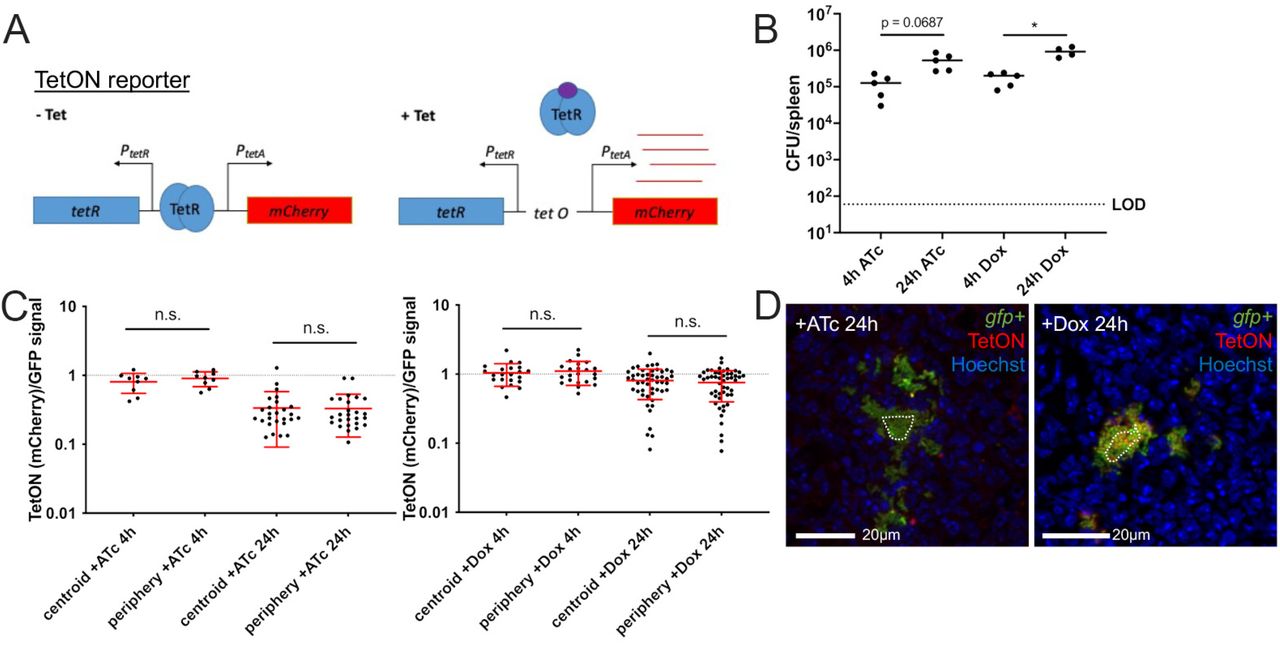
C57BL/6 mice were infected intravenously with the TetON gfp+ strain and a single dose of Dox (4mg/kg) or ATc (4 mg/kg) was administered intraperitoneally at 48h post-inoculation. Spleens were harvested at the indicated timepoints after treatment. (A) Schematic of the TetON reporter: addition of tetracycline relieves TetR repression and allows for mCherry transcription. (B) CFU/spleen quantification at the indicated timepoints post-treatment. Dotted line: limit of detection, dots: individual mice. (C) Reporter signal was detected with fluorescence microscopy and is shown as the ratio of TetON (mCherry)/GFP signal at the centroid and periphery of microcolonies. Timepoints indicate time post-treatment with ATc (left panel) or Dox (right panel). Dotted line: equivalent levels of mCherry and GFP signal. Each dot: individual microcolony. Mean and standard deviation are shown. (D) Representative images; cells outside the dotted line are defined as peripheral. Dataset represents 4-5 mice/group, collected from two independent experiments; 2-8 microcolonies were analyzed/spleen from a single cross-section of tissue. Statistics: (B) Kruskal-Wallis one-way ANOVA with Dunn’s post-test; (C) Wilcoxon matched-pairs; *p<.05, n.s.: not-significant.
At 4h or 24h post-treatment, spleens were harvested to quantify CFUs and quantify reporter expression by fluorescence microscopy. Bacterial numbers continued to increase between 4h and 24h post-treatment with 4mg/kg doses of either ATc or Dox, confirming this dosage does not interfere with bacterial growth (Figure 5B). Microcolonies were then visualized by fluorescence microscopy to determine if ATc and Dox diffuse evenly across microcolonies at this dosage. The centroid and periphery of each microcolony were quantified for mCherry and GFP signal, and the ratio of mCherry/GFP was graphed. There were no significant differences in mCherry/GFP ratios between the centroid and periphery of microcolonies treated with either ATc or Dox, suggesting that each drug was diffusing evenly across microcolonies (Figure 5C). The mCherry/GFP ratios remained comparable at the centroid and peripheries even at 24 hours after treatment, showing that throughout the infection time course, there was even diffusion of the drugs (Figure 5C, 5D). These data here suggest that lowering the tetracycline dosage 10-fold results in even diffusion of a sub-inhibitory dose of tetracyclines, which will allow us to modulate revTetR reporter expression in all cells across the microcolony without impacting bacterial growth.
revTetR signal appears to increase in both the centroid and periphery of microcolonies
To determine if there are slowly-dividing subpopulations of bacteria within microcolonies, we infected mice with the revTetR gfp+ strain, and treated mice with ATc at 48h post-inoculation or left mice untreated. Mice were sacrificed at either 4h or 24h post-treatment, and spleens were harvested to quantify CFUs and visualize reporter expression by fluorescence microscopy. Bacterial CFUs were comparable between ATc-treated and untreated mice at both timepoints, suggesting that ATc treatment did not impair bacterial growth (Figure 6A). However, we did not see an increase in CFUs between 4h and 24h, which suggests there was limited, or variable, bacterial growth within this selected timeframe for this bacterial strain. To determine if there were differences in reporter expression, mCherry signal was quantified relative to the constitutive GFP signal at the periphery and centroid of individual microcolonies. Since we have previously shown that bacteria experience heightened levels of NO stress and express higher levels of the T3SS at the periphery of microcolonies, we were expecting to see heightened levels of mCherry signal relative to GFP at the periphery of microcolonies. At 4h post-treatment, we did not observe any differences in mCherry signal at the periphery of microcolonies compared to the centroid, in the absence or presence of ATc treatment (Figure 6B). This suggested there may not have been many cell division events within the first 4h of treatment, which is why tissue was also harvested 24h post-treatment. At 24h post-treatment, untreated mice had significantly lower levels of mCherry signal at the periphery of microcolonies, and ATc treated mice also had significantly lower mCherry signal at the periphery, indicating we were not seeing increased mCherry signal at the periphery of microcolonies as expected (Figure 6C). It did appear that ATc treated microcolonies had higher mCherry signals at both the centroid and periphery relative to untreated microcolonies, although this was not statistically significant. These results suggest that revTetR signal remained high after ATc treatment, indicating there may be slowly dividing cells present within microcolonies, but it was difficult to assess whether these cells were part of a particular subpopulation of bacteria without an additional reporter alongside revTetR.

C57BL/6 mice were infected intravenously with the revTetR gfp+ strain and a single dose of ATc (4 mg/kg) was administered intraperitoneally at 48h post-inoculation. Spleens were harvested at the indicated timepoints after treatment to quantify CFUs and prepare tissue for fluorescence microscopy. (A) CFU/spleen quantification at the indicated timepoints post-treatment. Dotted line: limit of detection, dots: individual mice, horizontal lines: median values. (B) Reporter signal at 4h quantified using the ratio of revTetR (mCherry)/GFP signal at the centroid and periphery of microcolonies. Dotted line: equivalent levels of mCherry and GFP signal. Each dot: individual microcolony. Mean and standard deviation are shown. (C) Reporter signal at 24h quantified using ratio of revTetR (mCherry)/GFP signal at the centroid and periphery of microcolonies. Mean and standard deviation are shown. (D) Representative images. Dataset represents 4-6 mice/group, collected from three independent experiments; 2-13 microcolonies were analyzed/spleen from a single cross-section of tissue. Statistics: (A) Kruskal-Wallis one-way ANOVA with Dunn’s post-test; (B-C) Wilcoxon matched-pairs; **p<.01, *p<.05, n.s.: not-significant.
NO stress correlates with heightened mCherry signal accumulation and slowed cell division rates
Hmp+ bacteria responding to NO stress preferentially survive doxycycline treatment, suggesting they may represent a slow-growing subpopulation (22). Consistent with this, in culture NO stressed cells accumulated heightened mCherry signal, suggesting they were dividing more slowly than unstressed cells (Figure 4). However, in our mouse model it was difficult to determine if peripheral cells of the microcolony had heightened revTetR signal without marking the peripheral subpopulation with the hmp reporter. To determine if NO-stressed bacteria are dividing more slowly than unstressed cells within host tissues, we infected mice with the revTetR Phmp::gfp strain and treated mice with ATc at 48h post-inoculation, or left mice untreated. Spleens were harvested at 4h and 24h post-treatment to quantify CFUs and visualize reporter expression by fluorescence microscopy. CFUs within ATc-treated mice did not differ significantly from CFUs within untreated mice; again, we noted that there was not significant growth based on total CFUs between 4h and 24h, but anticipated that there would be sufficient replication at the level of individual microcolonies to assess differences in revTetR signal (Figure 7A).
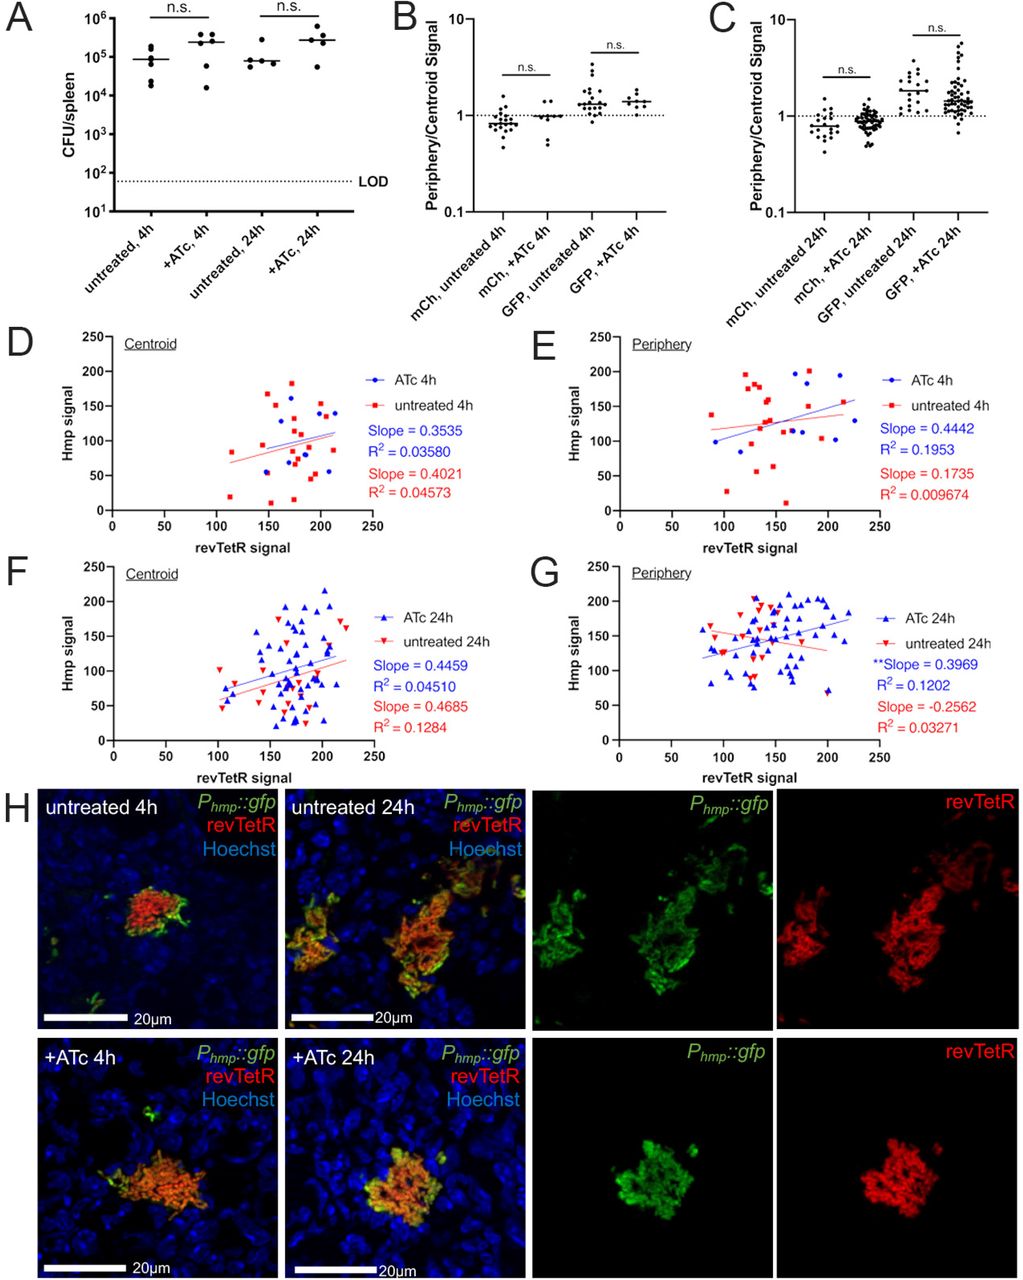
Mice were infected with the revTetR Phmp::gfp strain and a single dose of ATc (4 mg/kg) was administered intraperitoneally at 48h post-inoculation. Spleens were harvested at the indicated timepoints after treatment and prepared for fluorescence microscopy. (A) CFU/spleen quantification. Dotted line: limit of detection, dots: individual mice. (B) Reporter signal at 4h quantified using ratio of periphery/centroid signal for either mCherry (mCh) or GFP. Dotted line: equivalent levels of mCherry and GFP signal. Each dot: individual microcolony. (C) Reporter signal at 24h quantified using ratio of periphery/centroid signal for either mCh or GFP. (D-G) Correlation plots depicting single cell sum revTetR (mCherry) and Hmp (GFP) signals at the indicated timepoints, comparing +/- ATc treatment. Graphs represent either centroid or peripheral values, dots: individual microcolonies. (H) Representative images with the green and red channels shown alongside merged images for 24h post-treatment images. Dataset represents 5-6 mice/group, collected from three independent experiments; 3-8 microcolonies were analyzed/spleen from a single cross-section of tissue. Median values shown with horizontal lines. Statistics: (A-C) Kruskal-Wallis one-way ANOVA with Dunn’s post-test (D-G) linear regression with R2 value and slope of best-fit line, significantly non-zero slope indicates values are correlated. **p<.01, n.s.: not-significant.
Periphery and centroid measurements were taken from each microcolony image and combined into a single periphery/centroid ratio for each microcolony to allow for comparison across treatment groups. At 4h post-treatment, the average ratio for the hmp reporter signal was above a value of 1, indicating higher expression in the peripheral cells, while the average ratio for mCherry values was close to 1, suggesting equal expression in peripheral and centroid cells (Figure 7B). At 24h post-treatment, GFP ratios remained above 1, indicating high peripheral expression, and the +ATc mCherry ratio appeared to increase, although this was not significant (Figure 7C). There were no significant differences between ATc-treated and untreated groups for either timepoint, suggesting there wasn’t a dramatic change in fluorescent signals following ATc treatment in these experiments. However, the slight increase in mCherry expression at 24h indicates that microcolonies may have higher mCherry signal along the periphery, indicating slower growth in that region. Moreover, after the data was separated according to spatial location within the microcolony, there was a clear difference in trends between centroid bacteria and peripheral bacteria (Figure 7D-G). Of note, centroid bacteria showed very similar fluorescent patterns at 4h (Figure 7D) and 24h (Figure 7F) post-treatment, while peripheral bacteria at 24h post-treatment have a statistically significant positive correlation (Figure 7G), indicating that Hmp+ cells expressing higher levels of GFP tended to also express higher levels of mCherry (Figure 7H), supporting the conclusion that these cells are slower growing.
Discussion
In this study, we have developed a revTetR mCherry construct that can be utilized to detect bacterial cell division events within host tissues using a fluorescence dilution approach. We have shown this construct results in heightened mCherry signal in growth-arrested cells in culture, and have also shown that nitric oxide (NO) stress is sufficient to promote increased mCherry signal (Figure 4). This was consistent with previous studies showing NO exposure results in an arrest of cell division (48). However, our in vivo results in the mouse model of infection were less clear; with a constitutive gfp alongside the revTetR reporter, it was difficult to detect the expected heightened mCherry fluorescent signal within peripheral cells (Figure 6), which should have been responding to NO stress. Using the hmp reporter alongside revTetR, we were able to show that there was in fact a correlation between hmp reporter signal and revTetR mCherry signal within host tissues, suggesting that there were fewer cell division events within the peripheral Hmp+ population during the selected timeframe of ATc treatment (Figure 7).
There are several reasons this association between cell divisions events and NO stress may have been difficult to capture within host tissues. It is possible that we chose a timeframe where there were limited amounts of cell division. In the future, we would like to sample an extended timecourse with the revTetR Phmp::gfp strain to better understand where there are larger expansions in the bacterial population, and where we may detect more differential in terms of cell division rates between stressed and unstressed cells. hmp expression levels will also need to be assessed at each timepoint to determine if this stressed subpopulation is present. Although this data has previously been generated with other Y. pseudotuberculosis strains (17, 22, 49), the low levels of growth between 4h-24h treatment (52h-72h post-inoculation) with the revTetR strains suggest these reporter strains may not be replicating as quickly, or with the same dynamics, as other strains. We would typically expect a 5-10 fold increase in bacterial growth within this timeframe, as seen with the TetON gfp+ strain (Figure 5B). Another useful approach may be to modulate revTetR mCherry levels by decreasing initial mCherry expression, which could be interfering with growth of the strain (50). This could be accomplished by integrating a single copy into the chromosome to reduce copy number or by modifying the mCherry start codon to reduce levels of translation initiation (51). One thing to note is that the revTetR reporter strains did grow normally in culture, suggesting if they do have some growth delay, this is specifically induced within the host environment.
In this study, we compared revTetR reporter signal during treatment with two tetracycline derivatives, the active antibiotic, doxycycline (Dox), and the inactive derivative, anhydrotetracycline (ATc). Both tetracycline derivatives bind to TetR and revTetR, however ATc is predicted to bind these proteins with higher affinity, and has poor affinity to bacterial ribosomes (46, 47). This allowed us to modulate revTetR with ATc without significantly inhibiting translation, however we would expect to see translational inhibition during Dox treatment, and did see evidence of this when detecting dps reporter signal alongside revTetR. The amount of dps signal may not significantly increase with Dox treatment due to significant translational inhibition, and the inability of cells to translate gfp transcripts, which was observed when growth inhibition with 1µg/ml Dox did not significantly increase GFP signal (Figure 2C). However, we were able to conclude that slow-growing or growth-arrested cells had higher levels of revTetR mCherry signal using ATc and NO treatments.
Another consideration for this study was the ability of tetracyclines to diffuse evenly across microcolonies, as high levels of doxycycline were shown to accumulate at the periphery of bacterial microcolonies (22). We were able to identify a tetracycline concentration that resulted in even diffusion across microcolonies (Figure 5), but also pursued a dual reporter strategy to simultaneously detect tetracycline exposure and fluorescence dilution. We chose to generate this construct using a TetON yfp construct (tetR::PtetA::yfp) fused to a mutated PtetA::mCherry. Specifically, we mutated the two tet operator sites within PtetA at the M3 or M6 positions to reverse TetR binding to these sites (52, 53). Although these mutations were predicted to reverse TetR binding, unfortunately we found TetR could no longer bind the M3 or M6 mutated PtetA, which instead resulted in constitutive mCherry expression. As the low concentrations of tetracyclines appeared to diffuse evenly in host tissues, we didn’t pursue other routes of generating a dual system.
It is also possible that NO stress is such a transient occurrence within host tissues, that this doesn’t have prolonged effects on cell division rates, thus making it very difficult to capture growth-arrested cells. This was recently shown with a slow-folding fluorescent protein derivative, DsRed42, where NO stress was sufficient to promote fluorescence accumulation, but there was limited overlap in slow-growing and NO-stressed populations within host tissues (16). Destabilized and stable versions of fluorescent proteins were used here to show that NO stress was transient within host tissues, and that few bacteria were actively responding and detoxifying NO at any given timepoint (16). However, the fact that Hmp+ bacteria preferentially survive doxycycline treatment suggests that, while NO exposure may be transient, there may also be a long-term impact and sustained changes within cells exposed to high levels of NO (22). Although Yersinia repairs itself in response to this stress (49), there may be long-term damage, or even genetic changes that occur in response to NO. It would be very interesting to determine if genetic changes occur within microcolonies over the course of infection, especially given these bacterial populations are clonal, founded by single bacterium, and presumed to be genetically homogenous (17).
Materials and Methods
Bacterial strains and growth conditions
Y. pseudotuberculosis IP2666 was used as the wild-type strain throughout. For in vitro experiments, overnight cultures were grown in LB at 26°C with rotation for 16 hours. Exponential phase cultures were sub-cultured at 1:100 into LB, and grown at 37°C with rotation for 2 hours in preparation for experiments. For all mouse infections, bacterial inocula were grown overnight (16 hours) to post-exponential phase in 2xYT broth (LB, with 2x concentration of yeast extract and tryptone) at 26°C with rotation.
revTetR reporter construction
The revTetR reporter was generated by introducing specific point mutations into our previously described tetR::PtetA::mCherry reporter construct in pMMB67EH (22). tetR was mutated by site-directed mutagenesis at two sites, E15A (GAG→GCU) and L17G (CUU→GGU), using 4 point mutations to generate the revTetR construct. An additional L25V mutation could not be successfully introduced. Primers were designed that contained the desired mutations, and were used to PCR amplify around the pMMB67EH plasmid using PfuUltra II high-fidelity polymerase (Agilent). PCR products were purified (QIAGEN) and transformed into electrocompetent DH5αλpir E. coli. Colonies were screened based on mCherry fluorescence in the absence of tetracyclines, plasmids were then isolated using the PureYield Plasmid Midiprep kit (Promega), and sequenced to confirm mutations. revtetR::PtetA::mCherry plasmids were transformed into Y. pseudotuberculosis strains as previously described (54), to generate the following reporter strains: revtetR::PtetA::mCherry Pdps::gfp-ssrA, revtetR::PtetA::mCherry gfp+, and revtetR::PtetA::mCherry Phmp::gfp. Pdps::gfp-ssrA, gfp+, and Phmp::gfp reporter constructs have been previously described (16), and are all inserted into the pACYC184 plasmid.
In vitro reporter characterization
Once subcultures reached exponential phase (2h growth), the indicated doses of doxycycline (Dox; 0.01 µg/mL, 0.1 µg/mL, or 1 µg/mL) or anhydrotetracycline (ATc; 0.1 µg/mL, 1 µg/mL, or 2 µg/mL) were added to samples to promote mCherry dilution, with one sample left untreated as a control. Samples were incubated at 37°C with rotation throughout the time course, and time points of 0, 0.5, 1, 2, 3, and 4h post-antibiotic treatment were taken. For each time point, 600 µL from each sample was pelleted and resuspended in 600 µL of PBS. 200 µL of each sample was then pipetted into 3 wells of a black walled, clear bottom 96 well plate, and analyzed using a Synergy Microplate Reader (Biotek Instruments) for OD600 and fluorescence signal measurements. Optical density (A600nm) was used to approximate cell number, and mCherry fluorescence was detected with 560nm excitation/610nm emission. All experiments were repeated in triplicate to generate a total of three independent data sets, or nine replicates. In strains of Yptb also containing a GFP reporter, GFP fluorescence was detected with 480nm excitation/520nm emission.
Induction of hmp using nitric oxide donor compound
Diluted subcultures were prepared as described above, and after 1h subculture, were either treated with the nitric oxide donor compound DETA-NONOate (2.5 mM dose), or were left untreated. After another hour of incubation, each culture was evenly split into two separate tubes. Samples were then further treated with either ATc (1 µg/mL dose) or left untreated, for a total of four different treatment groups: +NO/+ATc, +NO/-ATc, -NO/+ATc, -NO/-ATc. OD and fluorescence of each sample were measured every 2h as described above. Cells were also prepared for fluorescence microscopy at every time point, as described below.
Fluorescence microscopy: bacteria
To visualize individual bacterial cells, 500 µL from each sample was pelleted, resuspended in 4% paraformaldehyde (PFA), and incubated overnight at 4° C for fixation. Agarose pads were prepared by placing two pieces of tape approximately 1 cm apart on slides, pipetting 25 µL of 1% agarose in PBS, and placing a glass coverslip over the area. After leaving the agarose to solidify for 20 min, the coverslips and tape were peeled off and the agarose was trimmed to 1 cm2 squares. PFA-fixed bacteria were pelleted, resuspended in 50 µL PBS, and 5 µL of sample was pipetted onto each agarose pad. Bacteria were imaged with the 63x oil immersion objective, using a Zeiss Axio Observer.Z1 (Zeiss) fluorescent microscope with Colibri.2 LED light source and an ORCA-R2 digital CCD camera (Hamamatsu). Five images were taken of each sample in distinct fields of view, using DIC, GFP, and mCherry channels. Volocity image analysis software was used to specifically select individual bacterial cells and quantify the fluorescent signal associated with each cell.
Murine model of systemic infection
The following strains were used for mouse infections: Y. pseudotuberculosis tetR::PtetA::mCherry-ssrA gfp+ (22), revtetR::PtetA::mCherry gfp+, and revtetR::PtetA::mCherry Phmp::gfp. Six to eight week old female C57BL/6 mice were obtained from Jackson Laboratories (Bar Harbor, ME). All animal studies were approved by the Institutional Animal Care and Use Committee of Johns Hopkins University. Mice were injected intravenously with 103 bacteria for all experiments. After 48 hours, mice were treated with the indicated dose (4mg/kg, equates to approximately 72µg in 100µl sterile PBS) of Dox or ATc. At the indicated timepoints, either 4h or 24h post-treatment, mice were euthanized via both lethal dose of isoflurane and cervical dislocation, and spleens were removed, halved, and processed for histology, or homogenized to quantify CFUs.
Histology
Harvested spleen halves were fixed in 4% PFA overnight at 4° C, and were embedded using Sub Xero OCT compound (Mercedes Medical), frozen on dry ice, and stored at −80°C. Spleens were cross-sectioned into 10 um sections using a cryostat microtome; one representative section was imaged per mouse. To visualize reporters, sections were thawed in PBS, stained with Hoechst at a 1:10,000 dilution, washed in PBS, and coverslips were mounted using ProLong Gold (Life Technologies). Images were taken of all microcolonies within each section with a 63x oil immersion objective, using a Zeiss Axio Observer.Z1 (Zeiss) fluorescent microscope with Colibri.2 LED light source, an Apotome.2 (Zeiss) for optical sectioning, and an ORCA-R2 digital CCD camera (Hamamatsu).
Image analysis
For in vitro experiments, Volocity image analysis software was used to identify single bacterial cells in each image taken, and to determine the total fluorescence intensity level in each bacterium for both mCherry and GFP. For in vivo experiments, Fiji image analysis software was used to quantify the signal intensity of each channel at the centroid and periphery of each microcolony, to generate relative signal intensities of fluorescent reporters. This was done by selecting a small representative area (0.01pixels2) at the centroid and periphery of each microcolony. Centroid bacteria were defined as being surrounded only by other bacteria. Peripheral bacteria were defined as being in contact with host cells (Figure 5D). All data was analyzed and graphed, and all statistical analyses performed, using GraphPad Prism 9.
Author Contributions
Conceptualization: BL, RKD, KMD; Formal Analysis: BL, KMD; Funding Acquisition and Supervision: KMD; Investigation: BL, RKD, KMD; Methodology: BL, KMD; Writing – Original Draft Preparation: BL, KMD; Writing – Review & Editing: BL, RKD, KMD.
Figure Legends

Cultures of the revTetR Phmp::gfp strain were cultured one hour in the presence of NO (+NO treatment), then split, and either treated with 1µg/ml ATc (+ATc) or left untreated (-ATc). Aliquots of cells were fixed at the indicated timepoints after ATc addition for fluorescence microscopy. Single cell fold change in GFP signal with NO treatment is shown, compared to untreated cells. Dotted line at a value of 1 is the mean GFP signal from individual untreated cells. Median value/group is highlighted.
Acknowledgments
We thank the members of the Davis lab, who provided feedback and suggestions during the final steps of manuscript preparation. The authors of this manuscript declare no conflicts of interest. This work was supported by a NIAID K22 Career Transition Award (1K22AI123465-01).
References


