

ABSTRACT
Intracellular signaling regulators can be concentrated into membrane-free, higher-ordered protein assemblies to initiate protective responses during stress — a process known as phase transition. Here, we show that a phase transition of the C. elegans Toll/interleukin-1 receptor domain protein (TIR-1), a homolog of the mammalian sterile alpha and TIR motif-containing 1 (SARM1), primes host immune defenses when dietary sterols are limited to handle subsequent bacterial infection. TIR-1/SARM1 is an upstream component of the p38 PMK-1 pathway in intestinal cells, an innate immune defense and stress response pathway in metazoans. Under conditions of low cholesterol availability, multimerization and precipitation of TIR-1/SARM1 potentiates the intrinsic NAD+ glycohydrolase activity of this protein complex, increases p38 PMK-1 phosphorylation, and promotes pathogen clearance from the intestine. Dietary cholesterol is required for C. elegans to survive infection with pathogenic bacteria and to support development, fecundity, and lifespan. Thus, activation of the p38 PMK-1 pathway in sterol-deficient animals is an adaptive response that allows a metazoan host to anticipate environmental threats under conditions of essential metabolite scarcity.
SIGNIFICANCE STATEMENT The nematode C. elegans must consume dietary sterols to support growth and reproduction. However, access to dietary sterols in its natural habitat is not guaranteed and thus, nematodes have evolved mechanisms to promote survival in sterol-poor environments. Here, we demonstrate that activation of the p38 PMK-1 innate immune pathway in response to low sterol availability promotes clearance of a bacterial pathogen from the intestine. Pre-emptive activation of innate immune defenses occurs through a phase transition of TIR-1/SARM1, an upstream component of the p38 PMK-1 pathway, which activates its intrinsic NAD+ glycohydrolase activity. Thus, nematodes anticipate threats from infectious pathogens during a time when the animal is relatively susceptible to infection.
INTRODUCTION
Access to essential dietary metabolites alters the life history traits of metazoans. For example, Caenorhabditis elegans lack the ability to synthesize cholesterol de novo and must acquire dietary sterols from its environment to support development, fecundity, lifespan, and resistance against pathogen infection (1–7). C. elegans larvae that encounter sterol-scarce environments are primed to enter an alternative developmental program, called dauer diapause, which promotes animal survival, in part, by altering their metabolism and growth to conserve energy (8–12). Interestingly, only a fraction of sterol-starved C. elegans larvae enter dauer diapause and the remaining animals develop to adulthood (10, 13). Thus, C. elegans that do not enter dauer diapause must adapt during sterol scarcity to develop and reproduce.
The p38 mitogen-activated protein kinase (MAPK) pathway is a key regulator of stress responses and innate immune defenses in metazoans. The C. elegans p38 homolog PMK-1 is part of a classic MAPK signaling cascade that is activated by the MAPKKK NSY-1 and MAPKK SEK-1, which are the nematode homologs of mammalian ASK and MKK3/6, respectively (14). C. elegans Toll/interleukin-1 receptor domain protein (TIR-1), which is homologous to mammalian sterile alpha and TIR motif-containing 1 (SARM1), acts upstream of NSY-1 to control p38 PMK-1 activation (15, 16). As in mammals, the C. elegans p38 PMK-1 pathway regulates the expression of secreted innate immune effectors and is required for survival during pathogen infection (14, 17–19). However, the mechanisms that activate the NSY-1/SEK-1/p38 PMK-1 signaling cassette in C. elegans intestinal epithelial cells are poorly defined.
Intracellular signaling regulators can be compartmentalized in membrane-less, higher-ordered protein assemblies with liquid droplet-like properties (20–26). Cytoplasmic de-mixing or phase transition of proteins in this manner concentrates signaling regulators to facilitate rapid and specific activation of protective defenses during stress (20, 21, 27). Here, we show that TIR-1/SARM1 undergoes a phase transition to potentiate its intrinsic NAD+ glycohydrolase activity and activate innate immune defenses in intestinal epithelial cells via the p38 PMK-1 pathway. By promoting aggregation of TIR-1/SARM1 with macromolecular crowding agents in vitro, we demonstrate that a phase transition of TIR-1/SARM1 is required for its catalytic activity. Accordingly, TIR-1/SARM1 containing mutations that specifically either prevent the phase transition or impair NAD+ hydrolysis have decreased enzymatic activity in vitro and are unable to activate the p38 PMK-1 pathway in vivo. Importantly, we show that limiting dietary sterols primes p38 PMK-1 immune defenses, in a manner dependent on a phase transition of TIR-1/SARM1, to promote clearance of a bacterial pathogen from the intestine. Availability of dietary cholesterol is required for C. elegans to survive infection with pathogenic bacteria (6). Thus, activation of the p38 PMK-1 pathway through a TIR-1/SARM1 phase transition during conditions of sterol scarcity is an adaptive response in animals that fail to enter dauer diapause. Immune activation, in this manner, primes host immune defenses to promote clearance of a bacterial pathogen from the intestine during a period of relative vulnerability to infection.
RESULTS
Cholesterol scarcity activates intestinal innate immune defenses
C. elegans are sterol auxotrophs and require dietary cholesterol for development, lifespan, fecundity, and resistance to pathogen infection (1–7). As such, 5 μg/mL of cholesterol is a standard additive in C. elegans laboratory growth medium (28). We found that C. elegans grown in the absence of cholesterol supplementation activated GFP-based transcriptional reporters for two putative immune effector genes, T24B8.5p::gfp and irg-5p::gfp (Fig. 1A and B). T24B8.5 and irg-5 are expressed in the intestine, induced during infection with multiple pathogens—including Pseudomonas aeruginosa, and controlled by the p38 PMK-1 innate immune pathway (17, 29, 30). qRT-PCR studies confirmed that C. elegans in a low cholesterol environment upregulate T24B8.5 and irg-5, as well as other innate immune effector genes (irg-4 and K08D8.4) (Fig. 1C). These data suggest that host defense pathways are activated in the absence of pathogen infection when environmental sterols are scarce.

Images of T24B8.5p::gfp (A) and irg-5p::GFP (B) transcriptional immune reporters in wild-type animals growing on standard nematode growth media (+5 μg/mL cholesterol) and in the absence of supplemented cholesterol (+0 μg/mL cholesterol). (C) qRT-PCR data of the indicated innate immune effector genes in wild-type C. elegans growing in the presence (+5 μg/mL) and absence (+0 μg/mL) of supplemented cholesterol. * equals p<0.05 (unpaired t-test). (D) Data from an mRNA-seq experiment comparing genes differentially regulated in uninfected nhr-8(hd117) mutants versus wild-type animals (y-axis) are compared with genes differentially expressed in wild-type animals during P. aeruginosa infection (x-axis). All genes are shown in gray. Genes that are differentially expressed in both datasets are shown in black (Fold change > 2, q<0.01). Genes that are annotated as innate immune genes are shown in red. The location of the representative genes T24B8.5, irg-5, irg-4, and K08D8.4, whose expression is examined throughout this manuscript are shown. See also Table S1. (E, F, G) Images of T24B8.5p::gfp animals of the indicted genotypes, grown under the indicated conditions are shown. In Fig. 1G, C. elegans were grown on media solidified with agarose, rather than agar. (H, I, J, K) qRT-PCR data of the indicated genes in wild-type and nhr-8(hd117) mutant animals grown on standard nematode growth media (+5 μg/mL cholesterol) in the presence or absence of 0.1% Tergitol, as indicated. For the qRT-PCR studies in Fig. 1C, 1H, 1I, 1J, and 1K, data are the average of three independent biological replicates, each normalized to a control gene with error bars representing SEM, and are presented as the value relative to the average expression from all replicates of the indicated gene in wild-type animals on standard nematode growth media (+5 μg/mL cholesterol). * equals p<0.05 (two-way ANOVA with Tukey multiple comparison testing). (L, M) C. elegans pathogenesis assay with P. aeruginosa and C. elegans of indicated genotypes at the L4 larval stage is shown and exposed to the indicated conditions. Data are representative of three trials. The Kaplan-Meier method was used to estimate the survival curves for each group, and the log rank test was used for all statistical comparisons. Sample sizes, mean lifespan and p-values for all trials are shown in Table S2. (N) P. aeruginosa, isolated from the intestines of animals with the indicated genotypes, were quantified after 24 hours of bacterial infection. Data are colony forming units (CFU) of P. aeruginosa and are presented as the average of 10 separate biological replicates with each replicate containing 10-11 animals. * equals p<0.05 (unpaired t-test). Scale bars in all images equals 200 μm. See also Fig. S1.
The nuclear hormone receptor, NHR-8, a homolog of mammalian liver X receptor (LXR) and pregnane X receptor (PXR), is required for the transport, distribution, and metabolism of cholesterol in C. elegans (13, 31). We used two previously characterized nhr-8 loss-of-function mutant strains as genetic tools to study conditions of low sterol content: hd117, which contains a 570 base pair deletion that removes the entire first exon (13), including the start codon, and ok186, a strain that contains a 1366 base pair deletion that removes most of the ligand-binding domain (31). The nhr-8(hd117) loss-of-function mutant has lower total cholesterol levels and is unable to develop under conditions of cholesterol deprivation (13). Interestingly, both nhr-8(hd117) and nhr-8(ok186) animals grown under standard conditions (i.e., in the presence of 5 μg/mL cholesterol) induce a transcriptional response, which mimics wild-type C. elegans infected with the bacterial pathogen P. aeruginosa (Fig. 1D and S1A). RNA-sequencing (RNA-seq) revealed that the differentially expressed genes in uninfected nhr-8(hd117) (Fig. 1D and Table S1) and nhr-8(ok186) (Fig. S1A and Table S1) mutants (each versus wild-type animals) significantly correlated with genes that are differentially expressed in wild-type animals during infection with P. aeruginosa (r = 0.311 and r = 0.370, respectively). These correlations increase when comparing only the genes whose transcription are significantly differentially regulated (r = 0.763 and r = 0.849, respectively) and those genes that are also involved in innate immunity (r = 0.677 and r = 0.703, respectively) (Fig. 1D and S1A). Among the immune effectors that are upregulated in nhr-8(hd117) and nhr-8(ok186) mutants are T24B8.5, irg-4, irg-5, and K08D8.4, the same genes whose transcription are also induced during cholesterol deprivation (Fig. 1C, 1D and S1A).
Two different supplementation experiments using the T24B8.5p::gfp immune reporter demonstrated that immune effector activation in nhr-8(hd117) mutants is due to sterol deficiency in these animals. First, supplementation of exogenous cholesterol at an increased concentration (80 μg/mL) fully suppressed T24B8.5p::gfp activation in the nhr-8(hd117) mutant (Fig 1E). Second, supplementation with the non-ionic detergents Tergitol or Triton X-100, which solubilize hydrophobic, amphipathic compounds, including sterols, suppressed T24B8.5p::gfp activation in nhr-8(hd117) animals, in a manner that was dependent on the presence of added cholesterol in the growth media (Fig. 1F-G and S1B). Nematode growth media without supplemented cholesterol is not entirely devoid of sterols, owing to sterol contamination from agar. However, growth media solidified with agarose, rather than agar, contains markedly fewer contaminating sterols (2, 10, 13). Interestingly, on agarose, the addition of Tergitol to the growth media suppressed T24B8.5p::gfp activation in the nhr-8(hd117) mutant, but only in the presence of 5 μg/mL of cholesterol (Fig. 1G). These data establish that solubilization of cholesterol by Tergitol in standard nematode growth media suppresses immune activation in the nhr-8(hd117) mutant background. Suppression of T24B8.5p::gfp activation in the nhr-8(hd117) background by Tergitol and Triton X-100 was dose-dependent (Fig. S1B). Supporting these findings, Tergitol suppressed activation of the immune effector genes T24B8.5, irg-4, irg-5 and K08D8.4 in the nhr-8(hd117) animals as measured by qRT-PCR (Fig. 1H-K). Of note, activation of immune defenses in nhr-8(hd117) animals is specific to cholesterol deprivation in this genetic background, as supplementation with individual unsaturated, mono- and polyunsaturated fatty acids, which are also mis-regulated in the nhr-8(hd117) mutant background (13), failed to suppress activation of T24B8.5p::gfp (Fig. S1C). Together, these data demonstrate that cholesterol deprivation in the nhr-8(hd117) mutant activates immune effector transcription independent of bacterial infection.
C. elegans raised on media without supplemented cholesterol are hypersusceptible to killing by P. aeruginosa, as are nhr-8(hd117) mutants on media with standard cholesterol supplementation (5 μg/mL) (6). We found that 80 μg/mL of cholesterol fully complemented the enhanced susceptibility of nhr-8(hd117) mutants to P. aeruginosa infection (Fig. 1L). In addition, solubilizing cholesterol in nematode growth media containing 5 μg/mL of added cholesterol with two different detergents restored pathogen resistance to the nhr-8(hd117) mutant (Fig. 1M). Consistent with a prior report, we found that nhr-8 is required in the intestine for resistance to pathogen infection (6). Knockdown of nhr-8 only in intestinal epithelial cells enhanced the susceptibility of C. elegans to pathogen infection (Fig. S1D). In addition, expression of nhr-8 either under the control of its own promoter (Fig. S1E) or under the control of a promoter (ges-1) that drives expression specifically in intestinal epithelial cells complemented the pathogen susceptibility of nhr-8(hd117) animals (Fig. S1F). We showed that expression of nhr-8 only in neurons, under the control of the sng-1 promoter, failed to rescue the susceptibility of nhr-8(hd117) animals to P. aeruginosa infection (Fig. S1G). Taken together, these data demonstrate that defects in cholesterol metabolism in intestinal epithelial cells specifically causes C. elegans to be more susceptible to killing by a bacterial pathogen.
Importantly, the robust transcriptional induction of immune effectors observed in the nhr-8(hd117) mutant (Fig. 1A-B and 1D) promotes clearance of P. aeruginosa from the intestine even though these mutant animals are more susceptible to pathogen killing (Fig. 1N). These data suggest that C. elegans activates host immune defenses when environmental sterols are limited to anticipate subsequent lethal challenges from bacterial pathogens.
Cholesterol scarcity activates the p38 PMK-1 innate immune pathway
C. elegans propagated in the absence of cholesterol engage the transcription of genes that are targets of the p38 PMK-1 innate immune pathway (Fig. 1C). Consistent with this observation, the levels of active, phosphorylated PMK-1 were higher in wild-type animals grown on media without supplemented cholesterol than in animals grown under standard culture conditions (i.e., with 5 μg/mL cholesterol), as assessed by immunoblotting with antibodies that detect the doubly phosphorylated TGY motif of PMK-1 (active PMK-1) and the total PMK-1 protein (32) (Fig. 2A and B). These data demonstrate that cholesterol deprivation activates p38 PMK-1.

(A) An immunoblot analysis of lysates from wild-type C. elegans grown on standard nematode growth media in the presence (+5 μg/mL cholesterol) and in the absence (+0 μg/mL cholesterol) of supplemented cholesterol using antibodies that recognize the doubly phosphorylated TGY motif of PMK-1 (phospho-PMK-1), total PMK-1 protein (total PMK-1) and tubulin (α-tubulin) is shown. PMK-1 is a 43.9 kDa protein and tubulin is a 50 kDa protein. (B) The band intensities of four biological replicates of the Western blot shown in Fig. 2A were quantified. * equals p<0.05 (unpaired t-test) (C) Gene set enrichment analysis (GSEA) of p38 PMK-1 targets in the mRNA-seq experiment. Fold change in expression of significantly differentially expressed genes (fold-change > 2 and q<0.01) in nhr-8(hd117) mutants vs. wild-type (in the absence of pathogen infection) are ranked from higher expression (red) to lower expression (blue) in the nhr-8(hd117) mutant. Normalized enrichment score (NES) and q-value are indicated. p38 PMK-1 targets found in the transcriptional profile are indicated by hit number (112) in the left margin and black lines. (D, E) Western blot experiment and quantification of four biological replicate experiments as described in Fig. 2A. and Fig. 2B with the strains of the indicated genotypes. In Fig. 2A. and Fig. 2D, pmk-1(km25) and nsy-1(ag3) and loss-of-function mutants are the controls, which confirm specificity of phospho-PMK-1 and total PMK-1 probing. * equals p<0.05 (one-way ANOVA with Dunnett multiple comparison testing). (F) Images of T24B8.5p::gfp transcriptional immune reporter animals in wild-type animals and nhr-8(hd117) mutants growing on control RNAi, tir-1(RNAi) or atf-7(RNAi) bacteria, as indicated. (G, H, I, J) qRT-PCR data of the indicated genes in the indicated mutant animals grown on standard nematode growth media (+5 μg/mL cholesterol). Data are the average of three to seven independent replicates, each normalized to a control gene with error bars representing SEM and are presented as the value relative to the average expression from all replicates of the indicated gene in wild-type animals. * equals p<0.05 (one-way ANOVA with Dunnett multiple comparison testing) (K) Images of T24B8.5p::gfp transcriptional immune reporter animals of the indicated genotypes growing in the presence or absence of 0.1% Tergitol. Scale bars in all images equals 200 μm. See also Fig. S2.
The p38 PMK-1 pathway is also activated in nhr-8 loss-of-function mutants. A gene set enrichment analysis of the nhr-8(hd117) and nhr-8(ok186) transcriptome profiling experiments revealed that the transcriptional targets of the p38 PMK-1 innate immune pathway were strongly enriched among the genes upregulated in each nhr-8 mutant (Fig. 2C and S2A), including the immune effectors T24B8.5, irg-4, irg-5, and K08D8.4. Consistent with these data, the nhr-8(hd117) and nhr-8(ok186) mutants had an increased ratio of phosphorylated PMK-1 relative to total PMK-1 compared to wild-type controls (Fig. 2D and 2E). In addition, RNAi-mediated knockdown of tir-1, the most upstream component of the p38 signaling cassette (15, 16), fully suppressed hyperactivation of T24B8.5p::gfp in nhr-8(hd117) animals (Fig. 2F). Consistent with these data, the tir-1(qd4) loss-of-function mutation completely suppressed the induction of T24B8.5, irg-4, irg-5, and K08D8.4 in the nhr-8(hd117) background (Fig. 2G-J). The transcription factors ATF-7 and SKN-1 link PMK-1 activity to its transcriptional outputs (33, 34). In nhr-8(hd117) animals, knockdown of atf-7, but not skn-1, abrogated T24B8.5p::gfp activation (Fig. 2F and S2B). Finally, to further support our observation that cholesterol scarcity induces immune defenses upstream of p38 PMK-1, we used the MAPK phosphatase vhp-1, a negative regulator of PMK-1 (35). Solubilization of cholesterol with Tergitol was unable to suppress activation of T24B8.5p::gfp induced by knockdown of vhp-1 (Fig. 2K). Thus, the TIR-1-p38 PMK-1-ATF-7 signaling axis is activated in the nhr-8 mutant background.
The c-JUN N-terminal kinase MAPK homolog kgb-1, the insulin signaling pathway forkhead box O family (FOXO) transcription factor, daf-16, and the G protein-coupled receptor (GPCR), fshr-1, each function in parallel to the p38 PMK-1 pathway to regulate immune and stress responses in C. elegans (17, 35–37). However, knockdown of each of these genes in nhr-8(hd117) animals failed to suppress T24B8.5p::gfp activation (Fig. S2B) and RNAi-mediated knockdown of nhr-8 did not induce nuclear localization of DAF-16::GFP (Fig. S2C). Thus, cholesterol scarcity induces C. elegans innate immune responses through specific activation of p38 PMK-1 immune pathway signaling.
Activation of the p38 PMK-1 pathway by cholesterol deprivation requires TIR-1 oligomerization and NAD+ glycohydrolase activity
C. elegans TIR-1, which is homologous to mammalian SARM1, functions upstream of the MAPKKK NSY-1; MAPKK SEK-1; MAPK p38 PMK-1 signaling cassette in the intestine to control innate immune defenses (15, 38). Accordingly, tir-1 loss-of-function mutants are more susceptible to killing by P. aeruginosa than wild-type animals (15). The TIR-1 protein has three characterized domains: a Heat/Armadillo repeat domain, a sterile alpha motif (SAM) domain, and a Toll-interleukin receptor (TIR) domain (38) (Fig. 3A). C. elegans TIR-1 oligomerizes in vitro through interactions of its SAM domains (39). In addition, oligomerization of SARM1 is essential for its function in plants and mice (39, 40). As such, we examined if oligomerization of C. elegans TIR-1 is required to activate the p38 PMK-1 immune pathway in the intestine. We used CRISPR-Cas9 to delete both SAM domains in tir-1 (tir-1ΔSAM) (Fig. 3A). We also generated point mutants in two residues within the C. elegans TIR domain that are important for the self-association and activity of mammalian SARM1 (C. elegans tir-1G747P and tir-1H833A) (39) (Fig. 3A). Interestingly, the C. elegans tir-1ΔSAM, tir-1G747P and tir-1H833A mutants prevented activation of the p38 PMK-1-dependent immune reporter T24B8.5p::gfp in nhr-8(RNAi) animals (Fig. 3B). Importantly, induction of T24B8.5p::gfp during cholesterol scarcity was also absent in these mutants (Fig. 3C). Consistent with these data, the tir-1ΔSAM, tir-1G747P and tir-1H833A mutants have reduced levels of active, phosphorylated p38 PMK-1, equivalent to the tir-1(qd4) null allele (29) (Fig. 3D and E). Additionally, they abrogate the induction of the T24B8.5 (Fig. 3F) and irg-4 (Fig. S3A) immune effectors in nhr-8(RNAi) animals and are each markedly hypersusceptible to P. aeruginosa infection (Fig. 3G).

(A) Model of tir-1 showing the domains and the mutations that were introduced using CRISPR-Cas9. (B, C) Expression of the innate immune effector T24B8.5p::gfp in tir-1 mutants with predicted defects in oligomerization (tir-1ΔSAM, tir-1G747P and tir-1H833A) and NADase catalytic activity (tir-1E788A) in the indicated genetic backgrounds and conditions. Scale bars in all images equals 200 μm. (D) Immunoblot analysis of lysates from the indicated genotypes probed with antibodies targeting the doubly phosphorylated TGY epitope in phosphorylated PMK-1 (phos-PMK-1), total PMK-1, and tubulin. nsy-1(ag3) and pmk-1(km25) loss-of-function mutants are the controls, which confirm the specificity of the phospho-PMK-1 probing. (E) The band intensities of three biological replicates of the Western blot shown in (D) were quantified. * equals p<0.05 (one-way ANOVA with Dunnett multiple comparison testing). (F) qRT-PCR data of T24B8.5 in wild-type and mutant animals of the indicated genotypes grown on standard nematode growth media (+5 μg/mL cholesterol). Data are the average of three independent replicates, each normalized to a control gene with error bars representing SEM and are presented as the value relative to the average expression from all replicates in wild-type animals. * equals p<0.05 (two-way ANOVA with Tukey multiple comparison testing). (G) C. elegans pathogenesis assay with P. aeruginosa and C. elegans of indicated genotypes at the L4 larval stage are shown. Data are representative of three trials. The Kaplan-Meier method was used to estimate the survival curves for each group, and the log rank test was used for all statistical comparisons. Sample sizes, mean lifespan and p-values for all trials are shown in Table S2. See also Fig. S3.
The TIR domain of C. elegans TIR-1 and its mammalian homolog SARM1 possess intrinsic NADase activity (39, 41, 42). Importantly, oligomerization of mammalian SARM1 and C. elegans TIR-1 is required for maximal NADase activity in vitro (39). The NADase activity in the TIR domain of mammalian SARM1 requires a putative catalytic glutamate residue (42). We used CRISPR-Cas9 to mutate the homologous catalytic glutamate residue in C. elegans tir-1 (tir-1E788A) and found that it was required for the immunostimulatory activity of tir-1. tir-1E788A mutants were unable to induce T24B8.5p::gfp both following knockdown of nhr-8 (Fig. 3B) and also during cholesterol scarcity (Fig. 3C). Likewise, the tir-1E788A mutant animals had less active, phosphorylated p38 PMK-1 (Fig. 3D and E), completely suppressed the induction of T24B8.5 (Fig. 3F) and irg-4 (Fig. S3A), and were more susceptible to P. aeruginosa infection (Fig. 3G). We confirmed that the tir-1E788A, tir-1ΔSAM, tir-1G747P and tir-1H833A mutants are translated and not degraded by introducing a 3X FLAG tag at the C-terminus of each of these mutants using CRISPR-Cas9 (Fig. S3B and C). A western blot with an anti-FLAG antibody yielded a band of the expected size for each of the tir-1 mutants (Fig. S3B). Collectively, these data provide genetic evidence that oligomerization of TIR-1 and its intrinsic NADase activity are required to activate the p38 PMK-1 innate immune pathway.
The NAD+ glycohydrolase activity of TIR-1/SARM1 is activated by a phase transition
To characterize further the mechanism of TIR-1/SARM1 activation, we recombinantly expressed and purified from E. coli the TIR domain of the TIR-1 protein (called TIR) and evaluated its NADase activity in vitro using an etheno-NAD+ (ε-NAD) activity assay, in which hydrolysis of the nicotinamide ring of ε-NAD leads to an increase in fluorescence. Interestingly, purified TIR only shows very modest NADase activity even at high protein concentrations (>15 μM) (Fig. 4A). Notably, the NADase activity of TIR increased parabolically with increasing TIR concentrations rather than linearly, suggesting that multimerization of TIR-1 potentiates its NADase activity (Fig. 4A).

(A) NADase activity of purified TIR at increasing TIR protein concentrations is shown. Activity was assessed by incubating TIR protein with 1 mM ε-NAD and monitoring the rate at which the fluorescent product ε-ADPR was produced. Curve represents a nonlinear regression fit of the NADase activity data points (n=2). (B) NADase activity of 2.5 μM TIR incubated in the presence of 25% (w/v) of macro- (PEG 8000, PEG 3350 and dextran) and micro- (sucrose and glycerol) viscogens was assessed as described in Fig. 4A (n=2). (C) Dose dependency of macroviscogens on the NADase activity of TIR is shown. 2.5 μM TIR protein was incubated with the indicated PEG compound at concentrations from 0-30% (w/v). NADase activity was assessed as described in Fig. 4A (n=2). (D) Steady-state kinetic analysis of 2.5 µM TIR incubated in 0-30% (w/v) of PEG 3350 with the ε-NAD substrate provided at concentrations from 0-4000 μM was assessed as described in Fig. 4A. (n=2). From the steady-state kinetic analysis performed in Fig. 4D, Km (E), kcat (F), and kcat/Km (G) were determined at each PEG 3350 concentration. (H) SDS-PAGE analysis of TIR protein fractions incubated with increasing concentrations of PEG 3350 before [precentrifugation (C)] and after centrifugation, the soluble (S) and pellet (P) protein fractions. NADase activity of TIR protein in each fraction and at each concentration of PEG 3350 was assessed, as described in Fig. 4A and is represented below the gel image (n=2, representative image shown). (I) Steady-state kinetic analysis of TIR wild-type, oligomerization mutant (TIRG747P), and catalytic mutants (TIRE788Q and TIRE788A) in 25% PEG 3350 assessed with 0-2000 μM ε-NAD was assessed as described in Fig. 4D. Kinetic parameters (Km, kcat and kcat/Km) are shown in the table below the graph (n=3). (J, K) SDS-PAGE analysis of TIR: wild-type, oligomerization mutant (TIRG747P) and catalytic mutants (TIRE788Q and TIRE788A), precipitation in the presence of 25% PEG 3350. Gel represents the soluble (S) and pellet (P) protein fractions of wild-type and mutant TIR following incubation with PEG 3350 and centrifugation. TIRG747P and TIRE788Q were assessed with 10 μM protein in Fig. 4J and TIRE788A was assessed with 3 μM protein in Fig. 4K. Quantification of replicates represented below gel images (n=4, representative images shown). * equals p<0.05 by one-way ANOVA in Fig. 4J and unpaired t-test in Fig. 4K. See also Fig. S4.
Given that high concentrations of TIR are required to observe NADase activity, we hypothesized that molecular crowding might activate the enzyme and therefore assessed the effect of several macro- and microviscogens on TIR activity. Macroviscogens reduce the free volume available for protein movement and thus promote aggregation of protein complexes that are capable of self-association (43, 44). Importantly, macroviscogens have minimal impact on the rate of diffusion of small molecules. By contrast, microviscogens, which are much smaller than most enzymes, affect the diffusion of substrates in solution and thus, the frequency at which enzymes encounter their substrate (44). Interestingly, macroviscogens (polyethylene glycol [PEG] 3350 and PEG 8000), but not microviscogens (sucrose or glycerol), dramatically increased the NADase activity of TIR (Fig. 4B). PEGs 3350 and 8000 increase TIR activity in a concentration-dependent manner (Fig. 4C). These effects were most pronounced with higher molecular weight PEGs as treatment with smaller molecular weight PEGs (e.g., PEG 1500 and PEG 400) or dextran did not increase the enzymatic activity of TIR (Fig. 4C). Crowding agents also increase the activity of the TIR domain of human SARM1, as well as plant TIR domains (39, 45), suggesting that the mechanism of TIR regulation is strongly conserved.
Treatment with macroviscogens enabled the characterization of the enzyme kinetics of TIR. Incubation with 25% PEG 3350 markedly enhances TIR activity at each enzyme concentration (Fig. S4A). Consequently, lower amounts of enzyme (2.5 μM TIR) can be used to obtain robust kinetic data. Using these conditions, we determined the steady-state kinetic parameters (kcat, KM, and kcat/KM) with 2.5 μM TIR in the presence of increasing concentrations of PEG 3350 (Fig. 4D). The Km of TIR increases and then decreases to level off at ∼500 μM of ε- NAD with increasing concentration of PEG 3350 (Fig. 4E). On the other hand, kcat increases near linearly with increasing concentrations of PEG 3350 (Fig. 4F). In addition, the catalytic efficiency (kcat/Km) followed the same trend as kcat, indicating that increased TIR activity is due to increased substrate turnover by the enzyme and not tighter substrate binding (Fig. 4G).
We found that the NAD hydrolase activity of TIR is also activated by the precipitant sodium citrate, providing an orthologous method to characterize the enzymatic activity of the TIR domain (Fig. S4A and B). Notably, the response to increasing citrate concentration was switch-like, where a concentration of at least 250 mM sodium citrate was needed to observe enzyme activity (Fig. S4B and S4C). By contrast, activation with PEG 3350 was more dose-dependent (Fig. 4C and D). Nevertheless, the kinetic parameters obtained in the presence of citrate displayed similar trends to those found with PEG 3350: Km decreased to level off at ∼400 µM of ε-NAD (Fig. S4D), kcat increases with increasing sodium citrate concentration (Fig. S4E), and kcat/Km follows the kcat trends (Fig. S4F).
In the cytoplasm, high concentrations of macromolecules (proteins, nucleic acids, lipids, carbohydrates) cause molecular crowding and induce phase transitions of signaling proteins (46). To determine if TIR undergoes a phase transition and whether NADase activity correlates with the transition, we incubated purified TIR with different concentrations of PEG3350 or citrate, centrifuged the sample, and evaluated TIR NADase activity in the soluble and insoluble fractions (Fig. 4H and S4G). At low concentrations of both PEG and citrate, TIR protein was present in the supernatant. However, at high concentrations of both PEG and citrate, TIR was principally located in the pelleted (insoluble) fraction, as visualized by Coomassie staining on an SDS-PAGE gel (Fig. 4H and S4G). Importantly, NADase activity was not detected in the supernatant of samples treated with high concentrations of PEG or citrate, whereas robust NADase activity was observed in the pelleted fraction (Fig. 4H and S4G). Taken together, these data demonstrate that precipitation of TIR is required to activate the intrinsic NADase activity of TIR-1/SARM1.
TIR phase transition and NAD+ glycohydrolase activity requires TIR oligomerization
To determine whether TIR-1 oligomerization is also required for a phase transition and the NADase activity of TIR, we recombinantly expressed and purified from E. coli the TIR domain of TIR-1 containing mutations in residues required for oligomerization (TIRG747P) and NAD+ catalysis (TIRE788A and TIRE788Q). Notably, the catalytic efficiency (kcat/Km) of TIRG747P, TIRE788A and TIRE788Q mutants was decreased 10-fold compared to TIRWT (Fig. 4I). Kinetic analysis of the recombinant TIR mutants in 25% PEG 3350 revealed that the Km of ε-NAD increases 2-fold and the kcat decreases 4-fold compared to TIRWT (Fig. 4I). These data demonstrate that the decreased activity of the TIR mutants is due to a combination of both decreased substrate binding and decreased substrate turnover. Similarly, kinetic analysis of TIR oligomerization and catalytic mutants in 500 mM citrate revealed that the catalytic efficiency (kcat/Km) decreases by 4-12-fold, similar to trends we observed in experiments conducted with PEG 3350 (Fig. S4H).
To further characterize the TIR phase transition, we evaluated the precipitation capacity of TIR oligomerization and catalytic mutants in the presence of PEG 3350 and citrate. Consistent with our genetic data, TIRG747P, which contains a mutation that prevents oligomerization of TIR, was unable to precipitate as readily as TIRWT (Fig. 4J). Compared to TIRWT, the TIRG747P mutant in the presence of PEG 3550 demonstrated a 25% decrease in the amount of precipitated protein (Fig. 4J). We observed similar results in the presence of citrate, in which compared to TIRWT, the TIRG747P mutant demonstrated a 22% decrease in precipitated protein compared to TIRWT (Fig. S4I). Importantly, TIR proteins with two different mutants in the catalytic glutamate required for NAD+ catalysis, TIRE788A and TIRE788Q, precipitated to a similar extent as TIRWT (Fig. 4J-K and S4I-J), but had minimal NADase activity (Fig. 4I and S4H). Collectively, these data demonstrate that a phase transition of TIR-1 is required for its NADase activity.
A phase transition superactivates the intrinsic NAD+ glycohydrolase activity of TIR
During phase separations, macromolecules partition into distinct biochemical compartments characterized by a higher concentration dense phase and a lower concentration dilute phase (23, 24, 26). The dense compartment can have either liquid-like properties in liquid-to-liquid phase separations or solid-like properties in liquid-to-solid phase transitions (24, 25, 27, 47). To determine whether TIR undergoes a liquid-to-liquid or a liquid-to-solid phase transition, we assayed the enzyme activity of TIR in the presence of 1,6-hexanediol, an aliphatic alcohol that interferes with hydrophobic interactions prominent in liquid-to-liquid separations. Thus, 1,6-hexanediol disrupts liquid-like compartments, but not solid-like compartments (23, 26, 27). In the presence of either PEG 3350 or citrate, we observed that 1,6-hexanediol decreases the NADase activity of TIR by <2-fold, yet the activity of 1,6-hexanediol-treated TIR remains two orders of magnitude higher than the activity of TIR without PEG 3550 or citrate addition (Fig. 5A). While significant, this modest effect suggests that the NADase activity of TIR is predominantly associated with a solid, rather than a liquid, state (Fig. 5A). Notably, in the absence of PEG 3350 or citrate, the low-level TIR NADase activity can be inhibited by 1,6-hexanediol (Fig. 5A), suggesting that this activity is driven by hydrophobic interactions. Importantly, 1,6-hexanediol does not interfere with TIR precipitation in the presence of PEG or citrate, regardless of whether it is added before or after precipitate formation (Fig. S5A and B).

(A) Effect of 1,6-hexanediol on TIR NADase activity is shown. TIR protein was incubated in the presence or absence of either 25% PEG 3350 or 500 mM citrate, and treated with either 0 or 2% 1,6-hexanediol. The NADase activity of TIR for each condition was assessed using the ε-NAD substrate assay (n=3). * equals p<0.05 (unpaired t-test). (B) The NADase activity of TIR protein incubated with either 25% PEG 3350 or 500 mM citrate before (precentrifugation, n=2) and after centrifugation, the supernatant (n=4) and precipitant (n=2) fractions. Precipitation fractions were resuspended in buffer alone or buffer containing 25% PEG 3350 or 500 mM citrate and NADase activity assessed. (C) SDS-PAGE analysis of TIR protein in the soluble (S) and pellet (P) fractions following incubation with either PEG 3350 or citrate and centrifugation (1 spin). Pellet fractions were subsequently resuspended in only buffer or buffer containing 25% PEG 3350 or 500 mM citrate and centrifuged a second time to isolate the soluble (S) and pellet (P) fractions (n=2, representative image shown). (D) SDS-PAGE analysis of TIR in the soluble (S) and pellet (P) fractions incubated with or without 25% PEG 3350 at the indicated pH (n=2, representative image shown). TIR steady state kinetic parameters [Km (E), kcat (F), kcat/Km (G)] is shown at the indicated pH (n=2). (H) Negative stain electron microscopy in either the absence or presence of 500 mM citrate (diameter of particles = 8.9 nm ± 1.2, n = 65). See also Fig. S5.
Next, we determined if this liquid-to-solid phase transition of TIR is reversible. The insoluble fraction following treatment of TIR with PEG 3350 or citrate was resuspended in either buffer alone or buffer plus the respective additive (PEG 3350 or citrate). If the phase transition is reversible, resuspension of precipitated TIR in buffer alone should disrupt enzymatic activity. However, if the phase transition is irreversible, activity should be detected when the pellet is resuspended in buffer alone. Notably, we observed some TIR enzymatic activity when the pellet was resuspended in buffer (Fig. 5B). With PEG 3350, the activity was lower than that observed in the pre-centrifugation control or when the pellet was resuspended in buffer with PEG 3350. By contrast, with citrate, the activity was similar to both control conditions (pre-centrifugation or when the pellet was resuspended in buffer and citrate). These data indicate that the phase transition of TIR is partially reversible in PEG 3350 and irreversible in sodium citrate. To confirm these findings, we centrifuged the resuspended samples to examine the fractions visually by SDS-PAGE. In the sample initially prepared with PEG 3350 and resuspended in buffer alone, a faint band was present in the supernatant fraction. However, this band was absent in the sample initially prepared with sodium citrate (Fig. 5C). These data confirm that the TIR phase transition is partially reversible in PEG 3350 and irreversible in sodium citrate, at least under these conditions.
Next, we evaluated the effect of pH on TIR precipitation and NADase activity. There was virtually no increase in TIR precipitation in the absence of PEG. However, in the presence of 25% PEG, TIR precipitation increased with increasing pH (Fig. 5D). Under these same conditions, no activity was apparent below pH 6. Km remained constant (Fig. 5E) and kcat increased from pH 6.5 to pH 8.5 (Fig. 5F). A corresponding increase in kcat/Km was responsible for the increase in catalytic efficiency above pH 7 (Fig. 5G). Notably, the increase in kcat/Km correlated with precipitation (Fig. 5D and G), again indicating that a phase transition increases TIR activity.
We performed negative stain electron microscopy to directly visualize TIR aggregation in vitro. Protein visualization is not possible with PEG because macroviscogens themselves are stained, confounding image analysis. Therefore, we performed this experiment with citrate. In the absence of citrate, we observed borderline fibrillar structures and protein aggregates, but overall, there were no consistent structures (Fig. 5H). In the presence of citrate, however, circular particles emerged (Fig. 5I). These results indicate that, in vitro, TIR aggregates into higher-order, ring-like structures.
Taken together, these data demonstrate that the TIR domain undergoes a phase transition, which superactivates its NADase activity to initiate the p38 PMK-1 innate immune pathway.
Sterol scarcity primes p38 PMK-1 immune defenses
C. elegans require cholesterol to survive bacterial infection. However, nematodes lack the ability to synthesize cholesterol de novo, and therefore must obtain this essential metabolite from their diet. Thus, we hypothesized that, when environmental sterols are limited, activation of the p38 PMK-1 pathway represents an evolutionary adaptation that primes immune effector expression to anticipate challenges from bacterial pathogens. To test this hypothesis, we examined the expression of innate immune effector genes during bacterial infection in the presence and absence of cholesterol supplementation. Interestingly, the induction of irg-4p::gfp (Fig. 6A), irg-5p::gfp (Fig. 6B) and T24B8.5p::gfp (Fig. 6C) during P. aeruginosa infection was enhanced when nematodes were infected on media that did not contain supplemented cholesterol. Consistent with these data, P. aeruginosa infection also led to increased activation of irg-4p::gfp (Fig. 6D) and irg-5p::gfp (Fig. 6E) when nhr-8 was depleted by RNAi. These data suggest that cholesterol scarcity primes p38 PMK-1 immune defenses for subsequent pathogen encounter.
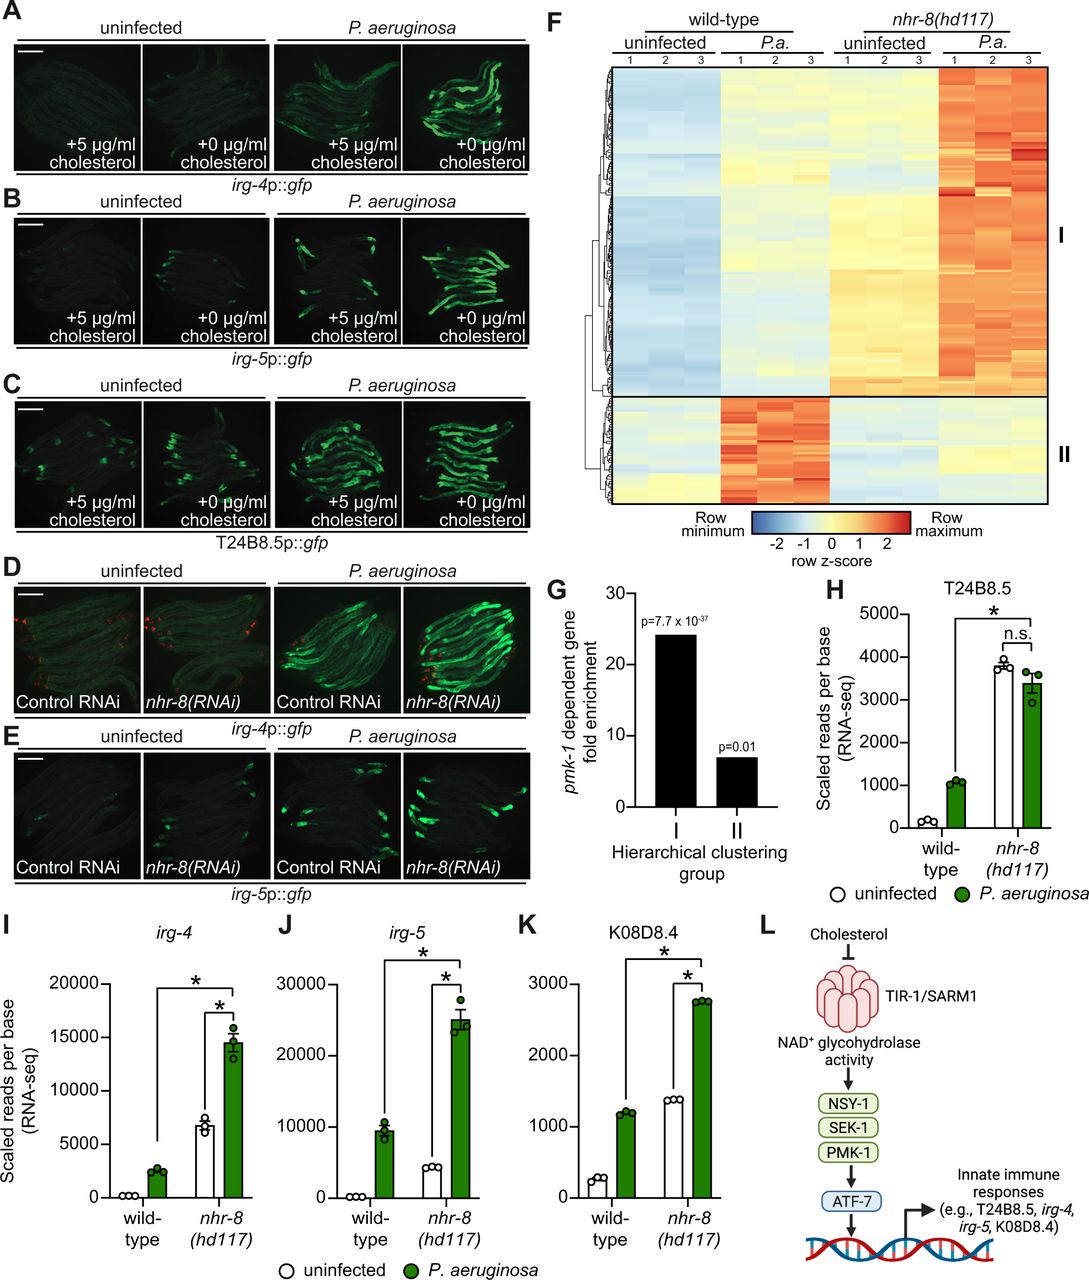
Images of the indicated transcriptional immune reporters under the indicated conditions. Scale bars in all images equals 200 μm. (F) A heat map compares the expression levels of the 184 genes that were both induced in wild-type animals during P. aeruginosa infection and differentially expressed (either induced or repressed) in nhr-8(hd117) mutants at baseline (each greater than 2-fold, q<0.05). To compare expression of these genes in wild-type and nhr-8(hd117) mutants, we scaled the expression level in each condition by calculating a z-score for each row and performed hierarchical clustering, which identified two main clusters (Cluster I has 139 genes and Cluster II contains 45 genes). See also Table S3. (G) Enrichment of p38 PMK-1-dependent genes in Cluster I and II genes is shown. (H, I, J, K) mRNA-seq data for the indicated genes from the experiment described in 6F showing scaled reads per base from three biological replicates. * equals q<0.05 from RNA-seq analysis. (L) Model of p38 PMK-1 pathway activation during sterol scarcity.
To provide further support for this hypothesis, we analyzed the expression pattern of p38 PMK-1-dependent transcripts in nhr-8(hd117) mutant animals during P. aeruginosa infection. Of the 472 genes that were induced in wild-type animals during P. aeruginosa infection, 184 were also differentially regulated (either induced or repressed) in nhr-8(hd117) animals that were infected with P. aeruginosa. To perform this analysis in an unbiased manner, we scaled the expression level in each condition for each of these 184 genes by calculating a row z-score and performed hierarchical clustering (Fig. 6F). We observed that these 184 genes group into two clusters: Cluster I had 139 genes and Cluster II contained 45 genes (Table S3). Cluster I was comprised mostly of genes whose expression in the absence of infection was higher in nhr-8(hd117) mutants than wild-type animals (129 of 139 genes). In addition, the majority of Cluster I genes were more strongly induced during P. aeruginosa infection in nhr-8(hd117) animals than wild-type animals. Cluster II, on the other hand, contained genes whose induction on P. aeruginosa were dependent on nhr-8. Interestingly, p38 PMK-1-dependent genes were strongly enriched among Cluster I, but not Cluster II, genes (Fig. 6G). Thirty-three of the 139 genes in Cluster I are known targets of the p38 PMK-1 immune pathway (24.17-fold enriched, hypergeometric p-value = 7.68 x 10-37), a group that includes the immune effectors T24B8.5 (Fig. 6H), irg-4 (Fig. 6I), irg-5 (Fig. 6J) and K08D8.4 (Fig. 6K). By contrast, only three genes in Cluster II are p38 PMK-1 dependent transcripts (6.95-fold enriched, hypergeometric p-value = 0.01) (Fig. 6F and 6G).
These data demonstrate that sterol scarcity primes the induction of innate immune effectors by activating the p38 PMK-1 immune pathway (Fig. 6L). Subsequent challenge by P. aeruginosa further drives immune activation in a manner that promotes clearance of pathogenic bacteria from the intestine (Fig. 1N).
DISCUSSION
Here, we show that the nematode C. elegans adapts to a sterol-deficient environment by activating immune defenses in the intestine via the p38 PMK-1 pathway. In the absence of dietary cholesterol, C. elegans are more susceptible to infection with pathogenic bacteria and have a shortened lifespan (6, 7, 13). In addition, sterol scarce environments prime some C. elegans larvae to enter dauer diapause, an alternative, stress-resistant growth form. We show that anticipatory activation of the p38 PMK-1 pathway during conditions of low sterol availability is an adaptive response in animals that do not enter dauer diapause.
In this study, we also define the mechanism of p38 PMK-1 immune pathway activation in C. elegans. We show that TIR-1/SARM1 undergoes a phase transition to potentiate its intrinsic NAD+ glycohydrolase activity and activate innate immune defenses in intestinal epithelial cells via the p38 PMK-1 pathway. Accordingly, activation of the p38 PMK-1 pathway when dietary sterols are limited requires TIR-1/SARM1 multimerization and precipitation.
The p38 PMK-1 pathway controls the expression of innate immune effector genes. Inputs from chemosensory neurons, bacterial density, tissue damage and nucleotide metabolism also regulate the tonic level of p38 PMK-1 pathway activity (16, 48–52). These data suggest that p38 PMK-1 phosphorylation is adjusted in different environments to anticipate dangerous threats during periods of vulnerability. Consistent with this hypothesis, the increased level of p38 PMK-1 phosphorylation during sterol deprivation leads to enhanced activation of immune effector genes and promoted pathogen clearance from the intestine during a subsequent bacterial infection.
We previously demonstrated that a C. elegans nuclear hormone receptor, NHR-86, a member of a family of ligand-gated transcription factors, surveys the chemical environment to activate the expression of immune effectors (32). Interestingly, NHR-86 targets immune effectors whose basal regulation requires the p38 PMK-1 immune pathway. However, NHR-86 functions independently of PMK-1 and modulates the transcription of these infection response genes directly. NHR-86 is a nematode homolog of the mammalian nuclear hormone receptor hepatocyte nuclear factor 4 (HNF4), a family of NHRs that expanded dramatically in C. elegans — 259 HNF4 homologs are encoded in the C. elegans genome (53, 54). One potentially unifying hypothesis is that HNF4 homologs detect pathogen- or host-derived ligands that are associated with infection and activate pathogen-specific immune defenses. In this model, the p38 PMK-1 pathway functions as a rheostat that receives inputs from signals associated with potentially dangerous environmental conditions to prime host immune effector genes. Thus, upon encountering a pathogen, immune defenses can be further augmented by mechanisms that detect pathogen specifically.
Intracellular signaling is coordinated through the formation of membrane-less, phase-separated compartments that concentrate signaling components and mediators to facilitate rapid cellular responses (20-22, 24, 47). In a contemporaneous study, we uncovered that the phase transition of the mammalian homolog of TIR-1, SARM1, also potentiates its intrinsic NADase activity (55). Consistent with the data presented in this manuscript, mammalian SARM1 with mutations in residues required for multimerization largely failed to undergo a phase transition and lack NADase catalytic activity. SARM1 has a well-characterized role in promoting Wallerian degeneration, a form of neuronal degeneration induced by axon injury (56, 57). During axon injury, SARM1 NADase activity depletes NAD+ and induces cell death, through a non-canonical cell death pathway (58). Additionally, in myeloid cells, SARM1 localizes to mitochondria and causes mitochondrial depolarization and cell death during inflammasome activation (59). Thus, the regulation of intracellular signaling activity through phase transition of TIR-1/SARM1 and its NAD+ glycohydrolase activity is evolutionarily ancient and is essential for diverse physiological processes, including neuronal degeneration, cell death, and innate immune regulation in the intestine.
MATERIALS AND METHODS
C. elegans and bacterial strains
The previously published C. elegans strains used in this study were: N2 Bristol (28), KU25 pmk-1(km25) (60), AU3 nsy-1(ag3) (14), ZD101 tir-1(qd4) (29), AA968 nhr-8(hd117) (13), AE501 nhr-8(ok186) (31), AU78 agIs219 [T24B8.5p::gfp::unc-54-3’UTR; ttx-3p::gfp::unc-54-3’UTR] (29), AU306 agIs44 [irg-4p::gfp::unc-54-3’UTR; myo-2p::mCherry] (61), AY101 acIs101 [pDB09.1(irg-5p::gfp); pRF4(rol-6(su1006))] (30), TJ356 zIs356 [daf-16p::daf-16a/b::gfp + pRF4(rol-6(su1006))], MGH167 sid-1(qt9); alxIs9[vha-6p::sid-1::SL2::GFP]. The strains developed in this study were: RPW278 nhr-8(hd117);agIs219, RPW317 tir-1(qd4);nhr-8(hd117), RPW280 nhr-8(hd117);umsEx42[nhr-8p::nhr-8::3’-UTR; myo-2p::mCherry), RPW281 nhr-8(hd117);umsEx43[nhr-8p::nhr-8::3’-UTR; myo-2p::mCherry), RPW288 nhr-8(hd117);umsEx50[ges-1p::nhr-8::3’-UTR; myo-2p::mCherry), RPW289 umsEx51[ges-1p::nhr-8::3’-UTR; myo-2p::mCherry), RPW290 umsEx52[ges-1p::nhr-8::3’-UTR; myo-2p::mCherry), RPW284 nhr-8(hd117);umsEx46[sng-1p::nhr-8::3’-UTR; myo-2p::mCherry), RPW286 nhr-8(hd117);umsEx48[sng-1p::nhr-8::3’-UTR; myo-2p::mCherry), RPW287 nhr-8(hd117);umsEx49[sng-1p::nhr-8::3’-UTR; myo-2p::mCherry). RPW339 tir-1(ums47[E788A]);agIs219, RPW369 tir-1(ums54[ΔSAM]);agIs219, RPW374 tir-1(ums55[G747P]);agIs219, RPW381 tir-1(ums56[H833A]);agIs219, RPW386 tir-1(ums57[tir-1::3xFLAG]);agIs219, RPW387 tir-1(ums58[tir-1[E788A]::3xFLAG]);agIs219, RPW388 tir-1 (ums59[tir-1[ΔSAM]::3xFLAG]);agIs219, RPW 389 tir-1(ums60[tir-1[G747P]::3xFLAG]);agIs219. Bacteria used in this study are Escherichia coli OP50, E. coli DH5α, E. coli HT115(DE3), and Pseudomonas aeruginosa strain PA14 (62).
C. elegans growth conditions and lipid supplementation
C. elegans strains were maintained on standard nematode growth medium (NGM) plates [0.25% bacto peptone, 0.3% sodium chloride, 1.7% agar, 5 μg/mL cholesterol (Sigma-Aldrich, BioReagent grade), 25 mM potassium phosphate pH 6.0, 1 mM magnesium sulfate, 1 mM calcium chloride] with E. coli OP50 as a food source, as described (28). For low cholesterol medium (0 μg/mL cholesterol), NGM was prepared without cholesterol supplementation, while 0.1% ethanol added to maintain an equivalent ethanol concentration. For high cholesterol medium, cholesterol was dissolved in ethanol at 20 mg/mL and added to NGM at a final concentration of 80 μg/mL immediately prior to pouring plates. For all assays with high cholesterol medium, control NGM containing 0.4% ethanol and 5 μg/mL cholesterol were used as control plates. Cholesterol solubilization assays were performed by supplementing NGM containing 5 μg/mL cholesterol with either 0.1% Tergitol (Sigma-Aldrich) or 0.1% Triton X-100 (Sigma-Aldrich). For assays using media solidified with agarose, NGM plates were prepared with 1.7% Ultrapure agarose (ThermoFisher Scientific) in place of agar. All fatty acids were purchased from Nu-Check-Prep Inc. and supplementation performed as previously described with modification (63, 64). Fatty acids were dissolved in 50% ethanol and added at a final concentration of 1 mM to NGM agarose containing 0 μg/mL cholesterol and 0.1% Tergitol immediately prior to plate pouring. Prior to all assays, plates supplemented with lipids and control plates were seeded with E. coli OP50 and grown for 24 hours at room temperature. Assays were performed by picking 10-20 gravid adult animals to either lipid supplemented or matched control plates. Animals were maintained on the plates for 14 hours at 20°C after which they were removed. Eggs laid on the plate were allowed to hatch and develop to the L4 stage at 20°C. For low cholesterol assays, animals were grown for two generations on NGM containing 0 μg/mL cholesterol.
C. elegans strain construction
CRISPR/Cas9 was used to generate tir-1 mutants in both wild-type and TIR-1::3xFLAG backgrounds, as described (65, 66). All CRISPR/Cas9 reagents were purchased from Integrated DNA Technologies. Target guide sequences were selected using the CHOPCHOP web tool (67). ssODN repair templates contained indicated edits, deletions or insertions with 35 bp flanking homology arms. crRNA guide and ssODN sequences are listed in Table S4. A mixture of 0.25 μg/μL Cas9, 0.1 μg/μL tracrRNA and 0.056 μg/μL crRNA were incubated for 15 minutes at 37°C. 0.11 μg/μL ssODN and 40 ng/μL pRF4(rol-6(su1006)) plasmid were added to the mixture, centrifuged and microinjected into young adult animals carrying the agIs219 transgene or tir-1(ums57[tir-1::3xFLAG]);agIs219. The F1 progeny were screened for Rol phenotypes 3-4 days after injection and then for indicated edits using PCR and Sanger sequencing. Primer sequences used for genotyping are listed in Table S4.
Feeding RNAi
Knockdown of target genes was performed by feeding C. elegans E. coli HT115 expressing dsRNA targeting the gene of interest, as previously described with modification (68–70). In brief, HT115 bacteria expressing dsRNA targeting genes of interest were grown in Lysogeny broth (LB) Lennox medium containing 50 μg/mL ampicillin and 15 μg/mL tetracycline overnight with shaking (250 rpm) at 37°C. Overnight cultures were seeded onto NGM containing 5 mM IPTG and 50 μg/mL carbenicillin and incubated at 37°C for 16 hours after which synchronized L1 animals were transferred to bacterial lawns and allowed to grow until the L4 stage.
C. elegans Bacterial Infection and Colonization Assays
“Slow killing” P. aeruginosa infection experiments were performed as previously described (71, 72). Wild-type is either N2 or agIs219. In brief, a single colony of P. aeruginosa PA14 was inoculated into 3-mL of LB medium and grown with shaking (250 rpm) at 37°C for 14 hours. 10-μL of overnight culture was spread onto 35-mm petri dishes containing 4-mL slow killing agar (0.35% peptone, 0.3% sodium chloride, 1.7% agar, 5 μg/mL cholesterol, 25 mM potassium phosphate pH 6.0, 1 mM magnesium sulfate, 1 mM calcium chloride). Plates were incubated for 24 hours at 37°C and for approximately 24 hours at 25°C. Immediately prior to starting the assay 0.1 mg/mL 5-fluorodeoxyuridine (FUDR) was added on top of the agar to prevent progeny from hatching. Animals used in all assays were grown at 20°C with specified growth conditions. For assays involving high cholesterol or nonionic detergents, slow killing agar plates were prepared with either 80 μg/mL cholesterol (Sigma-Aldrich), 0.1% Tergitol (Sigma-Aldrich), or 0.1% Triton X-100 (Sigma-Aldrich). For experiments using plates containing 80 μg/mL cholesterol, matched control plates containing the equivalent ethanol concentration (0.4%) and 5 μg/mL cholesterol were prepared. All pathogenesis and lifespan assays are representative of three biological replicates. Sample sizes, mean lifespan, and p values for all trials are shown in Table S2.
Colony forming units of P. aeruginosa were quantified in the intestine of C. elegans as previously described with modifications (73, 74). Briefly, C. elegans animals were exposed to lawns of P. aeruginosa, which were prepared as previously described, for 24 hours. Animals were then picked to NGM plates lacking bacteria and incubated for 10 minutes to remove external P. aeruginosa. Animals were then transferred to a second NGM plate after which 10-11 animals per replicate were collected, washed with M9 buffer containing 25 mM tetramisole (Sigma-Aldrich) and 0.01% Triton X-100 (Sigma-Aldrich), and ground with 1.0 mm silicon carbide beads (BioSpec Products). P. aeruginosa CFUs were quantified from serial dilutions of the lysate grown on LB agar.
Gene expression analysis and bioinformatics
Synchronized L1 stage C. elegans of the indicated genotypes were grown to the L4 stage and harvested by washing with M9. For expression analysis of C. elegans genes during P. aeruginosa infection, animals at the L4 stage animals were transferred by washing to plates containing E. coli OP50 or P. aeruginosa PA14 lawns. Animals were exposed for four hours and subsequently harvested by washing with M9. RNA was isolated using TriReagent (Sigma-Aldrich), column purified (Qiagen), and analyzed by 100 bp paired-end mRNA-sequencing using the BGISEQ-500 platform (BGIAmericasCorp) with >20 million reads per sample. Raw fastq reads were evaluated by FastQC (version 0.11.5), clean reads were aligned to the C. elegans reference genome (WBcel235) and quantified using Kallisto (version 0.45.0) (75). Differentially expressed genes were identified using Sleuth (version 0.30.0) (76). Pearson correlation statistical analysis was performed using Prism 9.0. Heat-maps of differentially expressed genes were generated using pheatmap (version 1.0.12). Gene set enrichment analysis of RNA-seq was performed using GSEA (version 4.1.0) (77) with a custom gene set database containing p38 PMK-1 dependent genes generated from previously published RNA-seq of uninfected pmk-1(km25) animals (78). Differential gene expression was defined as a fold change (FC) versus wild-type greater than 2 and q less than 0.01.
For the qRT-PCR studies, RNA was reverse transcribed to cDNA using the iScriptTM cDNA Synthesis Kit (Bio-Rad Laboratories, Inc.), amplified and detected using Syber Green (Bio-Rad Laboratories, Inc.) and a CFX384 machine (Bio-Rad Laboratories, Inc.). The sequences of primers that were designed for this study are presented in Table S4. Other primers were previously published (17, 79–81). All values were normalized against the geometric mean of the control genes snb-1 and act-3. Fold change was calculated using the Pfaffl method (82).
Immunoblot analyses
Protein lysates from C. elegans grown to the L4 larval stage on E. coli OP50 on NGM agar were prepared as previously described with modification (32, 83). Harvested animals were washed twice with M9 buffer and resuspended in RIPA Buffer (Cell Signaling Technology, Inc.) containing 1x Halt Protease and Phosphatase inhibitor (ThermoFisher Scientific). Samples were lysed using a teflon homogenizer, centrifuged, and protein was quantified from the supernatant of each sample using the DC protein assay (Bio-Rad Laboratories, Inc.). NuPAGETM LDS sample buffer (ThermoFisher Scientific) was added to a concentration of 1X and 12.5-30 μg of total protein from each sample was resolved on NuPAGETM 4-12% BisTris (Phospho-PMK-1 and Total-PMK-1) or NuPAGETM 3-8% TrisAcetate (TIR-1::3xFLAG) gels (ThermoFisher Scientific), transferred to nitrocellulose membranes using a Trans-Blot Turbo Transfer System (Bio-Rad Laboratories, Inc.), blocked with 5% milk powder in TBST and probed with a 1:1000 dilution of an antibody that recognizes the doubly-phosphorylated TGY motif of PMK-1 (Cell Signaling Technology, #9211), a previously characterized total PMK-1 antibody (32), a monoclonal mouse anti-FLAG antibody (Sigma-Aldrich, M2), or a monoclonal mouse anti-tubulin antibody (Sigma-Aldrich, Clone B-5-1-2). Horseradish peroxidase (HRP)-conjugated anti-rabbit (Cell Signaling Technology, #7074) and anti-mouse IgG secondary antibodies (Abcam, #ab6789) were diluted 1:10,000 and used to detect the primary antibodies following the addition of ECL reagents (Thermo Fisher Scientific, Inc.), which were visualized using a BioRad ChemiDoc MP Imaging System. The band intensities were quantified using ImageJ version 2.0.0, and the ratio of active phosphorylated PMK-1 to total PMK-1 was calculated.
Generation of transgenic C. elegans strains
To generate nhr-8 rescue lines, 1989 bp of the nhr-8 promoter region upstream of the 5’-UTR, and the entire nhr-8 coding region, including the 5’-UTR and 3’-UTR were amplified and PCR purified. Gibson assembly was used to clone PCR products into a SmaI-linearized pUC19 vector. Plasmids were transformed into chemically competent E. coli DH5α and selected on LB agar with 50 μg/mL ampicillin. For tissue specific rescue of nhr-8 expression, 1973 bp of sng-1 promoter region (neuronal specific expression), 1936 of ges-1 promoter region (intestinal specific expression) and the nhr-8 coding region were PCR amplified, purified and cloned into a SmaI-linearized pUC19 vector by Gibson assembly, transformed into chemically competent E. coli DH5α, and selected on LB agar with 50 μg/mL ampicillin. All plasmids were verified by Sanger sequencing. Primer sequences used for cloning are listed in Table S4. Plasmids (50 ng/μL), the myo-2p::mCherry co-injection marker (5 ng/μL) and pUC19 vector (155 ng/μL) were microinjected into nhr-8(hd117) animals to generate the arrays for native expression (umsEx42, umsEx43), intestinal specific expression (umsEx50, umsEx51, umsEx52), and neuronal specific expression (umsEx46, umsEx48, umsEx49).
Microscopy
Nematodes were mounted onto agar pads, paralyzed with 10 mM levamisole (Sigma) and photographed using a Zeiss AXIO Imager Z2 microscope with a Zeiss Axiocam 506mono camera and Zen 2.3 (Zeiss) software.
TIR-1 TIR domain expression and purification
The recombinant C. elegans TIR-1 TIR domain (TIR) was expressed in bacteria as previously described (55). Briefly, the TIR domain cloned into the pET-30a(+) vector was transformed into chemically competent E. coli BL21(DE3) cells and maintained as a glycerol stock at -80 °C. An inoculation loop was used to transfer the transformed bacteria into 5-mL of LB media with 50 µg/mL (final concentration) of kanamycin and the culture was grown overnight at 37 °C while rotating. The next day, the cultures were diluted 1:400 in LB media with 50 µg/mL (final concentration) of kanamycin and grown at 37 °C while shaking at 215 rpm until an OD600 of 0.7-0.8 was reached. After cooling, 50 µM IPTG (final concentration) was added to the culture to induce protein expression. The incubator temperature was decreased to 16 °C and cells were incubated for an additional 16-18 h. Bacterial cells were collected by centrifugation at 3,000 x g for 15 min at 4 °C, flash frozen in liquid nitrogen, and stored at -80 °C until purification.
For purification, bacterial pellets were thawed on ice and then resuspended in Lysis Buffer (50 mM Tris•HCl pH 7.0, 300 mM NaCl, 10% (w/v) glycerol, 0.001% Tween 20) with PierceTM EDTA-free protease inhibitor mini tablets (ThermoFisher Scientific). The resuspension was incubated with 100 µg/mL lysozyme for 10 min at 4 °C and sonicated with a Fisher Scientific Sonic Dismembrator sonicator (FB-705) in 50-mL batches at an amplitude of 30 for 20 s, pulsing for 1 s on and 1 s off, followed by a delay period of 20 s for a series of 12 cycles. Crude lysate was clarified at 21,000 x g for 25 min at 4 °C, at which point the supernatant was applied to pre-equilibrated Strep-Tactin XT Superflow high-capacity resin (IBA Lifesciences) and allowed to enter the column by gravity flow; the Strep-Tactin resin had been equilibrated in Strep Wash Buffer (50 mM Tris•HCl pH 7.0, 300 mM NaCl). The column was washed with 30 column volumes of Strep Wash Buffer and the protein was eluted with 25 column volumes of Strep Elution Buffer (Strep Wash Buffer with 50 mM biotin). Protein eluted from the Strep-Tactin column was then applied to pre-equilibrated TALON Metal Affinity Resin (Takara) and allowed to enter the column by gravity flow; the TALON resin was equilibrated in His Wash 1 (50 mM Tris•HCl pH 7.0, 150 mM NaCl, 5 mM imidazole). A series of 15 column volume washes were applied (His Wash 1; His Wash 2: 50 mM Tris•HCl pH 7.0, 150 NaCl, 10 mM imidazole) and the protein was eluted in 20 column volumes of His Elution Buffer (50 mM Tris•HCl pH 7.0, 150 mM NaCl, 150 mM imidazole). The eluted protein was dialyzed overnight in Dialysis Buffer (50 mM Tris•HCl, pH 7.0, 150 mM NaCl). The next day, the protein was concentrated using a 10,000 NMWL Amicon Ultra-15 Centrifugal Filter Unit at 4 °C and the protein concentration was determined by the Bradford assay. TIR was flash frozen in liquid nitrogen and stored at -80 °C in 25-µL aliquots.
Fluorescent NADase Assay
Nicotinamide 1,N6-ethenoadenine dinucleotide (ε-NAD, Sigma-Aldrich) is a fluorescent analog of NAD+ and was utilized in kinetic assays as a TIR-1 substrate. TIR-1 cleaves the nicotinamide moiety from ε-NAD to release nicotinamide and etheno-ADPR (ε-ADPR), which fluoresces (λex = 330 nm, λem = 405 nm). Enzymatic activity was assayed in Assay Buffer (50 mM Tris pH 8.0, 150 mM NaCl; final concentration) using Corning® 96–well Half Area Black Flat Bottom Polystyrene NBSTM Microplates for a final reaction volume of 60-μL, or Corning® 384-well Low Volume Black Round Bottom Polystyrene NBSTM Microplates for a final volume of 20-µL; reactions were initiated by the addition of ε-NAD. ε-ADPR fluorescence intensity readings were taken in real time every 15 s for 15-30 min using Wallac EnVision Manager software and a PerkinElmer EnVision 2104 Multilabel Reader. Fluorescence intensity readings (λex = 330 nm, λem = 405 nm) were converted to [ε-ADPR] with an ε-ADPR standard curve, which was produced by incubating fixed concentrations (0-400 µM) of ε-NAD with excess ADP-ribosyl cyclase and plotting the peak fluorescence intensity values against [ε-ADPR]. The activity was linear with respect to time under all conditions tested.
Effect of crowding agents and sodium citrate on the activity of the TIR domain
The enzymatic activity of the TIR domain was evaluated using the Fluorescent Assay described above. First, the enzyme concentration dependence was determined. For purified protein, the enzyme (0-32.5 µM; final concentration) was added to Assay Buffer in duplicate, briefly incubated at room temperature for 10 min, and the reaction was initiated with 1 mM ε-NAD. Fluorescence intensity was monitored in real time every 15 s for 15 min.
To evaluate the effect of crowding agents and sodium citrate on TIR activity, stock solutions of the additives were made. 50% (w/v) solutions of PEGs 8000, 3500, 1500, and 400, as well as 60% (w/v) solutions of dextran, sucrose, and glycerol were prepared and filtered. Initially, the concentration dependence of TIR in the presence of PEG 3350 was determined. TIR (0-15 µM; final concentration) was added to Assay Buffer with 25% PEG 3350 (final concentration) in duplicate, incubated for 10 min at room temperature, initiated with 1 mM ε-NAD, and monitored every 15 s for 15 min. The concentration dependence of TIR in 25% PEG 3350 was used to establish that 2.5 µM TIR could be used to enable robust kinetic analyses. Next, the effect of viscogens on TIR activity was evaluated by adding 2.5 μM TIR (final concentration) in duplicate to Assay Buffer with or without 25% w/v of the viscogens (final concentration). Following a brief 10 min incubation period, the reaction was initiated with 1 mM ε-NAD and monitored every 15 s for 20 min. The dose response of 2.5 μM TIR to the viscogens (0, 10, 20, and 30% final concentrations) was evaluated in the same manner and monitored every 15 s for 15 min.
Sodium citrate was prepared as a stock solution of 2 M and filtered. The concentration dependence of TIR in the presence of 500 mM sodium citrate was determined. TIR (0-15 µM; final concentration) was added to Assay Buffer with 500 mM citrate (final concentration) in duplicate, incubated for 10 min at room temperature, and then the reaction was initiated with 1 mM ε-NAD and monitored every 15 s for 15 min. Additionally, the dose dependence of sodium citrate was determined in duplicate. 2.5 µM TIR was added to Assay Buffer with (0-1000 mM) sodium citrate and briefly incubated at room temperature for 10 min. The reaction was initiated with 1 mM Ε-NAD, and fluorescence was monitored for 15 min every 15 s.
In all cases, the fluorescence intensity was converted to ε-ADPR using the ε-ADPR standard curve described above. Slopes of the progress curves yielded the velocities of the reactions, which were plotted in GraphPad Prism.
Effect of PEG 3350 and sodium citrate on steady state kinetics
Steady state kinetic reactions were carried out in Assay buffer with either PEG 3350 (0-25%; final concentration) or sodium citrate (0-1000 mM; final concentration); a constant concentration of 2.5 µM TIR was used in these assays. Reaction components were mixed in duplicate and incubated at room temperature for 10 min before initiating the reaction with ε-NAD (0-4000 µM, final concentration). Fluorescence intensity was monitored for 15 min every 15 s. Using the ε-ADPR standard curve, the fluorescence was converted to [ε-ADPR]. The velocity of the reactions was calculated from the slope of the progress curve at each ε-NAD concentration and plotted in GraphPad Prism. Kinetic parameters were determined by fitting these velocities to the Michaelis Menten equation (Eq. 1) at each PEG 3350 or sodium citrate concentration. Km, kcat, and kcat/Km values were plotted against PEG 3350 or sodium citrate concentration.

Where Vmax is the maximum velocity, [S] is the substrate concentration, and Km is the substrate concentration at half the maximum velocity.
The TIR domain precipitates in PEG3350 and sodium citrate
5 µM TIR was incubated in Assay Buffer with PEG 3350 (0, 10, 17.5, and 25%; final concentration) or sodium citrate (0, 125, 250, 500, 750, and 1000 mM; final concentration) in duplicate at room temperature for 15 min. The precentrifugation control was removed and the remainder of the sample was centrifuged at 17,000 x g at 4 °C for 10 min. Following centrifugation, the supernatant was separated from the pellet and the pellet was resuspended in Assay Buffer with the respective concentration of PEG 3350 or sodium citrate. Samples were diluted 1:2 with gel loading buffer and run on an SDS-PAGE gel. Protein bands were stained by Coomassie and visualized on a BioRad Gel Doc EZ Gel Documentation System with Image LabTM Software. Representative images are shown.
Following resuspension of the pellet, all fractions were analyzed in the Fluorescent Assay. After the samples were aliquoted into the assay plate in duplicate, the enzymatic reaction was initiated with 1 mM ε-NAD and monitored every 15 s for 15 min. Fluorescence intensity was converted to ε-ADPR concentration using the ε-ADPR standard curve. Slopes of the progress curves yielded the velocities of the reactions, which were plotted in GraphPad Prism.
Effect of 1,6-hexanediol on TIR domain activity and precipitation
To evaluate the effect of 1,6-hexanediol on TIR activity, the Fluorescent Assay was performed in triplicate in the absence and presence of PEG 3350 or sodium citrate. For pure protein, 35 µM TIR (final concentration) was incubated in Assay Buffer at room temperature for 10 min with or without 2% 1,6-hexanediol (final concentration). For PEG 3350 or citrate, 2.5 µM TIR was incubated in Assay Buffer with 25% PEG 3350 or 500 mM sodium citrate (final concentrations) for 10 min at room temperature with or without 2% 1,6-hexanediol. The reactions were initiated with 1 mM ε-NAD and monitored for 15 min every 15 s. Using the ε-ADPR standard curve, fluorescence was converted to [ε-ADPR] and the reaction velocities (i.e., slopes of the progress curves) obtained. Velocities were normalized for enzyme concentration and these normalized velocities were plotted in GraphPad Prism.
To determine whether 1,6-hexanediol can alter TIR precipitation, 1,6-hexanediol was added either before or after TIR precipitation in duplicate. To assess whether 1,6-hexanediol disrupts TIR precipitation, TIR precipitates were formed first by incubating 10 μM TIR (final concentration) with 25% PEG3350 or 500 mM sodium citrate (final concentration) at room temperature for 15 min. 1,6-hexanediol (0, 1, or 2%; final concentrations) was added to the mixture and incubated at room temperature for an additional 10 min. The precentrifugation control was removed and the remaining mixture was centrifuged at 21,000 x g for 10 min at 4 °C. Supernatant fractions were removed, and the pellet was resuspended in Assay Buffer with the respective additive and concentration of 1,6-hexanediol. All fractions were run on an SDS-PAGE and stained with Coomassie Blue, and gels were imaged on a BioRad Gel Doc EZ Gel Documentation System with Image LabTM Software. Next, we determined if 1,6-hexanediol could prevent TIR precipitation. 10 µM TIR was incubated in Assay Buffer with 1,6-hexanediol (0, 1, or 2 %; final concentration) for 15 min at room temperature. 25% PEG 3350 or 500 mM sodium citrate was added to the TIR-buffer-hexanediol mixture and incubated further for 10 min. Controls were removed and the samples were centrifuged at 21,000 x g for 10 min at 4 °C. As before, supernatant fractions were removed, and pellet fractions were resuspended in Assay Buffer with respective additives and hexanediol concentrations. Fractions were analyzed by SDS-PAGE/Coomassie staining; representative images are shown.
Phase Transition Reversibility
To evaluate the reversibility of the TIR phase transition, 5 µM of TIR was mixed with Assay Buffer and 25% PEG 3350 or 500 mM sodium citrate in duplicate (final concentrations). Following a 15 min incubation period at room temperature, precentrifugation controls were removed and the sample remaining was centrifuged at 17,000 x g for 10 min at 4 °C. Supernatant fractions were separated from the pellet, which was resuspended in either Assay Buffer alone or Assay Buffer with respective additive. All fractions were analyzed for enzymatic activity in the Fluorescent Assay. Briefly, the precentrifugation, supernatant, and pellet fractions were aliquoted into the assay plates in duplicate and the reaction was initiated with 1 mM ε-NAD. Fluorescence was converted to [ε-ADPR] concentration with the ε-ADPR curve to yield the progress curves. The velocity of the reactions was taken as the slope of the line and the velocities were plotted in GraphPad Prism.
To validate the kinetic data, 10 µM TIR (final concentration) was incubated in Assay Buffer with either 25% PEG 3350 or 500 mM sodium citrate (final concentration) for 15 min at room temperature; control samples were incubated in Assay Buffer only. Samples were centrifuged at 21,000 x g for 10 min at 4 °C, after which the supernatant was separated from the pellet. The pellets from samples initially prepared with additives were resuspended in either Assay Buffer alone or Assay Buffer plus the respective additive; this was not necessary for the sample initially prepared without additive since the protein is primarily located in the supernatant in this case. After removing another control sample (Additive lanes on gel), the resuspended samples were centrifuged again at 21,000 x g for 10 min at 4 °C. As before, the supernatant was removed, and the pellet was resuspended in Assay Buffer with the respective additive. All samples were analyzed for protein content on an SDS-PAGE gel and stained with Coomassie Blue.
Effect of pH on TIR domain precipitation and kinetics
To determine the effect of pH on TIR precipitation, the experiments described above were carried out in duplicate at pH values from 4.5-9.0. Briefly, 5 µM TIR (final concentration) was mixed with Assay Buffer (50 mM buffer; 150 NaCl) with and without 25% PEG 3350 (final concentration); for pH 4.5-5, sodium acetate buffer was used; for pH 5.5-6.5, MES was used; for pH 7-9, Tris was used. The samples were incubated for 15 min at ambient temperature, at which point the samples were centrifuged at 21,000 x g for 10 min at 4 °C. The supernatant was removed, and the pellet was resuspended in either buffer alone or buffer with 25% PEG 3350 (final concentration); the presence or absence of 25% PEG 3350 and the buffer identity of the resuspension solution corresponded to the initial sample preparation. 10-µL 1 M Tris, pH 6.8 was added to each sample to neutralize the buffer before running on an SDS-PAGE gel and staining with Coomassie blue. Images of the gels were obtained on the BioRad Gel Doc EZ Gel Documentation System with Image LabTM Software. Representative images are shown. ImageJ was used to quantify the bands, which were plotted in GraphPad Prism.
Steady state kinetic analyses were also performed at each pH in 25% PEG 3350. A constant concentration of 2.5 µM TIR was used in these assays. Reaction components were mixed in quadruplicate and incubated at room temperature for 10 min before initiating the reaction with 0-2000 µM of ε-NAD (final concentration). Fluorescence intensity was monitored for 15 min every 15 s. Using the ε-ADPR standard curve, the fluorescence was converted to [ε-ADPR]. The velocity of the reactions was calculated from the slope of the progress curve at each ε-NAD concentration. Kinetic parameters were determined by fitting these velocities to the Michaelis Menten equation (Eq. 1) at each pH. The log of Km, kcat, and kcat/Km values were determined and plotted in GraphPad Prism.
Negative Stain Electron Microscopy
Negative stain EM on TIR (270 µg/mL) was performed in Assay Buffer (50 mM Tris, pH 8; 150 mM NaCl) with or without 500 mM sodium citrate. Samples were applied to glow-discharged, carbon- and formvar-coated copper grids and allowed to sit for 1 min and 30s before blotting excess liquid away. 1% uranyl acetate was used to fix the samples before image. Samples were images on a FEI Tecnai Spirit 12 microscope. The diameter of particles in the samples with citrate were analyzed in ImageJ.
TIR domain mutants
TIR domain mutants were made using PCR based methods. The pET30a+ TIR-1 TIR domain construct was used as a template (0.2-2 ng/µL; final concentration). The manufacturer’s protocol for iProofTM High-Fidelity DNA Polymerase (Bio-Rad Laboratories, Inc.) was followed using iProof HF buffer supplemented with 3% DMSO. 50-µL reaction volumes were used in the following protocol: initial denaturation for 3 min at 98 °C, denaturation for 45 s at 98 °C, annealing for 1:30 min at 45-72 °C, extension for 6 min at 72 °C, final extension for 10 min at 72 °C. Denaturation, annealing, and extension steps were repeated 30 times. The following day, DpnI was added to the PCR reactions and incubated at 37 °C for 2 h to digest the template DNA. The digest was transformed into chemically competent E. coli XL1-Blue cells. Transformants were grown overnight in LB media with 50 µg/mL kanamycin and mini-prepped (Promega). Mutagenesis was validated by Sanger sequencing (Genewiz). The mutants were expressed and purified as described for WT TIR.
Steady state kinetic analyses of the mutants were carried out in Assay Buffer with 25% PEG 3350 or 500 mM sodium citrate with 2.5 µM of the mutants (final concentrations). Reaction components were mixed in triplicate and incubated at room temperature for 10 min before initiating the reaction with 0-2000 µM of ε-NAD for PEG 3350 or 0-4000 µM for citrate. Fluorescence intensity was monitored for 17.5 min every 15 s. Using the ε-ADPR standard curve, the fluorescence was converted to [ε-ADPR]. The velocity of the reactions was calculated from the slope of the progress curve at each ε-NAD concentration and plotted in GraphPad Prism. Kinetic parameters were determined by fitting these velocities to the Michaelis Menten equation (Eq. 1) for each mutant.
To evaluate the precipitation capacity of TIR mutants, 10 µM (WT, G747P, E788Q, and H833A) or 3 µM (WT, E788A) of the enzyme was mixed with Assay Buffer (50 mM Tris, pH 8.0; 150 NaCl) with and without 25% PEG 3350 or 500 mM sodium citrate (final concentrations). Precipitation of the TIRE788A mutant was evaluated at 3 µM due to low yields of the protein; WT TIR at 3 µM was included as the proper control. The samples were incubated for 15 min at ambient temperature, at which point the samples were centrifuged at 21,000 x g for 10 min at 4 °C. The supernatant was removed, and the pellet was resuspended buffer with the respective additive (final concentration). Samples were diluted 1:1 with water before running on an SDS-PAGE gel. Stain free images of the gels were obtained on the BioRad Gel Doc EZ Gel Documentation System with Image LabTM Software. Representative images are shown. ImageJ was used to quantify the bands, which were plotted in GraphPad Prism.
Statistical Analyses
Differences in survival of C. elegans in the P. aeruginosa pathogenesis assays were determined with the log-rank test after survival curves were estimated for each group with the Kaplan-Meier method. OASIS 2 was used for these statistical analyses (84). qRT-PCR studies, intestinal CFU quantification, western blot band intensity quantification, TIR NADase activity, and TIR protein precipitation are presented as the mean ± standard error of the mean. Statistical hypothesis testing was performed with Prism 9 (GraphPad Software) using methods indicated in the figure legends. Sample sizes, mean lifespan, and p-values for all trials are shown in Table S2.
Data Availability
The mRNA-seq dataset is available from the NCBI Gene Expression Omnibus using the accession number GSE178572. All other data are available in the manuscript.

(A) An mRNA-seq experiment as described in Fig. 1D, except using a different nhr-8 mutant allele: nhr-8(ok186). (B) Images of T24B8.5p::gfp animals as described in Fig. 1F. (C) Images of T24B8.5p::gfp on agarose media with 0.1% Tergitol in the presence of supplemented fatty acids, as indicated. (D, E, F, G) Pathogenesis assay with P. aeruginosa and C. elegans of indicated genotypes at the L4 larval stage is shown. Data are representative of three trials. The Kaplan-Meier method was used to estimate the survival curves for each group, and the log rank test was used for all statistical comparisons. Sample sizes, mean lifespan and p-values for all trials are shown in Table S2. Scale bars in all images equals 200 μm. See also Fig. 1.

(A) Gene set enrichment analysis (GSEA) of p38 PMK-1 targets in the mRNA-seq experiment as described in Fig 2C, except using a different nhr-8 mutant allele: nhr-8(ok186). (B) Images of T24B8.5p::gfp animals, as described in Fig. 2F. (C) Images of the transgenic C. elegans, in which gfp has been fused to the DAF-16 protein under the indicated conditions. Scale bars in all images equals 200 μm. See also Fig. 2.

(A) qRT-PCR data of irg-4 in wild-type and mutant animals as described in Fig. 3C. (B) Immunoblot analysis of lysates from the indicated genotypes probed with an antibody that recognizes the FLAG epitope. (C) Images of T24B8.5p::gfp immune reporter containing the indicated genotypes. Scale bars in all images equals 200 μm. See also Fig. 3.
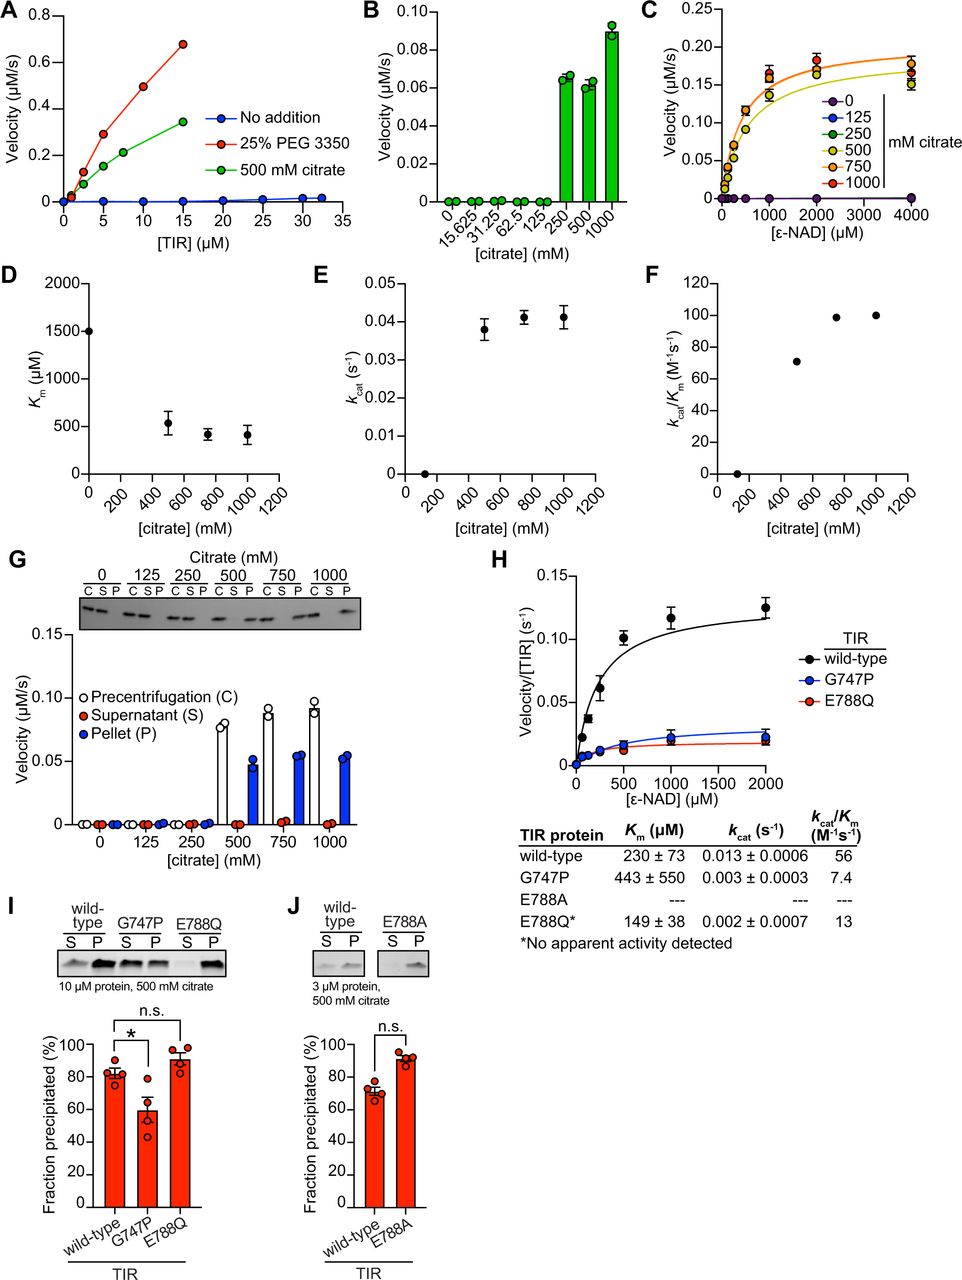
(A) Enzyme concentration dependence in presence and absence of either 25% PEG 3350 or 500 mM sodium citrate (n=2). (B) Dose dependence of TIR NADase activity on citrate concentration as described in Fig. 4C, except using citrate (n=2). (C) Steady-state kinetic analysis of TIR as described in Fig. 4D, except in the presence of citrate (n=2). (D-F) From the steady-state kinetic analysis performed in (C), Km (D), kcat (E), and kcat/Km (F) were determined at each citrate concentration. (G) Effect of citrate on TIR aggregation and associated activity as described in Fig. 4H (n=2, representative images shown). (H) Steady state kinetic analysis of TIR mutants as described in Fig. 4I, except in the presence of citrate (n=3). (I, J) Precipitation of TIR mutants as described in Fig. 4J and 4K, except in the presence of citrate (n=4, representative images shown). See also Fig. 4.
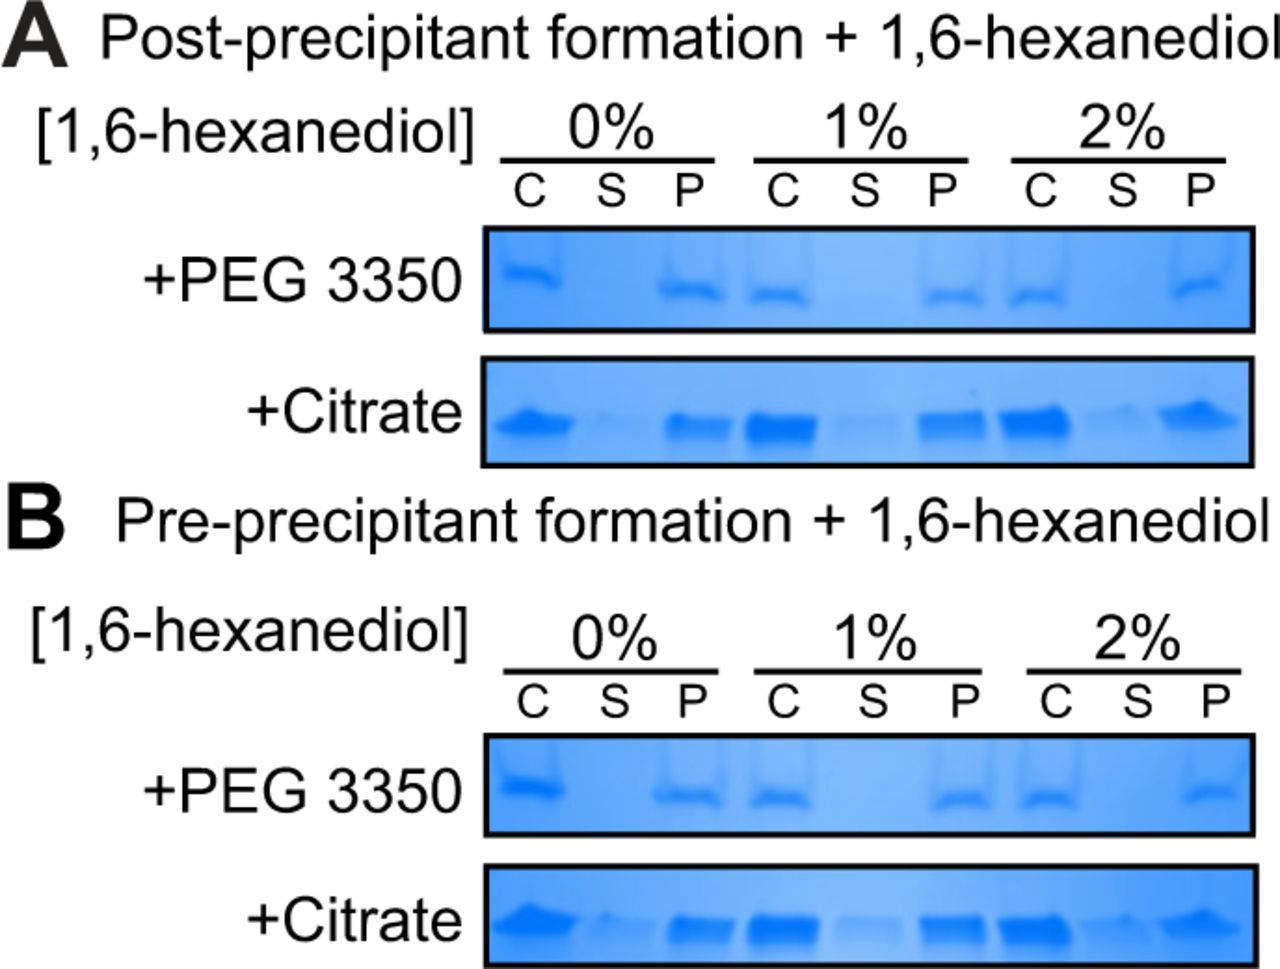
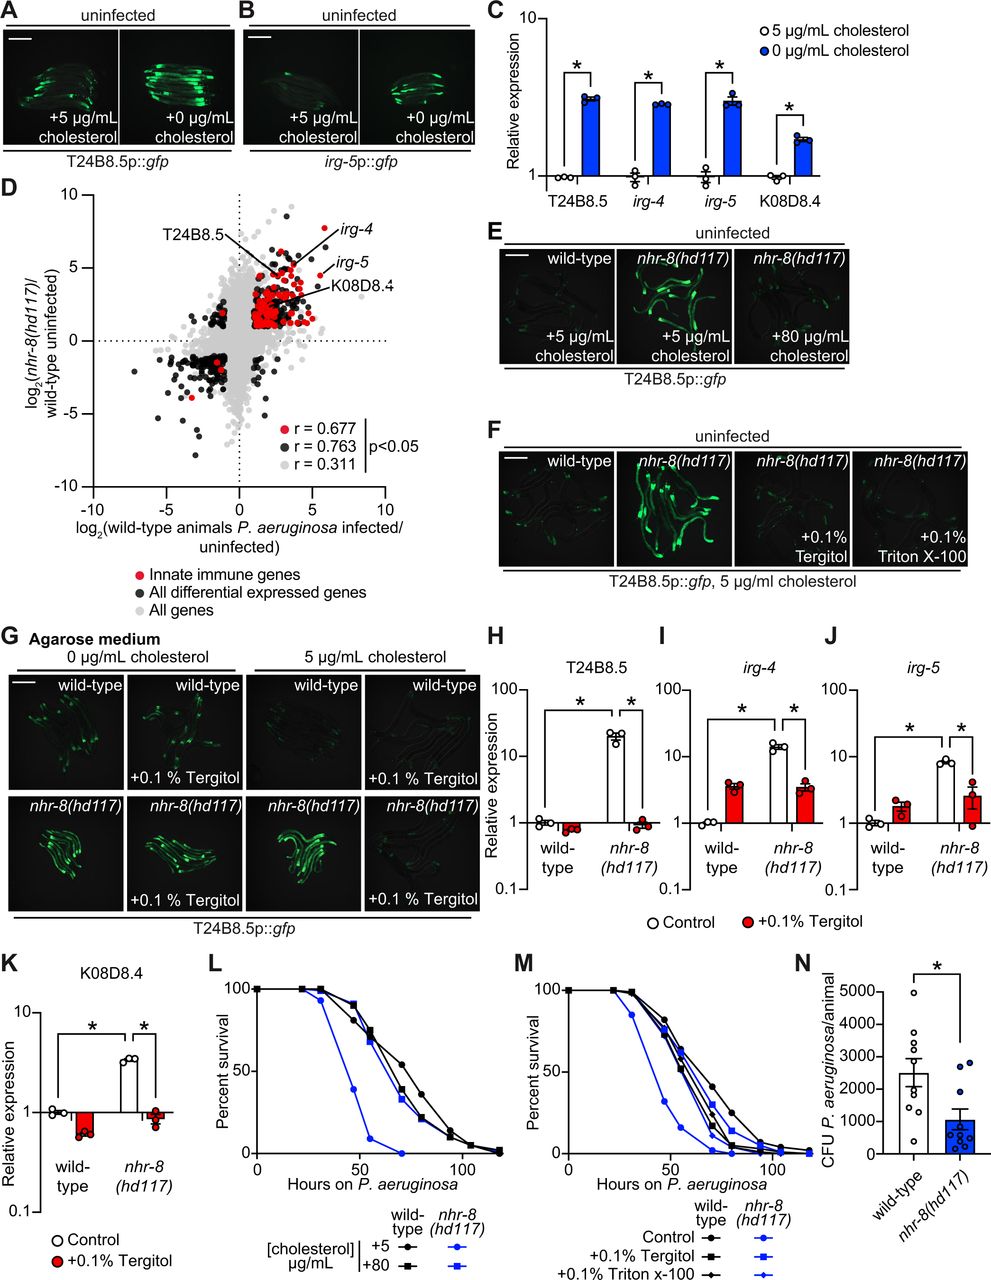
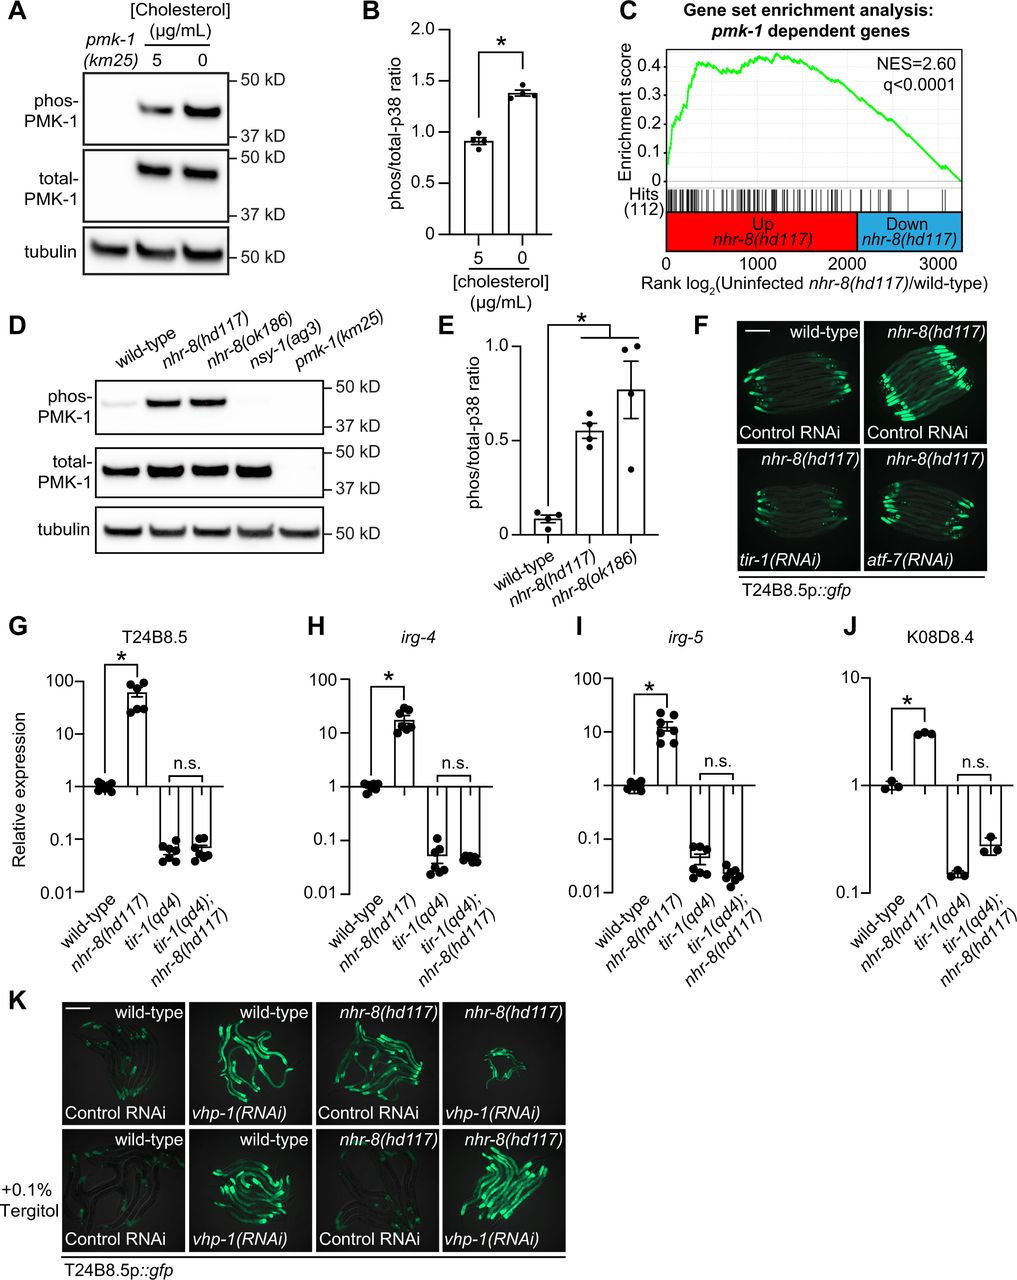
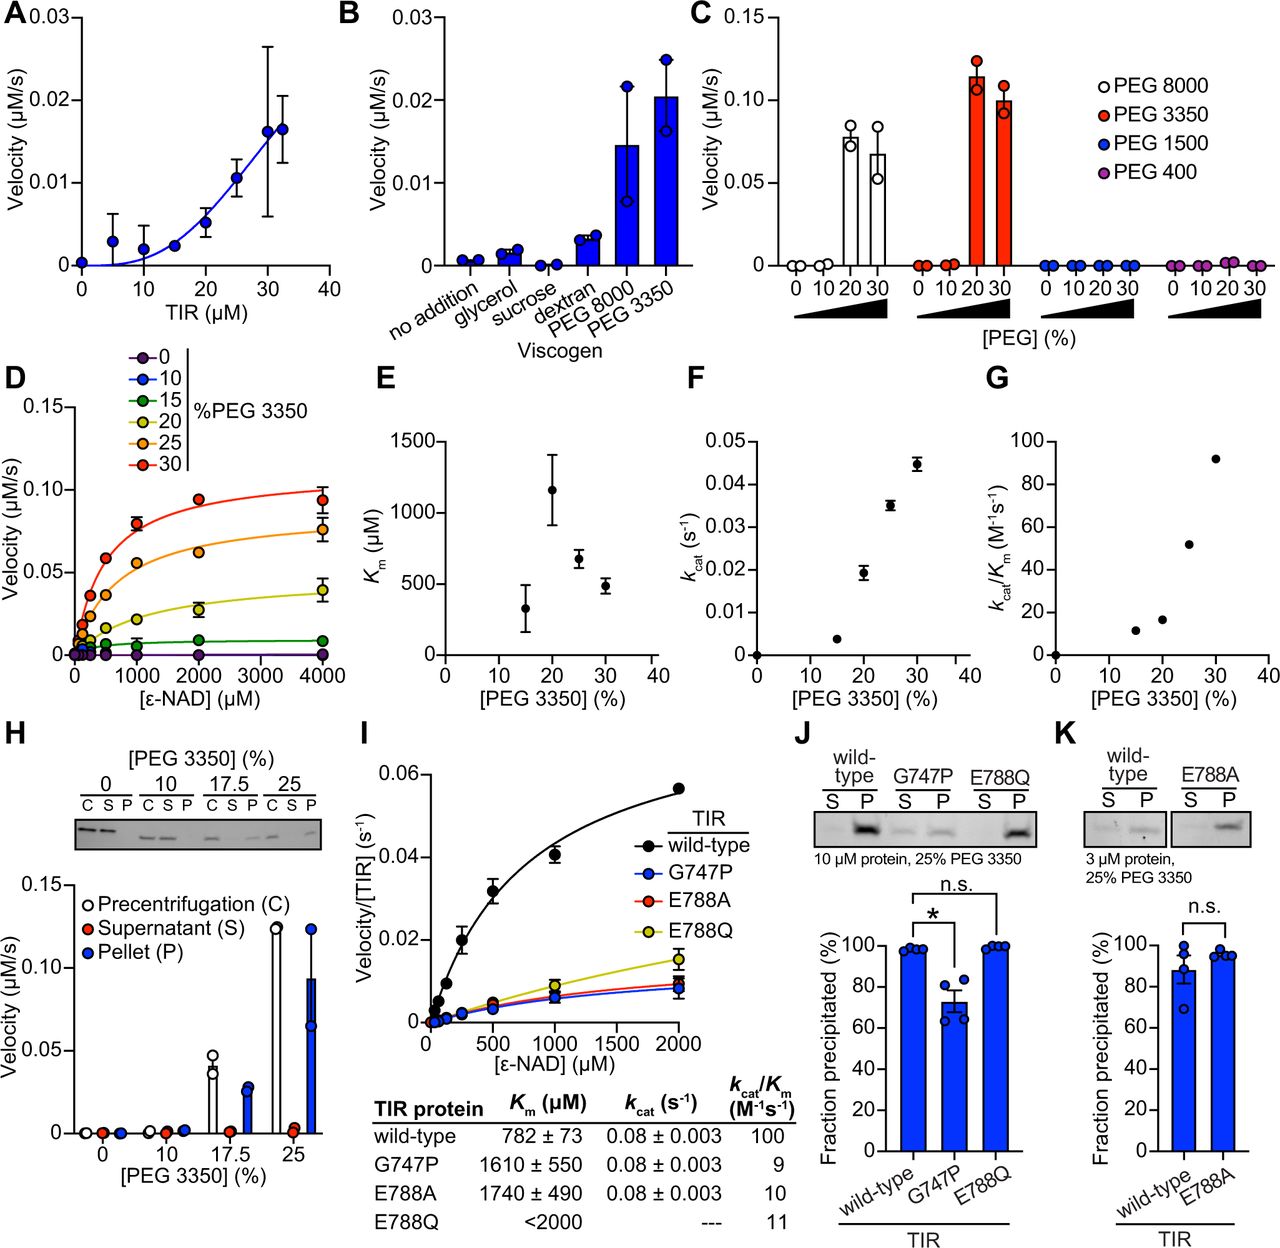
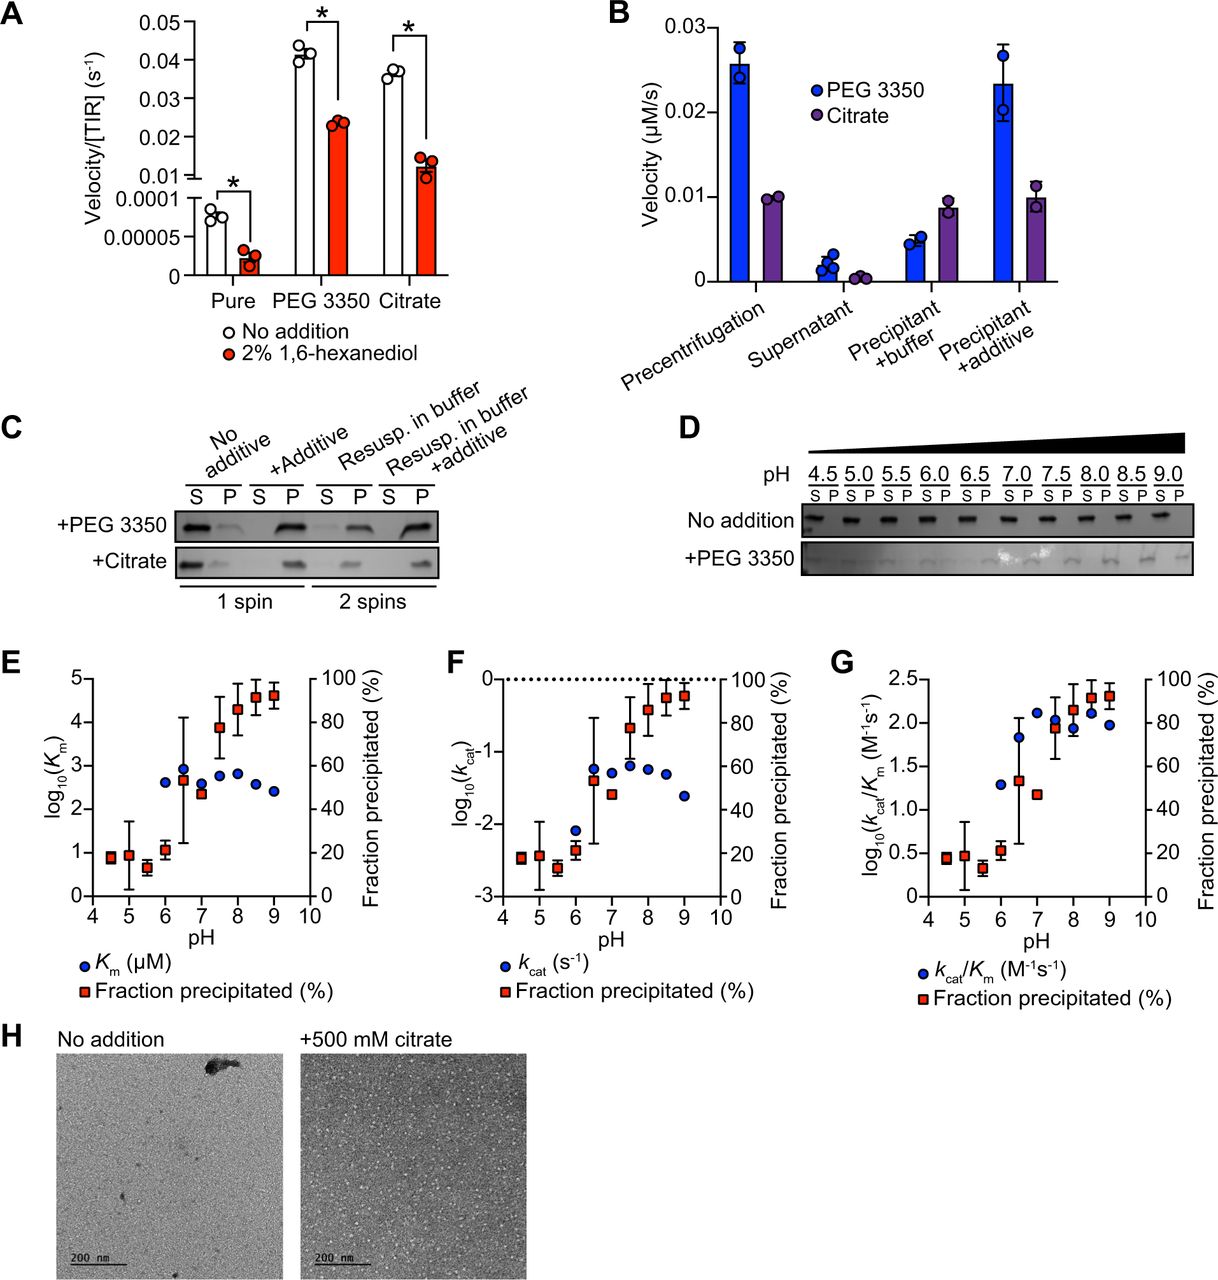
(A) SDS-PAGE analysis of TIR protein soluble (S) and pellet (P) fractions following TIR incubation first with 25% PEG 3350 or 500 mM citrate and subsequently addition of 2% 1,6-hexanediol (n=2, representative image shown). (B) SDS-PAGE analysis of TIR protein soluble (S) and pellet (P) fractions following TIR incubation first with 0 or 2% 1,6-hexanediol and subsequently addition of 25% PEG 3350 or 500 mM citrate (n=2, representative image shown). See also Fig. 5.
Supplementary Table S1. Genes differentially expressed in nhr-8(hd117) and nhr-8(ok186) mutants compared to wild-type in the RNA-seq experiment presented in Fig. 1D and S1A.
Supplementary Table S2. Sample sizes, mean lifespan, and p values for the C. elegans pathogenesis assays.
Supplementary Table S3. Genes in Cluster 1 and Cluster 2 of the heat map shown in Fig. 6F.
Supplementary Table S4. Primer, crRNA guide and ssODN sequences designed for this study.
Acknowledgments
ACKNOWLEDGEMENTS AND FUNDING SOURCES
The authors thank Alexandra Byrne, Victoria Czech, Lauren O’Connor, and Heather Loring for helpful discussions. The authors are also grateful to Melanie Trombly and Merin MacDonald for critical reading of the manuscript. This research was supported by R01 AI130289 (to R.P.W.), R21 AI163430 (to R.P.W.), an Innovator Award from the Kenneth Rainin Foundation (to R.P.W.), the Dan and Diane Riccio Fund for Neuroscience (to R.P.W. and P.R.T.), F30 AI150127 (to N.D.P.), T32 AI132152 (to N.D.P. and J.D.I.), T32 GM107000 (to N.D.P.), and R35 GM118112 (to P.R.T.). Some strains were provided by the Caenorhabditis Genetics Center, which is funded by the NIH Office of Research Infrastructure Programs (P40 OD010440).
REFERENCES
- 1.↵
- 2.↵
- 3.
- 4.
- 5.
- 6.↵
- 7.↵
- 8.↵
- 9.
- 10.↵
- 11.
- 12.↵
- 13.↵
- 14.↵
- 15.↵
- 16.↵
- 17.↵
- 18.
- 19.↵
- 20.↵
- 21.↵
- 22.↵
- 23.↵
- 24.↵
- 25.↵
- 26.↵
- 27.↵
- 28.↵
- 29.↵
- 30.↵
- 31.↵
- 32.↵
- 33.↵
- 34.↵
- 35.↵
- 36.
- 37.↵
- 38.↵
- 39.↵
- 40.↵
- 41.↵
- 42.↵
- 43.↵
- 44.↵
- 45.↵
- 46.↵
- 47.↵
- 48.↵
- 49.
- 50.
- 51.
- 52.↵
- 53.↵
- 54.↵
- 55.↵
- 56.↵
- 57.↵
- 58.↵
- 59.↵
- 60.↵
- 61.↵
- 62.↵
- 63.↵
- 64.↵
- 65.↵
- 66.↵
- 67.↵
- 68.↵
- 69.
- 70.↵
- 71.↵
- 72.↵
- 73.↵
- 74.↵
- 75.↵
- 76.↵
- 77.↵
- 78.↵
- 79.↵
- 80.
- 81.↵
- 82.↵
- 83.↵
- 84.↵


