

Abstract
Accurately recognizing other individuals is fundamental for successful social interactions. While the neural underpinnings of this skill have been studied extensively in humans, less is known about the evolutionary origins of the brain areas specialized for recognising faces or bodies. Studying dogs (Canis familiaris), a non-primate species with the ability to perceive faces and bodies similarly to humans, promises insights into how visuo-social perception has evolved in mammals. We investigated the neural correlates of face and body perception in dogs (N = 15) and humans (N = 40) using functional MRI. Combining uni- and multivariate analysis approaches, we identified activation levels and patterns that suggested potentially homologous occipito-temporal brain regions in both species responding to faces and bodies compared to inanimate objects. Crucially, only human brain regions showed activation differences between faces and bodies and partly responded more strongly to humans compared to dogs. Moreover, only dogs represented both faces and dog bodies in olfactory regions. Overall, our novel findings revealed a prominent role of the occipito-temporal cortex in the perception of animate entities in dogs and humans but suggest a divergent evolution of face and body perception. This may reflect differences in the perceptual systems these species rely on to recognize others.
1 Introduction
The ability to detect and recognize another individual is a socio-cognitive skill crucial for successful social interactions and survival. The face and body of another human or non-human animal convey a wealth of social information beyond their identity, such as when facilitating the correct categorization of another individual’s emotional state [1–7]. Consequently, accurate perception of faces and bodies is an important building block for social perception.
Therefore, the neural underpinnings of face and body perception have been studied extensively in humans. Decades of research revealed a predominant role of the occipito-temporal cortex for the perception of others with distinct, but adjacent regions specialized for face and body perception as part of the so-called ventral visual pathway [8–17]. While the ventrolateral visual cortex responds to animate compared to inanimate stimuli more generally [18–20], the sensitivity in the occipital face and extrastriate body area (lateral occipital cortex), as well as the fusiform face and fusiform body area (inferior temporal cortex) appear increased for faces or bodies [10,11,24–28,12,13,15–17,21–23]. Regarding the recognition of another individual’s species-identity, previous research suggests a preference for human faces compared to faces of other species (such as dogs or horses) [29, 30], potentially reflecting increased salience of conspecifics over heterospecifics.
The evolutionary history of the neural underpinnings of face and body perception has been mainly investigated by comparative research in non-human primates [23–27,31], and this has revealed a homologous visual pathway [e.g., 1 for review]. However, apart from primate species, the neural bases of this socio-cognitive ability and its potential origin in the mammalian brain remain largely unstudied. Dogs’ (Canis familiaris) ability to perceive and understand humans and conspecifics has already been well-investigated using behavioural and eye-tracking measures and yielded numerous comparable skills between dogs and humans. For example, dogs can not only differentiate between faces [32, 33], but even discriminate facial emotional cues of humans and conspecifics [7,34,35]; and they demonstrate complex behaviours such as visual perspective taking [36, 37]. Thus, dogs constitute an excellent model to study the evolution of visuo-social perception in mammals [38].
While first non-invasive canine neuroimaging studies [29,39–42] suggested an involvement of the temporal cortex in face perception, they triggered a debate on whether the occipito-temporal specialization for face perception in dogs matches that of humans [29,39–42]. Previous work reported increased activation for faces compared to objects [40, 42], scenes [40], or a mono-coloured surface [39], but not compared to other low-level visual controls (i.e., scrambled images [39, 40] or the back of the head [29]). Some studies lacked non-facial controls entirely [41]. Studies additionally investigating responses to con- and heterospecifics were inconclusive ranging from reports of increased responsiveness to dog stimuli in general (i.e., face and back of the head) but no specialization for faces [29], over separate brain regions specialized for human or dog faces [41], to no species-but general face-preference [40]. Further, no previous work investigated the neural bases of body perception. This is a major limitation, as bodies play an important role for social perception in general, but in particular for dogs - as indicated e.g., by dogs’ high responsiveness to emotional or ostensive-referential bodily cues, such as tail-wagging [43] or human gestures [43–45]. It is particularly noteworthy in this respect, that dogs even outperform humans’ closest living relatives, chimpanzees, in utilizing human ostensive cues [46].
Thus, the findings so far do not allow for a distinction between face and body or general animacy perception and are inconclusive regarding the influence of the other individual’s species-identity. The present comparative neuroimaging study aimed to resolve this debate. We performed the, to our knowledge, first systematic comparison of the neural bases of face, body and inanimate object perception in dogs and humans, in order to gain insights into how social perception has evolved in two phylogenetically distant mammalian species [38, 47].
2 Results
Fifteen awake and unrestrained pet dogs (Fig 1A) and forty human participants underwent functional magnetic resonance imaging (MRI) while viewing images of human and dog bodies, faces, inanimate objects (e.g., different toys), and grid-scrambled versions of these images serving as visual controls (Fig 1B). Over the course of two 5 min runs, participants saw 180 different images presented in a block design interspersed with an implicit visual baseline. We analysed the dog fMRI data with a newly developed analysis protocol shown to significantly improve neural signal detection power [48]. All statistical tests were corrected for multiple comparisons (see fMRI data analysis, Fig 2, Tables S2-S3).

(A) We obtained all imaging data using a 3T Siemens Skyra MR-system, equipped with a 15-channel human knee coil to scan the dog participants, and using a 32-channel human head coil for the human participants (not depicted). Dogs received extensive training [49] to stay motionless without restraints or sedation and could leave the MR scanner at any time via a custom-made ramp positioned at the scanner bed. All (dog and human) participants wore earplugs for noise protection and dog participants had an additional head bandage to secure optimal positioning of the earplugs throughout the scan session. (B) All participants viewed images of human and dog bodies, human and dog faces, inanimate objects (e.g., toys) or grid-scrambled versions of these images presented in a block design. (C) We split the data sets and used data from the first task run to compare activation for visual stimulation (all stimuli) to the visual baseline (i.e., the localizer data set). In both participant samples, we observed activation in the occipito-temporal cortices. These task-responsive voxels then served as a search space to determine individual functional regions-of-interest (fROIs), additionally constrained by bilateral anatomical regions (see Fig 2A). Results are displayed at p < 0.05, FWE-corrected at cluster-level using a cluster-defining threshold of p < .001 (dogs, Table S1), and p < 0.05 whole-brain FWE-corrected (humans; Table S1) Results for the dogs are overlaid onto a canine breed-averaged surface render [50], and onto the FreeSurfer “FsAverage” surface for humans (https://surfer.nmr.mgh.harvard.edu/fswiki). Anatomical nomenclature for all figures refers to the dog brain atlas from Czeibert and colleagues [51] and to the human brain atlas from the Laboratory for Neuro Imaging (LONI) Brain Atlas [52] (LPBA40; http://www.loni.usc.edu/atlases/). R, right; L, left; A, anterior; P, posterior; STS, superior temporal sulcus; MT, middle temporal visual area (V5); LOC, lateral occipital complex.

(A) Based on the localizer data set, we defined individual category-specific regions-of-interest (functional region-of-interest approach, fROI) within multiple anatomically constrained search spaces using the contrasts bodies > inanimate objects (body fROIs) and faces > inanimate objects (face fROIs). (B) From these individual fROIs, we then extracted activation estimates during the viewing of faces, bodies, inanimate objects and scrambled images (all compared to the implicit baseline) using the data from the independent test data set to test potential face- or body-sensitivity. (B) In dogs, we observed increased activation levels for faces and bodies compared to inanimate objects or scrambled images in three occipitotemporal regions (medial and caudal suprasylvian, ectomarginal gyrus) in face and body fROIs. However, no difference between faces and bodies except in the caudal suprasylvian face fROI. The face and body fROIs located in the occipito-parietal marginal gyri resulted in increased activation levels primarily for bodies. In humans, similar to dogs, we observed the strongest activation levels for faces and bodies in all fROIs. In contrast to the dog data, the human data analysis consistently resulted in a significant activation change for bodies compared to faces in body fROIs and vice versa (Table S2). Planned comparisons were corrected for multiple comparisons using Tukey method. *p < .05, **p < .01, ***p < .001, ***p < .0001, s.e.m., standard error of the mean; a.u., arbitrary units. Atlas maps and search spaces refer to the dog brain atlas from Czeibert and colleagues [51] and human parcels were retrieved from previous work [56]. A, anterior; P, posterior; S, superior; L, left; R, right
2.1 Mass-univariate analysis: Face- or body-sensitive areas in the occipito-temporal cortices of dogs and humans
To start out, we investigated whether dogs and humans have specialized cortical regions for face and body perception, and whether these regions responded differently to images of con- or heterospecifics. To this end, we used a standard functional region-of-interest analysis approach (fROI,[53–55]). We split the data into two orthogonal data sets, (1) a localizer data set (first task run) to define potential face- or body-sensitive areas in visual-responsive brain regions (Fig 1C, 2A) and (2) a test data set (second task run) to extract activation levels from these regions and to test potential category sensitivity. We chose this approach for two reasons. First, we aimed at directly testing the potential category-sensitivity, quantified by increased activation levels. Second, our goal was to account for differences in the location of activation peaks between individuals as reported in previous dog imaging studies [40, 42].
2.1.1 Functional regions-of-interest (fROIs)
For each participant, we defined bilateral fROIs within constrained search spaces to preserve spatial information (i.e., the rough anatomical location of activation peaks). For the human participants, we used previously reported anatomical regions known to be engaged in face and body perception [56]: the extrastriate body area, fusiform body area, occipital face area and fusiform face area (Fig 2A). For the dog participants, we could not build on previous research due to lack of shared template space and availability of data. Therefore, we first compared activation levels associated with the visual presentation of all stimuli compared to implicit baseline (i.e., white cross presented on grey background) using the localizer data set. This revealed task-responsive activation within the occipital-, splenial-, ectomarginal-, caudal-, medial suprasylvian- and marginal gyri, partially overlapping with results from previous studies investigating face perception [29,39–42,57,58] (Fig 1C, Table S1). We then used anatomical masks [51] of these regions as search spaces for the dog participants (Fig 2A). For comparison, we also report task-responsive voxels for the human participants, confirming involvement of the occipito-temporal cortex including the lateral occipital cortex and fusiform gyrus (Fig 1C, Table S1; see also Fig. S1 for schematic figures of the dog and human brain).
We then defined individual category-sensitive regions within each search space by selecting the top-10% voxels with the strongest activation for bodies or faces compared to inanimate objects based on the individual data from each participant.
2.1.2 Sensitivity for animate stimuli but sub-division in face- and body-sensitive regions exclusive to humans
Next, we extracted the mean activation signal during viewing of faces, bodies, inanimate objects and scrambled images (all compared to the implicit baseline) from the individual fROIs using the test data set. In dogs, we observed significantly increased activation levels for faces and bodies compared to inanimate objects or scrambled images in both face and body fROIs, located in the medial and caudal suprasylvian- and ectomarginal gyrus. In the caudal suprasylvian face- and ectomarginal body fROI, the increased activation for faces showed the same trend but did not always reach significance. We did not find consistent evidence for a further sub-division into face- and body-selective areas in the occipito-temporal cortex, as there was no significant activation difference between faces and bodies in seven out of eight fROIs. We only observed significantly increased activation for bodies compared to faces in the caudal suprasylvian face but not body fROI. The occipital and splenial face and body fROIs did not result in differential activation changes in response to any of the stimulus categories (Table S2). Regarding the parietal cortex, the marginal gyrus appeared solely responsive to bodies compared to all other conditions with no activation differences for faces compared to inanimate objects or scrambled controls (Fig 2B).
Results for the human participants confirmed earlier research [10,11,24–28,12,13,15–17,21–23] with the strongest overall activation levels for bodies in the extrastriate and fusiform body areas and for faces in the occipital and fusiform face areas (Fig 2B; Table S2). In summary, we found multiple occipito-temporal regions in the dog and human cortices responsive to animate stimuli, but detected a further sub-division into face- and body-sensitive regions exclusively in the human brain (see also Fig S1 for a summary of the results).
2.1.3 Conspecifics preference in human extrastriate body and fusiform face area
Next, we investigated whether processing of faces or bodies differed when participants saw images of con-compared to heterospecifics (Table S3). In humans, this revealed increased activation for human (mean: 4.46, SD = 1.83) compared to dog bodies (mean: 3.76, SD = 1.66) in the extrastriate body area (t(39) = 3.14, p = 0.003), as well as a general activation increase for human (mean: 1.89, SD = 0.87) compared to dog (mean: 1.64, SD = 0.81) stimuli in the fusiform face area (t(79) = 3.71, p < 0.0001). For the dogs, we did not find a difference between the perception of dog and human stimuli.
2.2 Multivariate pattern analysis of animacy perception
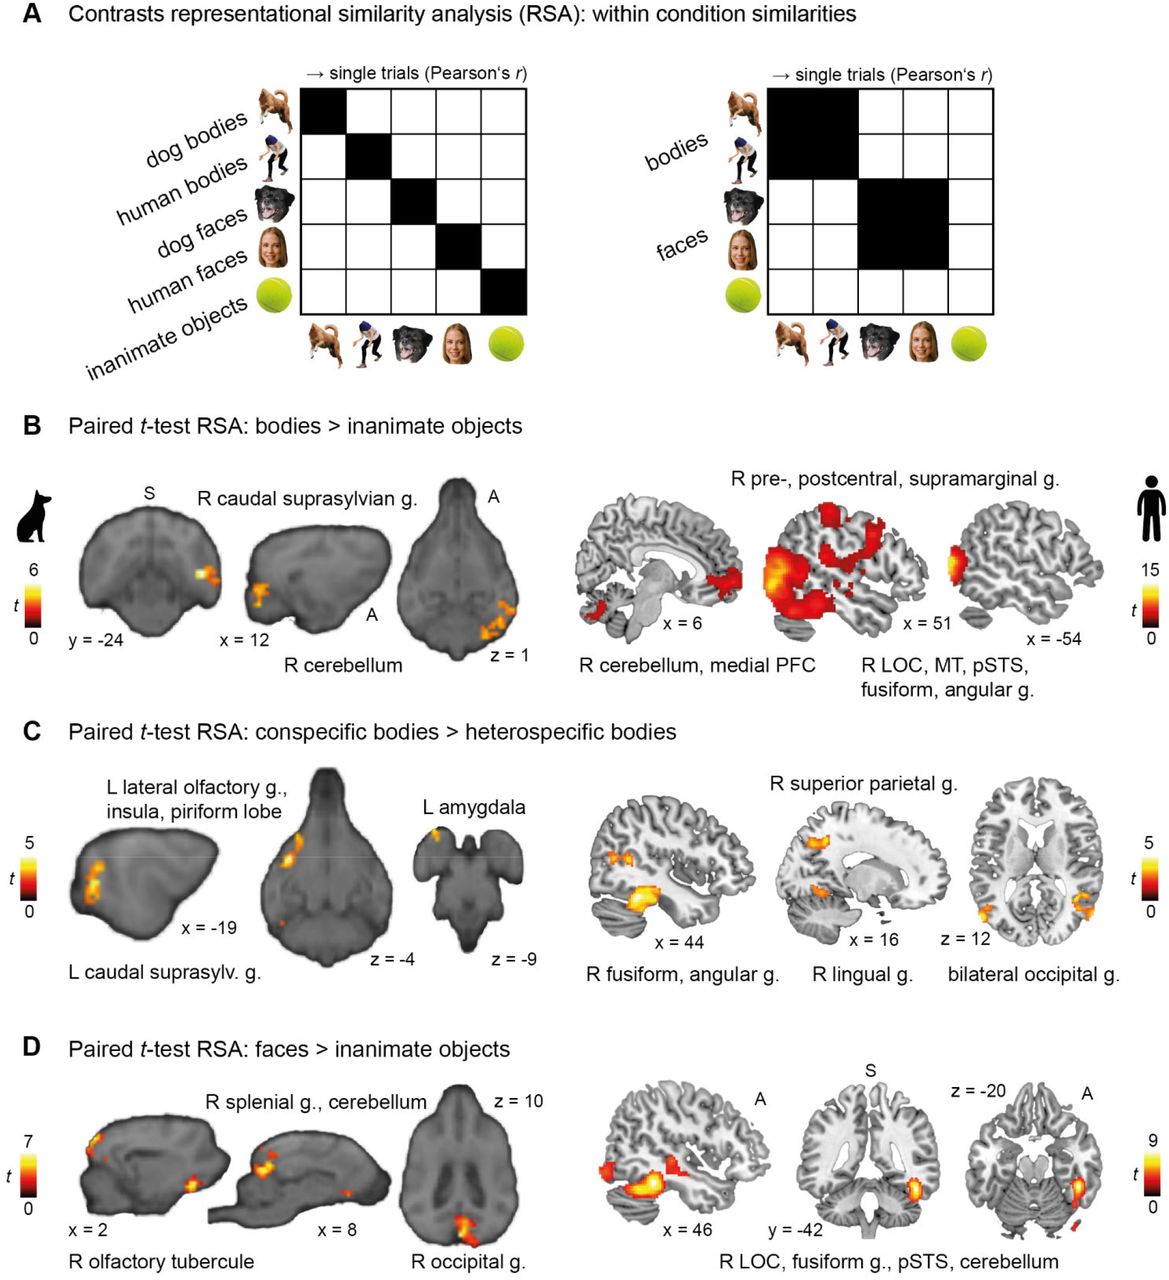
Despite the overall activation (measured using mass-univariate analyses) to stimulus categories may not differ, we reasoned that more fine-grained analyses of multivariate activation patterns could reveal distinctions [59]. Therefore, we investigated the neural representations of faces and bodies in dogs and humans and their potential correspondence using whole-brain representational similarity analyses (RSA). We moved a 4 and 8 mm searchlight across the whole dog and human brain, respectively, in order to determine individual pattern similarity maps between all trials of each stimulus category [60–62] (Fig 3A). On the group-level, we then conducted paired t-tests to compare the pattern similarities maps of (1) animate vs. inanimate stimuli, (2) bodies vs. inanimate objects, (3) faces vs. inanimate objects, (4) faces vs. bodies, and (5,6) within the face and body categories: images of conspecifics vs. heterospecifics (i.e., dog faces vs. human faces; dog bodies vs. human bodies).

(A) We moved a 4/8 mm (dog/human) spherical searchlight across the whole brain to quantify the neural patterns underlying stimuli categories. Pattern similarity matrices were computed across the respective quadrants marked in black. (B,D) In both species, we observed increased pattern similarity for bodies or faces compared to inanimate stimuli in higher-order visual areas in the occipito-temporal cortex and the cerebellum. (C,D) In dogs we additionally detected distinct neural patterns of activation for faces and conspecific (= dog) bodies in olfactory and limbic regions. In humans, we observed an increased pattern similarity for (conspecific) bodies in fronto-parietal regions associated with action perception [63–65]. All results are displayed at p < 0.05 FWE-corrected at cluster-level, and using a cluster-defining threshold of p < .005 for the dog and p < .001 for the human data (Tables S4-5). Anatomical locations are shown in panel B for the dog and in D for the human data: superior (S), anterior (A); all sagittal, coronal and axial planes displayed have the same orientation. Coordinates refer to a canine-breed averaged template [50] or to MNI space for the human data. Person’s r, correlation coefficient; t, t-value; g., gyrus; PFC, prefrontal cortex LOC, lateral occipital cortex; MT, middle temporal visual area (V5); pSTS, posterior superior temporal sulcus; R, right; L, left.
Results revealed increased (within-category) pattern similarity for animate compared to inanimate stimuli in the occipito-temporal cortex of dogs (i.e., caudal suprasylvian and splenial gyrus) and humans (i.e., middle occipital gyrus) overlapping with the identified fROIs. In human participants, we additionally observed increased similarity in the cerebellum and fronto-parietal regions (Tables S4-S5). In brief, this indicates distinct neural representations of animate compared to inanimate stimuli in higher-order visual regions of both species.
2.2.1 Similar and divergent neural representations for bodies and faces
Moving on to neural representations for bodies and faces, for bodies we observed increased pattern similarity compared to inanimate objects in higher-order visual areas in the occipito-temporal cortex, partially overlapping with the identified fROIs, and the cerebellum in both species (Fig 3B). Within the same regions (and again, in both species), we also observed distinct activation patterns for conspecific compared to heterospecific bodies. Furthermore, when the dogs viewed dog bodies, results revealed increased similarity in limbic structures and regions associated with olfaction (Fig 3C). In humans, we observed increased similarity for human compared to dog bodies in fronto-parietal regions associated with action perception [63–65] (Fig 3C).
Observing faces compared to inanimate objects resulted in significantly increased pattern similarity in occipito-temporal cortices of both species and again in dog olfactory structures (Fig 3D). Comparing similarity patterns for faces vs. bodies, we only found significant differences for the human participants (see Tables S4-5 for detailed results and Fig S1 for a schematic summary of the main results).
3 Discussion
Our findings revealed that the occipito-temporal cortex has a prominent role in the perception of animate entities in both dogs and humans. This suggests that the neural processing of animate vs. inanimate stimuli across mammalian brains may either have an old evolutionary origin in the common ancestors of canines and primates or is the result of convergent evolution [47]. However, within these regions, only humans displayed an additional sub-division into distinct face- and body-sensitive brain regions. Moreover, only dogs showed distinct responses to human and dog faces as well as dog bodies in olfactory areas (see Fig S1 for summary of the results). These findings suggest a divergent evolution of the neural bases of face and body perception (or processing) in dogs and humans. The differential engagement of visual and olfactory brain functions would fit particularly well with the differential sensitivity and preferential use of these perceptual systems to infer social and contextual information.
Detecting biological agents is crucial for survival and social relationships. Hence, the visual differentiation between animate vs. inanimate entities is an evolutionary important category representation. Studies show that dogs target animate agents when, for example, presented with images of wild animals, humans or dogs embedded in natural landscapes [66] or of social interactions between humans and dogs [67]. Further, dividing stimuli into an animate vs. inanimate dimension is one of the first visually salient categorizations formed by human infants [68]. In this way, animacy representation provides the first building block for more complex visual categorizations such as faces vs. bodies. Thus, considering its biological significance and the observed cross-species similarities in our study, animacy might constitute a general organizing principle across mammalian brains.
Behavioural [7,33,34,43,69–72] and imaging studies [57, 58] have also demonstrated that dogs are able to perceive facial and bodily cues of dogs and humans and display high responsiveness to ostensive-referential bodily cues [44,45,73,74], already as puppies [75]. Our results do not contradict these findings, but suggest that visual regions involved in the perception of faces are also involved in the perception of other body parts, and may thus encode animate stimuli. A recent dog neuroimaging study [76] also showed that the visual regions observed in our study play a crucial part in the perception of complex social interactions, which would confirm their important role for social perception.
While previous investigations of how dogs perceive bodies have mainly focused on the decoding of human referential cues, we hope that our work will inspire more research on how dogs perceive bodily social as well as emotional cues of con-as well as heterospecifics. The absence of a further sub-specialization for face vs. body perception in the occipito-temporal cortex of dogs might indeed indicate that dogs in comparison to humans focus more on whole body social cues rather than on specific sub-parts. This interpretation is notably well in line with a recent comparative eye-tracking study [77].
Regarding species perception, our results indicate an increased salience for human compared to dog stimuli in humans, but no evidence for a conspecific-preference in the occipito-temporal cortex of dogs. Thus, human and dog stimuli appear to be equally salient for dogs. This is in line with previous behavioural studies suggesting, for example, no significant difference in the perception of human or dog emotional facial [34], whole-body cues [77], or images of social interactions [67]. Further, two recent studies demonstrated that dogs, already as puppies, follow human gestural-communication and show an interest in human faces [75], which has not been observed in wolf puppies [78]. Additionally, half of the variation in these socio-cognitive skills could be accounted for by genetic factors, suggesting that dogs’ attention to humans might have been enhanced during domestication [75 for review of both studies]. Future studies investigating species-preferences in dogs might thus consider adding further heterospecific stimuli of other familiar species, such as cats.
In accordance with a potential divergent evolution of face and body representations in dogs and humans, we also observed distinct neural representations for faces (regardless of species) and conspecific (dog) bodies in dog olfactory regions. Although unexpected, these results might reflect dogs’ significantly higher olfactory sensitivity and its use to infer social and contextual information [54 for review]. However, the link between cognition and olfaction remains speculative since behavioural studies using olfactory cues so far mainly explored dogs’ odour and disease detection abilities (e.g., [81–85]), while dog imaging studies on olfaction focused on reward-processing [86, 87] or general sensory abilities [88–90]. However, a recent behavioural study investigating dog cognition using olfactory cues showed first evidence that dogs form representations of their owners when smelling their tracks [91].
In humans, results revealed distinct activation patterns for bodies in fronto-parietal regions that have been consistently associated with the perception of actions [63–65]. In dogs, we did not find activation in (pre-)motor cortices, but the increased neural sensitivity for bodies in the occipito-parietal marginal gyrus might be initial evidence for an analogous visual pathway to encode actions. However, this is beyond our study’s scope, and the precise neural underpinnings of action observation in dogs have not yet been investigated.
We have taken several steps to maximize neural signal sensitivity already when designing our study (e.g., by using a block design) and at the analysis stage (e.g., by using dog-tailored hemodynamic models increasing response detection power [48]). Nevertheless, the extensive training required for dogs [49] resulted in different sample sizes for the two species, and the more extensive prior work in humans [56] resulted in more constrained search spaces, and likely higher spatial sensitivity for the human data. Further, the majority (80%) of our pet dogs were pure-bred herding dogs, which prevented us from testing potential breed-specific differences and may limit generalizability.
In conclusion, our study reveals novel evidence for similarities and differences of animacy perception between two phylogenetically distant mammal species, advancing our understanding of the foundations of social cognition and behaviour. Finally, we provide insights into the differentially evolved sensory systems of dogs and humans for the perception of faces and bodies.
4 Materials and Methods
4.1 Participants
Fifteen pet dogs (Canis familiaris; 11 females, age range: 4-11 years, mean age: 7.8 years) consisting of 10 Border collies, 2 Australian shepherds, 1 Labrador retriever and 2 mixed-breed dogs and forty human participants (22 females, age range: 19-28 years, mean age: 23 years) participated in the present study.
Prior to MRI scanning, all dogs underwent initial medical examination concerning their eyesight and general health and received extensive training to habituate to the MRI environment [49]. They were fully awake, able to exit the MRI scanner at any time and equipped with noise protection (Fig 1A). All caregivers gave informed written consent to their dogs’ participation. Human participants were right handed, had normal or corrected-to-normal vision, they reported no history of neurological or psychiatric disease, nor phobia of dogs, fulfilled the standard inclusion criteria for functional MRI, and gave informed written consent to participate. Dog data collection was approved by the institutional ethics and animal welfare commission in accordance with Good Scientific Practice (GSP) guidelines and national legislation at the University of Veterinary Medicine Vienna (ETK-06/06/2017), based on a pilot study conducted at the University of Vienna. Human data collection was approved by the ethics committee of the University of Vienna (reference number: 00565) and performed in line with the latest revision of the Declaration of Helsinki (2013).
4.2 Task and procedure
We employed a block design (duration: 12 s) split in two 5 min runs where participants saw images of faces and bodies of dogs or humans, objects and scrambled versions of these images (5 images per block; Fig 1B, see below) on an MR-compatible screen (32 inch) positioned at the end of the scanner bore. Crucially, we used the same task for dogs and humans. Human participants were instructed to watch the images presented on the MR screen and dogs were trained to attend to the MR screen (passive viewing paradigm). Each run contained three blocks per condition, block order was randomized but the same condition was never presented twice in a row. Between blocks, participants saw a visual baseline jittered between 3-7 s with a white cross presented on a grey background. Image composition for each block and order within each block was randomized across participants to ensure effects are not driven by specific blocks; each image was presented once. The task was implemented using PsychoPy [92]. Overall motion and wakefulness were live monitored via the camera of an eye-tracker (Eyelink 1000 Plus, SR Research, Ontario, Canada) positioned below the MR-compatible screen. For the dogs, the trainer stayed within the scanner room but out-of-sight throughout the scan session to monitor and handle the dogs. Human participants saw both runs within a single scanner session with a short break in-between. For the dogs, the number of attempted sessions varied depending on how many repetitions they needed to complete one run without substantive motion and with sufficient attentiveness (i.e., eyes open and gazing towards the centre of the screen); in-between task runs the dogs always were given a short break outside the MR scanner. Realignment parameters were evaluated after each scan session. If overall motion exceeded 4 mm in any of the three translation directions, the dog was re-invited to repeat the run in a subsequent session and sessions were scheduled at least one week apart. On average, dogs needed three sessions to complete both runs. No data of the non-successful sessions were used for analysis.
4.2.1 Stimulus material
The stimulus set comprised 180 coloured images of faces and bodies of dogs and humans, everyday inanimate objects (e.g., a toy, a chair), and phase-grid scrambled versions of each category (30 images per condition) derived from Wagner and colleagues [93], the Hemera Photo-Object data base (Hemera Technologies) and the internet (see Fig 1B for examples). The images were resized to 600 × 600 pixels and presented in the centre of the MR screen on grey background. We cut out the heads off from the body images, as well as objects from body images (e.g., a coffee cup, a soccer ball). The images showed a variety of postures (e.g., jumping, looking up), neutral and positive emotional displays (e.g., sleeping, smiling) and viewing perspectives (e.g., from above, from a side angle). Luminance was set homogeneously across stimuli and we controlled for spatial extent (see supporting information for details).
4.3 MRI data acquisition
We acquired all MRI data with a 3T Siemens Skyra MR-system (Siemens Medical, Erlangen, Germany) and a 15-channel coil (initially designed for measurements of the human knee) for data acquisition in dogs and a 32-channel human head coil for data acquisition in humans. Functional scans of dogs used a 2-fold multiband (MB) accelerated echo planar imaging (EPI) sequence including the following parameters: voxel size = 1.5 x 1.5 x 2 mm3, repetition time (TR) / echo time (TE) = 1000/38 ms, field of view (FoV) = 144 × 144 × 58 mm3, flip angle = 61°, 20% gap and 24 axial slices covering the whole brain (interleaved acquisition, descending order). Structural scans had a voxel size of 0.7 mm isotropic (TR/TE = 2100/3.13 ms, FoV = 230 × 230 × 165 mm3) and were acquired in a separate scan session prior to functional data collection. Human functional scans were acquired using a 4-fold MB accelerated EPI sequence including the following parameters: voxel size = 2 mm isotropic, TR/TE = 1200/34 ms, FoV = 192 × 192 × 124.8 mm3, flip angle = 66°, 20% gap and 52 axial slices coplanar to the connecting line between anterior and posterior commissure (interleaved acquisition, ascending order). Additionally, we obtained field map scans to correct functional scans for magnetic field inhomogeneities using a double echo gradient echo sequence with the following parameters: voxel size = 1.72 x 1.72 x 3.85 mm3, TR/TE1/TE2 = 400/4.92/7.38 ms, FoV = 220 × 220 × 138 mm3, flip angle = 60° and 36 axial slices (same orientation as functional scans). Structural scans had a voxel size of 0.8 mm isotropic (TR/TE = 2300/2.43 ms, FoV = 256 × 256 × 166 mm3) and were acquired after functional data acquisition.
4.4 Data processing and statistical analysis
Imaging data was preprocessed and analysed using SPM12 (https://www.fil.ion.ucl.ac.uk/spm/software/spm12/), Matlab 2018b (MathWorks) and R 3.6.3 [94].
4.4.1 MRI data preprocessing
In both samples, we slice-time corrected (reference: middle slice) and realigned functional images to the mean image. Human imaging data was also unwarped using the acquired field map. Dog imaging data was manually reoriented with the rostral commissure set as a visual reference (SPM module: “Reorient images / Set origin”) to match the template orientation [50] and structural images were skull-stripped using individual binary brain masks created using itk-SNAP [95]. Next, we co-registered the structural and functional images to the mean functional image, segmented the structural images in both samples and normalized the human data to the Montreal Neurological Institute (MNI) template space and the dog data to a breed-averaged stereotaxic template space [50]. Normalized images were resliced to 1.5 mm isotropic and smoothed with a 3-dimensional Gaussian kernel (full-width-at-half-maximum, FWHM; with twice the raw voxel resolution: dogs/humans = 3/4 mm; see [48] for an in-depth description of our dog data preprocessing pipeline). We then calculated individual scan-to-scan motion (frame wise displacement, FD) and added motion regressors to first-level GLMs for each scan exceeding the a priori set FD threshold of 0.5 mm (motion scrubbing [96, 97]) to account for both translational and rotational displacements. For the dog participants, we removed on average 8% of the scans from each run (run 1: mean FD = 0.23 mm, 90th percentile = 0.36 mm; run 2: mean FD = 0.24 mm, 90th percentile = 0.38 mm) and 1% of the scans from each run of the human participants (run 1: mean FD = 0.17 mm, 90th percentile = 0.22 mm; run 2: mean FD = 0.18 mm, 90th percentile = 0.21 mm).
4.4.2 fMRI data analysis
Mass-univariate activation analysis
We analysed the functional data using a general linear model (GLM) approach implemented in SPM12. Individual GLM matrices included six regressors of interest for task (dog faces, dog bodies, human faces, human bodies, inanimate objects, scrambled) and the six regressors from the realignment procedure (see above) were added as nuisance regressors. All blocks were estimated using a boxcar function time-locked to the onset of each block with a duration of 12 s. For the dog data, the signal was convolved with a tailored dog haemodynamic response function [48] (HRF), while the standard human canonical HRF (i.e., the default HRF parameters provided by SPM12) was used for the human data. The dog HRF reflects a previously observed 2-3 s earlier peak of the BOLD signal than expected by the human HRF model [48]. Normalized, individual binary masks served as explicit masks and we applied a high-pass filter with a cut-off at 128 s. We then split the data in two sets (task run 1, task run 2). Based on the data from the first task run, we estimated three subject-level contrast maps for the difference between our conditions of interest (i.e., faces, bodies with equal weights for human and dog images) and objects, and a visual stimulation contrast (all conditions > implicit visual baseline). For the second task run, we computed eight subject-level contrasts, one for each task regressor (i.e., dog bodies, human bodies, dog faces, human faces, everyday inanimate objects, scrambled), averaged for faces (i.e., dog and human faces) and averaged for bodies (i.e., dog and human bodies) compared to implicit visual baseline.
Functional region of interest (fROI) approach
We implemented a standard functional region-of-interest (fROI, [53–55]) approach to investigate potential category-specificity of cortical regions. This approach allows us to directly test the potential category-sensitivity quantified by increased activation level while accounting for slight differences in the location of activation peaks between individuals as which have been reported in previous dog imaging studies [40, 42].
The participant-level contrast images from the first run served as localizer data to define individual category-sensitive regions. Within anatomically constrained search spaces (Fig 2A) we selected the top-10% voxel from each hemisphere with the strongest signal for the condition-of-interest (i.e., face areas: faces > objects, body areas: bodies > objects) to form bilateral individual fROIs. Selecting the top-10% voxel was an a priori decision we made because the resulting fROI sizes (on average: 30 voxels) were similar to the average cluster size observed in a previous dog imaging study that used two visual paradigms and the same smoothing kernel [48]. Further, percentages instead of absolute numbers took also the varying search space sizes into account (see supporting material and Fig S2-3 for more information). The data from the left out second task run allowed then to directly test potential category specificity in an independent data set. Thus, we extracted the activation levels from the conditions-of-interest contrasted against implicit visual baseline from both body and faces areas (= individual fROIs).
Group functional ROI analyses were performed running repeated measures analyses of variance (ANOVAs). First, we tested our main research question, whether the body areas resulted in increased sensitivity for bodies regardless of species and vice versa for faces, and added everyday objects and scrambled images as further conditions. Thus, we ran a one-way ANOVA with stimuli category (faces, bodies, everyday objects, scrambled) as dependent variable. Next, to investigate if there is a difference in activation between conspecific and heterospecific stimuli, we used 2 x 2 within-subjects ANOVAs (species: conspecific, heterospecific; image category: face, body). P-values for group comparisons investigating the same research questions were Bonferroni-adjusted, e.g., if the 6 potential body fROIs result in increased sensitivity for bodies compared to all other categories results in an adjusted p-value of 0.008 (= 0.05/6). Adjusted p-values are reported along with the results (Tables S2-3). For whole-brain group analyses, we tested significance applying a whole-brain familywise error (FWE) correction for the human data and a cluster-level inference with a cluster defining threshold of p < 0.001 and a cluster probability of p < 0.05 FWE corrected for multiple comparisons for the dog data. Cluster extent (i.e., minimum spatial extend to be labelled significant) was calculated using the SPM extension “CorrClusTh.m” (by Thomas Nichols, University of Warwick, United Kingdom, and Marko Wilke, University of Tübingen, Germany; https://warwick.ac.uk/fac/sci/statistics/staff/academic-research/nichols/scripts/spm/).
Representational similarity analysis
Next, we investigated the neural representations for faces, bodies and objects and their potential convergence in dogs and humans. To this end, we performed a whole-brain representational similarity analysis (RSA; [60–62]) to determine neural pattern similarities within image categories. GLMs were modelled identical to univariate GLMs (see above) but for each block, we ran a separate GLM with the block as task regressor and remaining blocks were combined in one regressor of no interest [98]; runs were modelled independently. Thus, the analysis resulted in 36 beta images for each participant (6 conditions × 6 trials). RSA was performed using the smoothed functional data. For all RSA analyses, we moved a spherical searchlight [99] (dogs: r = 4 mm, 81 voxel; humans: r = 8 mm, 251 voxel) throughout individual whole-brain grey matter masks computed based on the normalised segmentation output considering only searchlights with a minimum of 15 grey matter voxel for the dog and 30 for the human data.
Within a given searchlight, we extracted single-trial beta estimates from all voxels and sorted them according to their stimuli category (Fig 3A; dog / human bodies, dog / human faces, inanimate objects) and reshaped the data to a trial × voxel matrix. Next, we z-scored the data across trials and runs and computed a trial × trial similarity matrix by correlating each beta estimate of each trial to all other trial estimates. Finally, in order to retrieve overall similarity scores, we then Fisher’s z-transformed the data and calculated overall similarity matrices by averaging scores across the respective quadrants. We were specifically interested in pattern similarities across animate vs. inanimate (faces × bodies vs. inanimate objects), faces or bodies vs. inanimate objects, faces vs. bodies and conspecific vs. heterospecific species dimensions within face and body categories. We then assigned the overall similarity values to the centre voxel of each searchlight resulting in individual whole-brain pattern similarity maps.
On the group-level, we then used paired t-tests to compare the pattern similarities between trials of (1) faces vs. inanimate objects (i.e., [dog faces × human faces] vs. inanimate objects), (2) bodies vs. inanimate objects (i.e., [dog bodies × human bodies] vs. inanimate objects), (3) animate vs. inanimate images (i.e., [dog faces × human faces x dog bodies × human bodies] vs. inanimate objects), (4) faces vs. bodies (i.e., [dog faces × human faces] vs. [dog bodies × human bodies]), and (5,6) within the face and body categories: images of conspecifics vs. heterospecifics (i.e., dog faces vs. human faces; dog bodies vs. human bodies). We computed permutation tests [100] to determine group-level significance using the Statistical nonParametric Mapping (SnPm13) toolbox running 5000 permutations for each paired t-test and applied cluster-level inference with a cluster defining threshold of p < .005/.001 (dogs/humans) and a cluster probability of p < 0.05 familywise error corrected (FWE) for multiple comparisons.
Data visualization
Data was visualized using SPM12 (https://www.fil.ion.ucl.ac.uk/spm/software/spm12/), Matlab 2018b (MathWorks), itk-SNAP [95], R 3.6.3 [94] with mainly the packages ggplot2 [101] and RainCloudPlots [102] and the python project nilearn (http://nilearn.github.io).
5 Acknowledgments
We thank Prof. Nancy Kanwisher for her helpful comments on the preliminary results and analysis plan. We also want to thank Morris Krainz, Anna Thallinger, Olaf Borghi and Helena Manzenreiter for their help collecting the data, Boryana Todorova for her support in preparing the stimuli set and all the dogs and their caregivers and all human participants for taking part in this project. This project was supported by the Austrian Science Fund (FWF): W1262-B29 and by the Vienna Science and Technology Fund (WWTF), the City of Vienna and ithuba Capital AG through project CS18-012, and the Messerli Foundation (Sörenberg, Switzerland). The funders had no role in study design, data collection and analysis, decision to publish, or preparation of the manuscript.
6 CRediT authorship statement
Magdalena Boch
Conceptualization, Methodology, Software, Validation, Formal analysis, Investigation, Data curation, Writing - original draft, Writing - review & editing, Visualization, Project administration. Isabella C. Wagner: Conceptualization, Methodology, Resources, Writing - original draft, Writing - review & editing, Supervision. Sabrina Karl: Investigation, Writing - review & editing. Ludwig Huber: Conceptualization, Resources, Writing - review & editing, Supervision, Funding acquisition. Claus Lamm: Conceptualization, Methodology, Resources, Writing - original draft, Writing - review & editing, Supervision, Funding acquisition.
7 Declaration of Competing Interests
The authors declare no competing financial interests.
9 Supporting information
9.1 Stimulus material: luminance and spatial extent
Luminance was set to 100 for all images and background, grid-scrambled images were created based on images equally drawn from each category to control for potential low-level visual differences. Face and body images vary in spatial extent (= ratio image / background) due to their shape (mean values: faces = 58.53; bodies = 29.42; t(118) = 21.17, p < 0.0001), matching them in spatial extent would have required resizing the face images to half their size resulting in less ecologically valid images, but we matched dog and human images within the body and face categories (mean values faces: dogs = 58.55; humans = 58.50; t(58) = 0.03, p = 0.98; means bodies: dogs = 30.97; humans = 27.87; t(58) = 1.33, p = 0.19). Further, half of the object images were matched in spatial extent to either body (mean values: bodies = 29.42, matched objects = 29.86, t(73) = −0.17, p = 0.86) or face (mean values: faces = 58.53, matched objects = 57.23, t(73) = 0.78, p = 0.44) images and scrambled images were created based on images equally drawn from each category.
9.2 Anatomical search spaces
We localized face and body areas in restrained search spaces to also retrieve anatomically more precise information. For the dog participants, we could not build on previous research due to different template spaces or data unavailability and therefore selected all task-responsive gyri as search spaces. We determined them performing a group-level activation comparison entering the visual stimulation contrast (all conditions > implicit visual baseline) from the first task run in a second-level one sample t-test. Since the majority of significant clusters expanded across more than one anatomical region, we decided to not only select regions with a significant local maxima (Table S1, section “dog participants”, Fig 1C) but all gyri with visual responsive voxels. This resulted in six search spaces for potential face or body regions: medial suprasylvian, caudal suprasylvian, ectomarginal, occipital, marginal and splenial gyrus (Fig 2A). For the human participants, we used bilateral fusiform and occipital face area parcels as face area search spaces and bilateral fusiform and extrastriate body area parcels as body area search spaces derived from previous research [56]. Selecting the top-10% voxels resulted in the following functional region of interest (fROI) sizes for each hemisphere: medial suprasylvian gyrus (32 voxels), caudal suprasylvian gyrus (27 voxels), marginal gyrus (35 voxels; for one dog 23 voxels in the left hemisphere due to lower number of active voxels in contrast bodies > inanimate objects), ectomarginal gyrus (31 voxels), splenial gyrus (34 voxels) and occipital gyrus (23 voxels). For the human participants, selecting the top-10% voxels from each of the four parcels [56] resulted in the following fROI sizes: extrastriate body area (each hemisphere: 137 voxels), fusiform body area (left: 53 voxels; right: 102 voxels), occipital face area (left: 21 voxels, except one participant only had 15 active voxels, and another had no active voxels; right: 79 voxels), fusiform face area (left: 216 voxels, right: 241 voxels).
9.3 Supplemental figures
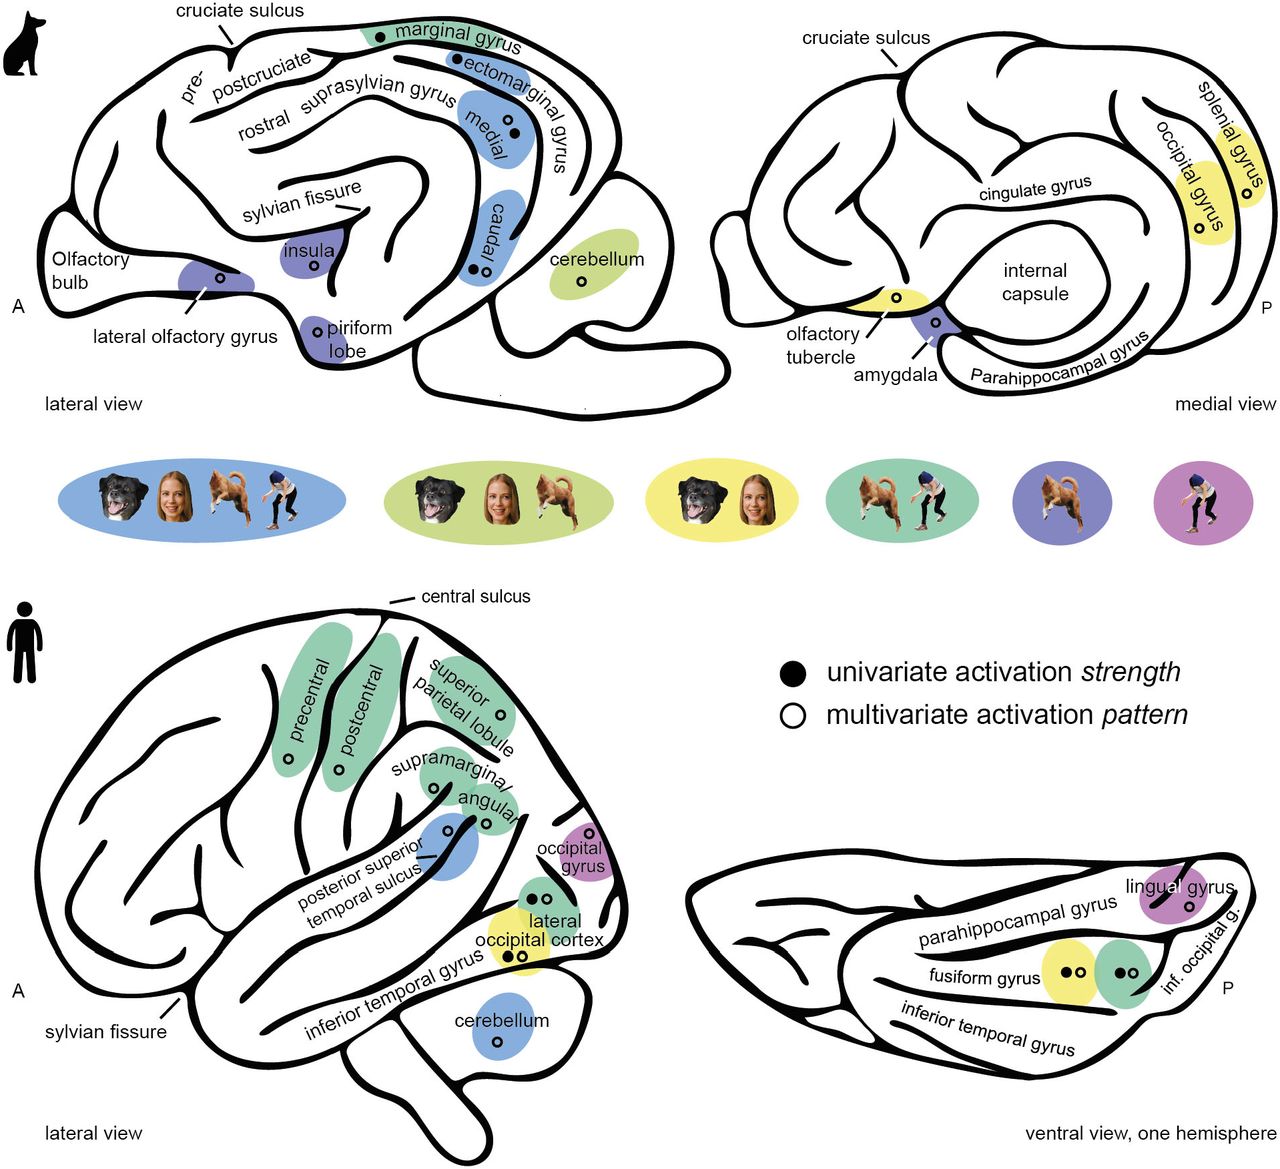
Results from the functional regions of interest (univariate activation strength) and representational similarity analysis (multivariate activation pattern) illustrating the results on schematic brain figures. For simplification, observed results are always summarized on one hemisphere; they do not mark the exact but the approximate anatomical location.

Individual fROIs were defined for faces (> inanimate objects) and bodies (> inanimate objects) within multiple anatomical search spaces (A-D) based on the data from localizer data set (i.e., first task run). The colour of the heat map indicates the amount of overlap between the fROIs of all dog participants. We observed slight individual differences in anatomical location between participants as indicated by a maximum overlap of N = 7 from overall 15 participants. The axial plane in panel A (top row) shows the anatomical locations posterior (P) and right hemisphere (R); all axial planes displayed have the same orientation. The sagittal plane displays the cut coordinates (z) and the anatomical locations superior (S) and anterior (A); z-coordinates refer to a canine-breed averaged template [50].

Individual fROIs were defined for faces (> inanimate objects) and bodies (> inanimate objects) within multiple anatomical search spaces (A-D) based on the data from the localizer data set (i.e. first task run). The colour of the heat map indicates the amount of overlap between the fROIs of all humans. We observed slight individual differences in anatomical location between participants as indicated by a maximum overlap of N = 30 from overall 40 participants. The axial plane in panel A shows the anatomical locations posterior (P) and right hemisphere (R); all axial planes displayed have the same orientation. The sagittal planes display the cut coordinates (z) and the anatomical locations superior (S) and anterior.
9.4 Supplemental tables
Task-related activation: localizer data set (task run 1)
Results from one-waya repeated measures analyses of variance (ANOVAs)
Results from 2 × 2a repeated measures analyses of variance (ANOVAs)
Dog data: Pattern similarity during face, body and object perception
Human data: Pattern similarity during face, body and object perception
Footnotes
↵+ These authors share senior authorship.
8 References
- 1.↵
- 2.
- 3.
- 4.
- 5.
- 6.
- 7.↵
- 8.↵
- 9.
- 10.↵
- 11.↵
- 12.↵
- 13.↵
- 14.
- 15.↵
- 16.
- 17.↵
- 18.↵
- 19.
- 20.↵
- 21.↵
- 22.
- 23.↵
- 24.↵
- 25.
- 26.
- 27.↵
- 28.↵
- 29.↵
- 30.↵
- 31.↵
- 32.↵
- 33.↵
- 34.↵
- 35.↵
- 36.↵
- 37.↵
- 38.↵
- 39.↵
- 40.↵
- 41.↵
- 42.↵
- 43.↵
- 44.↵
- 45.↵
- 46.↵
- 47.↵
- 48.↵
- 49.↵
- 50.↵
- 51.↵
- 52.↵
- 53.↵
- 54.
- 55.↵
- 56.↵
- 57.↵
- 58.↵
- 59.↵
- 60.↵
- 61.
- 62.↵
- 63.↵
- 64.
- 65.↵
- 66.↵
- 67.↵
- 68.↵
- 69.↵
- 70.
- 71.
- 72.↵
- 73.↵
- 74.↵
- 75.↵
- 76.↵
- 77.↵
- 78.↵
- 79.
- 80.
- 81.↵
- 82.
- 83.
- 84.
- 85.↵
- 86.↵
- 87.↵
- 88.↵
- 89.
- 90.↵
- 91.↵
- 92.↵
- 93.↵
- 94.↵
- 95.↵
- 96.↵
- 97.↵
- 98.↵
- 99.↵
- 100.↵
- 101.↵
- 102.↵


