

Abstract
Duchenne muscular dystrophy (DMD) affects myofibers and muscle stem cells (SC), causing progressive muscle degeneration and repair defects. It is not known whether dystrophic myoblasts—the effector cells of muscle growth and regeneration—are affected. Using a combination of transcriptomic, molecular and functional analyses we demonstrate, to our knowledge for the first time, convergent cell-autonomous abnormalities in primary mouse and human dystrophic myoblasts. In Dmdmdx mouse myoblasts lacking full-length dystrophin transcripts, expression of 170 other genes was significantly altered. Myod1 (p=2.9e-21) and key muscle genes controlled by MyoD (Myog, Mymk, Mymx, epigenetic regulators, ECM interactors, calcium signalling and fibrosis genes) were significantly downregulated. Gene ontology enrichment analysis indicated significant alterations in genes involved in muscle development and function. These transcriptomic abnormalities translated into increased proliferation (p=3.0e-3), reduced chemotaxis towards both sera-rich (p=3.8e-2) and cytokine-containing medium (p=1.0e-2), and significantly accelerated differentiation in 3D organotypic cultures. These altered myoblast functions are essential for muscle regeneration. The defects were caused by the loss of expression of full-length dystrophin as strikingly similar and not exacerbated alterations were also observed in dystrophin-null Dmdmdx-βgeo myoblasts. Corresponding abnormalities were identified in human DMD primary myoblasts and in an established dystrophic mouse muscle (SC5) cell line, confirming universal, cross-species and cell-autonomous nature of this defect. These results demonstrate the disease continuum: DMD defects in satellite cells cause myoblast dysfunctions diminishing muscle regeneration, which is essential to counteract myofiber degeneration. Contrary to the established belief, our data identify myoblasts as a novel and important therapeutic target for treatment of this lethal disease.
Introduction
Duchenne muscular dystrophy (DMD) is a debilitating and lethal neuromuscular disorder caused by mutations in the DMD gene located on the X chromosome 1. Diagnosis is made between the age of 2 and 5, loss of ambulation occurs around 12 and young adults die due to respiratory and/or cardiac failure2.
DMD is the largest human gene known 3: Three full-length transcripts encode 427 kDa proteins, while further intragenic promoters drive expression of progressively truncated variants. Dp427 and the dystrophin-associated protein complex (DAPC) are important for the functional development of differentiating myotubes 4 and subsequently prevent contraction-induced injury in the mature muscle5.
Several studies showed that the ablation of dystrophin in fully differentiated myofibres did not trigger their degeneration 5,6, and even that myofibres can function entirely without dystrophin 7,8.
In fact, DMD pathology is active prior to diagnosis: delays in the attainment of motor and non-motor milestones are discernible in 2 months old DMD babies 9 and transcriptomes of muscles from asymptomatic DMD patients revealed typical dystrophic abnormalities 10. Studies of human foetuses 11–13 and various animal DMD models, including GRMD dogs 14, Sapje zebrafish 15 and Dmdmdx mouse embryos16 revealed that pathology starts already in prenatal development.
Indeed, in skeletal muscle lineages modelled in human DMD pluripotent stem cells, we have recently demonstrated marked transcriptome and miRNA dysregulations identifiable even before muscle specialisation 17. These data, combined with the existence of the specific embryonic dystrophin Dp412e 18, substantiate the early disease manifestations in muscle precursor cells.
Importantly, there is increasing evidence that dysregulation of myogenic cells is behind muscle pathology and disease progression in adult DMD muscle. However, the mechanism(s) remain(s) to be elucidated and, given the interaction of myogenic and inflammatory cells in muscle regeneration 19, distinguishing the primary and the secondary consequences of dystrophin deficiency is crucial for development of effective therapies.
Helen Blau proposed that DMD is intrinsic to the undifferentiated myoblast 20. This hypothesis was initially discounted 21, but there is new evidence that DMD mutations produce a range of cell-autonomous abnormalities in both human and mouse myogenic cells from adult muscles 22–25.
If DMD directly affects myoblasts, cells that are key to muscle regeneration, a better definition of the consequences of the loss of DMD gene expression could help identifying early disease biomarkers and establishing better therapeutic targets.
Herein, using a combination of RNA-Seq, molecular and functional approaches, we compared the dystrophic and healthy myoblasts isolated from skeletal muscles of the commonly used Dmdmdx mouse model.
While Dmdmdx represents the loss of full-length (Dp427) dystrophin’s expression, which reflects the molecular defect affecting the majority of DMD patients, Dp71 is present in regenerating muscles and specifically in myoblasts 26. Yet, little attention has been given to the DMD pathology in dystrophin-null individuals. We have recently described exacerbated pathology in Dmdmdx-βgeo mice lacking all dystrophins 27. Therefore, we also investigated consequences of the total loss of Dmd expression in Dmdmdx-βgeo myoblasts 28.
Finally, we compared transcriptomic alterations in mouse and human dystrophic myoblasts to identify defects occurring across species.
We report that the absence of expression of the full-length dystrophin triggers major transcriptomic and functional abnormalities in myoblasts. These abnormalities are cell autonomous, as they persist in myogenic cells maintained long-term in culture. Importantly, key alterations are common between mouse and human myoblasts.
Results
Transcriptomic alterations in proliferating Dmdmdx myoblasts
Total RNA extracted from primary myoblasts isolated from gastrocnemii of 8 week old male Dmdmdx, Dmdmdxβgeo and control mice was subjected to RNA-Seq and analysed for the differential expression of genes between groups and the enrichment of GO categories in the generated lists of differentially expressed genes.
Bioinformatic analysis of the RNA-Seq data showed the impact of the Dmdmdx allele on the primary myoblast transcriptome. Sample-based hierarchical clustering clearly segregates genes into two groups corresponding to genotypes (Figure 1a) and a volcano plot illustrates the presence of a substantial number of significantly dysregulated genes (Figure 1b; Table S1).

a) Sample-based hierarchical clustering heatmap based on the top 500 genes with the highest standard deviation for Dmdmdx vs. WT based on RNA-Seq data. Colour represents dissimilarity between samples, based on the Euclidean distance, from dark blue (0) for identical samples to white (40) for the most distinct.
b) Volcano plot for Dmdmdx versus WT primary mouse myoblast differential gene expression analysis. Circles represent individual genes, with colour representing significance and direction of dysregulation (blue-significantly downregulated; red-significantly upregulated; black-not significantly dysregulated). Circle position represents fold change on a log2 scale for the x-axis and adjusted p-value on a −log10 scale for the y-axis. Horizontal dotted line represents the threshold of an adjusted p-value of 5.0e-25.0e-2 or lower while the vertical doted lines represent the threshold for the absolute log2 fold change of 1.
c) Clustered heatmap of genes of interest from the dysregulated gene list of Dmdmdx vs. WT primary myoblasts. Colour represents the z-score such that each gene has a mean of 0 and standard deviation of 1 to allow direct comparisons.
Expression of 170 genes was found to be significantly up- or down-regulated more than 2-fold when comparing Dmdmdx and WT primary mouse myoblasts (Table S1). Among these, Myod1 and Myog, key coordinators of skeletal muscle development and repair, were found to be downregulated in dystrophic myoblasts and their downregulation was confirmed by qPCR (Figure S1). Pax3 and Pax7 transcriptional regulators 29 were also individually investigated, with Pax3 levels confirmed as significantly downregulated by qPCR (Figure S1). Analysis identified downregulation of further important regulators and effectors of the muscle program (Figure 1c; Table S1) such as Mymx and Bex1, known to be regulators of muscle repair 30. Des, a structural component of myofilaments, and Itga7, the primary laminin-1 receptor of myoblasts and mature fibres were also found to be significantly downregulated (Figure 1c; Table S1).
The H19 gene, defined as promoting differentiation 31, was found to be significantly downregulated in proliferating Dmdmdx myoblasts (Figure 1c; Table S1), which combined with reduced expression of aforementioned muscle program markers, as well as myogenic differentiation markers such as Acta1, Actc1, Actn3, Atp2a1 and upregulation of Nov, known to inhibit myogenic differentiation 32, imply an altered readiness of dystrophic myoblasts to differentiate. Moreover, numerous genes encoding histones and Smyd1 33 and Hmga1 34,35 regulators of chromatin organisation/chromatin interacting proteins, were found to be significantly dysregulated in dystrophic myoblasts (Figure 1c; Table S1). Taken together, these gene expression changes indicated an increased readiness of dystrophic myoblasts to proliferate, compared to their WT counterparts.
Several genes key to myoblast-extracellular matrix interactions and fibrosis were found to be significantly dysregulated in Dmdmdx myoblasts (Figure 1c; Table S1), including: Mmp3, Mmp9 and Mmp10 metalloproteases, collagen genes (Col2a1, Col4a1, Col4a2 and Col8a2), Lrrn1 a transmembrane protein interacting with fibronectin 36 as well as genes encoding fibronectin itself (Fn1) and decorin (Dcn). The latter promotes proliferation and differentiation in myoblasts 37 but also has a role in collagen assembly and mineralisation 38.
Finally, calsequestrins (Casq1 and Casq2) (Table S1) were significantly downregulated, in line with previous observations in the dystrophic muscle 39.
No exacerbation of transcriptomic alterations in the dystrophin-null Dmdmdx-βgeo compared to Dmdmdx myoblasts
Corresponding bioinformatic comparison of Dmdmdx-βgeo vs. Dmdmdx myoblast transcriptomes found no substantial difference between them, as illustrated by sample clustering (Figure 2a) and volcano plot (Figure 2b), with no segregation between groups. Only 11 genes were found to be significantly differentially expressed between the two genotypes. Of these, 6 are pseudogenes, 1 is a processed transcript and only 4 are protein coding genes (Igf1, Npr3, Postn and Capn6). None of these genes have a higher log2 fold change than 1.7 and the adjusted p-values have an average of 1.0e-2 compared to 9.6.10−3 for the genes found to be significantly differentially expressed between Dmdmdx and WT myoblasts.

a) Sample-based hierarchical clustering heatmap based on the top 500 genes with the highest standard deviation for Dmdmdx-βgeo vs. Dmdmdx Colour represents dissimilarity between samples based on the Euclidean distance, from dark blue (0) for identical samples to white (40) for the most distinct. Note the absence of sample segregation into two groups corresponding to genotypes.
b) Volcano plot for Dmdmdx-βgeo vs. Dmdmdx primary mouse myoblast differential gene expression analysis. Circles represent individual genes, with colour representing significance and direction of dysregulation (blue-significantly downregulated; red-significantly upregulated; black-not significantly dysregulated). Circle position represents fold change on a log2 scale for the x-axis and adjusted p-value on a −log10 scale for the y-axis. Horizontal dotted line represents the threshold of an adjusted p-value of 5.0e-2 or lower while the vertical doted lines represent the threshold for the absolute log2 fold change of 1.
c) log2 fold change values (Dmdmdx versus WT on the x-axis and Dmdmdx-βgeo versus WT on the y-axis) for genes significantly dysregulated in one or both dystrophic primary mouse myoblasts vs. WT. Pearson’s correlation coefficients (r) and p-value are shown. Green circles represent genes significantly dysregulated in Dmdmdx-βgeo vs. WT, blue circles represent genes significantly dysregulated in Dmdmdx vs. WT and red circles represent gernes significantly dysregulated in both.
Interestingly, comparison of the Dmdmdx-βgeo to the WT transcriptome returned fewer (81) (Table S2) significantly differentially expressed genes than Dmdmdx versus WT (170) (Table S1). However, comparison of the fold changes between the two analyses (Figure 2c) revealed that the two models show strikingly similar alterations with a strong, significant correlation (r = 0.9418, p< 1.0e-4) in the log2 fold changes for genes significantly altered in Dmdmdx versus WT and/or Dmdmdx-βgeo versus WT analyses (Figure 2c).
MyoD dependent downregulation of gene expression in dystrophic myoblasts
Lists of genes altered in dystrophic myoblasts were analysed for common patterns of transcriptional regulation. Overrepresented transcription factor binding sites (TFBS) on promoter regions of the dysregulated genes were examined using the seqinspector tool and available ChIP-Seq data 40. Genes found downregulated in Dmdmdx had increased ChIP-Seq signal at the TFBS for four transcription factors: MyoD (adjusted p-value: 2.9e−21, track GEO accession GSM915165), TCF12 (1e−19, GSM915178), MYOG (5.6e−19, GSM915164) and TCF3 (adjusted p-value 3.3e-3, GSM915177) (Figure 3; Table S3B). A range of genes, including Mymk, Mymx, Chrna1 and Acta1 showed a binding signal at their TFBS above the background of at least three out of four of these overrepresented TFs (Figure 3b; Table S3C). Furthermore, transcripts downregulated in Dmdmdx-βgeo also exhibit overrepresentation of MyoD binding sites (Table S3E). In contrast, genes upregulated in any cell type under investigation did not show any statistically significant overrepresentation of the binding signal of any TF (Table S3A and D).

Averaged ChIP-Seq signal histograms for each of the significantly overrepresented TFBS in downregulated genes. Histograms are centred around the transcription start site (TSS) of each gene. x-axis – distance upstream and downstream from the TSS of each gene, y-axis - ChIP-Seq signal for each location averaged for all gene promoters in the submitted list; red line - downregulated genes, blue line - upregulated genes, green line - reference signal (based on 1000 random gene promoters); Bonferroni-corrected p-value of TF signal overrepresentation vs reference: *** < 1.0e-3; ** < 1.0e-2.
a) MYOD (adjusted p-value: 2.9e−21, track GEO accession GSM915165), b) TCF12 (1e−19, GSM915178), c) MYOG (5.6e−19, GSM915164); d) TCF3 (0.0033, GSM915177); e) Heatmap of normalised TF-binding signal for each of the TFs overrepresented in genes downregulated in Dmdmdx myoblasts. Genes that did not show significant binding above background (as provided by the seqinspector tool) were assigned TF binding signal of 0.
GO enrichment analysis indicates significant functional alterations in dystrophic myoblasts
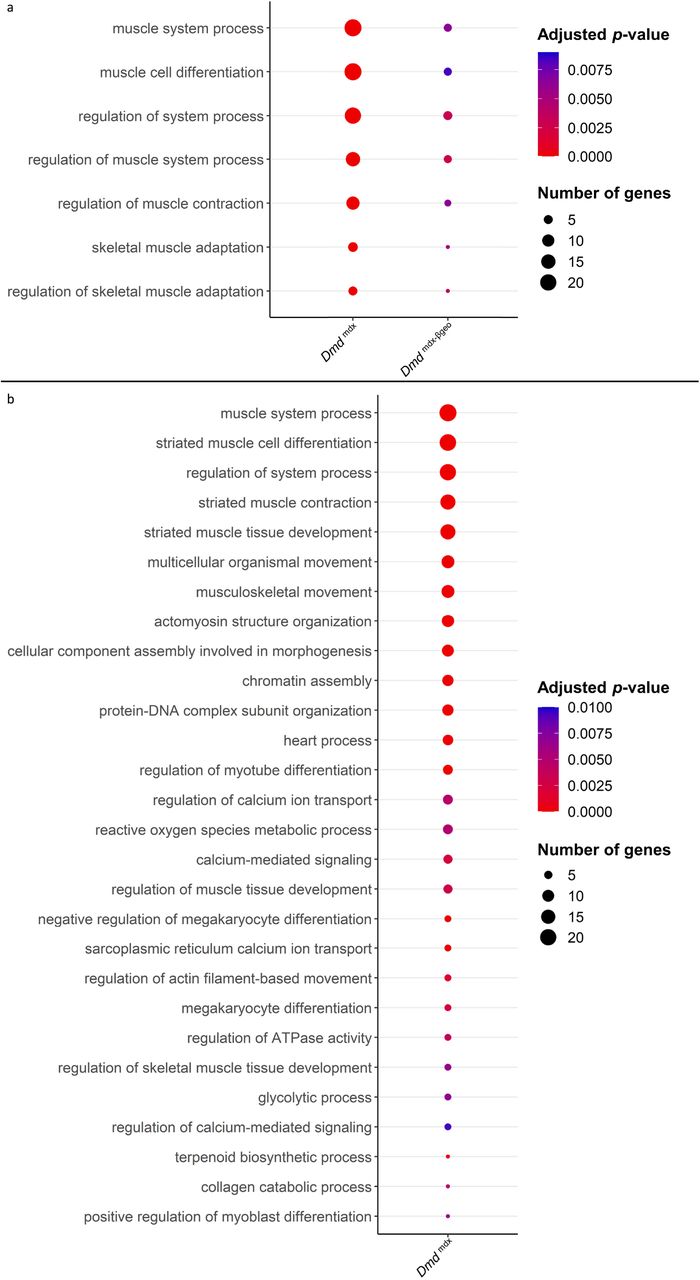
Two broad GO categories: “muscle system process” and “regulation of muscle system process” were enriched in the downregulated genes found when comparing Dmdmdx and Dmdmdx-βgeo vs. WT primary mouse myoblasts (Figure 4a; Table S4). These categories include genes involved in muscle development and function. For a myoblast to fulfil its role in regenerating a damaged muscle, it must be able to proliferate, migrate towards and differentiate in response to relevant stimuli. GO enrichment analyses of downregulated genes (Figure 4; Table S4) imply phenotypic alterations in dystrophic myoblasts affecting all three functions.

a) Bubble plot of the overlapping GO categories enriched in Dmdmdx and Dmdmdx-βgeo versus WT downregulated genes lists. Bubble size represents the number of genes from the downregulated gene lists belonging to the GO category and the bubble colour depicts the adjusted p-value from red (0) to blue (8.0e-3). b) Bubble plot of GO categories enriched in Dmdmdx versus WT downregulated genes lists following REVIGO redundancy filtering (See methods). Bubble size represents the number of genes from the downregulated gene lists belonging to the GO category and the bubble colour depicts the adjusted p-value from red (0) to blue (1.0e-2).
Specifically, categories such as “chromatin assembly” and “muscle cell proliferation” (Figure 4b; Table S4), are enriched, indicating an altered proliferative state of dystrophic myoblasts. The enrichment of the GO categories “muscle cell migration” and “positive regulation of cell migration” in downregulated genes (Figure 4; Table S4) indicate a migrative phenotype in dystrophic myoblasts, while GO categories “muscle cell differentiation” and “striated muscle cell differentiation” (Figure 4a and b; Table S4) suggest that dystrophic myoblasts may have an altered ability to differentiate.
Moreover, several GO categories related to calcium ion transport, homeostasis and calcium-mediated signalling were found significantly enriched in Dmdmdx vs. WT downregulated genes (Figure 4b; Table S4), in line with this well-established dystrophic abnormality 41.
These results suggested alterations in proliferation, migration, and differentiation in both Dmdmdx and Dmdmdx-βgeo cells. To further assess these processes, we performed functional analyses of these three key myoblast functions in primary myoblasts isolated from gastrocnemii of dystrophic and control mice.
Increased proliferative capacity of dystrophic myoblasts
The ability of myoblasts to proliferate is key to obtaining enough myogenic cells to repair muscle fibre damage. Given that the transcriptomic data indicated this mechanism as likely to be affected, we tested, in a BrDU incorporation assay, the dystrophic myoblasts capacity to respond to the proliferative stimulus of the exposure to a sera-rich medium (Figure 5a). After six hours, 57 % of Dmdmdx myoblasts have incorporated BrDU compared to 26 % of WT cells (p=3.0e-3). 39.1 % of Dmdmdx-βgeo cells were positive for BrDU compared to 24 % of the corresponding C57Bl/6 controls (p=1.0e-2). This statistically significant two-fold increase in BrDU incorporation denotes an exaggerated response to a proliferative stimulus in both dystrophic cells compared to their respective WT controls. Although Dp71 expression was described as enhancing myoblast proliferation 42, we did not observe any negative effect on proliferation in dystrophin-null Dmdmdx-βgeo cells. On the other hand, this absence of differences between these two genotypes was consistent with the differential gene expression data described earlier.

a) Proliferation analysis in myoblasts from Dmdmdx, Dmdmdx-βgeo, C57BL/10 and C57BL/6 mice using a BrdU incorporation assay. (Left) Representative examples of BrdU flow cytometric dot plots from C57BL/10 and Dmdmdx cells after 6 hours of incorporation, with FL-1 channel corresponding to BrdU fluorescence intensity and FSC channel denoting the cell size. (Right) Graph showing significantly increased proliferation of dystrophic myoblasts presented as ratio of BrdU-positive dystrophic cells relative to the respective wild type controls. Errors bars represent mean ± SEM, n = 3 or 4, * = p ≤ 5.0e-2, ** = p < 1.0e-2 (Student’s unpaired t-test). b) Cell chemotaxis analysis in myoblasts from Dmdmdx, Dmdmdx-βgeo, and respective wild type controls. Cells were seeded on a trans-well insert and allowed to penetrate towards the bottom well containing either proliferation medium or serum-free medium complemented with cytokines. Graph shows significantly reduced chemotaxis of dystrophic myoblasts represented as the relative number of cells present on the well-side of the membrane after 12 hours. Error bars represent mean ± SEM, n = 3 or 4, * = p < 5.0e-2, ** = p < 1.0e-2 and *** = p < 1.0e-3 (Student’s unpaired t-test). c) Altered expression of differentiation markers in Dmdmdx compared to C57BL/10 myoblasts. Results of qPCR expression analyses of Myh1, Myog and Mymk markers at specific timepoints over the 6-day period of spheroid differentiation. Individual values for biological replicates normalised to Gapdh expression and relative to wild type values at the commencement of differentiation (t=0) are shown. Error bars represent mean ± SEM, n = 3, * = p≤ 5.0e-2, ** = p< 1.0e-2 and **** = p< 1.0e-4 (two-way ANOVA was used to determine the statistical significance between groups and time-points over the 6-day period and Fisher’s LSD was used to determine which timepoints exhibited a significant difference between groups).
Significantly decreased chemotaxis of dystrophic myoblasts
In dystrophic myoblasts several GO categories associated with migration were found to be overrepresented in the downregulated gene lists. We therefore assessed, using the Boyden chamber assay, the chemotaxis of dystrophic cells toward sera-rich medium and toward medium containing a cocktail of chemo-attractants (Figure 5b). Dmdmdx myoblasts chemotaxis towards both sera-rich and cytokine-containing medium was found to be significantly reduced, with respectively 28 % (p=3.8e-2) and 21% (p=1.0e-2) cells penetrating through the membrane compared to WT. Dmdmdx-βgeo myoblasts also showed significantly reduced chemotaxis at 44 % (p=5.0e-6) and 54 %, (p=7.8e-4), compared to WT controls in serum-rich and cytokines media, respectively.
Altered differentiation of Dmdmdxdystrophic myoblasts
Dystrophic myoblasts showed altered expression of several key genes involved in muscle differentiation (Figure 1c) and GO categories related to differentiation were enriched in downregulated gene lists (Figure4; Table S4). Even though these analyses were performed in proliferating myoblasts, such alterations could indicate a distorted capacity for differentiation in dystrophic cells.
To assess this, differentiation of Dmdmdx myoblasts was compared against WT, using a threedimensional (3D) culture, facilitating interactions closely resembling those occurring in muscles in situ.
Spheroids of dystrophic or WT cells (n = 3 per group), were placed in differentiation medium (t=0) and collected at days 0, 2, 4 and 6 to monitor their differentiation. We first established that after 6 days in such condition’s spheroids differentiated sufficiently to express myosin heavy chain (Figure S2; supplementary movie). Changes in differentiation were assessed by qPCR quantification of the expression of Myh1, Myog and Mymk, gene markers of myoblast differentiation. Analysis of the time course of expression revealed a significantly altered pattern in Dmdmdx cultures. Specifically, Mymk (Time: DF = 3, F = 7.520, p = 3.4e-2. Group: DF = 1, F = 50.40, p = 2.1e-3), Myog (Time: DF = 3, F = 9.811, p = 1.7e-2. Group: DF = 1, F = 11.72, p = 2.7e-2) and Myh1 (Time: DF = 3, F = 24.97, p = 8.0e-4. Group: DF = 1, F = 66.95, p = 1.2e-3) were found to have their expression statistically significantly increased (two-way ANOVA) in dystrophic spheroids, when compared to WT (Figure 5c).
Also, in our hands, Dmdmdx myogenic cells in 2D cultures formed myotubes within ≈ 5 days, while WT myoblasts required minimum 7 days in the differentiation medium (unpublished), which is in agreement with reports that dystrophic myoblasts differentiate faster22.
It is worth noting that these increases in Myh1, Myog and Mymk expression in differentiating cells contrast with their expression profiles in proliferating myoblast, where dystrophic cells showed consistently lower expression levels of these markers (Table S1; Figure 1c and Figure S1).
Dystrophic myoblast cell line reproduces transcriptome anomalies found in primary cells
Although multiple replicates of primary myoblasts from the same genotype had similar transcriptome profiles (Figure 1), primary cultures might not be free from other cell types. Moreover, myoblasts isolated from Dmdmdx muscle have been exposed to the dystrophic niche and some of the alterations might result from environmental factors. Therefore, we investigated whether alterations found in primary cells also occur in an established myoblast cell line. We used the SC5 (Dmdmdx) and IMO (WT) cells, both derived from the H2Kb-tsA58 mice 43 and thus having an identical genetic background. Comparison of RNA-Seq data showed a strong segregation of samples according to genotypes (Figure 6a) and a clear dysregulation in gene expression (Figure 5b, Table S5). The SC5 dystrophic cell line transcriptome had significantly more dysregulated genes compared to IMO controls (Table S5) than the primary Dmdmdx myoblasts compared to WT cells (Table S1). Importantly, despite this transcriptome drift expected in cells maintained long term in culture 44, the key alterations seen in the transcriptome of dystrophic primary cells were also found in the established dystrophic cell line. Myod1, Myog, Mymk, Des and 69 other genes (Figure 6c; Table S5) were found significantly dysregulated in dystrophic cells and an overlap in GO (Figure 6c and d; Table S6) demonstrated that the impact of the mdx mutation is present, with 61 GO categories for biological processes being enriched in the downregulated genes lists in both primary and cell line myoblasts carrying the Dmdmdx allele.

a) Sample-based hierarchical clustering heatmap, colour represents dissimilarity between samples based on the Euclidean distance, from black for identical samples to white for more distinct samples.
b) Volcano plot, showing the results of differential expression analysis between SC5 and IMO. Circles represent individual genes, with their colour representing significance and direction of dysregulation (blue-significantly downregulated; red-significantly upregulated; black-not significantly dysregulated). Circle position represents fold change on a log2 scale for the x-axis and adjusted p-value on a −log10 scale for the y-axis. Horizontal dotted line represents the threshold of an adjusted p-value of 5.0e-2 while the vertical doted lines represent the threshold for the absolute log2 fold change of 1.
c) Venn diagrams representing the overlap between genes dysregulated in SC5 and primary Dmdmdx myoblasts vs. WT as well as the overlap between GO categories for biological processes overrepresented in both downregulated gene lists. Number in the white circle enumerates dysregulated genes or enriched GO categories in SC5 vs. IMO, black circle those of Dmdmdx vs. WT and grey area numbers represent overlap between these two sets. d) Bubble plot of the overlapping GO categories following redundancy filtering applied to the 61 categories identified (panel c). Bubble size represents the number of genes from the downregulated gene lists belonging to the category and bubble colour represents the adjusted p-value from red (0) to blue (1.0e-2).
Further analysis of these 61 GO categories (Table S6) revealed that all those altered are among the most significantly dysregulated both in terms of adjusted p-values and fold enrichment in both primary and established cells, involving very relevant processes and functions, such as “striated muscle tissue development” and “striated muscle cell differentiation” (Figure 6c; Table S6).
Moreover, analysis of overrepresented TF binding sites on promoter regions of the dysregulated genes found transcripts downregulated in the SC5 cells to have significantly higher than background signal for MyoD, MYOG, and TCF12 (Table S3G), in clear agreement with TFBS overrepresented in primary Dmdmdx myoblasts. Likewise, genes upregulated in SC5 did not exhibit statistically significant overrepresentation of the binding signal of any TF (Table S3F).
Finally, in line with these transcriptomic similarities, the dystrophic myoblast cell line exhibited the impaired chemotaxis phenotype (Figure S3), identical to that identified in primary dystrophic myoblasts (Figure 5b).
Human and mouse dystrophic primary myoblasts exhibit corresponding transcriptome changes
Comparison of differential gene expression data from human DMD and healthy primary myoblasts also showed significant transcriptomic alterations with a clear segregation between samples according to genotypes (Figure 7a) and a greater number of significantly downregulated genes (334) compared to upregulated ones (86) (Figure 7b, Table S7). This profile was very similar to the primary mouse myoblast data (Figure 1; Table S1).
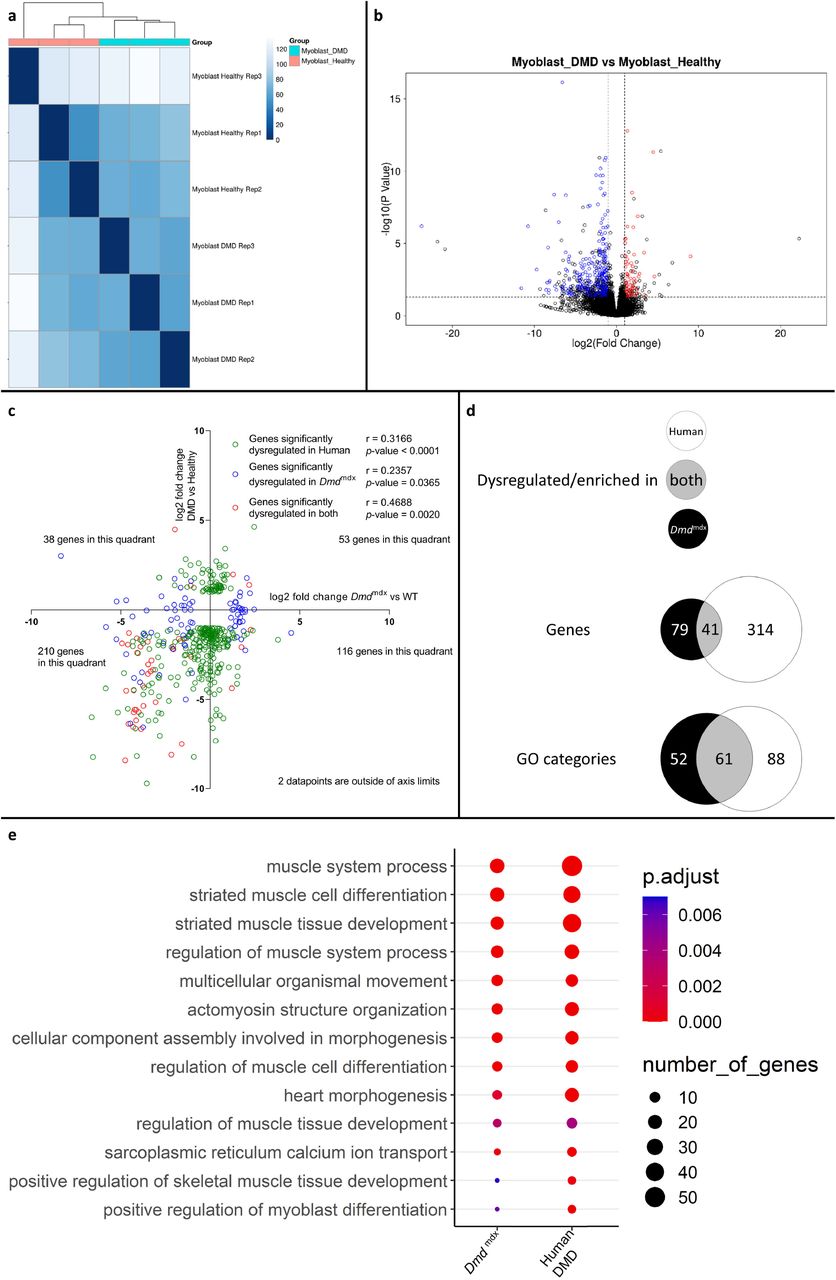
a) Sample-based hierarchical clustering heatmap, represented as described before.
b) Volcano plot, showing the results of differential expression analysis between DMD and healthy myoblasts. Circles represent individual genes, with their colour representing significance and direction of dysregulation (blue-significantly downregulated; red-significantly upregulated; black-not significantly dysregulated). Circle position represents fold change on a log2 scale for the x-axis and adjusted p-value on a −log10 scale for the y-axis. Horizontal dotted line represents the threshold of an adjusted p-value of 5.0e-2 while the vertical doted lines represent the threshold for the absolute log2 fold change of 1.
c) log2 fold change values (Dmdmdx versus WT on the x-axis and human DMD versus WT on the y-axis) for genes significantly dysregulated in one or both dystrophic vs. WT primary myoblasts. Pearson’s correlation coefficients (r) and p-values are shown. Green circles represent genes significantly dysregulated in DMD, blue circles represent genes significantly dysregulated in Dmdmdx vs. WT and red circles represent genes significantly dysregulated in both. The number of genes found in each quadrant is shown.
d) Venn diagrams representing the overlap between genes dysregulated in primary human DMD and Dmdmdx myoblasts vs. WT as well as the overlap between GO categories for biological processes overrepresented in both downregulated gene lists. Number in the white circle enumerates dysregulated genes or enriched GO categories in human DMD vs. healthy, black circle those of Dmdmdx vs. WT and grey area numbers represent overlaps between these two sets.
e) Bubble plot of the overlapping GO categories following redundancy filtering applied to the 61 categories identified (panel d). Bubble size represents the number of genes from the downregulated gene lists belonging to the GO category and the bubble colour depicts the adjusted p-value from red (0) to blue (7.0e-3).
Comparison of log2 fold changes of significantly dysregulated genes in human DMD myoblasts and their orthologous counterparts in mouse primary Dmdmdx myoblasts, revealed that genes significantly downregulated in one species tend to also be downregulated in the other, as shown by more genes in the lower-left quadrant of Figure 7c, compared to other quadrants (Fisher’s exact test: p = 2.0e-4). With r values ranging from 0.2357 to 0.4688, depending on which gene populations are compared (Figure 7c and d), the magnitude of gene expression changes between species was equivocal.
However, comparison of the human GO enrichment for biological processes in the significantly downregulated gene list to its mouse counterpart returned a strikingly similar result, with 61 overlapping categories (Figure 7d and e; Table S8). Of these, 49 also overlap with the categories in the mouse dystrophic myoblasts cell line. Again, the most significantly altered categories (in terms of adjusted p-value) that overlap in both species were associated with muscle cell development and differentiation (Figure 7c, Table S8).
When comparing the list of significantly downregulated genes in Dmdmdx versus WT (Table S1) and human DMD versus healthy human myoblasts (Table S8), taking into account only one to one orthologs, 41 genes are present in both lists including key myogenic program actors such as Myog, Mymk, Myod1, Des, Smyd1, Acta1, Actc1 and Atp2A1.
Interestingly, other genes of interest found to be dysregulated in primary mouse myoblasts were found to have non-orthologous counterparts dysregulated in human primary DMD myoblasts: COL11A1, COL14A1 and COL15A1 for Col2a1, Col4a1, Col4a2 and Col8a2 or MMP2 for Mmp3, Mmp9 and Mmp10.
Finally, a three-way comparison of the GO enrichment for biological processes in the downregulated genes for dystrophic primary human myoblasts, primary mouse myoblasts and the dystrophic mouse myoblast cell line showed an important overlap: 49 categories were found enriched in all three datasets, with further 12 enriched in human and mouse primary cells, 12 in mouse primary and mouse cell line datasets and finally 47 categories enriched in both primary human and mouse cell line dystrophic myoblasts (Figure 8a). In the 49 categories enriched in all 3 datasets, many are relevant to the disease and consistent with the cell function anomalies described earlier. Specifically, categories such as “muscle cell differentiation”, “muscle system process”, “regulation of myoblast differentiation” and “regulation of muscle system process” being very significantly enriched in the downregulated genes lists for all datasets (Figure 8b).
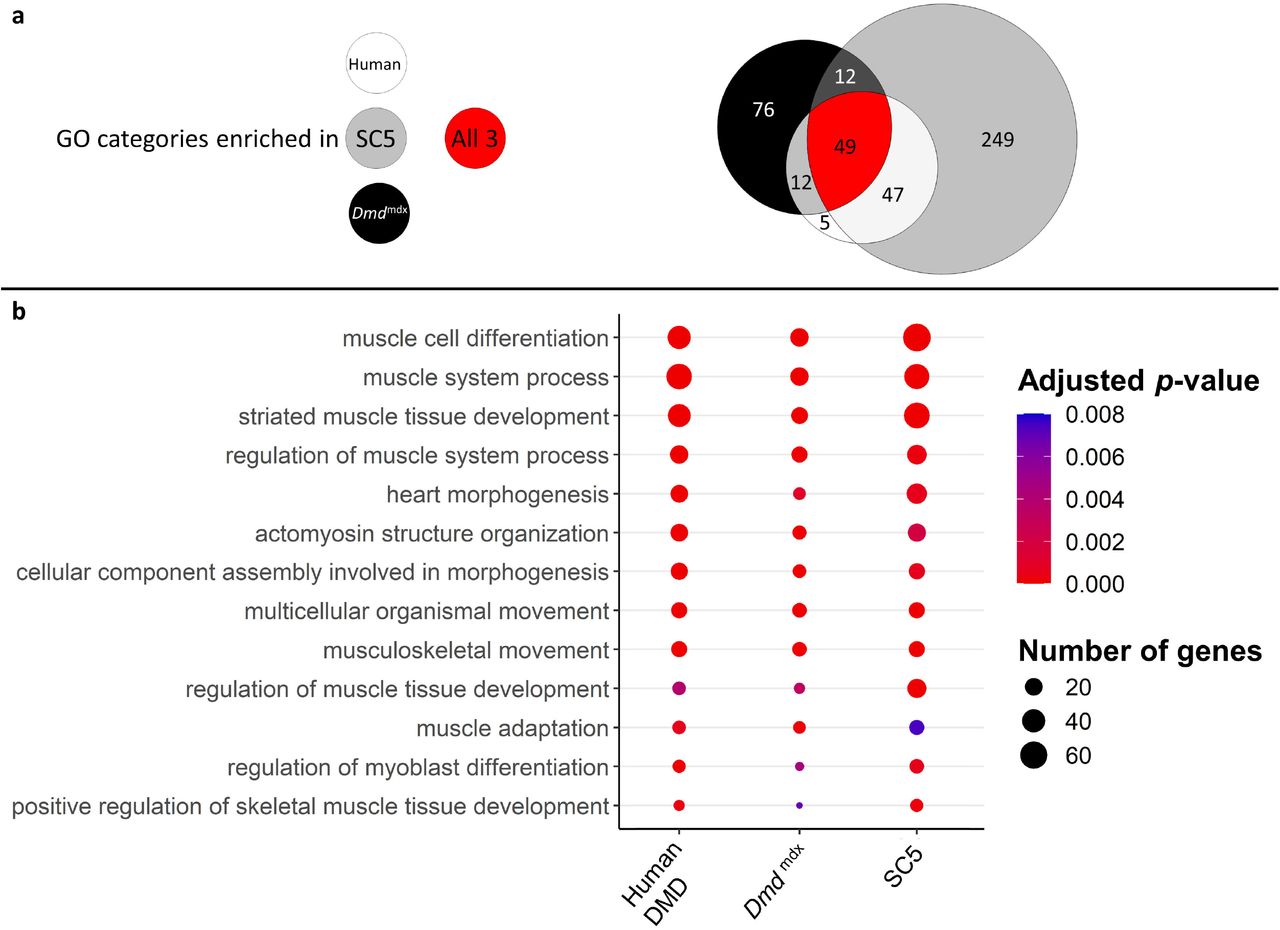
a) Venn diagram representing the overlap between GO categories for biological processes overrepresented in downregulated gene lists in primary human DMD, Dmdmdx myoblasts and established Dmdmdx myoblast cell line (SC5). Numbers in each area enumerate enriched GO categories in individual datasets and those overlapping (see the graphic legend).
b) Bubble plot of the overlapping GO categories following redundancy filtering applied to the 49 categories identified (panel a). Bubble size represents the number of genes from the downregulated gene lists belonging to the given GO category and bubble colour depicts the adjusted p-value from red (0) to blue (8.0e-3).
Alterations in transcriptomes of human and mouse dystrophic myoblasts are strikingly analogous, with downregulation of gene expression predominating in both, reduction in key markers of the muscle program and relevant common GO categories being enriched. Thus, these myoblast abnormalities are the consequence of DMD gene mutations.
Discussion
DMD presents in muscle stem cells, where loss of dystrophin affects asymmetrical cell divisions 45. Subsequently, absence of dystrophin during myotube differentiation causes the typical dystrophic abnormalities such as altered calcium homeostasis and creatine kinase leakage 4. We hypothesised that myoblasts originating from dystrophic stem cells, which give rise to myotubes, are also affected. Indeed, we demonstrate here for the first time that, in proliferating human and mouse myoblasts, the absence of DMD gene expression results in major abnormalities. Our data combining global RNA-Seq and functional analyses demonstrate that DMD directly affects myoblasts.
The key abnormalities concerned proliferation, chemotaxis, and differentiation. Importantly, synchronisation of these three processes, involving exit from the cell cycle, migration to the site of damage, activation of the skeletal muscle specific genes and cell fusion, is essential for muscle development and regeneration. Ultimately, myoblasts are the effector cells of muscle growth and repair, and it is the failure of muscle regeneration that drives DMD progression.
These defects are cell autonomous rather than caused by the inflammatory environment of the dystrophic niche because they persist in the dystrophic cell line maintained long-term in culture: established cells reproduced the key transcriptomic anomalies and were described before to have functional alterations found in primary cells 46.
Moreover, alterations are shared between mouse and human DMD myoblasts, despite the significant heterogeneity within human samples 17. Therefore, these dystrophic anomalies manifest irrespective of differences in genetic backgrounds and across species, which confirms their significance.
DMD pathology being intrinsic to the myoblast has been proposed previously 20 and there has been growing evidence that DMD mutations cause a range of cell-autonomous abnormalities in human and mouse myogenic cells and myoblasts, which affect cell division, differentiation, energy metabolism and signalling 22–24,24,27,27,45,47–50. Interestingly, Dmdmdx cell migration found reduced under physiological stimuli (this work) can be increased in the inflammatory environment 27. In fact, altered proliferation and migration resulting in highly metastatic phenotypes, have been associated with the loss of Dp427 in tumours featuring myogenic differentiation 51.
Our team recently demonstrated that DMD mutations evoke marked transcriptome and miRNome dysregulations early in human muscle cell development 17. In that study, expression of key coordinators of muscle differentiation was dysregulated in proliferating dystrophic myoblasts, the differentiation of which was subsequently also found to be altered, in line with the mouse cells studied here (Figure 5c).
A significant number of downregulated transcripts in dystrophic myoblasts are controlled by the same TFs, most notably MyoD and MYOG. Given that MYOG itself is regulated by MyoD, the significant downregulation of Myod1 expression found here appears to be the key trigger mechanism of the dystrophic abnormality in myoblasts: the lower levels of Myod1 transcript strongly correlate with downregulated expression of genes controlled by this TF, and which are key coordinators of skeletal muscle repair. Consequently, altered expression of myogenic regulatory factors in dystrophic myoblasts could have multiple consequences. Indeed, complete Myod1 ablation in Dmdmdx has been shown to exacerbate the disease due to a diminished capability for muscle regeneration 52,53. Downregulation of MyoD, which inhibits the cell cycle, could explain the increased proliferation in dystrophic cells. The Myod1-Mymk-Mymx (Myomaker/ Myomixer) axis altered here was found to determine myotube formation 54. Given that Pax3 inhibits myogenic differentiation of myoblasts 55, its downregulation in dystrophic cells could also contribute to this accelerated differentiation pattern observed here.
GO categories concerning calcium homeostasis and signalling, known to be altered in dystrophic muscles across species, were also found altered in dystrophic myoblasts: calsequestrins 1 and 2 levels being significantly downregulated, in line with previous findings in the dystrophic muscle 7,39 and cell lines 46,48.
Given that Dp71 dystrophin is found in undifferentiated myogenic cells 26, and that in development shorter dystrophins have been associated with proliferation and migration, and long isoforms with terminal commitment 56, we hypothesized that eliminating expression of Dp71 may exacerbate dysfunctions in myogenic cells. Surprisingly, we found that both Dmdmdx and Dmdmdx-βgeo cells had similar abnormalities and, contrary to Dp71 overexpression increasing myoblast proliferation 42, BrdU incorporation in dystrophin-null myoblasts was still significantly increased compared to WT. Interestingly, Dmdmdx myoblasts, having a point mutation in exon 23, expressed significantly lower levels of Dp71 (Figure S6), whose expression is driven by a promoted located over 40 exons downstream of the mutation. But whether this downregulation is sufficient to mimic its total loss is unknown.
Combined, these data bring to light the significance of full-length dystrophin defects in undifferentiated muscle cells, the consequences of which correspond to the impaired muscle regeneration occurring in this disease.
Clearly, the important question is the mechanism altering the myoblast phenotype. Dp427 in satellite cells appears to control asymmetrical cell division 45, which might suggest an interaction problem also in myoblasts.
However, even healthy myoblasts do not express Dp427 protein at levels detectable by Western blotting: an observation that contributed to the belief that myoblasts are not affected by DMD mutations. Although our attempts at immunolocalization in unsynchronised primary myoblasts failed to detect Dp427 (Figure S4), a precise spatio-temporal requirement for small amounts of fulllength dystrophin, analogous to its role in satellite cells 45 or at neuronal synapses 57 is a possibility that requires further studies. Importantly, WT myoblasts express the full-length transcript, which is depleted in dystrophic cells. It is worth noting that this 14 kb mRNA, which transcription time may be as long as 16 h 3, is produced in rapidly dividing myoblasts. Its expression is therefore unlikely to be meaningless.
Is it possible that loss of the full-length dystrophin expression may trigger a mechanism not involving its protein product? Considering the increasing number of human pathologies caused by RNA, including another dystrophy – dystrophia myotonica 58, it is not inconceivable that loss of a large 14 kb transcript made up of 79 exons may trigger a novel RNA-mediated disease process 59. Abnormalities in Dmdmdx cells, that harbour just a point mutation, indicate that the patho-mechanism does not require large Dmd gene rearrangements 60. Yet, improvements resulting from the expression of mini/micro dystrophins do not support the requirement for the entire 14 kb transcript or a toxicity of mRNA breakdown products generated via nonsense-mediated decay. However, the impact of premature dystrophin transcript termination on the downregulation of other genes 61 cannot be excluded.
A more likely explanation involves alterations of epigenetic regulation, a mechanism of increasing importance in DMD: The absence of dystrophin/DAPC in satellite cells leads to aberrant epigenetic activation, which impairs functions of the newly generated cells. This dystrophic SC division defect has been linked to polarization problem due to MARK2 mis-interaction 62 combined with β-syntrophin abnormalities 63,64. Downregulation of β-syntrophin, a DAPC member, results in impaired polarization of its interactor - p38γ. This, in turn, increases CARM1 phosphorylation and reduces MYF5 activation by PAX7 in in the daughter cell due for myogenic differentiation 65. Furthermore, dystrophin anchors nNOS 66, which becomes mis-localised in dystrophic cells. This results in decreased nitric oxide-dependent S-nitrosylation of HDAC2 67 and higher deacetylase activity that has been shown to be involved in the progression of muscular dystrophy 68.
Thus, loss of the full-length dystrophin in muscle stem cells does not abrogate myogenic cell divisions but causes significant abnormalities. The descendant myoblasts appear to be harbouring somatically heritable epigenetic changes analogous to genomic imprinting 69 and themselves might manifest significant epigenotype abnormalities 70.
Indeed, our DMD knockdown and rescue experiments in skeletal muscle progenitor cells 17 showed that phenotypic changes at day 17 were the consequences of some earlier events that occurred at day 10 and that some abnormalities might not be reproduced nor alleviated after crossing a specific checkpoint.
The data here indicate that epigenetic changes in dystrophic primary myoblasts may be present, as amongst the significantly altered genes Hist2h2ac, Hist1h2ag, Hist1h2ah, Hist1h1a, Smyd1 and Hmga1 gene products are involved in chromatin modifications or belong to the GO category “negative regulation of gene expression, epigenetic”. Methylated histone H3 lysine 4 (H3K4) is a key epigenetic signal for gene transcription. H3K4 methylation is mediated by several methyltransferases, including muscle-active Smyd1 71, found among the top downregulated transcripts in dystrophic myoblasts. Histone methylation can be reversed by histone demethylases, of which Lysine-Specific Histone Demethylase 1A (LSD1 encoded by Kdm1a) is an important muscle enzyme 72. The network of interactions between genes in this aforementioned GO category (Figure S5, Table S9) showed a clear interface between the Kdm1a node and significantly downregulated histone genes. LSD1 is involved in controlling Myod1 expression 73, which we found significantly downregulated in dystrophic myoblasts. Importantly, treatment of Dmdmdx mice with histone deacetylase inhibitors (HDACi) promoted myogenesis 74. Epigenetically, HDACi upregulate Myod1 75 and therefore would counteract its decreased expression and the resulting downregulated expressions of genes controlled by this TF, which we described here.
We postulate that, in dystrophic myoblasts, epigenetic dysregulation of Myod1 expression causes a pathological cascade of downregulated transcriptions of a range of genes controlled by MyoD, with functional consequences for muscle regeneration.
If it is the absence of dystrophin in myogenic cells that determines their fate, developmental muscle abnormalities should occur. This is indeed the case: asymptomatic DMD patients already have transcriptomic alterations 10 and myogenesis in Dmdmdx embryos is severely disrupted, with myotube hypotrophy, reduced myotube numbers and displacement defects 16. This developmental abnormality continues in adult muscles during regeneration.
Altogether, our data identify a continuum, where mutations disrupting expression of full-length dystrophin cause SC division abnormalities impacting myoblast generation but also imprinting these cells with functionalities further reducing muscle regeneration. And as dystrophin is needed at the myotube stage for the initial assembly of the DAPC and subsequent formation of viable myofibres 4, dystrophinopathy results in contraction-induced injury in mature muscle 5. Thus, the vicious circle of disease is closed with both degenerative and regenerative abnormalities contributing to DMD progression (Figure 9).

⍰ Embryonic stem cells (ES) express dystrophin Dp71 106 but its loss is not linked with arrested development. Yet, minor admixture of ES lacking Dp427 results in severe dystrophy 107: Defects in myogenic stem cells (SC) descendant from DMD ES must be responsible, because in myofibre syncytium, lack of dystrophin caused by small proportion of DMD nuclei would be compensated and damage prevented. Early mesoderm committed human cells express Dp412e 18 and ⍰ DMD manifests before entry into the skeletal muscle compartment 17. ⍰ DMD abnormalities are found in dystrophic human 11–13, dog 14, zebrafish 15 and mouse embryos, with stem cell dysfunctions (hyperproliferation and death), disrupted myotube formation 16 and fibrosis as intrinsic features in developing muscle 17. Typical dystrophic abnormalities (e.g., high serum CK) occur in new-borns years before diagnosis 9,10.
In adult muscle, healthy myogenic cells, myotubes and myofibres express Dp427 and DAPC assembles in differentiating fibres, supporting their functions. Impaired muscle regeneration occurs due to: ⍰ Cell-autonomous defects in dystrophic satellite cells (SC) affecting asymmetric cell divisions 24,45,49, ⍰ hyperproliferation of dystrophic myoblasts (this work) and purinergic hypersensitivity 25,108, ⍰ anomalous migration of DMD myoblasts: reduced under physiological conditions (this work) but augmented in the inflammatory environment 109 and ⍰ accelerated dystrophic myoblast differentiation (this work and Yablonka-Reuveni and Anderson, 2006) with defects in differentiating myotubes lacking Dp427 4. ⍰ Resulting mature muscle lacking DAPC show contraction-induced injury but dystrophin ablation in fully differentiated myofibres does not trigger muscular dystrophy 5,6. ⍰ Chronic inflammation exacerbates muscle damage 78,110,111 but specific inflammatory mediators are also needed for regeneration 19. ⍰ Muscle fibrosis intensifies, as the progressing loss of regenerative potential results in myofibres being replaced by the connective tissue.
Such a scenario explains the apparent contradiction, where removal of dystrophin and/or DAPC in fully developed myofibres does not result in dystrophic muscle damage 5,6. It would be the case if, once formed in a healthy muscle, DAPC remains stable even if dystrophin is subsequently lost, as indeed have been demonstrated 6.
Moreover, as the efficacy of exon skipping and gene targeting methods is much higher in proliferating cells than in myofibres, all outcomes of these treatments could arise from dystrophin re-expression in myoblasts, which later differentiate into myotubes with the functional DAPC.
Findings described here agree with the existing data that loss of dystrophin expression disrupts many downstream processes. These processes offer good targets for therapeutic interventions that are not constrained by the causative mutation 76–78. Importantly, adjustments made in dystrophic myoblasts can reduce or even prevent occurrence of dystrophy. For example, upregulation of Jagged 1 can counteract damage in muscles without any dystrophin 8 and corrections to COUP-TFII 79, EGFR-Aurka and Ghrelin expression 80 can reduce muscle damage.
Given that these pathways are active in myoblasts and the proteins involved are structurally incompatible with substituting the scaffolding properties of dystrophin, these findings further challenge the role of dystrophin in myofibre sarcolemma stabilization as the key pathological alteration in DMD.
Our findings, combined with these data, provide compelling foundation for the call to re-evaluate the established belief on the pathogenesis of DMD. Such reconsideration is important because most current therapeutic approaches aim at dystrophin restoration in differentiated myofibres and are often conducted in the advanced-stage disease, with very limited regenerative muscle potential. Despite decades of intensive research and numerous clinical trials, none of the candidate treatments delivered disease modifying results 81. Part of the problem is immune responses to re-expressed dystrophin 82, that need to be tackled 83 or prevented. However, dystrophin re-expression using new technologies 84 allowing re-targeting dystrophin to myoblasts and satellite cells in younger patients or, better still, in new-borns able to develop neonatal tolerance to dystrophin, could produce effective therapies for this devastating disease.
Materials and methods
Animals
Male C57BL/10ScSn-Dmdmdx/J, C57BL/10ScSnJ, C57BL/6-DmdGt(ROSAbgeo)1Mpd/J (Dmdmdx-βgeo) and C57BL/6J eight week old mice were used in accordance with institutional Ethical Review Board and Home Office (UK) Approvals. All mice were maintained under pathogen-free conditions and in a controlled environment (12-hour light/dark cycle, 19-23°C ambient temperature, 45-65 % humidity). For environmental enrichment, tubes and nesting materials were routinely placed in cages. The genotypes of all experimental animals were confirmed by PCR.
The C57BL/10 and C57BL/6 strains derived from a common origin 85 and it has been demonstrated that the mdx mutation on the C57BL/6 background shows the same pathology as the original C57BL/10 strain 86. Nevertheless, for RNA-Seq experiments, mixed background animals were generated to facilitate the direct comparison between Dmdmdx and Dmdmdx-βgeo transcriptomes. For this, Dmdmdx males were paired with C57BL/10 females and C57BL/6 males were paired with Dmdmdx-βgeo females. The resulting Dmdmdx/WT females and Dmdmdx-βgeo males were then bred together. The resulting DmdWT males were used as controls and bred with the Dmdmdx/mdx-βgeo females. The next generation Dmdmdx and Dmdmdx-βgeo males were used as the dystrophic groups. For the subsequent functional pairwise analyses Dmdmdx were compared against C57BL/10 and Dmdmdx-βgeo against C57BL/6 mice.
Primary myoblast extraction and culture
Gastrocnemii from 8-week-old male mice were used for myoblast extraction and culture. Gastrocnemius was chosen as it is considered a fast muscle with predominantly IIB fibres 87 and therefore more prone to dystrophic changes and producing a relatively homogenous population of myoblasts. Briefly, muscles were dissected free of fat and connective tissue before enzymatic digestion by 0.2 % type IV collagenase (Sigma, C5138) in Dulbecco’s Modified Eagles’ Medium (DMEM, Gibco 31885-023) for 90 min at 37°C, 5 % CO2. The digested muscles were then rinsed in plating medium (10 % horse serum, Gibco 26050-088; 0.5 % chicken embryo extract, Seralab CE-650-J; 100 units penicillin / 0.1 mg streptomycin per mL, Sigma P0781; in DMEM, Gibco 31885-023) incubated at 37°C, 5 % CO2. Digested muscles were then disrupted by successive passages in 50 mL, 25 mL and 10 mL serological pipettes. The freed muscle fibres were transferred to a dish containing plating medium.
The dish was then placed under a stereo microscope and 200 live fibres were transferred to another dish containing plating medium. This procedure was repeated 2 more times until 150 fibres were transferred to a third dish. 120 live fibres were then transferred to a tube containing proliferating medium (20 % foetal bovine serum, Gibco 10500-064; 10 % horse serum, Gibco 26050-088; 0.5 % chicken embryo extract, Seralab CE-650-J; penicillin / streptomycin, Sigma P0781; in DMEM, Gibco 31885-023). The resulting suspension of muscle fibres was then disrupted by passing it through an 18-gauge needle 10 times before passing the resulting solution through a 40 μm cell strainer (BD Falcon 352340).
The strained cell suspension was transferred to a collagen I (Sigma C8919) coated cell culture dish and proliferating medium was added to obtain an appropriate volume for the dish. The cells were then cultured at 37°C, 5% CO2 humidified atmosphere and expanded as needed for assays and experiments. Cells were lifted from dishes using Accutase (Biowest L0950).
Myoblasts cell lines
The SC5 (mdx) and IMO (WT) cell lines were derived from the leg muscle of the H2Kb-tsA58 line 43. Cells were cultured in DMEM supplemented with 20% FCS, 4mM L-glutamine, 100 unit/ml penicillin, 100 μg/ml streptomycin and 20 unit/ml murine γ-interferon (Invitrogen) at 33°C, 5% CO2 humidified atmosphere. When cells reached 95% confluence, they were cultured as primary cells in KnockOut DMEM (Invitrogen) supplemented with 10% v/v Knockout Serum Replacement (KSR, Invitrogen), 5% v/v Donor Horse Serum (DHS, Sera Labs) and 2mM L-glutamine at 37°C.
RNA extraction
Myoblasts isolated from gastrocnemii from 3 individual mice per experimental group were treated as biological replicates. Total RNA was extracted from Dmdmdx, Dmdmdx-βgeo and corresponding wildtype myoblasts using RNEasy Plus Universal mini kits (Qiagen 73404). Briefly, cells were washed 2 times with warm Dulbecco’s phosphate buffered saline DPBS, Gibco 14190144) before lysis by applying QIAzol directly to the freshly washed cells. Lysate was then homogenised by passing it through a 25-gauge needle 20 times. Samples were then processed according to the kit manufacturer’s instructions. RNA quality and concentration were measured using a NanoDrop 1000 Spectrophotometer (Thermo Scientific). RNA integrity was assessed using electrophoresis of 100 ng of total RNA in a 1 % agarose gel (Sigma A4718) in TRIS-acetate-EDTA (TAE) buffer or using an automated capillary electrophoresis system (2100 Bioanalyzer Instrument G2939BA, Agilent) using a kit assay (Agilent RNA 6000 Nano Kit 5067-1511, Agilent).
RNA Sequencing
Total RNA samples (n=3 per group) were processed by TheragenEtex (Republic of Korea) using an Agilent Bioanalyzer 2100 for quality assessment of samples with a threshold of 7.0 for the RNA integrity number (RIN). An Illumina TruSeq stranded total RNA kit was used to generate libraries following a ribodepletion step using a Ribo-Zero Human/Mouse/Rat kit. Libraries were sequenced in a paired-end 100⍰bp run using an Illumina HiSeq 2500 sequencing platform.
Raw reads were quality assessed using fastQC 88 and reads were trimmed using trim-galore 89 with parameters “--illumina -q 20 --stringency 5 -e 0.1 --length 40 --trim-n” to remove adapter sequence and low-quality sequence tails. Reads were mapped to the GRCm38 Mus musculus genome from Ensembl using the STAR universal RNA-Seq aligner 90 with parameters “--outSAMmultNmax 300 --outSAMstrandField intronMotif”. Output mapping files were processed and filtered to remove nonmapping reads with mapping quality less than 20 using samtools 91.
The DESeq2 package 92 in R 93 was used to perform differential gene expression analysis. Gene models were taken from Ensembl version 91, and read counts over unique genes were quantified using the summarizeOverlaps() function in the GenomicAlignments package 94 using parameters ‘mode⍰=⍰“Union”, singleEnd⍰=⍰FALSE, ignore.strand⍰=⍰FALSE, fragments⍰=⍰FALSE, preprocess.reads⍰=⍰invertStrand’. P values were adjusted for multiple comparisons by using the Benjamini and Hochberg correction 95. Significantly differentially expressed genes were identified based on a fold-change of 2-fold or greater (up- or downregulated) and an adjusted p-value⍰<⍰5.0e-2. An additional filter was put in place to remove genes where the mean normalised Fragments Per Kilobase Mapped (FPKM) was < 1 for both conditions to avoid changes in low abundance transcripts. GO enrichment analysis was conducted using the clusterProfiler package 96 in R 93.
REVIGO 97 was used to reduce the redundancy of GO enrichment data to rationalise the categories being compared in figures. The default “SimRel” semantic similarity measure with a 0.4 threshold cut-off was used. When filtering GO categories for redundancy, the mouse UniProt database was used for all analyses, except when analysing the list of GO categories enriched in both human and mouse primary datasets, in which case the human UniProt database was used. STRING 98 was used to explore and visualize interaction networks. Only interactions present in databases for relevant species or experimentally determined were used.
Regulatory regions of the differentially expressed genes (listed in Tables S2, S3, S5, and Table S3H), defined as the region 1 Kb upstream or downstream of the transcription start site (TSS) of the gene, were analysed for overrepresentation of binding sites of transcription factors (TFs). The binding signal was analysed using the seqinspector tool (http://seqinspector.cremag.org, 99 and publicly available ChIP-Seq data 40. The overrepresentation was assessed by comparing the lists of tested genes with 1000 randomly selected gene promoters (Mus musculus reference genome mm9) Ensembl 75 gene symbols. TF signal was considered enriched if Bonferroni-corrected p-value returned by seqinspector was < 5.0e-2.
RNA-Seq data have been deposited in the ArrayExpress database at EMBL-EBI under accession number E-MTAB-10322 for the primary mouse myoblast samples (https://www.ebi.ac.uk/arrayexpress/experiments/E-MTAB-10322) and accession number E-MTAB7287 for SC5 and IMO myoblast cell line samples (https://www.ebi.ac.uk/arrayexpress/experiments/E-MTAB-7287).
Human primary adult myoblast RNA-Seq data
RNA-Seq data from human dystrophic (duplication exons 3–26, deletion exons 8–43, and stop exon 7) and healthy primary myoblasts were generated and analysed as described 17. Raw RNA-Seq data have been deposited in the ArrayExpress database at EMBL-EBI under accession number E-MTAB-8321 (https://www.ebi.ac.uk/arrayexpress/experiments/E-MTAB-8321).
cDNA synthesis and qPCR analysis
Total RNA samples were converted to cDNA using SuperScript VILO cDNA Synthesis Kit (Invitrogen 11754050) as per manufacturer instructions.
qPCR reactions were run in duplicates using 25 ng of cDNA per reaction with Precision Plus Mastermix (Primer Design PPLUS-LR), forward and reverse primers synthesized by Eurofins (Table S10) and DEPC treated water (Fisher Bioreagents BP561) as per manufacturer instructions, in 96 well plates using an Applied Biosystem ViiA7 RT-PCR instrument, and expression quantified using the ΔΔCT method.
Cell proliferation assay
Primary myoblasts were seeded in 10 cm diameter dishes (Sarstedt 83.3902) coated with Collagen I (Sigma C8919) at 30 % confluency in proliferation medium, as above and left to attach for 2 hours before adding bromodeoxyuridine / 5-bromo-2’-deoxyuridine (BrDU, Invitrogen B23151) to a final concentration of 75 μM and left to proliferate for 6 hours. Cells were then rinsed with warm DPBS, detached using Accutase (Biowest L0950) and fixed using ice cold ethanol. Samples were left at −20°C over-night and then analysed by flow cytometry. Fixed cells were submitted to an acid wash (2M HCl, 0.5 % Triton X-100) for 30 min at room temperature, washed in PBS and the remaining acid was neutralized using a borate buffer (pH= 8.5). Cells were then stained in 200 μL of PBS (0.5 % Tween 20) with 1 μg of Anti-BrDU FITC conjugated antibody (BD 556028) or an FITC conjugated isotype control for 30 min at room temperature. Cells were then washed in HEPES buffer (pH= 7.4) and resuspended in PBS before processing using a FACScalibur system.
Boyden chamber chemotaxis assay
Primary myoblasts from dystrophic and WT mice were treated for 2 hours with proliferating medium complemented with 10 μg.mL−1 mitomycin C (Fisher Bioreagents BP2531) to prevent proliferation from confounding the results of the assay. Cells were then rinsed with warm DPBS twice to remove excess mitomycin C. Each insert (Sartstedt 83.3932.800) was seeded with 10 000 myoblasts in serum-free medium while the wells were filled with either proliferating medium or serum-free medium complemented with 10 ng.mL−1 FGF-b (R&D Systems 3139-FB), IGF-I (R&D Systems 791-MG) and HGF (R&D Systems 2207-HG). Cells were left for 12 hours before fixation in buffered formalin (Sigma HT501128) and crystal violet staining for cell counting and spectrophotometer measurements.
Cell differentiation assay
Myoblasts were used to generate spheroids as such a culture provides an environment that facilitates myogenic differentiation due to a 3D structure improving physical interactions, differentiation and fusion of myoblasts 100–103. One million myoblasts per genotype and per mouse were pelleted at 300g for 5 minutes in 15 mL centrifuge tubes before pellets were transferred into individual wells of a 6-well plate containing 50 % proliferation medium (20 % foetal bovine serum, Gibco 10500-064; 10 % horse serum, Gibco 26050-088; 0.5 % chicken embryo extract, Seralab CE-650-J; penicillin / streptomycin, Sigma P0781; in DMEM) and 50 % DMEM (Gibco 31885-023) and cultured for 24 hours. Then cells were placed in 25 % proliferation medium with 75 % DMEM for 24 hours and finally in the differentiation medium (2 % horse serum, Gibco 26050-088; penicillin / streptomycin, Sigma P0781; in DMEM). Introduction to differentiation medium was considered t=0 and differentiation was allowed for 6 days.
At the collection time, spheroids undergoing differentiation were rinsed in DPBS and collected in 1 mL of Qiazol solution before freezing for subsequent processing. On thawing, spheroids were disrupted using progressively smaller gauge needles (19, 21, 23 and 25 gauge) and then processed as per the RNA extraction section. Mymk was chosen as a marker of myoblast fusion and therefore entry into the final stages of differentiation 104 and Myog and Myh1 as robust markers of late stage myogenic differentiation 105.
Immunolocalisation with confocal microscopy
Muscles (tibialis anterior) frozen in liquid N2 chilled-isopentane in cryo-embedding matrices (Cellpath KMA-0100-00A) were allowed to equilibrate to −20 °C in the cryostat chamber. Cryosections (10 μm) were cut and attached to poly-L-lysine coated slides (Thermo Scientific J2800AMNZ). Sections were allowed to air-dry before fixation and staining. Myoblasts were seeded at 10 000 per collagen-coated coverslip in a 24 well plate (Sarstedt 83.1840.002 and 83.3922) and left to adhere for 12 hours before processing. Spheroids having undergone the differentiation process were frozen in embedding medium and 10 μm sections were cut, as previously described.
Both muscle sections and cultured myoblasts were then processed identically. They were fixed in 10 % neutral buffered formalin (Sigma-Aldrich HT501128) at room temperature for 10 minutes and washed 3 times in PBS containing 0.1 % v/v Triton X-100 (Sigma-Aldrich X100), blocked for 30 min using 10 % v/v chicken serum (Gibco 16110082) in PBS-Triton then incubated for 90 minutes under agitation in primary antibody solution: anti dystrophin (Developmental Studies Hybridoma Bank MANDYS1 clone 3B7 cell culture supernatant) 25 % v/v antibody or anti Myosin-4 (Invitrogen, 14-6503-95) 1μg.mL−1, 10 % v/v chicken serum in PBS-Triton. Samples were then washed one time in PBS-Triton then incubated in secondary antibody solution (Invitrogen A-21200) with 10 μg.mL−1 antibody, 10 % v/v chicken serum and DAPI 300 nM (Invitrogen D1306) in PBS-Triton for 1 hour followed by 2 washes in PBS-Triton then PBS and mounted using an anti-fading mounting medium (Thermo Scientific TA-006-FM). Omitting primary antibodies in the reaction sequence served to confirm the specificity of the signal.
Samples were examined with a confocal laser-scanning microscope (LSM 880; Zeiss, Oberkochen, Germany) using a Plan Apochromat, 63x DIC oil objective (NA 1.4) (pixel size 0.13 μm) objective. Images were acquired using sequential acquisition of the different channels to avoid crosstalk between fluorophores. Pinholes were adjusted to 1.0 Airy unit. In all cases where multiple images were captured from the same immunohistochemical reaction, laser power, pinhole, and exposure settings were captured once on sample from a representative control section and maintained throughout imaging. Images were processed with the software Zen (Zeiss) and exported into tiff images for figure generation or WMV for video exporting. Only brightness and contrast were adjusted for the whole frame, and no part of any frame was enhanced or modified in any way.
Statistical analysis
Student’s unpaired t-test was used for comparisons between two data groups. Two-way ANOVA was used to determine if there was any statistically significant difference between groups and time points in the differentiation assay and Fisher’s LSD was used to determine which time points exhibited statistically significant differences between genotypes. Pearson’s correlation coefficient was calculated to quantify the level or correlation between datasets and Fisher’s exact test was used to further investigate the similarities between human and mouse primary myoblasts gene expression data. All results which passed the threshold for statistical significance were tested for normal distribution using the Shapiro-Wilk normality test, all analysed data were normally distributed. A p-value of ≤ 5.0e-2 was considered statistically significant, and the values are reported as follows in figures: *p ≤ 5.0e-2, **p< 1.0e-2, ***p < 1.0e-3, ****p < 1.0e-4. All statistical analyses outside of differential gene expression and GO enrichment analyses were performed using GraphPad Prism 8.4.2.
Author’s contributions
MRFG contributed mouse experiments and transcriptomic analyses (with SCR); VM and CP contributed comparative human data; MB analysed TFBS; LB performed immunolocalizations in spheroids; SCR and MK supervised transcriptomic analyses and DCG conceptualised the project, supervised experiments and wrote the final version of the manuscript. All authors contributed to data analysis and writing of the manuscript.
Conflicts of interest
None.
Figure S1: Differential expression of muscle programme markers in primary myoblasts from Dmdmdx and Dmdmdx-βgeo mice.
Results of qPCR expression analyses of indicated markers relative to wild type, normalized to Gapdh, shown as individual datapoints for biological replicates. Error bars represent mean ± SEM, n = 3, * = p < 5.0e-2, ** = p ≤ 1.0e-2, *** = p ≤ 1.0e-3, **** = p ≤ 1.0e-4 (Student’s unpaired t-test).
Figure S2: Immunodetection of the sarcomeric myosin heavy chain 4 in Dmdmdx and BL/10 in differentiated spheroids.
Representative immunofluorescence micrographs of sections across spheroids differentiated for 7 days showing presence of MYH4 protein (green). Cell nuclei stained with DAPI (blue). Scale bar = 50μm).
Figure S3: Decreased cell chemotaxis of dystrophic established mouse myoblasts.
In the trans-well assay, cells were migrating towards the well containing proliferation medium. Graph shows relative values of individual replicates revealing significantly reduced movement of dystrophic cells compared to their WT equivalent. Error bars represent mean ± SEM, n = 4, ** = p < 1.0e-2 (Student’s unpaired t-test).
Figure S4: Immunodetection of Dp427 in WT primary mouse myoblasts.
Representative immunofluorescence micrographs of sections across C57BL/10 tibialis anterior muscle and primary Dmdmdx myoblasts stained with an antibody detecting epitopes in exons 31/32 of Dp427. Note the expected immunofluorescence signal (green) under the sarcolemma of myofibers, and absence of any discernible dystrophin immunoreactivity in myoblasts in culture, reacted and imaged under conditions identical to those used for muscle sections. Negative (no primary antibody) control shown. l indicates the specificity of the staining. Cell nuclei stained with DAPI (blue). Scale bar = 50 μm.
Figure S5: STRING interaction diagram of genes in the GO category: Negative regulation of gene expression, epigenetic.
Interaction network representing genes in GO:0045814. Each node depicts a gene; edges between nodes indicate interactions between protein products of the corresponding genes and the aggregated interaction scores from experimental data and interaction databases (see the Edge Confidence graphic legend for details). Genes significantly downregulated in dystrophic myoblasts are highlighted in red and the common interactor between all significantly downregulated genes (Kdma1) is highlighted in yellow. Isolated nodes are not shown.
Figure S6: Decreased expression of Dp71 transcript in primary myoblasts from Dmdmdx mice.
Results of qPCR expression assay shown as normalised individual datapoints for biological replicates relative to wild type, normalised to Gapdh. Error bars represent mean ± SEM, n = 3, * = p<5.0e-2 (Student’s unpaired t-test).
Table legends
Table S1: Genes significantly dysregulated in Dmdmdx vs. WT primary myoblasts.
From left to right, columns show ENSEMBL gene id, gene symbol, log2 fold change between Dmdmdx and WT primary myoblasts, adjusted p-value as output by DESeq2, average FPKM for Dmdmdx and WT groups. Genes are ordered from most downregulated to most upregulated.
Table S2: Tabulation of genes significantly dysregulated in Dmdmdx-βgeo vs. WT primary myoblasts.
From left to right, columns show ENSEMBL gene id, gene symbol, log2 fold change between Dmdmdx-βgeo and WT primary myoblasts, adjusted p-value as output by DESeq2, average FPKM for Dmdmdx-βgeo and WT groups. Genes are ordered from most downregulated to most upregulated.
Table S3: Identification of putative molecular regulators of genes altered in Dmdmdx myoblasts.
The overrepresentation of binding sites for transcriptional regulators in the promoter region of the altered transcripts was identified using the seqinspector online resource (see Materials and Methods).
A) TFBS analysis results for transcripts upregulated in Dmdmdx myoblasts. Column legend: id - ChIP- Seq track id; name - TF name, followed by the index of ChIP-Seq track for this TF; p-value - t-test p-value for overrepresentation of ChIP-Seq signal; Bonferroni - Bonferroni-corrected p-value; foldchange - a ratio of ChIP-Seq signal averaged across all promoters in the gene list versus 1000 random gene promoters; backgroundmean - averaged signal from the track across 1000 random gene promoters; querymean - averaged signal across all promoters from the submitted list. B. TFBS analysis results for transcripts downregulated in Dmdmdx myoblasts. columns - as in A. C) top 10 genes for each of the significantly overrepresented TFs for transcripts downregulated in Dmdmdx. D-G) TFBS analysis results (column legend as in A) for the following gene lists: upregulated in Dmdmdx-βgeo; downregulated in Dmdmdx-βgeo; upregulated in SC-5; downregulated in SC-5. H) gene lists as submitted to the seqinspector tool, including gene symbols that were translated for database compatibility.
Table S4: GO categories significantly enriched in the downregulated gene lists from primary Dmdmdx vs. WT and Dmdmdx-βgeo vs. WT.
Columns A and D show the GO category ID, columns B and E show GO category description and columns C and F show adjusted p-value for GO categories enriched in the significantly downregulated genes in primary Dmdmdx and Dmdmdx-βgeo myoblasts, respectively. GO categories are ordered from the lowest (top) to the highest (bottom) p-value for each analysis and GO categories significantly enriched in both analyses are highlighted in red.
Table S5: Genes significantly dysregulated in SC5 (dystrophic) vs. IMO (WT) myoblast cell line.
From left to right, columns show ENSEMBL gene id, gene symbol, log2 fold change between SC5 and IMO primary myoblasts, adjusted p-value as outputted by DESeq2, average FPKM for SC5 and IMO groups. Genes are ordered from most downregulated to most upregulated.
Table S6: GO categories significantly enriched in the downregulated gene lists from primary Dmdmdx vs. WT and SC5 vs. IMO cell lines.
Columns A and D show the GO category ID, columns B and E show GO description and columns C and F show adjusted p-value for GO categories enriched in the significantly downregulated genes in SC5 myoblast cell line and primary Dmdmdx myoblasts, respectively. GO categories are ordered from the lowest (top) to the highest (bottom) p-value for each analysis and GO categories significantly enriched in both analyses are highlighted in red.
Table S7: Genes significantly dysregulated in DMD vs. healthy primary human myoblasts.
From left to right, columns show ENSEMBL gene id, gene symbol, log2 fold change between DMD and healthy human primary myoblasts, adjusted p-value as outputted by DESeq2, average FPKM for human DMD and health groups. Genes are ordered from most downregulated to most upregulated.
Table S8: GO categories significantly enriched in the downregulated gene lists from dystrophic vs. WT human primary myoblasts and Dmdmdx vs. WT mouse primary myoblasts.
Columns A and D show GO category ID, columns B and E show GO category description and columns C and F show adjusted p-values for GO categories enriched in the significantly downregulated genes in primary human DMD and mouse Dmdmdx myoblasts, respectively. GO categories are ordered from the lowest (top) to the highest (bottom) p-value for each analysis and GO categories significantly enriched in both analyses are highlighted in red.
Table S9: Interactions between genes in the GO category GO:0045814: “Negative regulation of gene expression, epigenetic” generated in STRING.
Columns A and B show nodes connected by an edge, column C shows the interaction score if one has been determined experimentally, column D shows the interaction score if an interaction is present in a database feeding into STRING and column E shows the combined interaction score.
Table S10: Primers used in real-time quantitative PCR analysis.
Primers were designed specifically except Gapdh primer set, which was taken from 112.
Acknowledgements
The authors would like to thank S Arkle, C Crane-Robinson and K Zabłocki for the critical comments on the manuscript. SCR was partially funded through an Expanding Excellence in England (E3) grant from Research England.
Footnotes
References
- 1.↵
- 2.↵
- 3.↵
- 4.↵
- 5.↵
- 6.↵
- 7.↵
- 8.↵
- 9.↵
- 10.↵
- 11.↵
- 12.
- 13.↵
- 14.↵
- 15.↵
- 16.↵
- 17.↵
- 18.↵
- 19.↵
- 20.↵
- 21.↵
- 22.↵
- 23.
- 24.↵
- 25.↵
- 26.↵
- 27.↵
- 28.↵
- 29.↵
- 30.↵
- 31.↵
- 32.↵
- 33.↵
- 34.↵
- 35.↵
- 36.↵
- 37.↵
- 38.↵
- 39.↵
- 40.↵
- 41.↵
- 42.↵
- 43.↵
- 44.↵
- 45.↵
- 46.↵
- 47.↵
- 48.↵
- 49.↵
- 50.↵
- 51.↵
- 52.↵
- 53.↵
- 54.↵
- 55.↵
- 56.↵
- 57.↵
- 58.↵
- 59.↵
- 60.↵
- 61.↵
- 62.↵
- 63.↵
- 64.↵
- 65.↵
- 66.↵
- 67.↵
- 68.↵
- 69.↵
- 70.↵
- 71.↵
- 72.↵
- 73.↵
- 74.↵
- 75.↵
- 76.↵
- 77.
- 78.↵
- 79.↵
- 80.↵
- 81.↵
- 82.↵
- 83.↵
- 84.↵
- 85.↵
- 86.↵
- 87.↵
- 88.↵
- 89.↵
- 90.↵
- 91.↵
- 92.↵
- 93.↵
- 94.↵
- 95.↵
- 96.↵
- 97.↵
- 98.↵
- 99.↵
- 100.↵
- 101.
- 102.
- 103.↵
- 104.↵
- 105.↵
- 106.↵
- 107.↵
- 108.↵
- 109.↵
- 110.↵
- 111.↵
- 112.↵


