

Abstract
The identity and biological activity of most metabolites still remain unknown. A key bottleneck in the full exploration of this tremendous source of new structures and pharmaceutical activities is the compound purification needed for bioactivity assignments of individual compounds and downstream structure elucidation. To enable bioactivity-focused compound identification from complex mixtures, we developed a scalable native metabolomics approach that integrates non-targeted liquid chromatography tandem mass spectrometry, and simultaneous detection of protein binding via native mass spectrometry. While screening for new protease inhibitors from an environmental cyanobacteria community, native metabolomics revealed 30 cyclodepsipeptides as chymotrypsin binders. Mass spectrometry-guided purification then allowed for full structure elucidation of the most prevalent compounds via nuclear magnetic resonance spectroscopy, as well as orthogonal bioactivity studies. Together, these results identified the rivulariapeptolides as a family of serine protease inhibitors with nanomolar potency.
Main
Specialized metabolites, often referred to as natural products, are a tremendous pool of chemically diverse and pharmaceutically active organic compounds. By some estimates more than 50% of all current pharmaceuticals are based on or inspired by natural products1. Nevertheless, the vast majority of biological activities and pharmaceutical potential of specialized metabolites, still remain to be discovered, and their ecological functions to be understood2.
While mining genome and meta-genome data starts to provide an overview of the biosynthetic potential of nature3,4, most specialized metabolites remain inaccessible, as the living organism that produces these metabolites cannot be cultured or their gene clusters remain silent under laboratory culturing conditions. Natural product discovery and chemical ecology studies in environmental samples are hence becoming more and more attractive5.
Along with next-generation sequencing technologies, recent instrument and computational advances in nuclear magnetic resonance (NMR) spectroscopy and non-targeted liquid chromatography tandem mass spectrometry (LC-MS/MS) offer tremendous assistance to explore the uncharted metabolic space of nature6. These tools enable large scale compound dereplication, rapid identification of chemical analogs, and de novo annotation of molecular formulas, substructures, chemical classes and structures7–12. However, the assignment of bioactivity of newly identified metabolites, typically requires assays using pure compounds. Therefore, the isolation of specialized metabolites is typically guided by repetitive bioactivity assays. Together with full structure elucidation, this process usually takes months, and is therefore a major bottleneck for the systematic exploration of nature for novel pharmaceutically active compounds and comprehensive chemical ecology studies.
A logical next step is the development of activity metabolomics13 or functional metabolomics14 approaches, that aim to add functional information to the metabolites detected in a given system.
With native electrospray ionization (ESI), mass spectrometry (MS) is increasingly being used to analyze non-covalent binding of biomolecules, typically performed in direct infusion experiments15–21. While native MS workflows have been developed that can identify metabolites bound to proteins by MS/MS22, combining the separation power of ultra-high-performance liquid chromatography (UHPLC) and the selectivity of native MS offer a great potential to decipher protein-metabolite interactions out of complex biological mixtures, such as environmental samples. However, typical mobile phase conditions disfavor non-covalent protein binding due to an acidic pH and high organic solvent content.
To perform native MS coupled to UHPLC, we developed an experimental setup that increases pH and water content of the mobile phase post-column and infuses a protein binding partner before entering the ESI interface (Figure 1). As the protein is constantly infused post-column, one can monitor the intact protein mass over the LC-MS run and observe mass shifts when eluting metabolites bind to the protein at a defined retention time. Using collision induced dissociation (e.g., Higher Energy C-Trap Dissociation (HCD) in our setup), the complex can be dissociated again in the mass spectrometer and a “binding threshold” can be applied to distinguish between specific and non-specific binding. In combination with parallel non-targeted MS/MS analyses, the mass and compound ID or compound class can be assigned (level 2 or level 3 annotation23,24).

(a) Native metabolomics setup. A crude extract is separated by µ-flow UHPLC. The pH is adjusted after chromatography with ammonium acetate to “native-like” conditions via the make-up pump. Orthogonally, protein of interest is infused, and the resulting protein-binder complexes are measured by FT-MS. The procedure is repeated as a metabolomics run (high resolution UHPLC-MS/MS acquisition without protein infusion). For the data analysis (b) the Δ m/z and retention time of the native MS run are correlated with m/z values and retention time of the metabolomics (LC-MS/MS) run and subsequently visualized using molecular networking and retention time pairing that links the observed mass differences of the protein in the native state vs bound states with the parent mass of MS/MS spectra of the small molecule.
After our initial method validation, we screened for new protease inhibitors from an environmental cyanobacteria biofilm as a first application. In general, cyanobacteria have been a rich source of highly bioactive natural products25–28, and in particular protease inhibitors from numerous chemical classes29–34. Protease inhibitors are key compounds used for treatment of viral infections (HIV and Hepatitis C)35, cancer36, diabetes37, hypertension38, and as general anti-coagulants39. Several of the approved protease inhibitors are analogs of natural products such as aliskiren, captopril, and carfilzomib that target renin, angiotensin-converting enzyme, and proteasome, respectively40.
In this study, we used chymotrypsin as the protease target to identify inhibitors from a marine cyanobacteria community. Using our native metabolomics approach, we identified 30 chymotrypsin binders in the crude extract with a single LC-MS run. The masses and MS/MS spectra of the binders were queried against structural and spectral databases, revealing that most of them were unknown. This led to the targeted isolation and structure elucidation of a family of new, and highly potent protease inhibitors, which we termed “rivulariapeptolides”.
Results
Development of the native metabolomics approach
In a crude extract, native metabolomics provides binding information about each compound towards a protein of interest. In our experimental set-up, we utilized a single 10-minute LC-MS run to discover compounds that bind to the serine protease, chymotrypsin. The workflow is as follows: A crude extract is analyzed using native ESI while the protein of interest is infused post-column throughout the entire LC gradient. Binding of a small molecule to the protein of interest results in a peak with a mass corresponding to the protein bound to the compound. The m/z difference between the protein-ligand complex and the unbound protein reveals the molecular weight of the ligand while the ratio of the intensity of the protein-ligand peaks relative to the unbound protein peaks provides a qualitative indication of the binding affinity under these conditions.
We first optimized the pH for native mass spectrometric acquisition of chymotrypsin and confirmed that the enzyme remains active under our native metabolomics buffer conditions. As a positive control for binding, we used molassamide41, a known non-covalent serine protease inhibitor of the 3-amino-6-hydroxy-2-piperidone (Ahp)-cyclodepsipeptide family. We found that an ammonium acetate buffer of pH 4.5 showed the highest peak intensity (Figure S1a). Next, we injected a serial dilution of molassamide into our native metabolomics LC-MS setup where it was mixed post-column with a constant concentration of chymotrypsin. The protein-ligand complex was detected at a deconvoluted mass of 26195.1 Da and the unbound apoprotein at 25232.6 Da (Figure S1b). The observed Δ mass of 962.5 Da matches the mass of molassamide (962.4749 Da). After deconvolution and integrating the peak area of the protein-ligand complex and plotting it against the molassamide concentration in the peak window, we obtained a binding curve. The resulting curve depicts a concentration-dependent increase of protein-ligand to unbound protein ratio with increasing ligand concentration (Figure S1c). To test the specificity of these interactions, we evaluated binding of small molecule QC standards and the peptidic cysteine protease inhibitor gallinamide A27,42,43. We could not detect any binding to chymotrypsin by these negative controls under native MS conditions (Figure S2).
To further test our native metabolomics conditions, chymotrypsin was assayed with crude extract from the cyanobacterium Rivularia sp. using a fluorescence substrate competition assay. The bioassay conditions were designed to mimic the pH and solvent composition expected in the native mass spectrometry setup. Although chymotrypsin is optimally active in near-neutral pH, it retains good activity in 10 mM ammonium acetate at pH 4.5. Under these conditions, it was completely inhibited by 10 µg/mL of extract with 50% inhibition at 0.84 µg/mL (Figure S1d). Chymotrypsin was then assayed in increasing concentrations of acetonitrile (ACN) to determine if enzyme activity was retained in this solvent. Activity was reduced by 9% to 34% in ACN concentrations up to 33.3% v/v. In the presence of 41.7% v/v ACN which corresponds to the end of the UHPLC gradient, activity was decreased by 70% (Figure S1e). These results confirmed that chymotrypsin can be used as a target protease for native metabolomics as it retains activity at pH 4.5 in ACN concentrations up to 42% and binds to compounds from an inhibitory crude extract.
Native metabolomics reveals chymotrypsin binders
Following the successful proof-of-concept experiment with molassamide, we next screened for potential chymotrypsin binders from a crude extract of a biofilm from the marine cyanobacterium Rivularia sp, collected from coral sediments at Carlos Rosario Beach in Culebra, Puerto Rico, U.S. The methanol extract was separated by reversed-phase UHPLC and ammonium acetate buffer and chymotrypsin were infused post-column, prior to native ESI and acquisition of mass spectrometry data in the high m/z range (2500-5000 m/z). The crude extract was subsequently re-injected, without infusion of chymotrypsin to obtain high-resolution LC-MS/MS data of compounds in the extract in the low m/z range (300-2000 m/z).
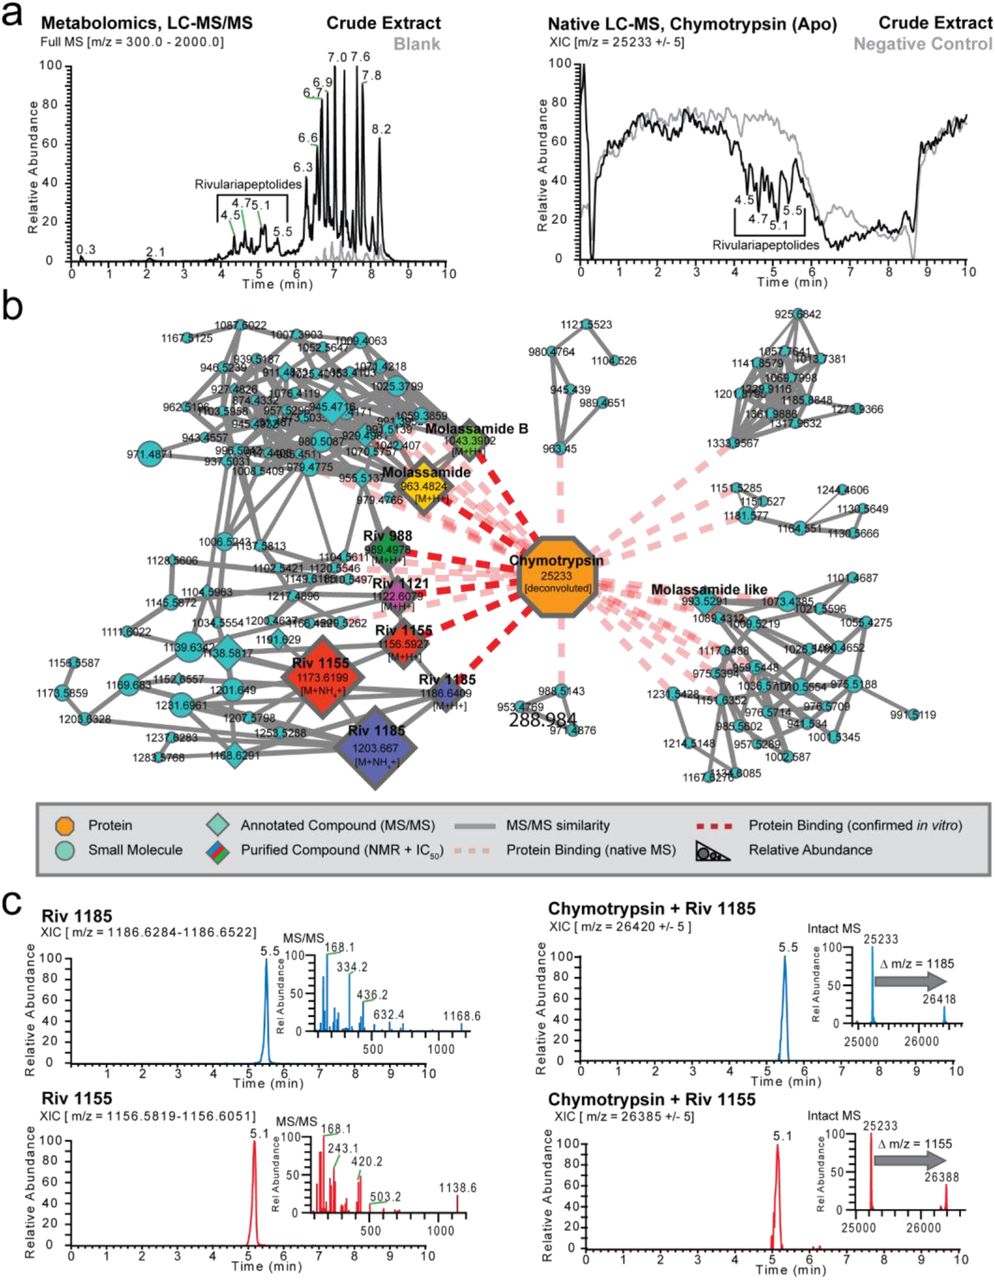
As a first step of data analysis, we plotted the total ion current (TIC) of the crude extract metabolomics data (Figure 2a, left) and extracted ion chromatogram (XIC) of the apo-chymotrypsin from charge state deconvoluted native mass spectrometry data (Figure 2a, right) which shows several negative peaks in the range of 4.5 - 5.5 minutes. The decrease in signal of the apo-protein in that retention time range is due to the emergence of larger masses that correspond to protein-ligand complexes. After feature finding of the deconvoluted masses and matching of the parallel metabolomics LC-MS/MS data of the crude extracts by retention time and exact mass matching, we could identify more than 30 potential small molecule-protein complexes. To display the family of small molecules that form protein ligand complexes and to show their structural relations, we visualized them in a correlation molecular network (Figure 2b) that is based on their MS/MS similarity (grey line), retention time, and mass matching between protein and small molecules through the red dashed lines.

(a) Left panel: Full mass spectrum (m/z 300 - 2,000) of cyanobacterial crude extract and blank. The retention times (RT = 4.5 - 5.5 min) of major Ahp-cyclodepsipeptides are highlighted. Right panel: Deconvoluted extracted ion chromatogram (m/z 25,233 ± 5) of alpha-chymotrypsin screened against the cyanobacterial crude extract under native MS conditions and negative control. (b) Correlation molecular network of deconvoluted chymotrypsin and putatively new small molecule inhibitors binders by native MS. (c) Upper left panel: Extracted ion chromatogram (m/z 1,186.6284 - 1,186.6522) and MS2 spectrum of putative new chymotrypsin-binder rivulariapeptolide 1185 at RT = 5.5 min. Upper right panel: Extracted ion chromatogram (m/z 26,420 ± 5) of a putative chymotrypsin-binder complex. Mass difference between the putative chymotrypsin-binder complex (m/z 26,420 ± 5) and apo chymotrypsin (25,233 ± 5) suggests a molecular weight of 1,187 ± 5 Da for the putative chymotrypsin binder rivulariapeptolide 1185. Lower left panel: Extracted ion chromatogram (m/z 1,156.5819 - 1,156.6051) and MS2 spectrum of putative putative chymotrypsin-binder rivulariapeptolide 1185 at RT = 5.1 min. Lower right panel: Extracted ion chromatogram (m/z 26,385 ± 5) of a putative chymotrypsin-binder complex. Mass difference between the putative chymotrypsin-binder complex (m/z 26,385 ± 5) and apo chymotrypsin (25,233 ± 5) suggests a molecular weight of 1,152 ± 5 Da for the putative chymotrypsin binder rivulariapeptolide 1155.
The molecular weight of these chymotrypsin binding compounds ranged from 900 to 1,250 Da (Figure S3), the most abundant being m/z 1186 and m/z 1156 that also show perfect overlap of the chromatographic profiles between intact protein and metabolomics LC-MS/MS data (Figure 2c). Based on their highest relative abundance we targeted them for further purification, structure determination by NMR and orthogonal protease inhibition assays.
Rivulariapeptolides, a family of new Ahp-cyclodepsipeptides
The potential chymotrypsin binder with the nominal m/z 1186, identified by native metabolomics, was next targeted for isolation and structure elucidation. Hence, we first separated the Rivularia crude extract into four fractions of decreasing polarity via solid phase extraction. SMART NMR11,44 analysis was applied to the most hydrophilic fraction and all but one structure of the top 10 SMART results were predicted as cyclic depsipeptides (Figures 3a, S4), including 6 of the top 10 as Ahp-cyclodepsipeptides (three from marine filamentous cyanobacteria: somamide B, molassamide, lyngyastatin 6)41,45–47. Complementarily, MS/MS-based molecular networking analysis of the Rivularia crude fractions helped with the annotation of the known Ahp-peptides molassamide, kurahamide, and loggerpeptin A along with several putatively new ones (Figure 3b, S5a). Next, the SIRIUS and ZODIAC48,49 tools were applied to determine the molecular formula of the chymotrypsin-binding features, with exact mass m/z 1186.6400 [M+H]+, as C61H87N9O15 (0.5 ppm). Subsequently, we classified the MS/MS spectrum indicative for a ‘cyclic depsipeptide’ based on the classification with CANOPUS9. Further substructures of the molecule were predicted as benzene, hydroxy-benzene, and proline/ N-acyl-pyrrolidine derivatives, as well as piperidinone/delta-lactam for the Ahp-family defining moiety (Figure 3c).

Structure elucidation workflow based on NMR and MS/MS data (a). The workflow combined automated in-silico MS/MS and NMR annotation tools for fast compound class identification and dereplication of known natural products exemplified for the new natural product rivulariapeptolide 1185. (b) Molecular networking and SMART analysis suggested the presence of a AHP-cyclodepsipeptide molecular family. (c) In depth MS and MS/MS analysis of the new natural products with the SIRIUS tool framework helped to establish the molecular formula and to gain substructural information about the N-acylated proline residues, characteristic for the rivulariapeptolide subfamily. (d) Unambiguous structure elucidation by various 1D/2D NMR and MS/MS experiments led to the planar structure of rivulariapeptolide 1185. Selected 2D NMR-derived correlations and MS2 fragmentations are depicted.
To unambiguously determine the structure, we isolated nominal m/z 1186, named rivulariapeptolide 1185 (1), and performed 1D and 2D NMR experiments and manual MS/MS interpretation (Figure 3d, Figures S6-S11, Table S1). Subsequently, we targeted the isolation of further rivulariapeptolides by preparative HPLC, based on their protein-ligand complex ratios from the native metabolomics experiments as well as their relative abundance. In that way, we isolated and elucidated the planar structures of the rivulariapeptolides 1185, 1155, 1121, and 989 (1, 2, 3, 4) with the exact masses 1186.6400 [M+H]+ (C61H88N9O15, 0.5 ppm), 1156.5923 [M+H]+ (C59H82N9O15, - 0.2 ppm), 1122.6080 [M+H]+ (C56H84N9O15, - 0.1 ppm) and 989.4978 [M+H]+ (C50H69N8O13, - 0.1 ppm). In addition to rivulariapetolides, we identified the already known molassamide (5) as well as new derivative we termed “molassamide B” (6) with m/z 1041.3924 [M+H]+ (C48H66BrN8O13, −0.3 ppm), which is ortho-brominated (Scheme S1, Table S2-S3, Figures S12-S34).
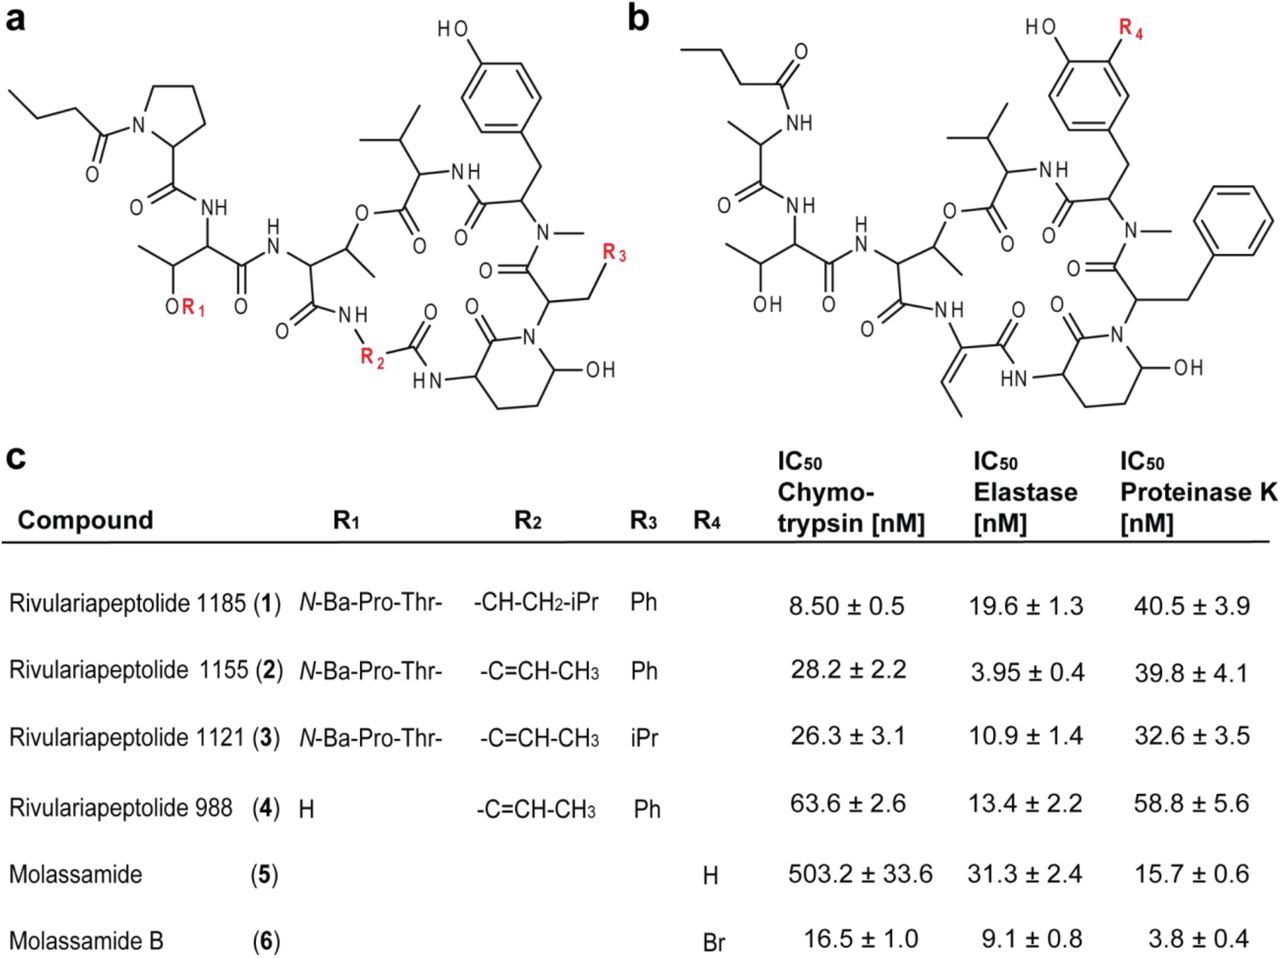
Finally, the chymotrypsin inhibitory activities of the purified Ahp-cyclodepsipeptides 1-6 were assessed by specific biochemical assays and confirmed the results of our native metabolomic protein infusion MS experiments (Figure 4b). All six compounds were found to be nanomolar chymotrypsin inhibitors with compound 1 being the most potent (Figure 4, IC50 = 8.5 ± 0.54 nM). Intriguingly, a single ortho-bromination in the N-methyltyrosine moiety led to a 30-fold increase in potency for the new compound 6 (IC50 = 16.54 ± 1.02 nM), when compared to the known compound 5 (IC50 = 503.2 ± 33.6 nM). These promising results led us to test these six Ahp-cyclodepsipeptides against two other serine proteases, elastase and proteinase K, which are of biomedical and ecological relevance, respectively.

(a) Structures of the isolated rivulariapeptolides 1185 (1), 1155 (2), 1121 (3), 988 (4). (b) Structures of the isolated known molassamide (5), and the new molassamide B (6). (b) Potency of isolated compounds for selected serine proteases following 40 min pre-incubations. Data are presented as the mean ± SD, n = 3.
While 2 was found to be the most potent elastase inhibitor (IC50 = 13.95 ± 0.36 nM), 6 was the most potent proteinase K inhibitor (IC50 = 3.83 ± 0.37 nM). The isolated compounds were docked by induced-fit, inside the binding pocket of alpha-chymotrypsin (PDBID 4Q2K) and all were found to have a similar binding mode (Figure S35) that was revealed by crystal structures of Ahp-cyclodepsipeptides in complex with serine proteases50,51.
Discussion
Here we describe the use of native metabolomics protein infusion MS to simultaneously detect protein-metabolite binding and annotate their molecular structures. This approach can be used for rapid screening of small molecule modulators for proteins of interest, directly from crude extracts. In our case study, we identified 30 chymotrypsin binding natural products in a 10 min LC-MS run from a few µg of crude extract. This process would have taken month to years via traditional bioactivity-guided natural product discover approaches, and most likely would not have been possible to this extent.
The amounts of protein needed for native metabolomics high-throughput screening are a few mg for a 24 h screen of 96 samples with a 10 min LC-MS method, which is both achievable and affordable with commercially available proteins or in house heterologous protein expression.
Besides the ad-hoc experimental determination of binding information, we systematically organized this information in the public GNPS spectral library through spectrum tags. Hence, native metabolomics derived properties are accessible in future experiments and can provide biological context to complex metabolomes.
While we primarily used the method for an initial screening approach and assigned binary binding information (binder/non-binder), titration experiments using native mass spectrometry can be used to determine relative dissociation constants (Kd) by fitting the intensity ratio of bound and unbound protein as a function of the added ligand. This method first assumes that no dissociation takes place during the transmission through the mass spectrometer, and second, that the observed gas phase intensity ratio correlates with the solution ratio. These assumptions imply that ESI titration measurements can deliver a relative “snapshot” of the solution concentrations to reflect solution-phase binding affinities. Nevertheless, as the experimental environment is inherently different (gas phase vs. solution) absolute binding affinities might differ from solution based orthogonal assays52.
From a natural product discovery perspective, it is very interesting that 30 putative bioactive molecules were discovered in a single extract. This indicates that the chemical space for certain bioactive molecular families can often be underestimated when compared to traditional bioactivity-guided approaches, as they are typically biased towards the most abundant or most active compounds. At least for Ahp-cyclodepsipeptides, recent biosynthetic studies suggest that the high structural diversity of these compounds is mainly driven by the hypervariability of amino acids in the positions proceeding and following the Ahp-unit (see Figure 4a for the definitions of residues R3 and R2, respectively)53. The events impacting R2 can be explained by high-frequency point mutations. This is sought to provide an evolutionary platform to iteratively test combinations while maintaining the central activity. However, the amino acid substitutions at R3 most likely occur via recombination events, thereby allowing for evolutionary shortcuts53. These biosynthetic hypotheses are supported by the compounds isolated in this study and add to a better understanding of structure-activity relationships for Ahp-cyclodepsipeptides. Comparing rivulariapeptolide 1185 (1) to rivulariapeptolide 1121 (3), a leucine residue is swapped for an Abu unit at R2, and phenylalanine is replaced by leucine at R3. The most surprising structure-activity relationship gained from this study, however, was that a single substitution of bromine (molassamide B, 6) for hydrogen (molassamide, 5) led to a thirty-, three-, and four-fold increase in potency towards chymotrypsin, elastase, and proteinase K, respectively. This finding, together with the fact that several additional brominated Ahp-peptides but no chlorinated Ahp-peptides could be identified (Figure S36), indicates the need for further structure-activity investigations as well as biosynthetic studies that characterize the responsible halogenases.
The protease inhibition of the compounds discovered with the native metabolomics workflow was confirmed with an orthogonal fluorescence assay against three proteases. At nanomolar concentration their IC50 show high potency and exhibit distinct selectivity (Figure 4c, Tables S4 and S5). For example, molassamide (5) is the second most potent inhibitor screened against proteinase K but is the least potent inhibitor for chymotrypsin and elastase. Rivulariapeptolide 1155 (2), on the other hand, is the most potent elastase inhibitor but shows much lower inhibition against both chymotrypsin and proteinase K.
Together, these findings highlight the utility of the native metabolomics approach presented herein. Beyond the discovery of novel protease inhibitors, we anticipate that native metabolomics will be applied for the screening of a broad variety of non-covalent interactions of biomolecules from complex mixtures and could be of central importance for the development of activity/ functional metabolomics workflows, both for drug discovery as well as chemical ecology studies.
Methods
Cyanobacterial collection and taxonomy
Marine cyanobacteria biofilm samples were collected in an intertidal zone growing on rock/reef substrate on May 14th, 2019, and at 0.5 − 2.0 m of water at Carlos Rosario Beach in Culebra, Puerto Rico, U.S (GPS coordinates: 18°19’30.0”N 65°19’48.0”W) on April 6th, 2019. Biomass for both samples was hand collected (DRNA Permit O-VS-PVS15-SJ-01165-15102020). Microscopic examination indicated that this collection was morphologically consistent with the genus Rivularia. 16S rDNA analysis confirmed the identity as Rivularia spp. PCC 7116. Voucher specimen available from E.C.D. as collection no. MAP14MAY19-1, and from W. H. G. as collection no. CUR6APR19-1.
Micro-flow LC-MS/MS data acquisition
For micro-flow UHPLC-MS/MS analysis 2 µL were injected into vanquish UHPLC system coupled to a Q-Exactive quadrupole orbitrap mass spectrometer (Thermo Fisher Scientific, Bremen, Germany) with an Agilent 1260 quaternary HPLC pump (Agilent, Santa Clara, USA) as a make-up pump. For reversed-phase chromatographic, a C18 core-shell microflow column (Kinetex C18, 150 × 1 mm, 1.8 um particle size, 100 A pore size, Phenomenex, Torrance, USA) was used. The mobile phase consisted of solvent A (H2O + 0.1 % formic acid (FA)) and solvent B (acetonitrile (ACN) + 0.1 % FA). The flow rate was set to 150 µL/min. A linear gradient from 5-50 % B between 0-4 min and 50-99 % B between 4 and 5 min, followed by a 2 min washout phase at 99% B and a 3 min re-equilibration phase at 5 % B. Data-dependent acquisition (DDA) of MS/MS spectra was performed in positive mode. Electrospray ionization (ESI) parameters were set to 40 arbitrary units (AU) sheath gas flow, auxiliary gas flow was set to 10 AU and sweep gas flow was set to 0 AU. Auxiliary gas temperature was set to 400 °C. The spray voltage was set to 3.5 kV and the inlet capillary was heated to 320 °C. S-lens level was set to 70 V applied. MS scan range was set to 200-2000 m/z with a resolution at m/z 200 (Rm/z 200) of 70,000 with one micro-scan. The maximum ion injection time was set to 100 ms with automatic gain control (AGC) target of 5E5. Up to two MS/MS spectra per duty cycle were acquired at Rm/z 200 17,000 with one micro-scan. The maximum ion injection time for MS/MS scans was set to 100 ms with an AGC target of 5.0E5 ions and a minimum 5% AGC. The MS/MS precursor isolation window was set to m/z 1. The normalized collision energy was stepped from 20 to 30 to 40% with z = 1 as the default charge state. MS/MS scans were triggered at the apex of chromatographic peaks within 2 to 15 s from their first occurrence. Dynamic precursor exclusion was set to 5 s. Ions with unassigned charge states were excluded from MS/MS acquisition as well as isotope peaks. For native metabolomics experiments, the same chromatographic parameters were used and in addition 150 µL/min ammonium acetate buffer was infused post-column through a make-up pump and a PEEKT-splitter and enzyme solution was infused with 2 µL/min flow rate via a syringe pump. ESI settings were set to 40 arbitrary units (AU) sheath gas flow, auxiliary gas flow was set to 10 AU and sweep gas flow was set to 0 AU. Auxiliary gas temperature was set to 400 °C. The spray voltage was set to 3.5 kV and the inlet capillary was heated to 300 °C. S-lens level was set to 80 V applied. MS scan range was set to 2000-4000 m/z with a resolution Rm/z 200 140,000 with 2 microscans. MS acquisition was performed in all ion fragmentation (AIF) mode with Rm/z 200 with 20% HCD collision energy and an isolation window of 2000 - 4000 m/z. To estimate binding strength a second MS data acquisition method was used that ramped HCD collision energy in 4 iterative scans with 0%, 20%, 40% and 60% per duty cycle.
Native metabolomics data analysis
For native LC-MS data, multiple charged spectra were deconvoluted using the xtract algorithm in Qualbrowser, part of the Xcalibur software (Thermo Scientific). Both deconvoluted native LC-MS and metabolomics LC-MS/MS .raw files were converted to centroid .mzML file format using MSconvert of the proteowizard software package. Feature finding of both file types was performed using a modified version of MZmine2.37 (corr.17.7). Feature tables from both intact protein mass and metabolomics data were matched by their retention time (RT) and an m/z offset corresponding to the mass of chymotrypsin (25234 Da) with an RT tolerance of 0.2 min and a mass tolerance of 4 Da. Feature tables (.csv), MS/MS spectra files (.mgf), and ion identity networking results (.csv) were exported and uploaded to the MassIVE repository. LC-MS/MS data was submitted to GNPS for feature-based molecular networking analysis. Downstream combined Molecular-Networks and chymotrypsin small molecule binding were visualized as networks in cytoscape (3.8.2).
pH dependency of native metabolomics
pH values over the entire LC gradient and peak intensities were both assessed using three different make-up solvents. Make-up solvent A was water, make-up solvent B was 10 mM ammonium acetate buffer, and make-up solvent C was 10 mM ammonium acetate buffer + 0.2% ammonium hydroxide, v/v. Molassamide was prepared as 100 µM solutions from a 10 mM stock solution in DMSO by preparing a 1:100 dilution into solvent mixture 1 (water + 10% acetonitrile + 0.1% formic acid). Samples were analyzed as described in micro-flow LC-MS/MS data acquisition; 2 µL of each solution were injected into the mass spectrometer, while chymotrypsin (Sigma),dissolved in water to a final concentration of 2 mg/mL, was injected through the syringe pump at a flow rate of 2 µL/min. pH values were assessed by disconnecting the flow to the source and collecting ∼30 µL of solvent every minute then testing this value on pH paper.
Titration of ligands and concentration dependency
Molassamide, Riv 1155, and Riv 1185 were prepared as 100 µM solutions from a 10 mM stock solution in DMSO by preparing a 1:100 dilution into solvent mixture 1 (water + 10% acetonitrile + 0.1% formic acid). From this 100 µM solution, dilutions were prepared at 10 µM, 1 µM, and 0.1 µM into solvent mixture 1. 2 µL of each solution were injected into the mass spectrometer, then 5 µL and 10 µL of the 100 µM solution were injected to yield final concentrations of 250 µM and 500 µM, respectively. Samples were analyzed as described in Micro-Flow LC-MS/MS data acquisition, while chymotrypsin (Sigma Aldrich) was dissolved in water to a final concentration of 2 mg/mL and injected through the syringe pump at a flow rate of 2 µL/min. The ratio of bound to unbound protein was plotted against the ligand concentration in a given HPLC peak window. Data points were fitted using the solver function.
Chymotrypsin activity assays in native mass spectrometry buffer
Cyanobacteria extract in (1 mg/ml, methanol) was diluted in 10 mM ammonium acetate pH 4.5 to 30 ug/mL and then sequentially diluted 1.5-fold to 0.52 µg/mL in the same buffer. Bovine chymotrypsin (Sigma Aldrich) and Z-Ala-Ala-Pro-Phe-AMC (Calbiochem, 230914) were diluted to 300 nM and 150 µM, respectively in 10 mM ammonium acetate pH 4.5. In a 384-well black microplate, 10 µL of enzyme, substrate and cyanobacteria extract were combined (30 µL final volume) such that the concentrations in the reaction were 100 nM chymotrypsin, 50 µM of Z-Ala-Ala-Pro-Phe-AMC and 10 µM to 0.17 nM of cyanobacteria extract. For solvent compatibility assays, chymotrypsin (100 nM) was assayed with 10 µg/mL and 1 µg/mL extract in 10 mM ammonium acetate, pH 4.5 containing 8.3 to 41.7% acetonitrile. A control assay lacked acetonitrile and cyanobacteria extract. All assays were performed in triplicate wells at 25°C in a Synergy HTX Multi-Mode Microplate Reader (BioTek, Winooski, VT) with excitation and emission wavelengths of 360 and 460 nm, respectively. The initial reaction velocity in each well was recorded and the dose response curve was generated using GraphPad Prism 9 software.
Calculation of Km and inhibition constants
To determine Km value of Z-Ala-Ala-Pro-Phe-AMC substrate, chymotrypsin was assayed with 1.95 to 500 µM of the substrate in Dulbecco’s phosphate buffered saline, pH 7.4 containing 0.01% Tween-20 in a final volume of 30 µL. Kinetic measurements were performed in triplicate wells at 25°C. The result Vmax values were plotted against substrate concentration and Km was calculated using the Michaelis-Menten model in GraphPad Prism 9. For inhibition studies, chymotrypsin (1 nM) was preincubated with 0 to 3 µM of each compound for 40 min in Dulbecco’s phosphate buffered saline, pH 7.4 containing 0.01% Tween-20. The reaction was initiated by addition of 25 µM of Z-Ala-Ala-Pro-Phe-AMC (Calbiochem, 230914) in a final volume of 30 µL, respectively. The release of the AMC fluorophore was recorded in a Synergy HTX multi-mode reader (BioTek Instruments, Winooski, VT) with excitation and emission wavelengths at 340 nm and 460 nm, respectively. The maximum velocity was calculated in RFU/sec over 10 sequential points on the linear part of the progress curve. The IC50 values were determined by nonlinear regression and Ki values were determined using the Morrison equation in GraphPad Prism 9.
NMR spectroscopy
Deuterated NMR solvents were purchased from Cambridge Isotope Laboratories. 1H NMR and 2D NMR spectra were collected on a Bruker Avance III DRX-600 NMR with a 1.7 mm dual tune TCI cryoprobe (600 and 150 MHz for 1H and 13C NMR, respectively) and a JEOL ECZ 500 NMR spectrometer equipped with a 3 mm inverse detection probe. NMR spectra were referenced to residual solvent DMSO signals (δH 2.50 and δC 39.5 as internal standards). The NMR spectra were processed using MestReNova (Mnova 12.0, Mestrelab Research) or TopSpin 3.0 (Bruker Biospin) software.
Extraction and isolation
The preserved cyanobacterial biomass from collection no. CUR6APR19-1 was filtered through cheesecloth, and then (98.7 g dry wt) was extracted repeatedly by soaking in 500 mL of 2:1 CH2Cl2 /MeOH with warming (<30 °C) for 30 min to afford 1.44 g of dried extract. A portion of the extract was fractionated by reverse-phase solid phase extraction (C18-SPE) using a stepwise gradient solvent system of decreasing polarity (Fr. 1-1 35% ACN/H2O, 124.4 mg; Fr. 1-2 70% ACN/H2O, 76.1 mg; Fr. 1-3 100% ACN, 77 mg; Fr. 1-4 100% MeOH, 254.9 mg. Fr. 1-2 was dissolved in 70% ACN/H2O and purified by preparative HPLC using a Kinetex 5 μm RP 100 Å column (21.00 × 150mm) and isocratic elution using 50% ACN/H2O for 8 minutes then ramping up to 100% in 14 minutes at the flow rate of 20 mL/min, yielding 56 subfractions. Rivulariapeptolide 1185 (compound 1) and 1155 (compound 2) were isolated from subfractions 1-2-20 to 1-2-23 that were combined (4.5 mg) and further purified by semi-preparative HPLC using a Synergi 4 μm Hydro-RP 80 Å column (10.00 × 250 mm) and isocratic elution gradient elution using 35% ACN / 65% H2O isocratic at the flow rate of 3.5 mL/min for 3 minutes the ramping up to 55% ACN in 22 minutes, then ramping up to 100% ACN in one minute and holding the gradient at 100% ACN for another 5 minutes yielding 1 (1.6 mg, RT = 23.3 min) and 2 (1.3 mg, RT =21.8 min) as a colorless, amorphous solid. The same HPLC conditions were used to isolate compounds 3 (rivulariapeptolide 1121, from subfraction 1-2-10 and 1-2-11, 1.1 mg, RT= 18.5min) and 4 (rivulariapeptolide 988, from subfraction 1-2-7, 1.3 mg, RT = 12.6 min). Fr. 1-1 was dissolved in 30% ACN/H2O and purified by preparative HPLC using a Kinetex 5 μm RP 100 Å column (21.00 × 150mm) and isocratic elution using 30% ACN/H2O for 10 minutes then ramping up to 50% in 10 minutes and then to 95% in 2 min at the flow rate of 20 mL/min, yielding 29 subfractions. Molassamide (compound 5) was isolated from subfractions 1-1-6 and 2-1-10 were combined (3.3 mg) and further purified by semi-preparative HPLC using a Synergi 4 μm Hydro-RP 80 Å column (10.00 × 250 mm) and isocratic elution gradient elution using 35% ACN / 65% H2O isocratic at the flow rate of 3.5 mL/min for 3 minutes the ramping up to 55% ACN in 22 minutes, then ramping up to 100% ACN in one minute and holding the gradient at 100% ACN for another 5 minutes yielding 5 as a colorless, amorphous solid (1.8 mg) at RT = 10.8 min. The same HPLC conditions were used to isolate compound 6 (Molassamide B, from subfraction 1-1-4 and 1-1-5, 1.8 mg, RT = 13.7 min).
Data Availability
All raw (.raw), deconvoluted (xtract.raw) and centroided (.mzXML or .mzML) mass spectrometry data as well as processed data feature table (.csv) and MS/MS spectra (.mgf) are available through the MassIVE repository (massive.ucsd.edu) with the identifier MSV000087964 and can be accessed under the following link: https://massive.ucsd.edu/ProteoSAFe/dataset.jsp?task=7ab346a09ca64aa1bd19bdc035801c15. The MS/MS spectra of the new discovered derivatives, including tags as protease inhibitors, have been added to the GNPS library (gnps.ucsd.edu) with the following IDs: rivulariapeptolide 1185 (1): CCMSLIB00005723387; rivulariapeptolide 1155 (2): CCMSLIB00005723986, CCMSLIB00005720236; rivulariapeptolide 1121 (3): CCMSLIB00005723398; rivulariapeptolide 988 (4): CCMSLIB00005723393; molassamide (5): CCMSLIB00005723404; molassamide B (6): CCMSLIB00006710020. Raw NMR data for compounds 1 -6 has been deposited to Zenodo (zenodo.org) and can be accessed under the following link: https://sandbox.zenodo.org/record/905199.
Code Availability
The modified version of MZmine2.37 (corr.17.7) used in this study is available at https://github.com/robinschmid/mzmine2/releases. The code for the mass-offset matching for native metabolomics data analysis is available under https://github.com/Functional-Metabolomics-Lab/Native-Metabolomics.
Contributions
R.R., W.H.G., and D.P. conceived the study. R.R., K.L.A., C.B.N., E.J.C., and W.H.G. collected and extracted environmental samples. A.T.A., P.C.D., and D.P. developed the native metabolomics approach. W.B. wrote software code. M.W. aided in integration with GNPS tags. R.R., A.T.A., and D.P. performed MS experiments. R.R. and M.L.M. performed compound isolation and R.R. carried out NMR experiments. P.F., C.L., and A.J.O. performed activity assays. I.B.S. performed docking studies. R.R., W.H.G., and D.P. wrote the manuscript. All authors edited and approved the final manuscript.
Ethics declarations
Competing interests
P.C.D. and W.H.G. are scientific advisors of Sirenas. P.C.D. is a scientific advisor of Galileo, Cybele, and scientific advisor and co-founder of Ometa Labs LLC and Enveda with approval by the UC San Diego. M.W. is a founder of Ometa Labs LLC.
Supplementary information
Supplementary Results, Methods, Figures, and NMR tables.
Acknowledgment
We thank the Deutsche Forschungsgemeinschaft for the support of D.P. through a postdoctoral research fellowship (PE 2600/1-1) and through the CMFI Cluster of Excellence (EXC 2124). R.R., P.C.D., and W.H.G. were supported by the Gordon and Betty Moore Foundation (GBMF7622) and by the US National Institutes of Health (R01 GM107550, P41 GM103484 and R03 CA211211). WB was supported in part by the Research Foundation – Flanders (12W0418N).
Footnotes
References


