

Summary
EROS (Essential for Reactive Oxygen Species) protein is indispensable for expression of the gp91phox-p22phox heterodimer of the phagocyte NADPH oxidase. EROS deficiency in humans causes the severe immunodeficiency, chronic granulomatous disease (CGD), but its mechanism of action remains unknown. We elucidate the role of EROS, showing it acts at the earliest stages of gp91phox maturation. It binds the immature 58kDa gp91phox directly, interacting with the OST glycosylation machinery and prevents gp91phox degradation. EROS also regulates the purine receptors P2X7 and P2X1 through direct interactions and P2X7 is almost absent in EROS deficiency. Accordingly, lack of EROS results in markedly abnormal P2X7 signalling, inflammasome activation and T cell responses. The loss of both ROS and P2X7 signalling leads to resistance to influenza infection. Our work identifies EROS as a highly selective chaperone for key proteins in innate and adaptive immunity and a rheostat for immunity to infection. It has profound implications for our understanding of immune physiology, immunodeficiency and gene therapy.
Introduction
The phagocyte NADPH oxidase generates reactive oxygen species (ROS) for host defence and is a critical component of innate immunity. This multi-subunit protein complex consists of (i) a membrane bound heterodimer, gp91phox-p22phox and (ii) the cytosolic components p67phox (Volpp et al., 1988), p47phox (Volpp et al., 1988, Segal et al., 1985), p40phox (Wientjes et al., 1993) and either Rac1 (Abo et al., 1991) or Rac2 (Yamauchi et al., 2004). When activated by microbial stimuli, the complex facilitates the transfer of electrons from cytosolic NAPDH through the gp91phox (Nox2) protein to molecular oxygen, located either extracellularly or within phagosomes (Segal, 2005, Thomas, 2017) generating superoxide anions. Various chemical reactions then drive the production of further ROS such as hydrogen peroxide (H2O2) and hypochlorous acid. Such molecules are directly anti-microbial but also play a role in activating other components of the innate immune response. The H2O2 generated through the phagocyte respiratory burst also has an important signalling role both within cells and transcellularly. Indeed, cysteine oxidation driven by H2O2 has been implicated in regulating other immune pathways such as inflammasome activation (Meissner et al., 2010), type 1 interferon production (Holmdahl et al., 2016, Sareila et al., 2017, Olsson et al., 2017, Zhong et al., 2018), LC3-associated phagocytosis (Martinez et al., 2015, Martinez et al., 2016) and autophagy (Thomas, 2018, de Luca et al., 2014).
The importance of the phagocyte NADPH oxidase is underlined by chronic granulomatous disease (CGD), a severe monogenic immunodeficiency caused by loss of individual components, which presents as susceptibility to infections with catalase positive organisms (including Staphylococcus Aureus, Salmonella and Burkholderia species) but also by autoimmune manifestations, characterised by sterile granulomatous inflammation (Alimchandani et al., 2013, Salvator et al., 2015, Goldblatt et al., 1999). Conversely, excess ROS generation can be damaging to tissues and have been implicated in the pathogenesis of autoimmunity (Choi et al., 2015, Hartung et al., 1988, Noubade et al., 2014). Polymorphisms in the genes encoding subunits are implicated in numerous autoimmune diseases (Magnani et al., 2014) and gp91phox function is implicated outside of immunity, in cardiovascular health (Sirker et al., 2011). It is thus paramount to understand how ROS are generated as their levels must be tightly controlled to facilitate numerous aspects of cell biology without causing oxidative stress.
One way to control ROS generation is to regulate the abundance of gp91phox-p22phox, the critical membrane bound components that facilitate electron transfer from NADPH to oxygen. These two proteins depend on one another for stable expression (Segal, 1987). gp91phox is synthesised in the ER as a 58kDa polypeptide. It becomes a 65kDa high mannose precursor, then acquires heme, forms a heterodimer with p22phox and is glycosylated in the Golgi apparatus before transport to endosomes (in macrophages) and to peroxidase-negative granules (in neutrophils) or the plasma membrane. The process of heterodimer formation is relatively inefficient and gp91phox monomers are rapidly degraded from the ER (DeLeo et al., 2000). Chaperones such as hsp90 (Chen et al., 2011) and hsp70 (Chen et al., 2012) regulate gp91phox abundance, as does the negative regulator of reactive oxygen species, NRROS (Noubade et al., 2014). We demonstrated that the protein Essential for Reactive Oxygen Species (EROS, gene symbol CYBC1) has profound effects on gp91phox and p22phox abundance. The heterodimer is essentially absent in EROS deficient cells in both mouse (Thomas et al., 2017) and human (Thomas et al., 2019) leading to extreme susceptibility to infection. Further, we and others have demonstrated that human EROS deficiency is a novel cause of CGD (OMIM: 618935) with a distinct microbial spectrum profile including infection with Legionella pneumophila and Streptococcus pneumoniae (Thomas et al., 2019, Arnadottir et al., 2018).
However, important questions remain, including (i) the exact mechanism by which EROS regulates gp91phox-p22phox abundance and (ii) whether EROS regulates the expression of other proteins. Both are key questions given that EROS deficiency is associated with severe morbidity and some clinical manifestations not seen in CGD, such as autoimmune haemolytic anaemia (Thomas et al., 2019) and glomerulonephritis (Arnadottir et al., 2018).
In this study, we show that EROS co-transfection with gp91phox markedly increases gp91phox expression in a variety of cell lines, selectively enhancing expression of the immature 58kDa form of the protein and preventing its degradation. EROS can exist in a trimeric complex with gp91phox and p22phox through direct binding to gp91phox and heme is not required for the interaction. EROS localises at the ER and the perinuclear membrane, interacting with components of the oligosaccharyltransferase complex (OST), consistent with a role early in biosynthesis. We also identify P2X7, a ligand gated ion channel, as an EROS target. EROS binds directly to and co-immunoprecipitates with P2X7 and other members of the P2X family. Accordingly, P2X7 driven calcium flux, inflammasome activation, and surface receptor shedding are markedly abnormal in EROS-/- cells with profound effects on both macrophage and T cell physiology. Together, the lack of gp91phox-p22phox and P2X7 leads to resistance to influenza A infection.
Results
EROS is a physiological regulator of gp91phox
EROS is essential for expression of the gp91phox-p22phox components of the phagocyte NADPH oxidase in primary human cells (Figure S1A). We examined the exact mechanism of action of EROS, asking how it fitted into the canonical model of gp91phox-p22phox biology (Figure S1B). One established method to investigate gp91phox-p22phox biosynthesis and stability is to transfect components of the complex into cells that do not normally express them (Dinauer, 2019). Such reductionist studies have demonstrated the ability of p22phox to stabilise the mature 91kDa form of gp91phox. We first transfected gp91phox to a variety of cell lines, to study the effects of EROS on its expression. Co-expression of murine EROS and gp91phox resulted in markedly increased gp91phox expression relative to gp91phox transfection alone in NIH3T3 and COS-7 cells which do not express endogenous p22phox (Figure 1A-B) as well as in HEK293T cells (Figure 1C) which express some endogenous p22phox. Thus, EROS can increase the expression of mouse gp91phox and can do so in the absence of p22phox. This result was corroborated using human constructs of EROS, gp91phox and p22phox (Figure 1D-F). In HEK293T cells, co-transfection of human EROS with gp91phox resulted in increased expression of the predominantly lower molecular weight (immature form) of gp91phox (Figure 1D). EROS’s ability to enhance the expression of the 58kDa form specifically was maintained when all three of gp91phox, p22phox and EROS were transfected compared to gp91phox and p22phox only (Figure 1E). This effect was also readily observable in non-adherent HEK293-F cells and with different tags placed on EROS and gp91phox (Figure S1C). Similarly, in p22phox-deficient NIH3T3 cells, co-transfection of human EROS with gp91phox enhanced the abundance of the immature 58kDa form (Figure S1D).
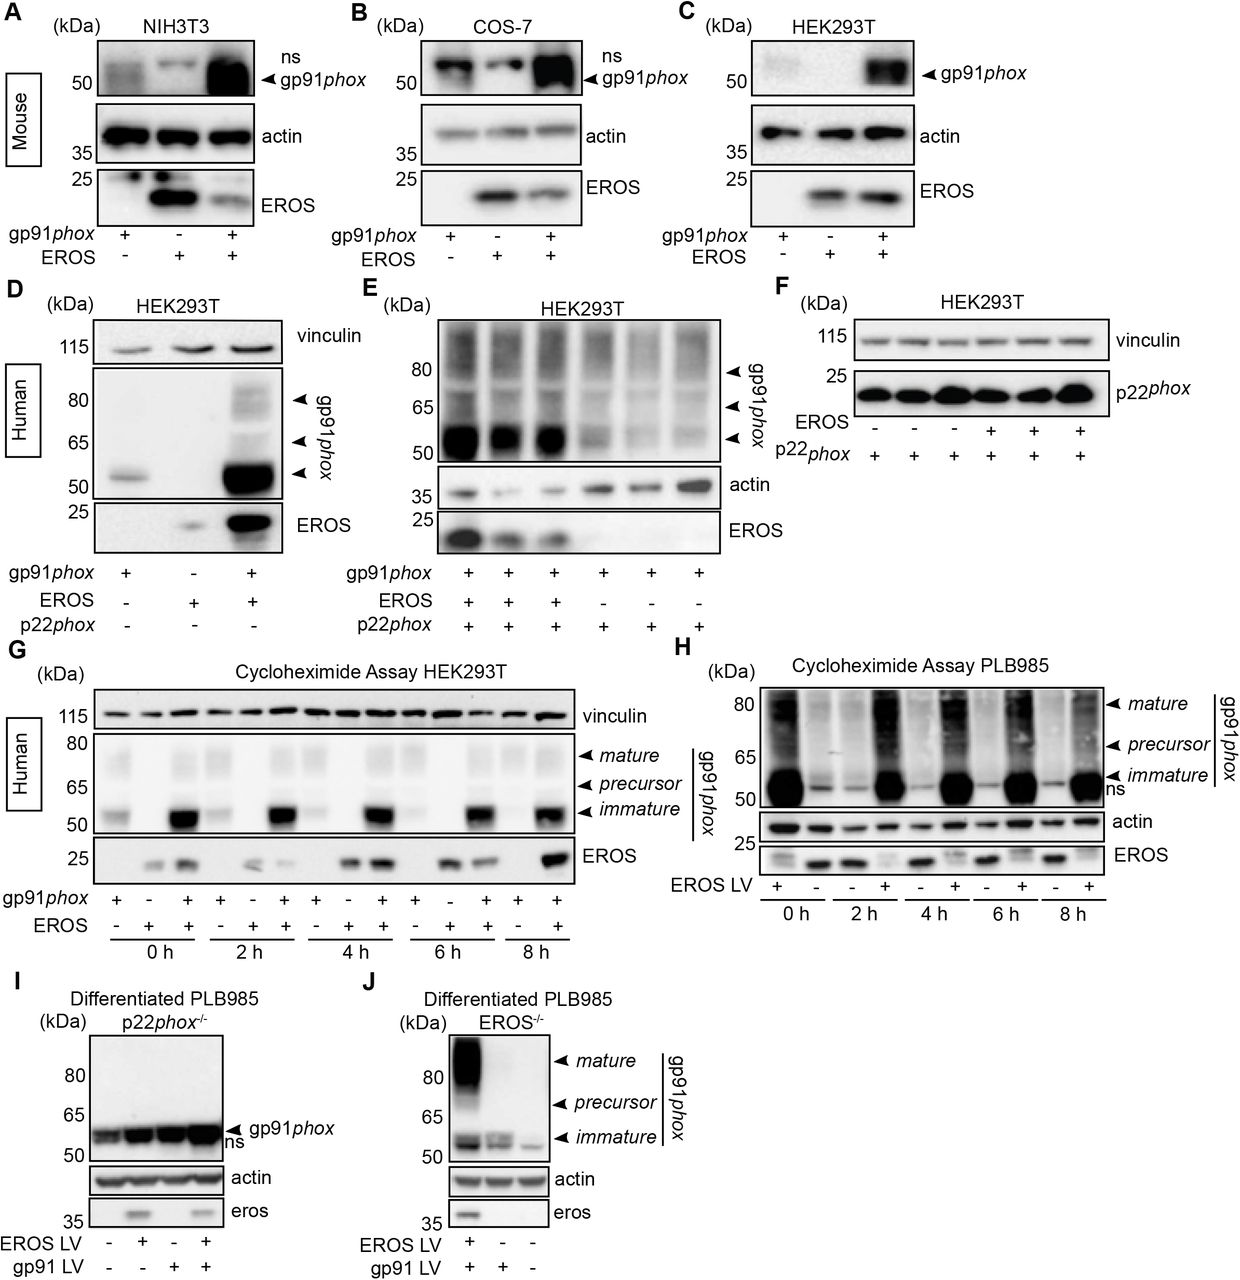
(A-C) Mouse constructs encoding EROS and gp91phox were co-transfected into NIH3T3 (A), COS-7 (B) and HEK293T (C) cell lines. gp91phox expression was analysed by immunoblotting; arrow indicates gp91phox band; ns: non-specific band. (D-F) gp91phox and p22phox expression in HEK293T cells following transfection with the indicated human constructs. (G) Analysis of the stability of the different forms of gp91phox (indicated by the arrows) following transfection in HEK293T cells in presence or absence of EROS and treatment with 10μg/mL cycloheximide. Actin and vinculin were used as loading control. (H) Stability of endogenous gp91phox in PLB985 neutrophil-like cells overexpressing lentivirus (LV) EROS-GFP vector and treated with 10μg/mL cycloheximide. (I-J) gp91phox expression following lentiviral transduction of EROS-GFP, gp91phox or both in differentiated PL985 knock-out for p22phox (I) or EROS (J). n: representative of at least 3 independent experiments. See also Figure S1.
These data demonstrate the ability of EROS to increase immature 58kDa gp91phox abundance in the absence of any p22phox and therefore independent of p22phox’s impact on gp91phox maturation.
In contrast to the results above, EROS co-expression with p22phox did not increase p22phox expression with either human (Figure 1F) or mouse (Figure S1E) constructs. Thus, the primary effect of EROS protein is on the abundance of gp91phox, not p22phox. Given that these two proteins are only stable as a heterodimer (Segal, 1987), EROS needs only be a critical regulator of one of them. Neither co-expression with gp91phox nor p22phox had any effect on EROS expression (Figure S1F) and EROS expression was normal in gp91phox deficient cells (Figure S1G).
We next examined whether EROS affected stability of the 58kDa form of gp91phox by using cycloheximide to block de novo protein synthesis. The 58kDa protein was prominently stabilised by co-transfection with EROS with less degradation in its presence (Figure 1G). The stability of the 65kDa precursor form and the mature gp91phox were not affected by the presence of EROS (Figure 1G). We complemented this co-transfection work by examining PLB985 cells which express high levels of NADPH oxidase components, especially when they are differentiated into a mature neutrophil phenotype. Cycloheximide treatment of PLB985 cells overexpressing EROS resulted in an increase of the abundance of endogenous gp91phox, particularly the 58kDa form, which is barely detectable in control PLB985 (Figure 1H). Analysis of gp91phox expression in differentiated PLB985 cells deficient in p22phox showed minimal gp91phox expression but a small amount of the 58kDa form could be observed. The abundance of this immature form can be increased by lentiviral overexpression of EROS or gp91phox, with highest abundance when both were transduced. Consistent with the absence of p22phox, the mature glycosylated form is not seen (Figure 1I). Differentiated PLB985 cells deficient in EROS also express minimal gp91phox at baseline. However, the small amount of gp91phox that can be detected following forced lentiviral overexpression is of both immature and mature forms because these cells are not genetically deficient in p22phox (Figure 1J). These data emphasize the necessary role of EROS in stabilizing the immature form of gp91phox in a human hematopoietic cell line, similar to that observed in our reductionist study.
EROS can associate with the gp91phox-p22phox heterodimer through direct interaction with gp91phox
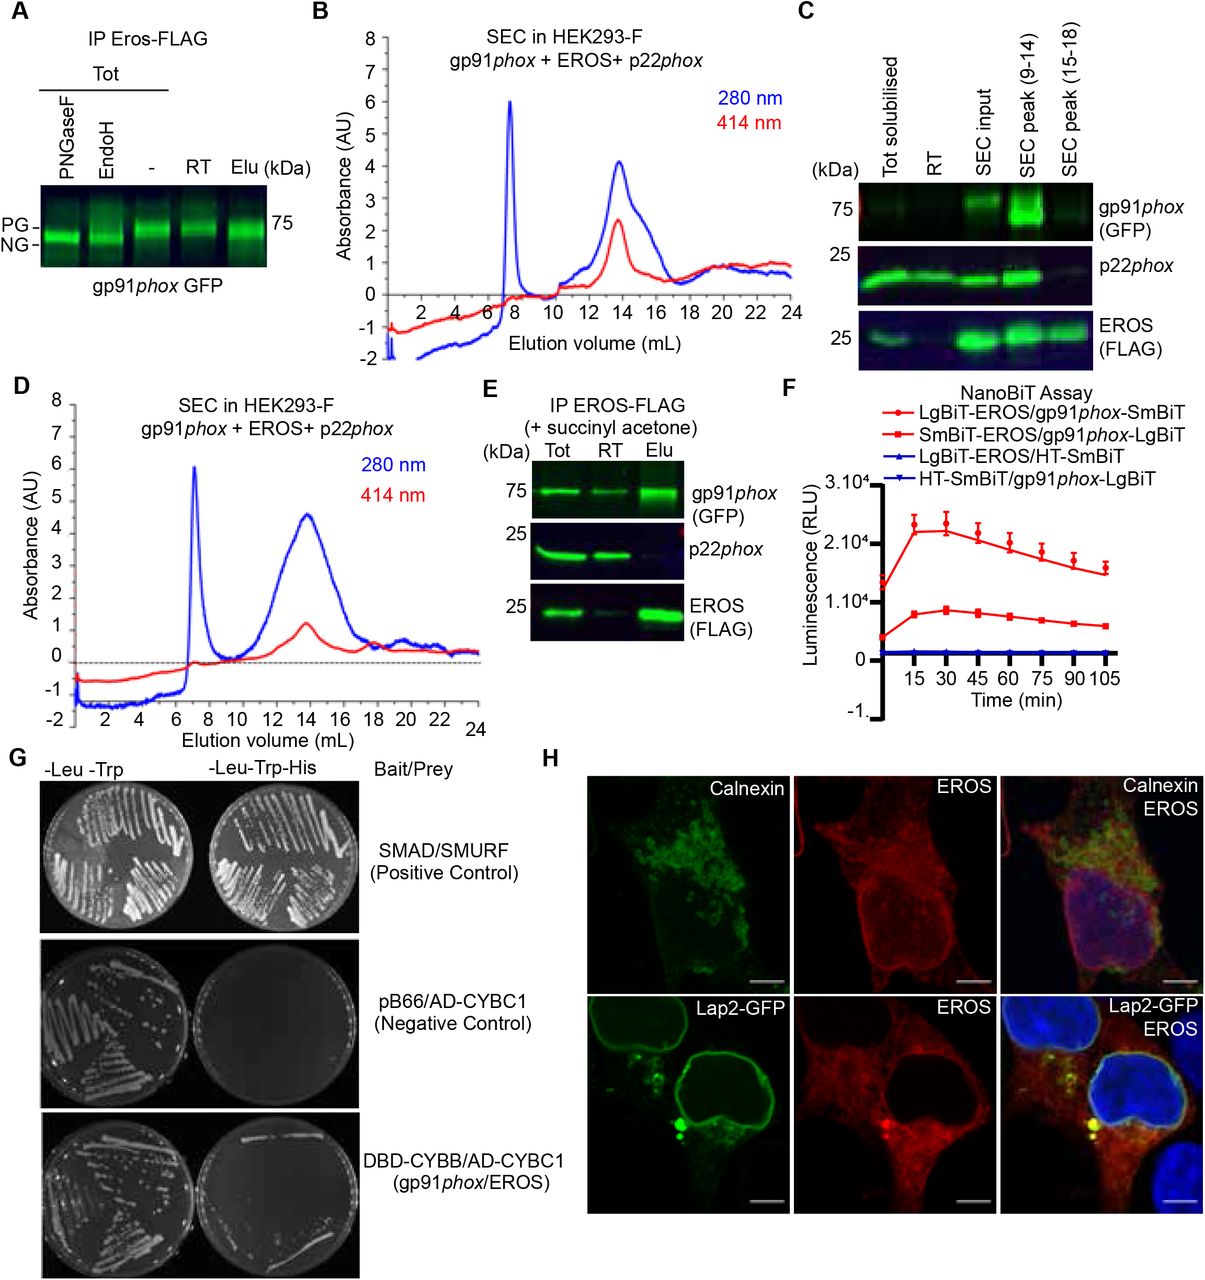
In our previous work, we showed that EROS could immunoprecipitate with gp91phox. We explored the details of the association between EROS, gp91phox and p22phox using optimised co-immunoprecipitation conditions in HEK293-F cells expressing FLAG-tagged mouse EROS followed by size exclusion chromatography (SEC) to further purify any complexes containing EROS. In cells transfected with EROS-FLAG, gp91phox-GFP and p22phox, EROS co-immunoprecipitated with the partially glycosylated form of gp91phox (Figure 2A). SEC further showed that it could associate with the heme-bound form of gp91phox as evidenced by the red heme absorbance peak (Figure 2B). Immunoblotting of SEC eluate detected p22phox indicating that EROS could also be found in a complex with both gp91phox and p22phox (Figure 2C). Notably, inhibiting heme synthesis using succinyl acetone blocked insertion of heme into gp91phox and prevented co-immunoprecipitation with p22phox, but did not prevent the association between EROS and gp91phox (Figure 2D-E). These data suggested that while EROS increases abundance of and stabilises the immature form of gp91phox, it can remain associated with gp91phox as it binds heme and then p22phox.

(A-D) Immunoprecipitation (IP) and size exclusion chromatography (SEC) analysis of protein complexes associated with EROS. (A) IP of EROS in HEK293-F cells expressing StrepII-FLAG-tagged EROS, gp91phox-GFP and p22phox with western blot for gp91phox. Lysates treated with Peptide N-glycosidase F (PNGaseF) or Endoglycosidase H (EndoH) served as reference; PG: partially glycosylated; NG: non-glycosylated; RT: run through (B) SEC profile of EROS-IP eluate indicating protein (280nm) and heme (414nm) content. (C) Immunoblot analysis of gp91phox-GFP, EROS-FLAG and endogenous p22phox in SEC fraction 9-14 and 15-18. (D) SEC profile of EROS eluate from HEK293-F cells expressing EROS-FLAG, gp91phox and p22phox constructs and treated with heme biosynthesis inhibitor succinyl acetone (10µg/ml). (E) IP of StrepII-FLAG-tagged EROS in HEK293-F treated with succinyl acetone. (F) Interaction between gp91phox and EROS assessed through luminescence production in live HEK293T cells expressing the indicated plasmids fused with the large (LgBIT) or small (SmBIT) fragment of the NanoLuc luciferase (see methods). Halo Tag (HT)-SmBIT is the negative control; RLU: Relative Luminescence Unit. (G) Yeast growth phenotypes obtained with the specified selective media using gp91phox bait plasmid and EROS prey plasmid. DBD: DNA binding domain of Gal4; AD: Activation domain of Gal4 (see methods). (H) EROS localisation in HEK293 cells transfected with EROS construct (top panel; 3D stack) or EROS and Lap2-GFP constructs (bottom panel; single plane), fixed, permeabilised and labelled with anti-EROS and anti-calnexin antibodies. Scale bar= 5μm. n= representative of at least 3 independent experiments. See also Figure S2.
Thus, we asked whether EROS interacts directly with gp91phox. To address this, we utilised the Nanoluc Binary Technology (NanoBiT) complementation reporter system (Dixon et al., 2016). We fused EROS and gp91phox to Large BiT (LgBiT) and Small BiT (SmBiT) subunits of the luciferase at either the N or C-terminus. Constructs were transfected into HEK293T to test various possible combinations (Figure S2A). The LgBiT-EROS and gp91phox-LgBiT constructs paired with the negative control HaloTag-SmBiT (HT-SmBiT) gave signal within the background. Two separate construct pairs, LgBiT-EROS with gp91phox-SmBiT and SmBiT-EROS with gp91phox-LgBiT generated high intensity luminescence within the first 30min of monitoring live HEK293T cells, thereby demonstrating that gp91phox and EROS interact directly (Figure 2F). This is further supported by yeast-two hybrid experiments. Using gp91phox bait plasmid and EROS prey plasmid we specifically observed colonies under the selective media without leucine, tryptophan and histidine (see methods) which confirmed the direct interaction between EROS protein and gp91phox (Figure 2G, Table 1). Confocal microscopy analysis showed that EROS is found in the ER and perinuclear compartment, colocalising with calnexin and the lamina-associated polypeptide-2 (Lap2; a nuclear membrane marker). This result is consistent with previous literature reporting a nuclear membrane localisation of the uncharacterised protein C17orf62, which corresponds to human EROS (Korfali et al., 2010). Given the continuity between the nuclear membrane and the ER, these data suggest that EROS acts very early in gp91phox biosynthesis (Figure 2G).
Yeast 2 Hybrid Interaction Matrix: Table resuming the different conditions tested during probing of interaction between EROS (CYBC1) and gp91phox (CYBB). pB66: Gal4 DNA-Binding Domain (DBD) vector, i.e. bait vector (DBD-bait); pB66ø: empty pB66 vector; pP7: Gal4 Activation Domain (AD) vector, i.e. prey vector (AD-prey). The same AD protein is expressed from both plasmids; pP7ø: empty pP7 vector; DBD-CYBC1: aa 1-187 of EROS cloned into pB66. Hybrigenics’ reference for this construct is hgx4414v2_pB66; DBD-CYBB: aa 1-570 of gp91phox cloned into pB66. Hybrigenics’ reference for this construct is hgx5346v1_pB66; AD-CYBC1: aa 1-187 of EROS cloned into pP7. Hybrigenics’ reference for this construct is hgx4414v2_pP7; AD-CYBB: aa 1-570 of gp91phox cloned into pP7. Hybrigenics’ reference for this construct is hgx5346v1_pP7; DO-2: selective media without tryptophan and leucine. DO-3: selective media without tryptophan, leucine and histidine. 3-AT: 3-aminotriazole (see methods).
These findings support a model where EROS directly binds and stabilises the 58kDa gp91phox protein, remaining associated with it through heme incorporation and p22phox binding. Notably, in the HEK293 co-transfection system, we found that human EROS increased expression of NOX1 and NOX4, two close homologues of gp91phox (NOX2). For NOX1, NOX2 and NOX4, this process was not impaired by succinyl acetone treatment (Figure S2C, D, E). The role of EROS is thus distinct and temporally separated from that of p22phox which stabilises the mature form of gp91phox (Figure S2B). However, EROS was not able to increase NOX5 expression, which is structurally different to NOX1, 2, 4 (Figure S2E). As NOX5, an enzyme that requires neither p22phox nor glycosylation, is not affected by EROS, our data may also provide important clues to the motifs that EROS recognises in directly binding NOX proteins.
EROS-mediated regulation of gp91phox involves the OST complex
The ability of EROS to act at the earliest stage of gp91phox biosynthesis prompted us to examine its biology in greater detail. We performed immunoprecipitation of EROS, followed by mass spectrometry analysis in RAW 264.7 macrophages overexpressing a FLAG-tagged EROS construct (Thomas et al., 2017), to identify candidate proteins that would illuminate EROS’s mechanism of action. This approach revealed 59 proteins specifically interacting with EROS (Figure 3A). Notably, Gene Ontology (GO) enrichment analysis highlighted “N-linked glycosylation” as one of the most enriched term (fold enrichment of 0.0173, Figure 3B). The oligosaccharyltransferase 48kDa subunit (OST48/DDOST), the Ribophorin-1 (RPN1) and the Ribophorin 2 (RPN2) were confident EROS interactors and were the proteins annotated with this GO term. They form the non-catalytic subunit of the OST complex (Pfeffer et al., 2014). Although it did not make the SP score cut-off, the staurosporine and temperature sensitive 3A (STT3A), which forms the catalytic subunit of the OST complex (Ramirez et al., 2019) was also specifically identified in three out of four EROS pull-down experiments. The GO term “positive regulation of glycoprotein biosynthetic process” was also enriched. These data point to a potential role of EROS during the N-glycosylation of gp91phox.

(A) EROS-FLAG affinity purification-mass spectrometry. Graph showing prey abundance (average number of peptide spectrum matches, n=4) by versus bait specificity (SP: SAINT probability score). The red line marks the SP score cut-off (0.9) for high confidence interacting proteins. The bait and interacting proteins relevant to this study are shown in red. (B) Network of protein interactions between EROS-interacting proteins derived from STRING. Coloured nodes represent proteins annotated with enriched GO terms relevant to this study. Red, “protein N-linked glycosylation”; blue, “T cell activation”; green, “positive regulation of glycoprotein biosynthetic process”, yellow “calcium ion transmembrane transport”. (C-D) EROS and gp91phox localisation, following fixation and labelling with anti-EROS antibody, in HEK293 cells expressing STT3A-GFP and EROS constructs (C) or STT3A-GFP, gp91phox-mRFP and EROS untagged constructs (D). Graphs represents the intensity profile of STT3A-GFP and EROS signal or STT3A-GFP, gp91phox-mRFP and EROS signal measured across the nuclear membrane (indicated in red line). (E) Expression of gp91phox in HEK293 cells transfected with the indicated constructs and treated with OST inhibitor (NGI-1) at the indicated concentration. (F) Expression of gp91phox in PLB985 cell line treated with NGI-1 at the indicated concentration. n= representative of 3 experiments.
Translation, synthesis and N-glycosylation of proteins transferred into the ER involve the ER translocon-machinery comprising the SEC61 channel, the translocon-associated protein (TRAP) complex and the OST complex (Cherepanova et al., 2016). We hypothesized that EROS may cooperate with the OST complex to regulate the abundance of the 58kDa gp91phox form. HEK293 cells expressing STT3A-GFP and EROS-mRFP constructs exhibited an ER localization of the two proteins with a specific rim around the nucleus (Figure 3C, right panel). Quantitation of the pixel intensity of STT3A-GFP and EROS-mRFP across the nuclear membrane gave an identical profile (Figure 3C, left panel). Similarly, co-expression of STT3A-GFP, gp91phox-mRFP and EROS untagged constructs lead to an ER and perinuclear localization of the three proteins (Figure 3D, right panel) with an identical pixel intensity profile upon quantitation (Figure 3D, left panel). These data demonstrate that a proportion of gp91phox and EROS can be found at the site of STT3A localization. Inhibition of the OST complex with the selective compound NGI-1 (Puschnik et al., 2017, Rinis et al., 2018) impaired the ability of EROS to increase the immature 58kDa form in a dose-dependent manner (Figure 3E) in HEK293 cells. NGI-1 treatment of PLB985 cells shifted the glycosylation pattern of gp91phox, selectively enhancing the 65kDa precursor and the immature 58kDa form of gp91phox compared to DMSO treatment where we observed a predominantly mature 91kDa protein (Figure 3F).
Overall, these findings are consistent with EROS being bound to gp91phox at the early stages of its biosynthesis while N-glycosylation takes place in ER. They also reveal a previously unappreciated involvement of the OST complex in gp91phox maturation process.
EROS targets a specific group of proteins
We and others have recently described EROS-deficiency as a distinct cause of CGD (Thomas et al., 2019, Arnadottir et al., 2018). Interestingly, these patients have exhibited manifestations that are often atypical for CGD. As many proteins can “moonlight”, having distinct functions, we hypothesised that EROS might regulate the abundance of other proteins in different immune cell types. We performed Tandem Mass Tagging proteomics analysis on bone marrow derived macrophages (BMDM) and CD4 T cells from control and EROS knockout mice. This approach allowed the identification of around 8000 proteins, a greater number than our previously reported label-free experiment which was limited to 2000 proteins (Figure 4A, B). We found that EROS deficiency has major effects on the expression of a small number of proteins in macrophages and this effect is conserved in CD4 T cells. These proteins were gp91phox (Cybb), p22phox (Cyba) and P2×7 the latter also identified as a high confidence EROS-interacting protein (see Figure 3A). Additionally, we observed a lower expression of the tumour suppressor protein Phactr4 (Solimini et al., 2013) in EROS-deficient cells. Phactr4 plays a key role in actin cytoskeleton remodelling by regulating the β1 integrin–FAK–ROCK-cofilin pathway (Huet et al., 2013, Sun and Fassler, 2012). The immunological role of Phactr4 is currently unknown.

(A-B) Volcano plot of proteins detected by Tandem Mass Tag proteomics analysis of macrophages (A) and CD4+ T lymphocytes (B) isolated from control and EROS-/- mice. (C) Volcano plot of proteins recovered by Plasma Membrane Profiling of macrophages isolated from control and EROS-/- mice. The volcano plots display statistical significance (-log10 p-value) versus the log2 fold change. n= 5 vs 5 biological replicates.
Given that EROS seemed to affect membrane proteins that localised to the plasma membrane, we performed plasma membrane profiling analysis to determine whether evaluating this compartment alone might reveal more proteins regulated by EROS. This analysis demonstrated very similar results. gp91phox, p22phox and P2×7 were the most down-regulated proteins in EROS-/- cells compared to control cells. The sodium/proton exchanger Slc9a9 was significantly up-regulated (Figure 4C).
Thus, all our mass spectrometry analyses demonstrated that the biological effects of EROS deficiency are conserved across different immune cells and it targets a very selective group of proteins.
EROS regulates the abundance of the P2X7 ion channel
P2X7 has pleiotropic roles in the immune system, regulating NLRP3 inflammasome activation, innate immune signalling and cell death across a variety of cell types (de Torre-Minguela et al., 2016, Taylor et al., 2008). Therefore, we focused on validating EROS’s role in controlling P2X7 abundance. We verified this by western blot (Figure 5A) and flow cytometry of both BMDM (Figure S3A) and freshly isolated peritoneal macrophages (Figure S3B) in independent cohorts of mice. The lack of P2X7 in EROS-/- cells was not a consequence of lack of expression of the NADPH oxidase as P2X7 protein was expressed normally in gp91phox-deficient cells (Figure 5B). Consistent with our mass spectrometry data (Figure 4B), P2X7 expression was extremely low on CD4+ T cells from EROS-/- mice, measured by western blot and flow cytometry (Figure S3C-D). Control splenocytes had high levels of P2X7 expression in NKT cells and γδ T cells with much reduced expression in EROS-deficient cells (Figure S3E-F). EROS deficiency also led to reduced P2X7 expression in B cells, NK cells and CD8+ T cells (Figure S3G, H, I).

(A-C) P2X7 expression analysed by western blotting of macrophages isolated from control, EROS-/- (A) and gp91phox-/- mice (B) and of control PLB985 cells and an EROS knock-out clone (C). (D-E) P2X7 expression in RAW264.7 cells overexpressing a FLAG-tagged EROS vector (D) and in HEK293 cells transiently expressing the specified constructs (E). (F-G) Interaction between EROS and P2X7 probed by immunoprecipitation of EROS from RAW264.7 EROS-FLAG macrophages followed by immunoblot for P2X7 (F) and by NanoBIT assay in live HEK293 cells expressing the LgBIT-fused EROS vector with a SmBIT-fused P2X7 vector (G). (H) P2X1 expression in macrophages isolated from EROS-/- mice compared to control. n= 5 biological replicates. (I) P2X1 abundance upon co-transfection with EROS construct in HEK293 cells. n= representative of 3 independent experiments. See also Figure S3.
P2X7 was very lowly expressed in human PLB-985 cells that carried a CRISPR mediated deletion in EROS (Figure 5C). RAW264.7 macrophages express P2X7 endogenously and lentiviral overexpression of EROS increased P2X7 expression relative to that observed with a control vector that expressed only GFP (Figure 5D). This effect was reproduced in HEK293 cells. Co-transfection of EROS and P2X7 resulted in much higher expression of P2X7 than when P2X7 was transfected alone (Figure 5E, Figure S3J). Therefore, not only does EROS deficiency lead to a lack of P2X7 expression, but EROS up-regulation increased P2X7 abundance. We hypothesised that the regulation of P2X7 abundance would have a similar mechanism to that for the gp91phox-p22phox heterodimer. Accordingly, P2X7 co-immunoprecipitated with EROS from RAW264.7 macrophages that expressed an N-terminal FLAG-tagged EROS (Figure 5F). Furthermore, NanoBiT analysis using a LgBiT-EROS and P2X7-SmBiT pair constructs in HEK293 resulted in luminescence production showing that the interaction between P2X7 and EROS was direct (Figure 5G).
Macrophages express other P2X family members including P2X4 and P2X1 (Sim et al., 2007). Western blot analysis of BMDM also demonstrated a lower expression of P2X1 in EROS deficient cells (Figure 5H). As with P2X7, co-transfection of both P2X1 and EROS caused greater expression of P2X1, compared to when P2X1 was transfected alone (Figure 5I). Thus, EROS also regulates P2X1 protein abundance. This was not, however, the case for P2X4 (Figure S3K). These data emphasise the role of EROS in controlling P2X7 expression through a direct mechanism analogous to that observed for gp91phox.
Loss of P2X7 impairs inflammasome activation and shedding of surface ligand
There were functional consequences to the loss of P2X7 and P2X1 in EROS deficiency. P2X7 is a metabotropic ion channel and ligation by ATP is associated with an inward flux of calcium and sodium an outward flux of potassium ions (Bartlett et al., 2014). We measured calcium influx following treatment of control and EROS-/- BMDM by bzATP, an ATP analogue that has higher affinity than ATP for the P2X7 receptor. bzATP driven calcium flux was highly attenuated in EROS-/- macrophages compared to their control counterpart (Figure 6A). Ionomycin driven responses were equivalent between the two strains, showing that there was no inherent problem with calcium mobilisation in EROS-deficiency (Figure 6A). Ligation of P2X7 by ATP is a key mediator of IL-1β production via the NLRP3 inflammasome (de Torre-Minguela et al., 2016). LPS treatment alone of the peritoneal macrophages from control and EROS-/- mice resulted in the secretion of modest amounts of IL-1β Robust induction of IL-1β secretion was observed upon treatment of the LPS-conditioned macrophages with ATP and this was approximately 4-fold lower in EROS-/- cells (Figure 6B). In vivo, following intraperitoneal LPS and ATP injection, peritoneal washings from EROS-/- mice showed much reduced IL-1β secretion compared with control (Figure 6C). Consistent with these data, caspase-1 activation was highly attenuated in EROS-/- macrophages following LPS/ATP treatment (Figure 6D) compared to control macrophages. LPS treatment, either in vitro or in vivo, resulted in comparable levels of TNF-α, IL-10, IL-6 and KC/GRO secretion between control and EROS-/- macrophages and levels of these cytokines were not altered significantly by ATP addition (Figure S4A-F).

(A) Calcium release tested by Rhod-3-AM calcium imaging assay, in control or EROS-/- BMDM in response to bzATP treatment (with ionomycin as positive control); n= 3 independent experiments. (B) IL-1β secretion following LPS priming of peritoneal macrophages from control or EROS-/- mice before and after treatment with ATP. (C) Secretion of IL-1β following in vivo administration of LPS and then ATP to control or EROS-/- mice. (D) Decreased Caspase-1 activity, detected through luminescence production (see methods), in peritoneal macrophages from EROS-/- mice compared to control mice following LPS priming and ATP treatment (n= 11 biological replicates). (E-F) Representative flow cytometry histogram of surface ligand CD62L (E) and CD27 (F) expression in CD4+ T cells isolated from EROS-/- or control mice and treated with ATP (n= 5 biological replicates). Percentage of CD4+ T cells positive for CD62L or CD27 for each condition is shown on the left panel graphs. p value was determined using Student’s t test. (G) Reduced phosphatidyl serine exposure and cell death in EROS-/- CD4+ T cells compared to control CD4+ T cells following ATP treatment as analysed by flow cytometry staining with Propidium Iodide and Annexin V (representative of n= 5 biological replicates). (H) Control or EROS-/- mice were infected intranasally with 3.103 PFU of A/X31 influenza. Signs of illness were monitored daily. n= at least 12 biological replicates. See also Figure S4.
P2X7 plays several important roles in CD4+ T cell biology, including ADAM10/17 driven shedding of cell surface molecules such as CD62L and CD27 and externalisation of phosphatidylserine (PS), pore formation and cell death (Bartlett et al., 2014, Scheuplein et al., 2009). Accordingly, flow cytometry analysis of CD62L level following ATP treatment showed a reduced staining in control CD4+ T cells with 10% of cells positive for CD62L-APC compared to 70% of positive cells pre-ATP addition (Figure 6E). In EROS-/- CD4+ T cells, this ATP driven CD62L shedding is significantly impaired with 40% of cells still positive for CD62L-APC after ATP addition (Figure 6E). Similar results were obtained when examining CD27 shedding, with 40% of cells positive for CD27-FITC in EROS-/- CD4+ T cells following ATP addition compared to 10% of positive cells in control CD4+ T cells (Figure 6F). NAD-driven shedding of CD62L and CD27 was also significantly impaired in EROS-/- CD4+ T cells albeit to a lesser extent than with ATP treatment (Figure S4 G-H). PS exposure and cell death, assessed by annexin V and propidium iodide staining, were reduced in EROS-/- CD4+ T cells following ATP treatment (Figure 6G).
We speculated that there might be further in vivo consequences to the loss of both P2X7 and phagocyte NADPH oxidase activity in EROS-/- mice and noted that blockade of the P2X7 receptor has been associated with improved outcomes in influenza A virus (IAV) infection (Snelgrove et al., 2006, Leyva-Grado et al., 2017, Rosli et al., 2019). We intranasally injected control and EROS-/- mice with IAV and found that EROS-/- mice were protected from infection with a 50-60% reduction in mortality (Figure 6H).
These results identify a central role of EROS in modulating purinergic signalling in vivo through targeting P2X7.
Discussion
The NOX2 (cytochrome b558) is essential for defence against infection and a key modulator of inflammatory pathways. gp91phox exists as a co-dependent heterodimer with another membrane bound protein, p22phox (Segal, 1987). gp91phox is translated as a 58kDa immature protein which undergoes successive post-translational modifications leading to the association with p22phox and final maturation to a functional 91kDa protein. Heme incorporation is a pre-requisite for the association with p22phox which subsequently dictates the fate of the mature protein (DeLeo et al., 2000). The 58kDa form is inherently much more unstable and prone to proteasomal degradation than the mature 91kDa form, as we also observed in this study. Recently, we showed that another protein, EROS, was essential for the expression of both gp91phox and p22phox. EROS deficiency led to a remarkable lack of gp91phox and p22phox, ROS and caused CGD (Thomas et al., 2017, Thomas et al., 2019) raising the question of how it fits into the canonical model above.
We now show that EROS is needed very early in gp91phox biogenesis, in contrast to p22phox, preferentially stabilising the 58kDa precursor before heme incorporation and maturation takes place. It interacts directly with gp91phox and can associate with the gp91phox-p22phox heterodimer up until export from the ER. Much work has been done to characterise the latter stages of gp91phox maturation (Porter et al., 1996, Yu et al., 1997, Yu et al., 1999, DeLeo et al., 2000, Beaumel et al., 2014). This study offers unique insight into the early stages of the protein’s biosynthesis, on which all subsequent events depend. We propose that these early stages involve the interaction of EROS with the OST-complex, which is involved in the initial glycosylation events, folding and insertion into the ER membrane (Gemmer and Forster, 2020). The OST complex adds a preformed oligosaccharide to an asparagine residue on a newly synthetized protein (Cherepanova et al., 2016). Murine gp91phox has one asparagine residue while human gp91phox has three asparagine residues that are glycosylated (Harper et al., 1985, Wallach and Segal, 1997). Using PNGaseF and EndoH-treated lysates as a reference, we demonstrated that EROS immunoprecipitated with glycosylated gp91phox. Moreover, blockade of OST-mediated N-glycosylation impacts on the gp91phox glycosylation pattern upon co-transfection with EROS in HEK293 cells and in PLB985 cells but does not reduce the abundance of gp91phox per se as does EROS deficiency. It is likely that the presence of EROS is necessary at the initial glycosylation step, stabilising and preventing gp91phox misfolding while this process occurs.
In addition to elucidating the biology of gp91phox maturation, our work has important implications for the emerging field of gene therapy for CGD. A recent landmark publication described a gp91phox lentiviral vector in 6 patients (Kohn et al., 2020). At 12 months, six of the seven surviving patients had 16-46% oxidase positive neutrophils, a highly encouraging result. Yet, given that co-transfection with EROS can increase the abundance and prolong the half-life of gp91phox, we suggest that vectors expressing both proteins should be considered for long term efficacy of gp91phox gene therapy.
By performing extensive mass spectrometry analysis, we show conclusively that EROS regulates the abundance of only a very small subset of proteins, confirming that it is a highly selective chaperone. Hence, this work sheds new light on the control of P2X7 expression in both mouse and human and is the most profound effect on the abundance of this receptor that has been observed. Although effects of EROS deficiency on P2X7 expression were noted in our original mass spectrometry analysis and in a recent screen of factors that influence ATP driven phosphatidylserine excursion (Ryoden et al., 2020), this work goes much further. We show that EROS knockout mice have P2X7 deficiency in every cell of the immune system studied with profound implications for the biology of αβ, γδ and NKT cells. This is clear from our T cell work where EROS-driven P2X7 deficiency affects shedding of CD27 and CD62L and ATP driven cell death. Moreover, we show that the effects on P2X7 are a class effect with similar, but more modest, effects on P2X1 expression. We demonstrate that the mechanism by which this occurs is a direct effect on P2X7 and, by extension, is likely to be a direct effect on P2X1. The lack of effect on P2X4, however, suggests either some redundancy in stabilizing this particular protein and/or that EROS binds to it weakly. Significantly, we also show that EROS overexpression drives increased abundance of P2X7 and P2X1, suggesting that EROS might act as a physiological rheostat for purinergic signalling. A particular strength of our study is that we show marked in vivo sequelae of the lack of P2X7. EROS deficiency leads to profound susceptibility to bacterial infection but protects mice from infection with influenza A. Severe influenza infection is driven by dysregulated NLRP3 inflammasome resulting in excessive inflammation and lung pathology. Genetic deficiency or blockage of P2X7 system reduced secretion of pro-inflammatory cytokines (IL-β, TNF, IL-10) and cellular infiltrates in the lung leading to a better outcome following influenza disease (Snelgrove et al., 2006, Leyva-Grado et al., 2017). Hence, the dual loss of the phagocyte NADPH oxidase and P2X7 in EROS-/- mice likely confers protection from IAV infection.
P2X7 is crucial for ATP driven activation of the NLRP3 inflammasome and has an emerging role in T cell biology, especially in resident immune cells (Stark et al., 2018). Of note, P2X7 ligation by ATP is also a potent driver of ROS formation, the other major process that is profoundly affected by EROS deficiency (Pfeiffer et al., 2007). One role of EROS might be to modulate ATP driven danger signalling including ROS and NLRP3 activation through controlling NOX2 and P2X7. Both ROS and NLRP3 activation are clearly essential but the extent and duration of responses must be controlled to limit tissue damage. Therefore, one might consider EROS as a rheostat for these key linked immune processes.
In conclusion, we have elucidated the mechanism by which EROS controls the abundance of gp91phox and purinergic receptors and defined EROS as a highly selective molecular chaperone that can shape immune responses through targeting specific proteins. As well as advancing our understanding of the physiology of highly conserved and non-redundant proteins, this work has implications for translation, including gene therapy and possible therapeutic blockade of EROS to limit viral immunopathology.
Author Contributions
Conceptualisation: L.O.R, P.J.L, F.M, D.C.T. Investigation: L.O.R, P.M.M, E.G, E.R.D, A.S, G.R, L.Y, M.P, C.T, C.B, K.H, M.N, J.C.W, S.S, J.M.S, W.M.R. Resources: G.W, J.C, S.C, P.J.L, G.S, K.G.C.S. Data curation: M.P, L.Y. Writing Original draft: L.O.R, F.M, D.C.T, Visualisation: L.O.R. Funding Acquisition: F.M, D.C.T.
Declaration of interests
The authors declare no competing interests
Materials and Methods
Animal use
EROS-/- mice (KOMP) and gp91phox/Cybb-/- mice (KOMP) were previously described (Thomas et al., 2017). The care and use of all mice were in accordance with UK Home Office regulations (UK Animals Scientific Procedures Act 1986). The mice were maintained in specific pathogen–free conditions and matched by age and sex within experiments.
Antibodies and reagents
The following primary antibodies were used: mouse anti-gp91phox (sc-130543, Santa-Cruz Biotechnology; dilution 1:2000), rabbit anti-C17ORF62/EROS (HPA045696, Atlas; dilution 1:1000), rabbit anti-p22phox (sc20781, Santa-Cruz Biotechnology; dilution 1:1000), mouse anti-p22phox (sc-130550, Santa-Cruz Biotechnology; dilution 1:500), rabbit anti-P2X1 (APR001, Alomone; dilution 1:250), rabbit anti-P2X4 (APR002, Alomone; dilution 1:500), rabbit anti-P2X7 (APR004, Alomone; dilution 1:500), rabbit anti-vinculin (4650, Cell Signalling Technology; dilution 1:1000), rabbit anti-actin (ab8227, Abcam, dilution 1:2000), mouse anti-α-tubulin (ab7291, Abcam, dilution 1:1000), mouse anti-calnexin (MA3-027, Invitrogen, dilution 1:1000) and mouse anti-FLAG-M2 (F3165, Sigma, dilution 1:500). The homemade rabbit anti-NOX4 antibody was a kind gift of Prof. Ajay Shah (Kings College London, UK). The following anti-mouse antibodies were from Miltenyi Biotec: CD44-FITC (clone IM7.8.1), CD62L-PerCP-Vio700 (clone REA828), CD25-PE-Vio770 (clone 7D4), NK1.1-APC (clone PK136), TCRγδ-Vioblue (GL3), CD4-Viogreen (clone GK1.5). Mouse anti-CD8α-APC-H7 (clone 53-6.7) and mouse TCRβ-BV711 (clone H57.597) were from BD Bioscience. Mouse anti-P2X7-PE (clone 1F11) and mouse anti-CD45-AF700 (clone 30-F11) were from Biolegend. The following reagents were from New England Biolabs: PNGase F (P0704S) and EndoH (P0702S). The 2, 3 -O-(4-benzoylbenzoyl) ATP was from Sigma (5.05734).
DNA plasmids
The following plasmids were obtained from Origene: mouse gp91phox/nox2/cybb (MC204867), mouse GFP-tagged gp91phox/nox2/cybb (MG208975), mouse EROS/cybc1 (MC201263), human EROS/CYBC1 (SC324452), human gp91phox/CYBB (SC122091), human p22phox/CYBA (SC101113), human NOX4 (SC322623), mouse GFP-tagged P2X7 (MR227216), human P2X1 (SC118594) and human P2X4 (SC122124). Human pEGFP-N2-SST3A, human pmRFP-N2-EROS/C17ORF62/CYBC1 and human pEGFP-N2-Lap2β constructs were generously given by Prof. Eric Schirmer (University of Edinburgh, UK).
Human NOX1 was synthesised by Genewiz with a Strep II-FLAG tag at the N-terminus and cloned into the pEGBacMam vector, a kind gift from Eric Gouaux (Oregon Health & Science University; (Goehring et al., 2014)) using In-Fusion seamless DNA cloning (Takara Bio). The cDNAs encoding for human NOX5 (isoform b) was synthesized by GeneArt and subcloned into the pNGFP-EU vector, a kind gift from Eric Gouaux (Kawate and Gouaux, 2006).
Cell line culture
HEK293T, HEK293, COS-7, NIH/3T3, and RAW 264.7 EROS FLAG-tagged cells were maintained in DMEM medium (21969035, ThermoFisher) containing 10 % FBS (F7524, Sigma-Aldrich) and 100U/mL of Penicillin-Streptomycin-Glutamine (10378016, ThermoFisher). PLB985, PLB-clone 14 (Thomas et al., 2019), PLB-clone 20 (Thomas et al., 2019) and PLB985 overexpressing EROS-GFP lentivirus construct were cultured in complete RPMI medium consisting of RPMI 1640 (31870025, ThermoFisher), 10% FBS (F7524, Sigma-Aldrich), 2mM GlutaMAX (35050061, ThermoFisher), 1mM sodium pyruvate (11360070, ThermoFisher); 0.5mg/mL Penicillin-Streptomycin-Glutamine (10378016, ThermoFisher) and 20mM HEPES (H3537, Sigma-Aldrich). HEK293-F cells were grown in suspension using FreeStyle medium (Invitrogen). Human iPS-derived macrophages were generated from an undifferentiated iPS cell line as previously described (Thomas et al., 2017) and cultured in complete RPMI (see above).
Primary cell culture
To generate bone marrow derived macrophages, bone marrow cells harvested from femurs and tibias of 6-10 weeks old control or EROS-/- mice were grown in complete RPMI medium supplemented with 100 ng/mL of M-CSF (315-02, Peprotech) for 3 days. At day 3, 10 mL of the same medium was added to the culture and differentiated macrophages were collected at day 7 for mass spectrometry analysis.
To isolate mouse CD4 lymphocytes, mouse spleens were homogenised by manual disruption and subjected to positive selection using CD4 L3T4 magnetic beads (130-117-043, Miltenyi Biotech) according to the manufacturer’s protocol. Cells were counted and resuspended at a concentration of 2×10⁶ cells per ml in complete RPMI medium for subsequent analysis.
Transient expression
Cell were transfected at 60-80% confluency with 1.6µg-2µg of the indicated constructs using Lipofectamine RNAiMAX (13778075; Thermo Fisher) reagent for HEK293T, HEK293 and COS-7 cells and Lipofectamine 2000 (11668027; Thermo Fisher) reagent for NIH3T3 cells, following the manufacturer’s recommendation. HEK293-F were transfected with polyethylenimine (linear MW25000, Polyscience Europe GmbH) at a ratio of 1:3 DNA:polyethylenimine (Tom et al., 2008), using 0.5μg of the indicated constructs. Equivalent amounts of the corresponding empty vector were used as negative control. Cells were harvested and analysed 48h-72h post-transfection.
Protein stability and drug treatment
For cycloheximide experiment, HEK293T cells (transfected with an gp91phox construct alone or in combination with an EROS construct) and PLB985 cells (parental of expressing lentivirus EROS-GFP), were treated with 10µg/mL of cycloheximide (Sigma) and harvested at 2h, 4h, 6h and 8h post-treatment and subjected to western blot. Non-treated cells were used as control. For heme synthesis inhibition, 10µg/ml succinyl acetone (Merck) was added to the cell culture 4h after transfection. For OST inhibition, NGI-1 compound (TOCRIS) was added 3h post-transfection of HEK293 cells and left until harvesting (72h later).
Immunoprecipitation and Size exclusion Chromatography
Strep tagged-EROS was co-transfected in HEK293-F cells with GFP-gp91phox and p22phox. 48h post transfection cells were harvested and cell membranes were prepared as described in (Ceccon et al., 2017). Membranes were solubilised with 1% LMNG in 50mM Hepes pH 7.5, 100mM NaCl, 20% (v/v) glycerol, and passed through Streptactin-resin. Bound proteins were eluted from the column with 5mM desthiobiotin in 50mM Hepes pH 7.5, 100mM NaCl, 5% (v/v) glycerol and then subjected to size exclusion chromatography using a Superose 6 30/150 column. Lysates from 3.107 to 4.107 of cells were subjected to immunoprecipitation according to manufacturer’s protocol for the Sure Beads Protein G Magnetic Beads (161-4023, Biorad) using a rat anti-FLAG antibody (637303, Biolegend) and an IgG2aK isotype control antibody (14-4321-82, Invitrogen). Eluates from FLAG and IgG control beads were analysed by western blotting.
Western blot analysis
Cells were lysed at a concentration of 2×10⁷ cells per mL in Pierce RIPA buffer (89900, ThermoFisher) containing cOmplete Protease Inhibitor Cocktail (11697498001, Sigma Aldrich) and Halt Protease and Phosphatase inhibitor (78440, Thermo Fisher). Protein concentration was determined by BCA assay (23225, Thermo Fisher) according to manufacturer’s instructions. 15 to 20µg of proteins, mixed with 4X NuPage sample buffer (NP0008, Thermo Fisher), were resolved on a NuPAGE 4-12% Bis-Tris gel (NP0336BOX; NP0335BOX; Thermo Fisher) under reducing conditions in MOPS buffer (mops-sds1000, Formedium), transferred to a nitrocellulose membrane (GE10600003, Sigma-Aldrich) in NuPage transfer buffer (NP00061; ThermoFisher), and probed with the indicated primary antibodies followed by anti-rabbit IgG-horseradish peroxidase (7074S, Cell Signaling Technology, dilution 1:10000) or anti-mouse IgG-horseradish peroxidase (7076S, Cell Signaling Technology, dilution 1:10000) secondary antibodies. Blots were developed using one of the following: ECL (32106, Thermo Fisher), SuperSignal West Pico PLUS (34577, Thermo Fisher) or SuperSignal West Femto (34095, Thermo Fisher) reagents and chemiluminescence was recorded on a ChemiDoc Touch imager (BioRad).
NanoBIT assay for protein-protein interaction
The assay was performed following manufacturer’s protocol for the MCS Starter System (N2014, Promega). The constructs encoding EROS/CYBC1 or gp91phox/CYBB fused to the reporter subunits were custom made by Promega and consist of the following: SmBiT-CYBC1 (TK) vector (CS1603B224), CYBC1-SmBiT (TK) vector (CS1603B225), LgBiT-CYBC1 (TK) vector, (CS1603B226), CYBC1-LgBiT (TK) vector (CS1603B227), SmBiT-CYBB (TK) vector (CS1603B228), CYBB-SmBiT (TK) vector (CS1603B229), LgBiT-CYBB (TK) vector (CS1603B230), CYBB-LgBiT (TK) vector (CS1603B231). HEK293 were platted at a concentration of 2.104 cells per well in a 96 well plate (3917, Corning). The following day, cells were transfected either with 55ng/well of the indicated vectors combinations (1:1 ratio of interacting pairs) or with the NanoBIT negative and positive control provided (not shown in graph), using FugeneHD reagent (E2311, Promega) at a lipid to DNA ratio of 3:1. 20 hours post-transfection, growth-medium was exchanged with OPTI-MEM (51985034, Thermo Fisher) containing 2% FBS (7534, Sigma Aldrich) and 20mM HEPES (Thermo Fisher). The plate was left to equilibrate 10min at room temperature before addition of the freshly reconstituted Nano-Glo Live cell substrate. Luminescence was subsequently measured on a FLUOstar Omega plate reader (BMG, Labtech) using the following settings: plate mode, number of cycles: 8; cycle interval: 900sec, gain adjustment 70% of the target (positive control), orbital averaging of the well: 3; orbital shaking 300rpm for 15s before the first measurement.
Yeast 2 Hybrid experiment
This was performed by Hybrigenics Services (91000 Evry, France). The coding sequences of human EROS/CYBC1 (NM_001033046.3) and human gp91phox/CYBB (NM_000397.3) were PCR-amplified and cloned in frame with the Gal4 DNA binding domain (DBD) into plasmid pB66 (Fromont-Racine et al., 1997) as a C-terminal fusion to Gal4 (Gal4-DBD-bait fusion) and with the Gal4 Activation Domain (AD) into plasmid pP7 (AD-prey fusion). The diploid yeast cells were obtained using a mating protocol with both yeast strains (Fromont-Racine et al., 1997), based on the HIS3 reporter gene (growth assay without histidine). As negative controls, the bait plasmids were tested in the presence of empty prey vector and the prey plasmids were tested with the empty bait vector. The interaction between SMAD and SMURF or Alg5 and Alg5 are used as positive control (Colland et al., 2004). Controls and interactions were tested in the form of streaks of three independent yeast clones for each control and interaction on DO-2 and DO-3 selective media. The DO-2 selective medium lacking tryptophan and leucine was used as a growth control and to verify the presence of the bait and prey plasmids. The DO-3 selective medium without tryptophan, leucine, and histidine selects for the interaction between bait and prey. For specific interactions, the selection pressure was increased using 0.5mM 3-Aminotriazol (3-AT).
Cytokine secretion
For in-vivo experiments, EROS-/- mice were injected with 250ng/mL of Lipopolysaccharide (LPS, Invivogen). 2h later, 30mM of ATP or PBS (for control) was injected intraperitoneally. Mice were culled 2h later, and the peritoneal cavity washed. Supernatants and serum were analysed for the presence of the cytokines indicated in the Figureures using multiplex kits from Meso Scale Discovery (Maryland, US) and were conducted at the Core Biochemical Assay Laboratory (Cambridge University Hospital, UK).
Caspase-1 activity measurement
Peritoneal macrophages from control or EROS-/- mice were primed overnight with LPS (100ng/mL, Invivogen) and treated for 2h with ATP (2.5mM, Invivogen). Supernatants were harvested and subjected to Caspase-Glo 1 inflammasome assay following manufacturer’s protocol (G9951, Promega). Luminescence from caspase-1 activity was detected with a FLUOstar Omega plate reader (BMG, Labtech).
Immunofluorescence
Cells were fixed 15min in 4% paraformaldehyde (15710-S, Electron Microscopy), permeabilised with 0.1% Triton X-100 (Sigma) and quenched in 100mm Glycine (Sigma) for 15min. To reduce background, a blocking solution consisting of 5% Goat Serum (Sigma), 1% BSA (Sigma) in PBS (sigma) was applied for 1h prior to staining with the indicated primary antibody diluted in PBS solution with 0.5% Goat Serum (Sigma), 0.5% BSA (Sigma) for 1h30 at room temperature. Following extensive washes, cells were stained for 45min at room temperature with the appropriate secondary antibodies from Life Technologies: goat anti-mouse IgG – Alexa 488 conjugated (A11029), goat anti-rabbit IgG -Alexa 555 conjugated (A21429) and/or goat anti-rabbit IgG-Alexa 647 (A21245). Nucleus was labelled with Hoescht 33342 (H3570, Thermo Fisher) before coverslips were mounted in Prolong Diamond (P36961, Life Technologies).
Images were acquired on a ZEISS LSM 780 system, equipped with the following lasers: diode 405nm, argon multiline 458/488/514nm, HeNe 543nm, HeNe 594nm and HeNe 633nm and using a Plan Apochromat 63x/1.4 oil objective. Image processing and analysis of the intensity profile were done on Fiji is just Image J software (version 1.53c) using the “plot profile” command.
Calcium flux assay
Calcium imaging was performed on EROS-/- and control cells using the Rhod-3-AM calcium imaging kit (Invitrogen) following the manufacturer’s protocol. Images were acquired with an LSM710 laser scanning META confocal microscope (Carl Zeiss) using a ×20 objective and maximum pinhole aperture of 600μm. Two-line averages were performed for each frame with images taken every 4s. 20μl of media was used as a negative control. At t = 140s, 100µM bzATP was added to the cells. 100ng/ml ionomycin was used as a positive control at the end of the experiment to confirm correct loading of cells. Image analysis of fluorescence intensity in response to addition of negative control, bzATP and positive control across the time course was performed with the Volocity 3D Image Analysis Software, collecting data for all cells that did not spontaneously fluoresce and had an ionomycin response.
Flow cytometry
Single cell suspensions of spleens were prepared by mechanical disruption in FACS buffer (D-PBS with 2mM EDTA, 0.5% FBS and 0.09% sodium azide) with a 100µm smart strainer (Miltenyi Biotec). 10% of the spleen was subjected to red blood cell lysis (eBioscience), washed and blocked with 1μg of Mouse BD FC Block™ for 10min at 4°C prior to addition of multicolour antibody cocktails. After incubation for 30min DAPI was added (0.2µg/ml) and the samples washed prior to acquisition on a LSRFortessa™ (BD biosciences) that was standardised using BD Cytometer Setup and Tracking beads and software. Compensation was determined using Ultracomp eBeads (eBioscience). Data acquisition was controlled with BD FACSDiva v8 software. All samples were analysed using FlowJo 10.7 in a blinded manner. Doublets were excluded via FSC-A vs FSC-H and SSC-H vs SSC-W and dead cells excluded by DAPI vs FSC-A. A plot of CD45 against time was used to check the stability of sample acquisition and leukocytes identified by a CD45 vs SSC-A plot. CD4 T cells are TCRβ+NK1.1-CD4+, CD8 T cells are TCRβ+NK1.1-CD8+, NK cells are TCRβ-NK1.1+, NKT cells are TCRβ+NK1.1+, γδT cells are TCRγδ+TCRβ- and B cells were TCRβ-NK1.1-TCRγδ-SSC low. A gate for P2X7 was set on each population based on a fluorescence minus one control.
For shedding analysis, 100µl of CD4 cells were treated with either 29µM NAD (Sigma) or 2.5mM ATP (Invivogen) for 30mins at 37°C, washed, resuspended in FACS buffer (PBS, 2% FBS) and co-stained with anti-CD4 (GK1.5, Biolegend), anti-CD62L (MEL-14, Biolegend) and anti-CD27 (LG.3A10, Biolegend) for 10min at room temperature. Unbound antibodies were removed by washing cells in FACS buffer and cells were kept in the same buffer for the acquisition.
For cell death analysis, NAD or ATP-treated CD4 cells (as described above) were resuspended in annexin-binding buffer (ThermoFisher) and incubated with 1µl 100µg/ml Propidium Iodide (PI; ThermoFisher) and 1/50 annexin V antibody (ThermoFisher) for 10min at room temperature. Cells were washed and resuspended in 1X annexin-binding buffer for the acquisition. Samples were acquired on an LSR X20 flow cytometer (BD).
EROS affinity purification-mass spectrometry
EROS-FLAG affinity purifications were carried out as described previously (Thomas et al., 2017). Bound proteins were eluted by incubating the beads with 200µg/ml 3xFLAG peptide (Sigma-Aldrich) in IPP150 containing 0.02% NP-40. The eluates were concentrated in Vivaspin 500 PES centrifugal filters (Vivascience), reduced with 5mM TCEP (Sigma-Aldrich), and alkylated with 10mM iodoacetamide prior to sample fractionation by polyacrylamide gel electrophoresis with Novex NuPAGE Bis-Tris 4–12% gels (Life Technologies). Gels were stained with colloidal Coomassie (Sigma) and whole gel lanes were excised into 12 bands and processed for mass spectrometry analysis as previously described (Pardo et al., 2010).
Peptides were reconstituted in 0.1% formic acid and injected for on-line LC-MS/MS analysis on an LTQ FT Ultra hybrid mass spectrometer coupled with an Ultimate 3000 RSLCnano UPLC system. Peptides were separated on a PepMap C18 column (75µm i.d. x 250mm, 2µm) over a linear gradient of 4 – 33.6% CH3CN/0.1% formic acid in 60min at a flow rate at 300nl/min. MS analysis used standard data-dependant acquisition mode to fragment the top 5 multiply charged ions with intensity above 1000. Briefly, the FT full MS survey scan was m/z 380 – 1800 with resolution 100,000 at m/z 400, AGC set at 1e6 and 500ms maximum injection time. The MS/MS fragmented in ion trap was set at 35% collision energy, with AGC at 1e4 and 250ms maximum injection time, and isolation width at 2.0Da. The dynamic exclusion was set 45s with ± 20ppm exclusion window.
Raw files were processed with Proteome Discover 2.3 (Thermo Fisher Scientific). Database searches were performed with Sequest HT against the mouse Uniprot database (v. August 2019) and cRAP contaminant database. The search parameters were: trypsin, maximum of 2 missed cleavages, 10ppm mass tolerance for MS, 0.5Da tolerance for MS/MS, with variable modifications of carbamidomethyl (C), N-acetylation (protein N-term), deamidation (NQ), oxidation (M), formylation (N-term) and Gln-> pyro-Glu (N-term Q). Database search results were refined through processing with Percolator (FDR <1%). Protein identification required at least one high-confidence peptide. External contaminants (keratins, albumin, casein, immunoglobulins) were removed before further analysis. SAINTexpress was used to score interaction specificity (Teo et al., 2014). Proteins with SAINT probability score > 0.9 were deemed high confidence specific interactors (FDR< 1%). Proteins with SP score > 0.74 represent medium confidence interactors (FDR < 5%).
For visualization, the protein interaction network was generated with STRING (minimum required interaction score 0.4) using interactions derived from text-mining, experiments and databases. GO term enrichment analysis was performed with STRING.
Full proteome quantitative analysis by TMT-Mass spectrometry
Cell pellets were lysed in 1% Sodium deoxylate / 10% isopropanol / 50mM NaCl /100mM TEAB (tetraethylammonium bromide, Sigma) with Halt™ Protease and Phosphatase Inhibitor Cocktail (1x, Thermo Scientific). Lysates were sonicated and heated at 90°C for 5min. 100µg of proteins per sample were reduced with TCEP, alkylated with iodoacetamide, and digested with 3µg of trypsin (Pierce MS grade, Thermo) prior to labelling with TMT10plex according to the manufacturer’s instructions. Samples were pooled, acidified, and then centrifuged to remove precipitated deoxycholic acid. The supernatant was dried, resuspended in 0.1% NH4OH and fractionated on an XBridge BEH C18 column (2.1mm i.d. x 150mm, Waters) with an initial 5min loading then linear gradient from 5% CH3CN/0.1% NH4OH (pH 10) – 35% CH3CN /0.1% NH4OH for 30min, then to 80% CH3CN /0.1% NH4OH for 5min and stayed for another 5min. The flow rate was at 200µl/min. Fractions were collected at every 42s from 7.8min to 50min and then concatenated to 28 fractions and dried.
Peptides were reconstituted in 0.1% formic acid and a 25% aliquot injected for on-line LC-MS/MS analysis on the Orbitrap Fusion Lumos hybrid mass spectrometer coupled to an Ultimate 3000 RSLCnano UPLC system (Thermo Fisher). Samples were desalted on a PepMap C18 nano trap (100µm i.d. x 20mm, 100 Å, 5µ), then separated on a PepMap C18 column (75µm i.d. x 500mm, 2µm) over a linear gradient of 5.6 – 30.4% CH3CN/0.1% formic acid in 90min at a flow rate at 300nl/min. The MS acquisition used MS3 level quantification with Synchronous Precursor Selection (SPS5) with the Top Speed 3s cycle time. Briefly, the Orbitrap full MS survey scan was m/z 375 – 1500 with the resolution 120,000 at m/z 200, with AGC set at 4e5 and 50ms maximum injection time. Multiply charged ions (z = 2 – 5) with intensity threshold at 5000 were fragmented in ion trap at 35% collision energy, with AGC at 1e4 and 50ms maximum injection time, and isolation width at 0.7Da in quadrupole. The top 5 MS2 fragment ions were SPS selected with the isolation width at 0.7Da, fragmented in HCD at 65% NCE, and detected in the Orbitrap. The resolution was set at 50,000, and the AGC at 1e5 with maximum injection time at 86ms. The dynamic exclusion was set 40s with ± 10ppm exclusion window.
Raw files were processed with Proteome Discoverer 2.4 (Thermo Fisher) using Sequest HT. Spectra were searched against Uniprot mouse database (April 2020) and cRAP contaminant database. Search parameters were: trypsin with 2 maximum miss-cleavage sites, mass tolerances at 20ppm for precursors and 0.5Da for fragment ions, dynamic modifications of Deamidated (N, Q), Oxidation (M) and Acetyl (Protein N-terminus), static modifications of Carbamidomethyl (C) and TMT6plex (Peptide N-terminus and K). Peptides were validated by Percolator with q-value set at 0.01 (strict) and 0.05 (relaxed). The TMT10plex reporter ion quantifier included 20ppm integration tolerance on the most confident centroid peak at the MS3 level. The co-isolation threshold was set at 100%. Only unique peptides, with average reported signal-to-noise ratio >3, were used for protein quantification, and the SPS mass matches threshold was set at 55%. Only master proteins were reported.
Plasma Membrane Profiling analysis by TMT-Mass spectrometry
Cell surface proteins were labelled essentially as described previously (Weekes et al., 2012). Samples were then resuspended in 21µL 100mM TEAB pH 8.5 prior to labelling with TMT reagent (Thermo Fisher) following manufacturer’s protocol. After checking each sample was at least 98% TMT labelled, total reporter ion intensities were used to normalise the pooling of the remaining samples to a 1:1 ratio of total peptide content between samples. This final pool was brought up to a volume of 1mL with 0.1% TFA. FA was added until the pH was <2. Sample were then cleaned up by SPE using a 50mg tC18 SepPak cartridge (Waters). The cartridge was wetted with 1mL 100% Methanol followed by 1mL ACN, equilibrated with 1mL 0.1% TFA and sample loaded slowly. Samples were passed twice over the cartridge. The cartridge was washed 3x with 1mL 0.1% TFA before eluting sequentially with 250µL 40% ACN, 70% ACN and 80% ACN and dried in a vacuum centrifuge.
TMT labelled samples were resuspended in 40µL 200mM Ammonium formate pH 10 and transferred to a glass HPLC vial for basic pH reversed phase fractionation (BpH-RP). BpH-RP fractionation was conducted on an Ultimate 3000 UHPLC system (Thermo Scientific) equipped with a 2.1mm × 15cm, 1.7µm Kinetex EVO column (Phenomenex). Solvent A was 3% ACN, Solvent B was 100% ACN, solvent C was 200mM ammonium formate (pH 10). Throughout the analysis solvent C was kept at a constant 10%. The flow rate was 500 µL/min and UV was monitored at 280nm. Samples were loaded in 90% A for 10min before a gradient elution of 0–10% B over 10min (curve 3), 10-34% B over 21min (curve 5), 34-50% B over 5min (curve 5) followed by a 10min wash with 90% B. 15s (100µL) fractions were collected throughout the run. Fractions containing peptide (as determined by A280) were recombined across the gradient to preserve orthogonality with on-line low pH RP separation. For example, fractions 1, 25, 49, 73, 97 were combined and dried in a vacuum centrifuge and stored at -20°C until LC-MS analysis. 12 Fractions were generated in this manner.
For mass spectrometry, analysis was conducted on an Orbitrap Fusion instrument on-line with an Ultimate 3000 RSLCnano UHPLC system (Thermo Fisher). Samples were resuspended in 10µL 5% DMSO/1% TFA and all sample was injected. Trapping solvent was 0.1% TFA, analytical solvent A was 0.1% FA, solvent B was ACN with 0.1% FA. Samples were loaded onto a trapping column (300µm × 5mm PepMap cartridge trap (Thermo Fisher)) at 10µL/min for 5min at 60°C. Samples were then separated on a 75cm × 75µm i.d. 2µm particle size PepMap C18 column (Thermo Fisher) at 55°C. The gradient was 3-10% B over 10min, 10-35% B over 155min, 35-45% B over 9min, followed by a wash at 95% B for 5min and re-equilibration at 3% B. Eluted peptides were introduced by electrospray to the MS by applying 2.1kV to a stainless-steel emitter 5cm × 30µm (PepSep). Mass spectra were acquired using MS3 level quantification with SPS10 with the Top Speed 3s cycle time. The Orbitrap full MS survey scan was m/z 400-1500 with the resolution at 120 000, AGC set at 125 and 50ms maximum injection time. Multiple charged ions (z=2-7) with intensity threshold at 5000 were fragmented in ion trap at 35% collision energy, with AGC at 80 and isolation width at 0.7Da in quadrupole. The top MS3 fragment ions were SPS selected with the isolation width at 2 and were fragmented in HCD at 65% and detected in Orbitrap at 50 000 resolution. The AGC was set at 40 with maximum injection time at 120ms and the dynamic exclusion was set at 40s with ±10ppm exclusion window.
Data were processed with MASCOT (Matrix Science) and Proteome discoverer, v2.2 (Thermo Fisher). Raw files were searched against the UniProt Mouse database including common contaminants at a MS1 1Tol of 10ppm, MS2 Tol of 0.5Da. Fixed modifications were TMT labelled Lysines and Peptide N-Termini and carbamidomethylated cysteines. Methionine oxidation was allowed as a variable modification. Mascot Percolator was used to control the PSM FDR and an automated decoy database search was used to determine protein FDR. Proteins with either “high” (FDR <0.01) or “medium” (FDR <0.05) confidence were taken forward to further analysis. Proteins and their abundances were output to .csv, imported to R and submitted to statistical analysis using LIMMA, a moderated t-test available through the Bioconductor package. LIMMA p-values were corrected for multiple hypothesis testing using the Benjamini-Hochberg method to generate an FDR (q-value).
Data availability
The mass spectrometry proteomics data have been deposited to the ProteomeXchange Consortium via the PRIDE (Perez-Riverol et al., 2019) partner repository with the dataset identifier “PXD024659”. The plasma membrane profiling mass spectrometry data has the identifier “PXD025149”.
Acknowledgements
D.C.T is funded by a Wellcome-Beit Prize Trust Clinical Research Career Development Fellowship and Imperial College London. E.G and E.R.D. are funded by the Wellcome Trust (grant code 098051). Research in D.C.T lab is supported by a generous donation from the family of Sidharth Burman. This work was supported by the Italian Ministry of Education, University and Research (MIUR, “Dipartimenti di Eccellenza Program 2018–2022—Dept. of Biology and Biotechnology L. Spallanzani”, University of Pavia). We are grateful to Prof. Arthur Kaser, Prof. Eric Schirmer, Prof. Ramanujan Hedge, Prof. Marina Botto, Prof. Matthew Pickering and Dr. Jacques Behmoaras for helpful discussion. We thank the Facility for Imaging by Light Microscopy (FILM) at Imperial College London (London, UK), partly supported by funding from the Wellcome Trust (grant 104931/Z/14/Z) and BBSRC (grant BB/L015129/1). We thank the LMS/NIHR Imperial Biomedical Research Centre Flow Cytometry Facility for the support. We also thank the Microscopy facility at the Cambridge Institute of Medical Research (Cambridge, UK).


