

ABSTRACT
Background Humans take vitamin D supplements to reduce risk of vitamin D deficiency and reduce the risk of osteoporosis. However, it is unclear how dietary super-doses (10,000x greater than requirement) can affect vitamin D status in aged animals. Aged laying hens could be a model to compare with women in peri- or postmenopausal stages of life. The hens’ bone health is physiologically taxed from egg production and they are highly susceptible to osteoporosis.
Objective We investigated dietary super-dose impacts of cholecalciferol (vitamin D3) on vitamin D status in aged laying hens in production.
Methods Forty-eight 68 wk old Hy-Line Brown laying hens were individually housed in cages with eight hens per dietary treatment for eleven weeks. Hens were randomly assigned to one of six groups of dietary vitamin D3 supplementation and fed ad libitum. Supplementation levels were 400, 800, 7,400, 14,000, 20,000, and 36,000 IU D3/kg of feed. At termination of the study, all hens were euthanized and we collected tissue samples and their feces. Tissue calcium, plasma and egg yolk vitamin D metabolites, and gene expression levels were measured.
Results We observed that increasing dietary vitamin D3 increased plasma vitamin D3, 25-hydroxycholecalciferol, and 24,25-dihydroxycholecalciferol concentrations (p < 0.0001 for all 3 metabolites). Also, egg yolk vitamin D3 and 25-hydroxycholecalciferol showed a similar effect like plasma vitamin D metabolites (p < 0.0001 for both metabolites). We also observed super-dose fed hens had decreased kidney 24-hydroxylase expression (p = 0.0006).
Conclusions Dietary super-doses of vitamin D3 led to greater plasma and egg yolk vitamin D levels to show that aged laying hens can deposit excess vitamin D in egg yolk. We suggest future research should explore how 24-hydroxylation mechanisms are affected by vitamin D supplementation. Further understanding of 24-hydroxylation can help ascertain ways to reduce risk of vitamin D toxicity.
Introduction
Vitamin D deficiency is directly linked to osteoporosis, with research demonstrating that increasing vitamin D intake through diet or supplements is a means to reduce risk and prevent vitamin D deficiency (1, 2). Older women in menopausal or post-menopausal stages of life contend with increased demands of nutrient absorption with onset of hormonal changes that are an effect of menopause (3–5). Reduction of physiological turnover activity as an added effect of aging is another demand which makes vitamin D deficiency more prevalent in older women (6). A recent study reported how prevalent levels of vitamin D deficiency was in middle-aged and elderly people from Lanzhou population in China (7). This population was regularly exposed to sunlight; however, other factors such as smoking were correlated to contribute to vitamin D deficiency. Culmination of vitamin D deficiency and aging can lead to increased osteoporotic susceptibility and underlying potential health risks associated with bone vulnerability (8).
Older people tend to take vitamin D supplements to increase or maintain vitamin D levels (9). While vitamin D toxicity is uncommon, vitamin D supplements and overfortified foods are the only known means of reaching intoxication levels (10, 11). A study showed how adult men in winter months were given daily doses of D3, ranging from 0 – 250 μg for about 20 wk (12). The men had increased serum 25-hydroxycholecalciferol (25-OH-D3), even though their 25-OH-D3 concentration was in a safe range. There was also a study involving adult men and women given a single oral dose that ranged from 1.5 – 10 μg 25-OH-D3 /kg of body weight (13). Serum 25-OH-D3 concentration of these adults quickly increased within 4-6 h. However, the half-life of 25-OH-D3 was long (~22 d) and 25-OH-D3 can remain in circulation and potentially reach toxic levels (13). Young laying hens fed diets with 15,000 IU D3 /kg of feed for 48 wk did not show signs of tissue pathologies from toxicity (14). There is value with assessing how super-doses of dietary D3 affects plasma vitamin D metabolite levels in older laying hens. We hypothesized that older laying hens would have reduced vitamin D metabolism that led to reduced circulating levels of hydroxylated vitamin D metabolites. Understanding how high levels of dietary doses of D3 would be valuable information for ascertaining how overfortified foods can potentially affect vitamin D metabolism in older animals.
Dietary vitamin D supplementation is important for laying hens in production because their bone health is physiologically taxed from egg production (15, 16). Laying hens in commercial farms are fed diets with supplemental vitamin D3 beyond NRC requirements (17). This ensures the hens are able to lay eggs and maintain adequate Ca absorption for eggshell formation and importantly, bone mineralization. There are a few studies which investigated how high dietary vitamin D supplementation affected laying hen production and the metabolic implications pertaining to vitamin D status (14, 18, 19). There is need for studies that examined how super-doses of vitamin D3 affect gene expression and how vitamin D-related genes correlate to vitamin D metabolism in laying hens. Understanding how gene expression and metabolic indicators, like blood vitamin D metabolite levels, are affected by super-doses of dietary vitamin D3 in aged laying hens which has implications on the poultry industry, but also with human health. We expect aged laying hens fed super-doses of dietary vitamin D3 to have upregulated expression of vitamin D-related genes, resulting in improved vitamin D metabolism. Such findings have implications to justify increasing vitamin D intake from fortification in food for older women to improve their vitamin D status.
Our study examined dietary vitamin D3 super-dose effects on plasma and egg yolk vitamin D3 metabolites and relative gene expression of vitamin D-related genes in aged laying hens in production. We fed hens diets containing 400, 800, 7,400, 14,000, 20,000, and 36,000 IU D3/kg of feed to ascertain vitamin D3 supplementation impacts. Hens consuming diets with vitamin D3 greater than 10,000 IU/kg were expected to have increased plasma 24,25-dihydroxycholecalciferol (24,25-(OH)2-D3) because 24,25-(OH)2-D3 is an inactive form to indicate they reached vitamin D saturation. Hens consuming super-doses of D3 should also lay eggs with increased vitamin D3 content because they would deposit excess D3 into the egg (14).
Methods
Birds and housing
The hens used in our study were from North Carolina State University’s maintained poultry flock. Forty-eight 68 wk old Hy-Line Brown laying hens were housed at North Carolina State University, Raleigh, NC. Hens were individually housed in cages between two two-level battery cages with eight birds per treatment. The experimental design was a randomized complete block design with six levels of dietary vitamin D supplementation blocked by cage level. Vitamin D3 supplementation levels were formulated to be 250, 500, 1,500, 15,000, 30,000, and 60,000 IU D3/kg of feed, but the analyzed vitamin D3 in feed (and dietary treatments in this study are referred as) were 400, 800, 7,400, 14,000, 20,000, and 36,000 IU/kg of feed (Tables 1 and 2). Prior to the start of the experiment, all hens were fed the same diet (400 IU D3/kg of feed) for one month as a washout period. Hens were fed ad libitum along with water. North Carolina State University’s Institutional Animal Care and Use Committee approved all methods for this study, protocol ID number: 18-093-A.
Ingredient composition of the experimental basal diet
Nutrient content of the experimental diet
Sample Collection
Eggs were collected every morning and stored at 7°C for egg quality analyses. The first egg laid for the week by each hen was selected for egg yolk collection. Eggs were cracked open in a dim-lighted room to reduce photodegradative impacts of light on vitamin D in yolk. Yolk was separated from albumen and placed in a small plastic container wrapped in aluminum foil and stored at 4°C for a year until they were freeze-dried using a freeze-dryer (FreeZone 6 Liter Benchtop Freeze Dry System, Labconco, Kansas City, MO). All 48 birds were bled to have their plasma vitamin D3 metabolites measured. All birds were sacrificed by cervical dislocation and tissue samples were collected from 43 birds (minimum of seven birds per treatment) due to time constraints. Liver and kidney were collected and stored in RNAlater at −20°C until RNA extractions were performed.
Calcium and phosphorus content of various sites
Eggshells from week 0, 3, 4, 6, and 9 were washed with warm water to remove shell membrane and dried for 48 h at room temperature. Dried eggshells were pre-weighed and further dried at 68°C for 72 h using a dry oven (Blue M, Atlanta, GA) and weighed again. Eggshells were crushed into fine powder and subjected to digestion to measure Ca composition of eggshells. Feces and ileal digesta were also subjected to same steps as eggshells. Dried samples were weighed and then placed in a muffle furnace at 500°C overnight to ash samples. Ashed samples were dehydrated in 2 mL of distilled water and 4 mL of 6 N hydrochloric acid. The resulting sample was mixed and heated to warm to touch. Heated solution was poured into volumetric flask and deionized water was added to 50 mL. The flask was inverted 12 times to mix and the resulting solution was filtered using #40 filter paper into 15 mL centrifuge tubes for analysis. Ca and P was measured by inductively coupled plasma optical emission spectrometry.
Bones were wrapped in petroleum ether moistened cheesecloth and placed in a desiccator for 72 h to extract fat from bones. Fat-extracted bones were pre-weighed and dried for 24 h at 100°C to evaporate petroleum ether residues. Fat- and moisture-free bones were weighed and ashed using same methods as eggshell, feces, and ileal digesta for Ca and P composition and measured by inductively coupled plasma atomic emission spectroscopy.
RNA extraction and qPCR
Total mRNA was extracted from duodenum, ileum, liver, and kidney using Qiagen’s RNeasy Mini Kit (Germantown, MD). The extracted RNA was diluted and normalized to ~200 ng/μL for liver and 60 ng/μL for duodenum, ileum, and kidney. The aforementioned tissues’ RNA was reverse transcribed to complementary DNA (cDNA) using Applied Biosystems’ High-Capacity cDNA Reverse Transcription Kit (ThermoFisher Scientific, Waltham, MA) and their recommended steps to make a 20 μL working solution. Cycling procedure for reverse transcription started with 25°C for 10 min, 37°C for 120 min, 85°C for 5 mins, then held at 5°C indefinitely until storage or use.
Genes amplified for quantitative real time PCR (qPCR) were vitamin D receptor (VDR), 1α-hydroxylase (1α-OHase), 25-hydroxylase (25-OHase), 24-hydroxylase (24-OHase), and glyceraldehyde 3-phosphate dehydrogenase (GAPDH) as the housekeeping gene (Table 3). qPCR was conducted using PowerUP SYBR Master Mix (Life Technologies, Grand Island, NY) following manufacturer’s protocol and using Applied Biosystems StepOnePlus Real-Time PCR System (Carlsbad, CA). Cycling procedure started with 95°C for 10 min then 40 cycles of 95°C for 15 s for denaturing and 15 s at 60°C for annealing. All samples were run in triplicates.
Primer sequences for quantitative real-time PCR (qPCR)
Vitamin D metabolites
Plasma from specific-fed hens from 400, 800, 14,000, and 36,000 IU D3 groups were respectively pooled (n = 4/treatment) and sent to Heartland Assays (Ames, IA) for measuring D3, 25-OH-D3, and 24,25-dihydroxycholecalciferol [24,25-(OH)2-D3, inactive form of D3] using LC/MS/MS. Freeze-dried egg yolk from the same hens were pooled (15 g per sample) like plasma, but only samples from 400, 14,000, and 36,000 IU D3 groups (n = 4/treatment) were analyzed for D3 and 25-OH-D3 from Heartland Assays.
Statistical analysis
We conducted statistical analyses using general linear models using SAS 9.4® for all statistical tests and Tukey-Kramer test was used for multiple comparisons for differences between dietary treatments. We utilized repeated measures to account for temporal effects of weekly body weight, feed intake, egg production, eggshell quality, and ionized blood Ca. Dietary vitamin D3 level was the independent variable for Ca and P composition, plasma and egg yolk vitamin D metabolite concentrations, and gene expression data. We did not observe a cage effect in any analysis so the blocking variable was omitted from all statistical tests. All mRNA relative expressions were normalized using 2−CΔΔT with GAPDH as a housekeeper gene. Statistical significance was established at p < 0.05.
Results
Hens’ production performance was not influenced by dietary vitamin D3
To determine if dietary super-doses of vitamin D3 affected the hens’ production value, we measured the hens’ weekly body weights and egg production. Dietary super-doses of vitamin D3 did not affect body weight of these laying hens (p = 0.08; Table S1). There was an interaction between dietary vitamin D3 level over time (F = 5.45, p < 0.0001); however, there was constant feed wastage throughout the study so this effect could be inflated. A dietary effect was observed for egg production for the entire study duration (F = 2.52, p = 0.047; Table S2) with hens from 14,000 IU D3 treatment group having highest production rate of 86.7%. Eggshell strength and eggshell thickness were not affected by dietary vitamin D3 levels (p = 0.19, p = 0.72, respectively; Table S2). There was a trending interaction between dietary vitamin D3 level over time in which there was a decrease in eggshell elasticity (p = 0.07).
Ionized blood calcium is affected by dietary vitamin D3 levels
We also examined if ionized blood Ca in the hens was influenced by dietary vitamin D3 levels throughout the study. There was no temporal effect on ionized blood Ca (p = 0.65). With week 0 considered as a covariate, there was a strong dietary effect on ionized blood Ca (p = 0.002, Table S3). Even so, it is unclear on how dietary levels of D3 influenced ionized blood Ca concentration because their levels are both high and low across standard-fed D3 hens and super-dose-fed D3 hens.
Fecal calcium is affected by dietary vitamin D3 levels, but not ileal digesta or eggshell calcium or phosphorus
We had the eggshell, ileal digesta, and fecal Ca and P measured to determine if dietary vitamin D3 fed to our hens would reduce the excretion or loss of Ca and P. There was no dietary effect on eggshell Ca and P (p = 0.64 for both) and ileal digesta Ca or P (p = 0.74 and 0.09, respectively). There was a dietary effect with fecal Ca with hens fed 14,000 IU D3 diet had 10.6±0.8% Ca by weight in their feces, whereas all other treatments were 8-9%, with exception of 36,000 IU D3 fed hens which had 7.36±0.43% fecal Ca (p = 0.03, Table S4). There was no dietary effect on fecal P (p = 0.76). Feeding hens diets containing super-dose levels of vitamin D3 did not affect P in all measured samples and hens fed the highest level of D3 had the lowest Ca excretion in feces.
Humerus is more calcium and phosphorus dense than tibia
We assessed if dietary vitamin D3 would improve bone Ca and P in the hens. However, no dietary effects of vitamin D supplementation were observed on bone Ca or P (p = 0.79, p = 0.63, respectively). Humerus bones have more Ca and P than tibia bones (p = 0.020, p = 0.015, respectively; Figure S1). We showed that feeding aged laying hens super-dose levels of vitamin D3 does not affect Ca and P of humerus and tibia.
Dietary super-dosage levels of vitamin D increased plasma and egg yolk vitamin D3 metabolites
We had plasma and egg yolk vitamin D3 metabolites measured by LC-MS/MS to determine if dietary vitamin D3 affected plasma and egg yolk concentrations. Plasma vitamin D3 was below readable range for 400 and 800 IU treatments and those samples were considered zero and included in statistics to account for model building. All vitamin D3 metabolite data exhibited heteroskedasticity and were transformed using natural logarithm function. Transformed data exhibited linear and homoskedastic relationships and were used for statistics.
There was a significant increase in plasma concentration of D3, 25-OH-D3, and 24,25-(OH)2-D3 for hens fed dietary super-dose levels of vitamin D3 (D3: F = 27.2, r2 = 0.86, p = 0.0002; 25-OH-D3: F = 495.1, r2 = 0.99, p < 0.0001; 24,25-OH-D3: F = 239.4, r2 = 0.98, p < 0.0001). Although plasma D3 concentration could not be read for 400 and 800 IU treatments, D3 concentration had a strong positive correlation with 25-OH-D3 and 24,25-(OH)2-D3 concentrations (r = 0.95, p < 0.0001; r = 0.92, p < 0.0001; respectively). Plasma D3 and 25-OH-D3 had similar concentration values when dietary vitamin D3 increased with both metabolites having ~85 ng/mL at 36,000 IU treatment (Figures 1A and 1B). Although plasma 24,25-(OH)2-D3 concentration was statistically affected by dietary treatment, its rate of increase relative to dietary treatment, compared to the D3 and 25-OH-D3, was much lower with 17.4 ng/mL at 36,000 IU (Figure 1C). The percentage ratio of 24,25-(OH)2-D3 to 25-OH-D3 increased as dietary D3 levels increased and reached an asymptote at the super-dose levels (F = 18.8, r2 = 0.83, p < 0.0001; Figure 1D). The percentage ranged from 8.7% to 20.5% with all super-dose fed hens having a similar ratio of about 20%.

A) Cholecalciferol (Vitamin D3; 400 and 800 IU treatment concentrations were not determined) B) 25-hydroxycholecalciferol (25-OH-D3) C) 24,25-dihydroxycholecalciferol (24,25-(OH)2-D3) D) Ratio of 24,25-(OH)2-D3/25-OH-D3 presented as a percentage. Blue squares denote standard NRC range D3 levels in diet and orange squares denote super-dose levels of D3 in diet (n = 4). Squares are reported as means ± SEM. Squares with common letters are not statistically different from each other (General linear models, p < 0.0001).
Egg yolk D3 increased drastically as hens’ dietary D3 intake increased (F = 537.8, p < 0.0001; Figures 2A and 2B). Egg yolk 25-OH-D3 was also significantly increased in concentration as hens’ dietary D3 increased (F = 44.8, p < 0.0001), but the rate of increase was much lower compared to egg yolk D3 (D3 ranged from 8.55 – 1009.9 ng/g; 25-OH-D3 ranged from 3.48 – 51.6 ng/g). Yolk D3 was greatly positively correlated with plasma D3 and yolk 25-OH-D3 (r = 0.90, p = 0.002; r = 0.96, p < 0.0001; respectively).

Cholecalciferol (Vitamin D3) B) 25-hydroxycholecalciferol (25-OH-D3). Blue squares denote standard NRC range D3 levels in diet and orange squares denote super-dose levels of D3 in diet (n = 4). Squares are reported as means ± SEM. Squares with common letters are not statistically different from each other (General linear models, p < 0.0001).
Altogether, the plasma and egg yolk vitamin D3 data highlights a strong dose-dependent response towards dietary vitamin D3 fed to aged laying hens. All measured metabolites displayed increasing concentrations as dietary vitamin D3 levels increased.
Dietary super-doses of D3 intake upregulated duodenal vitamin D receptor expression
Considering VDR is the transcription factor responsible for exerting vitamin D’s physiological effects (20), we measured VDR expression in multiple tissues to determine if dietary D3 levels would affect VDR expression. Hens fed higher levels of dietary D3 had upregulated duodenal VDR expression (F = 3.54, p = 0.036; Figure 3A). There was no dietary effect on VDR expression from ileum, liver, and kidney (p = 0.96, 0.17, 0.32; respectively; Figures 3B-3D). These data suggest that duodenal VDR expression is responsive to dietary vitamin D3.

A) Duodenal VDR (n = 2-6) B) Ileal VDR (n = 2-5) C) Liver VDR (n = 2-4) D) Kidney VDR (n = 2-4). Tissues were analyzed using qPCR normalized against glyceraldehyde phosphate dehydrogenase (GAPDH; housekeeping gene) expression. Blue bars denote standard NRC range D3 levels in diet and orange bars denote super-dose levels of D3 in diet. All samples ran in triplicates and reported as means ± SEM. Bars with common letters are not statistically different from each other (General linear models, p < 0.05).
Dietary super-doses of D3 decreased kidney 24-OHase expression
We examined if vitamin D3 super-dosages would affect the gene expression of vitamin D hydroxylase enzymes in the liver and kidney. Unexpectedly, kidney 24-OHase expression was lower in hens fed diets with super-dose levels of D3 (F = 8.42, r2 = 0.73, p = 0.0006) with 400 and 800 IU hens having about 1.32 expression and super-dose hens having 0.80 – 1.00 expression (Figure 4A). There was no dietary effect on liver 25-OHase expression (p = 0.95; Figure 4B). Also, no differences were seen with kidney 1α-OHase expression (p = 0.81; Figure 4C). Our findings highlighted that liver 25-OHase and the kidney 1α-OHase expression were not affected by dietary super-doses of vitamin D3; however, the super-dosages led to downregulation in kidney 24-OHase expression.

A) Kidney 24-hydroxylase (24-OHase; n = 2-4) B) Liver 25-hydroxylase (25-OHase; n = 4-7) C) Kidney 1α-hydroxylase (1α-OHase; n = 2-5). Tissues were analyzed using qPCR normalized against glyceraldehyde phosphate dehydrogenase (GAPDH; housekeeping gene) expression. Blue bars denote standard NRC range D3 levels in diet and orange bars denote super-dose levels of D3 in diet. All samples ran in triplicates and reported as means ± SEM. Bars with common letters are not statistically different from each other (General linear models, p < 0.05).
Discussion
Our results suggest that dietary super-doses of D3 greatly increased plasma and egg yolk D3 levels. Increased plasma vitamin D3 indicates these birds absorbed the vitamin D3 from their diets. However, the inactive vitamin D3 metabolite, 24,25-(OH)2-D3 increased at a much lower rate than D3 and 25-OH-D3. Increasing plasma 24,25-(OH)2-D3 concentrations highlights that these hens were likely trying to reduce their circulating vitamin D3 levels. In addition, egg yolk D3 drastically increased while yolk 25-OH-D3 had a smaller rate of increase. Therefore, we speculate that maximal 24-hydroxylation activity was achieved and these hens deposited excess D3 in egg yolks to avoid vitamin D toxicity.
Vitamin D, regardless of its biogenic or dietary origins, is transported and circulated in blood which is why vitamin D is also considered a hormone (Figure 5)(16). Circulating vitamin D3 is transported to the liver to have a hydroxyl group added to C-25 by 25-OHase which results in 25-OH-D3. 25-OH-D3 moves to kidney to have another hydroxyl group added at C-1 by 1α-OHase to become 1,25-dihydroxycholecalciferol [1,25-(OH)2-D3], the most active form of vitamin D3 that exerts vitamin D’s biological effects via binding to VDR. However, there are regulatory pathways for 25-OH-D3 that can occur in the kidney with 24-OHase adding a hydroxyl group to C-24 to result in 24,25-(OH)2-D3 (16). 24,25-(OH)2-D3 is considered an inactive form of vitamin D that is excreted as a means for the body to remove excess vitamin D from circulation (21).
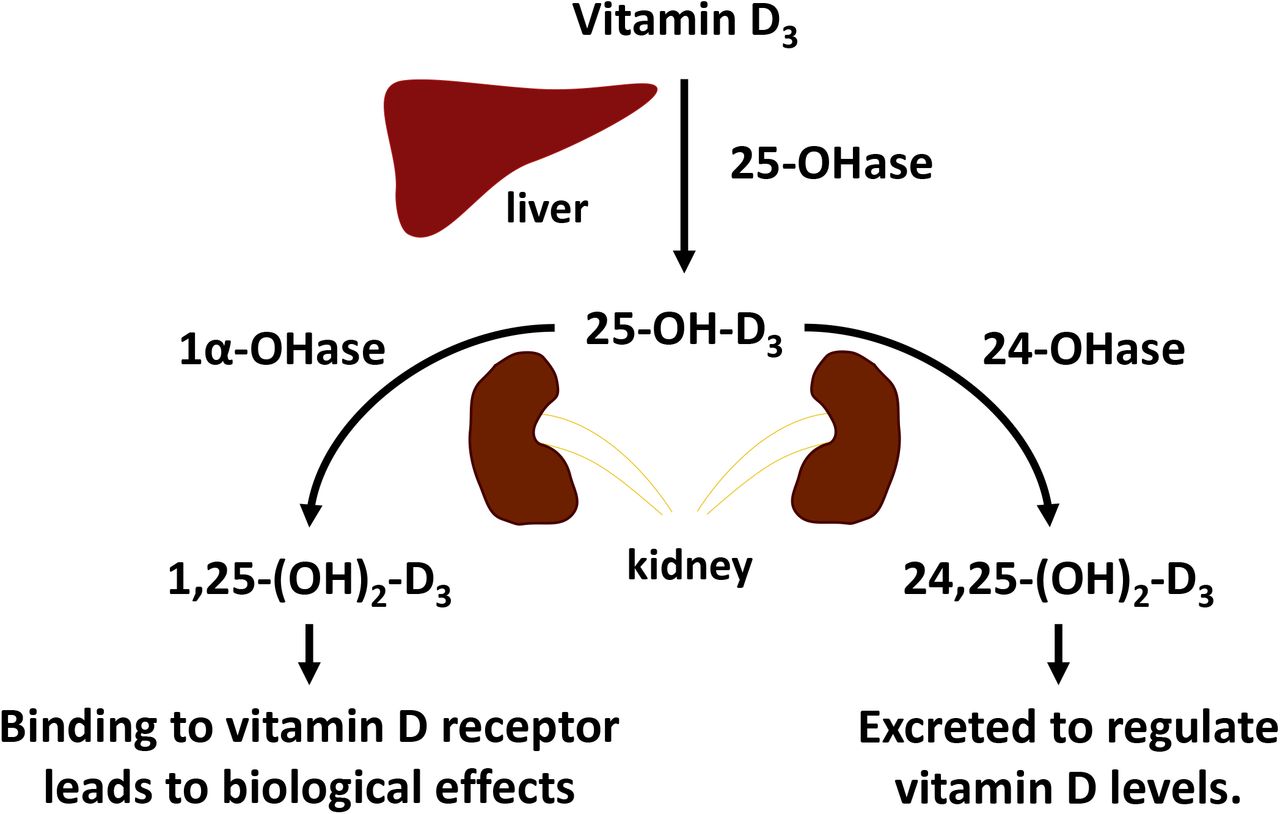
Vitamin D3 is converted to 25-hydroxycholecalciferol (25-OH-D3) in the liver by 25-hydroxylase (25-OHase). As a vitamin D status biomarker, 25-OH-D3 can be further hydroxylated at the C-1 or C-24 positions to become 1,25-dihydroxycholecalciferol [1,25-(OH)2-D3] or 24,25-dihydroxycholecalciferol [24,25-(OH)2-D3], respectively by 1α-hydroxylase (1α-OHase) or 24-hydroxylase (24-OHase) which are expressed in the kidney. 1,25-(OH)2-D3 is the biologically active form of D3 that binds to vitamin D receptor to exert biological effects and 24,25-(OH)2-D3 is an inactive vitamin D metabolite that is excreted from the body.
Vitamin D hydroxylases are part of a cytochrome P450 family that regulate vitamin D metabolism (21). The liver is a major site of 25-hydroxylation via 25-OHase in liver mitochondria and microsomes (22). There are extrahepatic sources of 25-OHase like kidney (23) and intestine (24); however, it is not clear how extrahepatic sources contribute physiologically to vitamin D metabolism (22). To our knowledge, there is only one paper that described the avian cytochrome P450 family in chicken liver (25). Aged laying hens fed diets containing super-doses of D3 did not result in any differential liver 25-OHase expression. This could signify liver 25-OHase may not be under metabolic control in avian species. Studies with rats and humans showed that increased plasma 25-OH-D3 concentration is related to dietary vitamin D3 intake (24, 26). Half-life of plasma 25-OH-D3 is at least 18 d (27). Therefore, it is possible that our observations of increased 25-OH-D3 concentration may not be necessarily caused by increased 25-OHase expression.
VDR is important for exerting biological effects of vitamin D with increasing intestinal Ca absorption being a prominent effect (28). Knockout rats that could not express VDR had decreased intestinal Ca absorption and almost no Ca-related transport protein expression (28, 29). In our study, hens fed diets with higher super-dose levels of D3 had upregulated VDR expression in duodenum (Figure 3A). This is further supported by an increase in responsiveness of VDR to D3 earlier in the intestine for increasing Ca absorptive capacity (30, 31). Super-dose levels of vitamin D3 intake did not affect liver VDR expression of the hens in this study likely because VDR has little to no expression in the liver (30, 32, 33). However, the distal part of intestine and colon were shown to have increased VDR expression in rats fed diets with 1,25-(OH)2-D3 (34).
Our hens were fed the experimental diets for eleven weeks and no discernable changes in egg production or body weight were observed (Table S1). Although egg quality was shown to not be affected by dietary super-doses of D3 in our study, a laying hen’s physiological status affects egg quality (35). Another study reported how laying hens fed extremely high levels of D3 also had no changes in egg production, except egg qualities like eggshell quality were reduced (36). Our findings agree with Mattila et al. (14) and a recent study by our colleagues (19) that laying hens fed diets with greater levels of dietary D3 throughout their production cycle increases yolk D3 content. An interesting finding in our study was that 25-OH-D3 in yolk increased with increased dietary D3 even though it was much lower than D3. Mattila et al. (18) also observed the same phenomenon with D3 and 25-OH-D3 in egg yolk being affected by dietary D3 fed to hens. Although 25-OH-D3 is a more potent source for vitamin D activity, more research is needed to explore the transfer rate of 25-OH-D3 from hens fed crystalline 25-OH-D3 in comparison to hens fed D3. Our findings indicated that D3 is deposited more readily into yolk versus 25-OH-D3. One assumption is that hens fed 25-OH-D3 have regulatory feedback mechanisms acting to reduce plasma 25-OH-D3 levels. Therefore, it is possible that excess 25-OH-D3 was transferred to the egg yolk instead of D3 as observed with hens from our study.
Plasma 25-OH-D3 concentration is important as a vitamin D status indicator (37, 38). Although plasma 25-OH-D3 concentration ranges have not been fully characterized in laying hens, vitamin D status can still be ascertained by observing 25-OH-D3 concentration relative to D3 and 24,25-(OH)2-D3. In our study, the 400 and 800 IU D3 treatments were formulated to meet NRC requirements for laying hens. Whereas the 14,000, 20,000, and 36,000 IU D3 treatments were dietary super-dose treatments for D3 intake. Higher dietary vitamin D3 levels led to increasing plasma concentrations of vitamin D3 and 25-OH-D3 (Figures 1A and 1B). The fascinating element of this data was the large range for plasma 25-OH-D3. The range was 7.15 ng/mL 25-OH-D3 for 400 IU hens to 85.2 ng/mL 25-OH-D3 for 36,000 IU hens. Yolk 25-OH-D3 levels were similar to plasma with the concentration range, 3.48 ng/g 25-OH-D3 for 400 IU hens to 51.6 ng/g 25-OH-D3 for 36,000 IU hens. Supplementing laying hen diets with 25-OH-D3 increased egg yolk 25-OH-D3, although it resulted in lower egg yolk vitamin D3 (39). Taking into consideration with our findings and what Duffy et al. (39) reported, the vitamin D metabolite composition in egg yolk is influenced by whatever dietary vitamin D3 isoform is fed to the laying hens.
Prior research characterized 24,25-(OH)2-D3’s function as an inactive vitamin D metabolite that is excreted from an animal’s body (40, 41). The biological significance of 24,25-(OH)2-D3 is to reduce 25-OH-D3’s plasma concentration (42). Hydroxylation of C-24 is significant because it can also occur with 1,25-(OH)2-D3 to lead to 1,24,25-trihydroxylcholecalciferol which is also excreted (41). To our current knowledge, there is no research on 24,25-(OH)2-D3 plasma concentration in laying hens. Comparable to plasma 25-OH-D3, the hens’ plasma 24,25-(OH)2-D3 increased as their dietary D3 intake increased. However, unlike plasma D3 and 25-OH-D3, there was a large difference in the rate of increase with 24,25-(OH)2-D3 having a tiny increase overall. Plasma 24,25-(OH)2-D3 in hens fed 14,000, 20,000, and 36,000 IU D3 /kg of feed was 6.8, 11.1, and 17.4 ng/mL, respectively. The rate of increase for 24,25-(OH)2-D3 relative to D3 and 25-OH-D3 at super-dosage levels off at 20%, highlighting a possible asymptotic relationship. The asymptote began at the 14,000 IU D3 level and can be potentially explained by 24-hydroxylation activity achieving its maximal limit. The combination of the lack of an exponential increase for plasma 24,25-(OH)2-D3, unlike D3 and 25-OH-D3, and the aforementioned asymptote is a monumental finding. It should be noted that there is a paradox with how hens fed super-dose levels of dietary vitamin D3 in this study had decreased kidney expression of 24-OHase. A study with rats reported how kidney 24-OHase expression was reduced by 1,25-(OH)2-D3 administration (43). The decreased 24-OHase expression in hens fed super-dose levels of D3 is possibly linked to increased levels of 1,25-(OH)2-D3. Another possible explanation is the long half-life of plasma 24,25-(OH)2-D3 (over 15 d (44)) caused 24,25-(OH)2-D3 to build up concentration in super-dose fed hens.
Our study has a number of strengths that highlight its impact with advancing nutritional knowledge. A significant strength of our study is the distinct separation of plasma and egg yolk vitamin D metabolite data between treatment groups. This emphasized the experimental design captured a broad range of dietary vitamin D3 supplementation level effects on plasma vitamin D metabolites that future research can focus on a specific range to build off our findings. Another strength of our study was the plasma 25-OH-D3 measurements to help assess the vitamin D status of the hens. Our study provides novel observations of laying hen plasma 25-OH-D3 levels relative to dietary vitamin D3 supplementation that can be valuable for the poultry industry to consider with vitamin D status. The plasma 24,25-(OH)2-D3 data is the most exciting novel finding of our study. Further understanding of the asymptotic relationship of the super-dose levels with plasma 24,25-(OH)2-D3 concentrations can open up new knowledge about 24,25-(OH)2-D3’s value as a biomarker for vitamin D metabolism.
There were a few limitations with this study that were realized when data was collected. We should have investigated kidney histopathology of these birds because soft-tissue calcification or renal kidney failure could result from the hens reaching vitamin D toxicity (45, 46). However, Mattila et al. (14) examined histological samples of younger hens fed 15,000 IU D3/kg of feed and they did not observe any pathological issues with their hens’ kidneys, leading them to conclude that vitamin D toxicity had not occurred. Wen et al. (19) noted how 17-wk old pullets fed diets containing 68,348 IU D3 had lower body weight and suggested that the pullets were likely affected by Ca toxicity. No weight loss was observed with the hens in our study and there was no interactive effect with ionized calcium between dietary vitamin D3 level overtime. So, it is plausible the hens may not have reached vitamin D toxicity. The smaller sample sizes and missing treatment groups from the qPCR results were because some tissue samples would not yield RNA for cDNA synthesis, even after multiple extraction attempts. All the tissue samples, except for plasma, had to be temporarily stored in a 7°C cold room until freezer space was made available which could have caused a reduction in RNA quality. Although statistical power may be lacking as a result of reduced sample size, the biological effect with 24-OHase looks promising and is still important for future research for vitamin D metabolism. We also stored the egg yolk in a refrigerator for about a year before the yolk was freeze dried. When compared to Wen et al. (19) results which used hens close to the age of the hens used in our study, our findings hinted towards minimal D3 degradation (Table 4). The amount of egg yolk vitamin D3 for similar dietary treatments between the two studies were comparable. This could indicate how stable D3 is when it is stored in cold, dark conditions. If this study was repeated, then using aged roosters, in addition to aged hens, would provide a perspective of what dietary vitamin D3 super-doses could result in vitamin D metabolism because the roosters cannot lay eggs and remove excess vitamin D through egg yolk deposition like hens. If roosters had soft-tissue calcification or kidney failure, then that would illustrate vitamin D super-doses led to toxicity and the hens avoided the toxicity by laying eggs containing the excessive vitamin D.
Comparison of egg yolk vitamin D3 from eggs laid by hens fed different dietary levels of vitamin D3 in this study compared to Wen et al. 2019 study (19). The closest experimental treatments by dietary vitamin D3 levels were compared.
Accounting for excessive yolk D3 levels, we speculate that hens fed super-doses of D3 converted their 25-OH-D3 to 24,25-(OH)2-D3 to avoid vitamin D toxicity, but 24-hydroxylation reached its maximal activity rate. Hens would shunt excess D3 and 25-OH-D3 to egg yolk as a consequence of increasing plasma vitamin D concentration. This rationale is further validated because these hens can only transfer so much D3 to yolk. This suggests why super-dose fed hens had higher levels of plasma D3 even though they transferred a lot of D3 to egg yolk. Our novel finding with plasma 24-OH-D3 concentration has important implications for geriatric humans who take supplements. Except for lactating women who can transfer excess vitamin D to milk, there is a possibility that older people taking high levels of vitamin D supplementation than intended could be at risk of vitamin D toxicity. To our knowledge, there are no studies that explored 24,25-(OH)2-D mechanisms when vitamin D is administered in large doses. Future research should elucidate vitamin D mechanisms with great levels of intake and how 24-hydroxylation is influenced.
Our study exhibits that feeding super-doses of dietary D3 to aged laying hens increases their plasma and egg yolk D3 metabolite concentrations (Figure 6). Importantly, there is a possible metabolic limit of 24-hydroxylation to remove excess circulating D3. Investigating 24-hydroxylation mechanisms will be important to understanding vitamin D supplementation impacts in geriatric animals for improving bone health and vitamin D metabolism in older humans.

Egg yolk vitamin D3 levels were strongly correlated to the dietary levels of vitamin D3 fed to the hens. Egg yolk 25-hydroxycholecalciferol (25-OH-D3) levels were also dependent on dietary vitamin D3; however, 25-OH-D3 increases at a lower rate. For plasma vitamin D metabolites, vitamin D3 and 25-OH-D3 concentrations increased relative to dietary vitamin D3 levels fed to the hens. Plasma 24,25-dihydroxycholecalciferol [24,25-(OH)2] levels were also dependent on dietary vitamin D3, but rate of increase is low. Dietary super-doses of vitamin D3 caused downregulation of kidney 24-hydroxylase (24-OHase) expression.
Acknowledgments
We thank Gavin Conant, Meghan Connelly, Peter Ferket, Laura Hernandez, Matt Koci, Shannon Madden, Celeste Sheftel, and Teresa Walker for their comments and edits to the initial manuscript; Taylor Jones and Nick Thompson for their help with the RNA extraction, cDNA synthesis, and qPCR experiments; David Dickey for statistical assistance; Jeff Hall and Zach Spivey for their help with taking care of the hens and collecting samples; and Liza Lentz of the Environmental and Agricultural Testing Service laboratory, Department of Crop and Soil Sciences, at North Carolina State University who performed the mineral composition experiments and analyses. The authors’ responsibilities were as follows-MFW and KAL: designed research; MFW, DDH, and KAL: conducted research; MFW: analyzed data; MFW and KAL: wrote manuscript; MFW and KAL: prepared experimental diets for study; MFW and PMP: prepared samples for ashing; MFW and DDH: prepared and shipped plasma and egg yolk samples to Heartland Assays; MFW and KAL: had primary responsibility for final content; and all authors have read and approved the final manuscript.
Footnotes
Sources of support: Funding for this research was supported by the US Poultry & Egg Association (KAL).
Conflict of Interest and Funding Disclosure: KAL is an employee of Elanco Animal Health. All other authors report no conflicts of interest.
Abbreviations used: 1α-OHase, 1α-hydroxylase; 1,25-(OH)2-D3, 1,25-dihydroxycholecalciferol; 24-OHase, 24-hydroxylase; 25-OHase, 25-hydroxylase; 24,25-(OH)2-D3, 24,25-dihydroxycholecalciferol; 25-OH-D3, 25-hydroxycholecalciferol; VDR, vitamin D receptor
References


