

ABSTRACT
Hunger is an internal state that not only invigorates behaviour towards feeding, but also acts as a contextual cue for the higher-order control of anticipatory feeding-related behaviour. The ventral hippocampus is a brain region important in encoding context, but how internal contexts such as hunger are represented in hippocampal circuits is not known. Pyramidal neurons in the ventral hippocampus, and in particular within the ventral CA1/subiculum border (vS) express the receptor for the peripheral hunger hormone ghrelin, and ghrelin is known to cross the blood brain barrier and directly influence hippocampal circuitry. However, what role vS neurons play during feeding related behaviour, and how ghrelin influences this role has not been directly investigated. In this study, we used a combination of whole-cell electrophysiology, optogenetics and molecular knockdown together with in vivo calcium imaging in mice to investigate the role of vS during feeding behaviour across different states of hunger. We found that activity of a unique subpopulation of vS neurons that project to the nucleus accumbens (vS-NAc) were active specifically when animals approached and investigated food, and that that this activity inhibited the transition to begin eating. Increases in peripheral ghrelin reduced vS-NAc activity during this anticipatory phase of feeding behaviour, by increasing the influence of synaptic inhibition. Furthermore, this effect required postsynaptic GHSR1a expression in vS-NAc neurons, suggesting a direct role of ghrelin signalling. Consistent with this role of hippocampal ghrelin signalling, removal of GHSR1a from vS-NAc neurons impaired ghrelin-induced changes in feeding-related behaviour. Together, these experiments define a ghrelin-sensitive hippocampal circuit that informs the decision to eat based on internal state.
INTRODUCTION
Animals must be able to control feeding behaviour dependent on need. Consuming food when already sated utilises time and energy that could be spent on more essential functions, and such maladaptive behaviour can result in disease and disorders associated with overeating. In contrast, being unable to sense the need for food – i.e. the ‘hunger’ state can result in undereating, and a resultant lack of fitness (Toates, 1981).
In this way, feeding behaviour can be seen as a decision-making process that involves selecting the most optimal action when presented with food given the current internal context (Davidson et al., 2007). A key aspect of this process is the ability to integrate external cues with internal state such as hunger (Benoit et al., 2010; Burnett et al., 2016; Toates, 1981). When viewed in this way, the value of a given food item is ambiguous because the same food, depending on the hunger state, can have different value. In other words the food item would predict a highly rewarding post-ingestive outcome when the animal is hungry, but when sated, the same food item will predict little rewarding outcome (Davidson et al., 2007). From a learning perspective, the decision to eat depends on a specific configuration of cues: the simultaneous presence of external food cues and hunger will drive feeding behaviour, but a food cue alone will not (Gershman, 2017; Rudy and Sutherland, 1995). In this framework, hunger can act as a context upon which sensory cues are interpreted (Azevedo et al., 2019; Davidson and Jarrard, 1993; Davidson et al., 2007; Mohammad et al., 2021).
The hippocampus, and particularly the ventral CA1 / subiculum area (vS) has been repeatedly proposed as a crucial structure for the discriminations of context, most notably in spatial contextual associations (Good and Honey, 1991; Holland and Bouton, 1999; Strange et al., 2014). However, the hippocampus is also heavily involved in hunger sensing, both in humans, and rodents (Azevedo et al., 2019; Davidson and Jarrard, 1993; Davidson et al., 2007; Mohammad et al., 2021). This suggests that in addition to discriminating spatial context to aid learning, the hippocampus may also discriminate other, more abstract contexts such as hunger. Consistent with this idea, hippocampal activity is extremely sensitive to hunger state in both humans (Wallner-Liebmann et al., 2010; Wang et al., 2006) and rodents (Min et al., 2011). For example, neurons represent the same spatial and environmental variables distinctly dependent on hunger state (Carey et al., 2019; Kennedy and Shapiro, 2009). Similarly, inactivation and dysfunction of the hippocampus leads to impaired hunger-based decision making (Hebben et al., 1985; Rozin et al., 1998). Furthermore, in rodents the ability to discriminate learned associations dependent on hunger state depends on the function of the ventral hippocampus (Azevedo et al., 2019; Davidson and Jarrard, 1993; Mohammad et al., 2021).
In keeping with the hippocampus’ role in sensing the hunger state, hippocampal pyramidal neurons express a diverse array of physiologically important receptors, for example, those involved in the signalling axes for stress, hunger and thirst (Lathe, 2001). More specifically to hunger, the hippocampus expresses the receptor for the peripheral hunger hormone ghrelin (GHSR1a) in both rodents (Diano et al., 2006; Hsu et al., 2015, 2017; Mani et al., 2014; Zigman et al., 2006) and non-human primates (Mitchell et al., 2001). Interestingly, peripherally circulating hormones are able to gain access to the hippocampus constitutively (Hamasaki et al., 2020), and there is evidence to support the entry of peripheral ghrelin into the hippocampus through the blood-brain barrier (Banks et al., 2002; Diano et al., 2006), although this notion is controversial (Furness et al., 2011). Additionally, ghrelin is capable of not only inducing structural (Diano et al., 2006) and functional (Diano et al., 2006; Ribeiro et al., 2014) plasticity in hippocampal neurons, but also influencing both hippocampal-dependent and feeding behaviour (Diano et al., 2006; Hsu et al., 2015, 2017; Kanoski et al., 2013). Direct infusion of ghrelin agonists and antagonists into the hippocampus have large effects on the interaction with food related cues, and anticipatory feeding behaviour (Diano et al., 2006; Hsu et al., 2015, 2017; Kanoski et al., 2013), but have no long-term effects on consumption and weight (Hsu et al., 2015; Kanoski et al., 2013). Thus, hippocampal ghrelin signalling appears to be particularly important for anticipatory food-related behaviour, consistent with the putative role of the hippocampus in supporting internal context.
However, while it is clear that motivational state affects hippocampal processing, and that hippocampal dysfunction impairs hunger dependent behaviour, how hippocampal circuitry directly influences internal state dependent feeding behaviour, and the cellular and circuit mechanisms underlying this ability remain unknown. This is compounded by the fact that vS is composed of multiple, non-overlapping and functionally distinct parallel projections to distinct downstream areas(AlSubaie et al., 2021; Cembrowski and Spruston, 2019; Sanchez-Bellot and MacAskill, 2021; Soltesz and Losonczy, 2018; Wee and MacAskill, 2020). For example, neurons in vS that project to the nucleus accumbens (NAc) have been shown to preferentially represent and control motivation and value (AlSubaie et al., 2021; Britt et al., 2012; LeGates et al., 2018; Trouche et al., 2019). Similarly, a separate population of neurons projecting to the lateral hypothalamus (LH) have been shown to be recruited during salient environments and during learning of food associations (Hsu et al., 2015; Jimenez et al., 2018; Mohammad et al., 2021). Both of these populations of neurons are therefore well placed to control anticipatory feeding related behaviour (Hsu et al., 2015; Reed et al., 2018; Yang et al., 2020). While this makes vH ideally placed to powerfully control motivational and hunger-related behaviour, each population has distinct influence on ongoing behaviour (AlSubaie et al., 2021; Britt et al., 2012; Hsu et al., 2015; Jimenez et al., 2018; LeGates et al., 2018; Mohammad et al., 2021; Trouche et al., 2019). Thus, how these populations are uniquely used during feeding behaviour, and how they are influenced by hunger and peripheral ghrelin, remains unknown.
Together, vS is well placed to control anticipatory feeding-related behaviour. It is consistently active during hunger-based decisions, its dysfunction impairs behaviour requiring hunger sensing, and it has ghrelin-sensitive neurons that project to two brain regions both crucially important for defining feeding behaviour. Therefore, in this study we used a combination of quantitative behaviour, in vivo imaging and manipulation, and slice physiology to address the role of vS circuitry in hunger-based decisions.
RESULTS
Peripheral ghrelin administration increases the transition from food investigation to food consumption
We first aimed to understand how the level of peripheral ghrelin influences the decision to eat. We analysed the behaviour of mice after an intraperitoneal (i.p.) injection of either the hunger hormone ghrelin or vehicle control, over a ten-minute period in a well habituated behavioural chamber that contained familiar chow.
Consistent with previous results, ghrelin injections caused a large increase in food consumption in sated mice when compared to injection of PBS (Figure 1A). To understand the structure of moment-to-moment behaviour that gave rise to this increased chow consumption, we analysed rodent feeding behaviour as a concatenation of simple, stereotyped behaviours (Burnett et al., 2019; Halford et al., 1998). These behaviours can be divided into feeding-specific behaviours, such as approach, exploratory sniffing and investigation of food (‘Investigation) and food consumption (‘Eat’), as well as non-feeding-specific behaviours such as ‘Rear’, ‘Groom’ and ‘Rest’ (‘Oth’). These behaviours are easily observable and reproducible, and are equivalent to those defined as part of the behavioural satiety sequence (BSS; (Halford et al., 1998)). By scoring the mouses behaviour over the ten-minute session we confirmed that the effect of ghrelin was due to two distinct changes – an increase in the frequency of eating bouts (Figure 1B), and an increase in the time spent eating per bout. This occurred with only minimal changes in other behaviours (Figure 1B, Supp Fig).
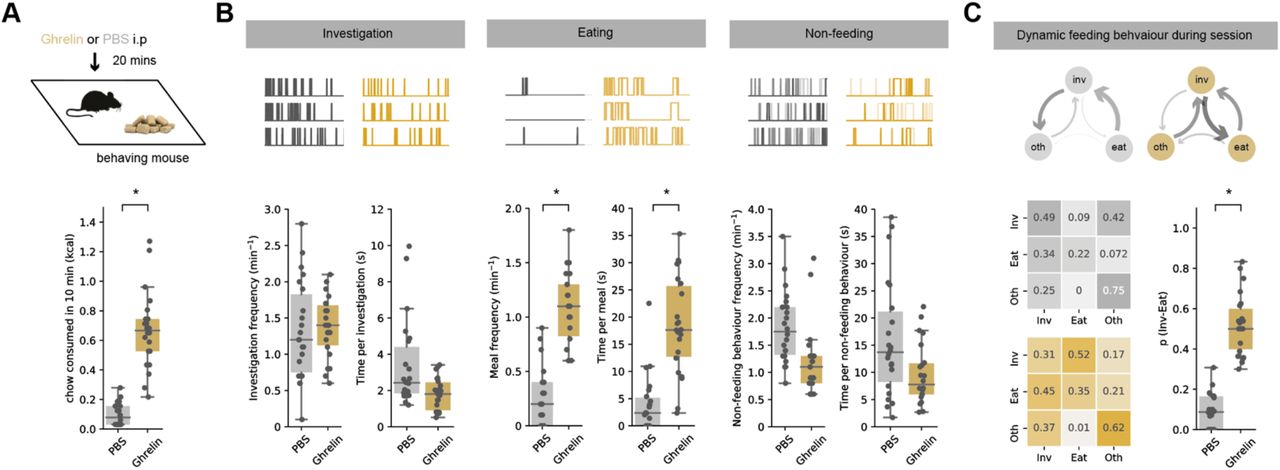
A. Top, schematic of experiment. Mouse was injected with either ghrelin or control PBS before exploring a well habituated chamber containing familiar chow for 10 min. Bottom, ghrelin administration (gold) increases chow consumption compared to PBS control (grey).
B. Analysis of food investigation, eating, and non-feeding behaviours including grooming, quiet resting and rearing. Top shows three examples of mouse behaviour across example ten-minute sessions. Note that overall ghrelin has minimal effect on behaviour apart from large increases both frequency and duration of eating bouts.
C. Markov analysis of feeding behaviour during ten-minute session. Top, state transitions for PBS (grey) and ghrelin (gold) treated mice. Arrow thickness is proportional to the probability of transition. Bottom, left, transition matrix for PBS and ghrelin-treated mice. Each row adds to one, and each matrix represents the probability of the next behavioural state (column) given the current state (row). Note that ghrelin dramatically increases the transition from investigation to eating, with minimal influence on other behavioural transitions. Bottom right, summary of investigation to eat transition probability across all mice in PBS and ghrelin. Note the large increase in p(Inv->Eat) after ghrelin in all mice.
This increase in meal frequency was indicative of altered decision-making dependent on peripheral levels of ghrelin, even in this simple assay. Therefore, we wanted to better understand the behaviour that resulted in this increased initiation of consumption. To do this, we analysed the sequence of behaviours during each ten-minute session as a discrete-time Markov chain - a vector of behavioural states that change as a function of time (Burnett et al., 2019). In this analysis, we used the three scored behvaiours as states to define the Markov chain – investigation, eat, and oth (See Supp Fig for an alternative analysis containing all 5 BSS behaviours that finds equivalent results). In this analysis, a transition matrix Pij fully and compactly defines an animal’s probability of transitioning from behaviour i to behaviour j, i.e. its overall behavioural strategy during the session. We computed the transition matrices for each animal, and compared these matrices across different states of hunger (Figure 1C). This analysis revealed that consistent with our initial analysis above, control mice spent relatively large amounts of time investigating the food pellet, but this investigation was only very rarely followed by a transition to eating. In contrast, in ghrelin treated mice, while the total time spent investigating the food pellet was similar, the transition from this investigation to consumption was dramatically increased. Furthermore, we compared the effect of ghrelin to overnight fasting, which represents a more physiological change in hunger state. This experiment revealed that overnight fasted animals displayed similar transition matrices to ghrelin-treated mice, with a prioritisation of investigation-to-eat transitions. However, overnight fasting also affected other non-feeding related behaviours, and drove animals to prioritise eating at the expense of other non-feeding-related behaviours (Supp Fig). Overall, across all transitions, the effect of ghrelin was remarkably specific, where its effect was to increase the probability of transitioning from investigation to consumption of food p(Inv->eat), with only minimal effect on other behavioural transitions (Figure 1C, Supp Fig).
Together this analysis confirms that mice innately make decisions based on peripheral ghrelin levels. When peripheral ghrelin is high, investigation of food leads to consumption, however when ghrelin is low, this same food cue results in an alternative behavioural choice resulting in no consumption. This analysis is consistent with internal hunger state – as conveyed via ghrelin – acting as a context to define behaviour (Davidson et al., 2007; Gershman, 2017). We next wanted to understand how vH might be involved in supporting this ability.
vS-NAc activity tracks investigation and eating behaviour
We next wanted to understand how vS might be involved in supporting this contribution to hunger-based decisions. We focussed on two of its main output populations – to NAc and LH (Wee and MacAskill, 2020). These parallel, non-overlapping projections are both thought to be crucial for supporting hunger dependent behaviour, and its influence by ghrelin, but their activity during such behaviour has never been investigated. We recorded the activity of these two populations of neurons using intersectional viral expression of GCaMP6f specifically in either NAc-projecting or LH-projecting vS neurons (Figure 2A), and combined this with bulk imaging of calcium-dependent activity using fibre photometry (Figure 2B). We first recorded activity during the ten-minute feeding assay in sated mice, and aligned activity to each behaviour in our Markov analysis (Figure 2C). We noticed that there was a consistent increase in activity of vS-NAc neurons during the investigation of food – where activity gradually increased to a peak at the end of the investigation bout, before rapidly decreasing upon transition to the next behavioural state (Figure 2C, D). In addition, there was a subtle, but consistent drop of vS-NAc activity upon the transition to eating, consistent with previous reports of NAc activity dynamics during feeding behaviour (Reed et al., 2018). Together this suggests that vS-NAc neurons are active during anticipation and investigation of food, and are inhibited upon the commencement of consumption. Interestingly vS-LH neurons did not show any consistent activity that was time locked to behaviour, and instead were much more active in response to salient external stimuli such as the presentation of an object or chow (Figure 2C, D, Supp Fig).

A. Top, schematic of injections allowing intersectional targeting of either vS-NAc or vS-LH neurons for photometry. Bottom example images of neurons in vS in each condition. Note tract left by fibre positioned in above fluorescent neurons in vS. Scale bars = 500 µm, 100 µm zoom.
B. Top, schematic of experiment. Activity of either vS-NAc or vS-LH neurons were recorded while mice explored a familiar arena containing chow. Bottom, example photometry traces from vS-NAc (purple) and vS-LH (green) neurons during the session. Rasters indicate investigation bouts. Scale bar = 1 zF, 2 min.
C. Average activity for vS-NAc (purple) and vS-LH (green) across all mice aligned to end of investigation, and start of eating or non-feeding behaviour during the session. Note large increase in activity ramping to end of investigative bout in vS-NAc neurons. Scale bar = 0.5 zF, 4 s.
D. Summary of activity around each behaviours for vS-NAc (purple) and vS-LH (green) neurons. Note consistent increase in activity around investigation and decrease in activity during eating in vS-NAc neurons, and very little modulation of vS-LH neurons.
E. Schematic of the general linear model (GLM) construction. Calcium activity for each mouse was fit by a weighted sum of each behavioural event, as well as during behavioural transitions, presentation of food and velocity during the session (see Methods).
F. Summary of coefficients of GLM representing the average neural activity during each behaviour. The coefficients are consistent with the behaviour averages in C and D, with an increase in vS-NAc activity during investigation and a decrease during eating
We next confirmed this pattern of activity by implementing a linear model to investigate how each of the behavioural variables predicted activity across the two populations (Figure 2E). Crucially, the linear model allowed us to estimate the average neural activity (represented as coefficient weights) during each of the Investigation, Eat and Oth behaviours, while accounting for potential contamination of the neural activity signal arising from different behaviours occurring in close temporal proximity, salience (i.e. during food presentation) and locomotion (i.e. velocity). Consistent with our previous analysis, this model showed that vS-NAc activity was high around investigation and inhibited around eating, while vS-LH activity was not modulated by BSS behaviours (Figure 2F).
vS-NAc activity during food investigation is inhibited by ghrelin
Our previous results suggested that vS-NAc activity was specifically modulated around feeding associated behaviours. In particular that there was a large anticipatory ramp of activity during investigation of food during the task (Figure 2). As a major effect of ghrelin was to alter the consequences of such investigative behaviour (Figure 1), we next wanted to investigate how this activity was altered by increases in peripheral ghrelin.
We repeated our investigation of vS activity in mice with counterbalanced injections of either ghrelin or PBS (Figure 3A). As before, ghrelin injections markedly increased both total consumption of chow, but also specifically the transition from investigation to eating (Supp Fig). Importantly however, we used our linear model to show that this change in behaviour was accompanied by a substantial inhibition of vS-NAc neurons – such that there was essentially no longer any activity around food investigation (Figure 3B). Interestingly this effect was specific to activity around investigation, as equivalent inhibition of vS-NAc activity upon eating was maintained across both ghrelin- and PBS-treated animals. We reasoned that this might indicate an association between the behavioural effect of ghrelin - increased transitioning from investigation to eating, and the inhibition of vS-NAc neurons. Consistent with this idea, on a session-by-session basis there was a strong correlation between the average activity of vS-NAc neurons during food investigation and both total amount of food consumed, and pInv->Eat (Figure 3B). Interestingly, consistent with a lack of encoding in sated mice, there was no effect of ghrelin on vS-LH neurons, and activity remained invariant across each behaviour (Figure 3C).

A. Left, schematic of injections allowing intersectional targeting of either vS-NAc or vS-LH neurons for photometry. Right, schematic of experiment. Activity of either vS-NAc or vS-LH neurons were recorded while mice explored a familiar arena containing chow.
B. Left, summary of activity around investigation and eating for vS-NAc neurons after injection of either PBS (grey) or ghrelin (gold). Note increase in activity around investigation is not present after ghrelin, while decrease in activity during eating is similar in both conditions. Right, Inverse correlation between vS-NAc activity during investigation and chow consumption (top) and p(Inv->eat) (bottom). Note strong relationship between vS-NAc activity and both measures.
C. As (B) but for vS-LH neurons.
Optogenetically increasing vS-NAc activity blocks ghrelin mediated increases in feeding
Our results so far suggest a model where high levels of eating in the task are associated with inhibition of vS-NAc activity during food investigation. We reasoned that this may indicate a much hypothesised role for vS-NAc neurons in behavioural inhibition (Gray and McNaughton, 2003) – where increased activity of vS-NAc neurons inhibits ongoing behaviour (Reed et al., 2018).
We reasoned that if activity of vS-NAc neurons inhibited the transition from investigation to eating, artificial activation of vS-NAc neurons should block ghrelin-induced increases in feeding. To test this idea, we expressed the excitatory opsin channelrhodopsin2 (ChR2) bilaterally in excitatory neurons in vS, and bilaterally implanted optical fibres in NAc (Figure 4A). This allowed us to activate vS input into NAc with brief pulses of blue light. We then compared mice expressing ChR2 with control mice expressing GFP. We repeated the ten-minute feeding assay in a counterbalanced design where in both cases the mouse was provided with i.p. ghrelin to drive feeding, but on one day the mouse underwent blue light stimulation during the session, while on the alterante day no light was present (Figure 4A).

A. Left, schematic of injections allowing optogenetic activation of vS-NAc neurons for photometry. Right, schematic of experiment. Activity of vS-NAc neurons was manipulated while mice explored a familiar arena containing chow after an injection of ghrelin. For both GFP and ChR2 groups mice underwent the session twice, with 20 Hz light stimulation or no light stimulation in a counterbalanced order
B,C. Analysis of frequency of eating, and duration of each eating bout in GFP (B), and ChR2 (C) mice with or without light stimulation. Note that light has no effect on GFP expressing animals, but markedly reduces frequency of eating. This decrease was essentially complete, and so only one mouse performed any eating behaviour where eating duration could be quantified.
D,E. Markov analysis of feeding behaviour during ten-minute session in GFP (D), and ChR2 (E) mice with or without light stimulation. Left, state transitions for light off and light on sessions. Right, summary of investigation to eat transition across all mice with and without light. Note light has no effect in GFP expressing mice, but results in a dramatic decrease in p(inv->eat) in ChR2 expressing mice.
In control animals, there was no effect of blue light stimulation, and ghrelin resulted in robust feeding behaviour in both light ON and light OFF days (as seen by both high chow consumption, and increase in p(Inv->eat), Figure 4B, D). However, light delivery in ChR2-expressing animals caused an almost complete cessation of eating, and inhibition of the investigation to eat transition (Figure 4C, E). This suggests that activation of vS-NAc neuron can block the transition from investigation to eating, even in the presence of high levels of peripheral ghrelin. This suggests that the effect of ghrelin in vS may be to inhibit the activity of vS-NAc neurons and overcome the block this activity imposes on behaviour.
Increasing peripheral ghrelin increases synaptic inhibition in vS-NAc neurons
Our results so far suggest that ghrelin may influence hippocampal circuitry by inhibiting the activity of vS-NAc neurons during food investigation. We next wanted to look for the cellular underpinnings of this change. We hypothesised that this dramatic decrease in activity may be due to plasticity of inhibitory connectivity. To test this, we injected mice with two colours of retrobeads – one in NAc and one in LH (AlSubaie et al., 2021; Sanchez-Bellot and MacAskill, 2021; Wee and MacAskill, 2020). This allowed us, two weeks later, to inject either PBS or ghrelin i.p and after 20 minutes prepare acute slices where we could visualise and record from NAc and LH-projecting vS neurons in acute slices from the same mice (Figure 5A). In the same experiment, we modulated the hunger state of mice by giving i.p. injections of ghrelin or vehicle and waiting for 20 minutes prior to preparation of acute brain slices.

A. Schematic of retrobead injections allowing whole cell recordings of vS-NAc and vS-LH neurons. Two weeks after injections mice were treated with either ghrelin or PBS control, and acute slices were prepared 20 mins later.
B. Average electrically evoked PSCs at -70 mV (downwards trace – a proxy for excitatory PSCs) and 0 mV (upwards trace – a proxy for inhibitory PSCs) in vS-NAc and vS-LH neurons after PBS (grey) or ghrelin (gold) treatment. Note increase in amplitude of vS-NAc IPSC after ghrelin treatment. Scale bar = 200 pA, 100 ms.
C. Left, summary of PSC amplitude in vS-NAc at -70 mV (top) and 0 mV (bottom). Right, summary of E:I ratio (amplitude at -70 mV / amplitude at 0 mV – a proxy for relative excitatory vs inhibitory drive). Note consistent decrease in E:I ratio after ghrelin, suggesting an increase in relative inhibitory drive.
D. As in (C) but for vS-LH neurons. Note lack of consistent changes across any measures.
E. Example traces containing isolated mIPSCs in vS-NAc and vS-LH neurons after PBS (grey) or ghrelin (gold). Scale bar = 20 pA, 1s.
F. Summary of amplitude (left) and frequency (right) of mIPSCs in vS-NAc neurons. Note consistent increase in mIPSC amplitude after ghrelin, with no change in frequency.
G. As in (F) but for vS-LH neurons. Note lack of consistent changes across any measures.
Following slice preparation, we first compared the relative excitatory and inhibitory synaptic strength onto each projection population by calculating the E:I ratio in response to electrical stimulation of the Schaeffer collateral input (the ratio of the excitatory current at -70 mV divided by the feedforward inhibitory current at 0 mV, Figure 5B). While ghrelin administration had no influence on E:I ratio in vS-LH neurons, we found a large decrease in the E:I ratio of vS-NAc neurons in mice treated with ghrelin compared to controls. This decrease was due to an increase in the relative inhibitory synaptic strength (Figure 5C, D). This demonstrates that inhibitory drive was selectively increased on vS-NAc, as opposed to vS-LH, neurons following peripheral ghrelin administration.
Next, we investigated the mechanism underlying this increase in inhibtion. We recorded miniature inhibitory post synaptic currents (mIPSCs) from both vS-NAc and vS-LH neurons in control and ghrelin treated mice (Figure 5E). Consistent with our results above, we found that ghrelin resulted in a large increase in the amplitude of mIPSCs in vS-NAc neurons, with no change in their frequency (Figure 5F), indicating a postsynaptic mechanism underlying the increase in inhibitory drive.. This was again accompanied by no changes in the properties of mIPSCs recorded in vS-LH neurons (Figure 5G). Together, this suggests that increased peripheral ghrelin increases synaptic inhibition onto vS-NAc neurons, through an increase in the postsynaptic strength of inhibitory synapses.
GHSR1a expression in vS:NAc neurons is required for ghrelin mediated changes in inhibitory synaptic strength
vS neurons express the ghrelin receptor GHSR1a, and peripheral ghrelin is known to cross the blood-brain-barrier and enter the hippocampus. Therefore we wanted to ask if the influence of peripheral ghrelin we observed on vS circuitry was via direct activation of the GHSR1a receptor on the postsynaptic membrane of vS-NAc neurons.
To test this, we used an intersectional viral method to knock down GHSR1a only in vS-NAc neurons using RNA interference (Figure 6A, Supp Fig). We then obtained whole-cell recordings from vS-NAc neurons expressing GHSR1a RNAi, or control neurons that expressed a scrambled control RNAi. We first replicated our previous findings, and found that in control mice, ghrelin administration resulted in a large increase in mIPSC amplitude in vS-NAc neurons (Figure 6B, C). However, in neurons with knockdown of GHSR1a, mIPSCs were insensitive to ghrelin administration (Figure 6B, C). This shows that the changes in inhibitory synaptic connectivity in vS-NAc neurons on administration of peripheral ghrelin require expression of the GHSR1a receptor on the postsynaptic membrane of vS-NAc neurons.

A. Top, schematic of injections allowing intersectional targeting of vS-NAc neurons with either GHSR1a RNAi or scrambled control. Bottom, two weeks after injections mice were treated with either ghrelin or PBS control, and acute slices were prepared for fluorescently identified whole cell recordings 20 mins later.
B. Example traces containing isolated mIPSCs in vS-NAc neurons expressing GHSR1a RNAi or scrambled control, after PBS (grey) or ghrelin (gold). Scale bar = 15 pA, 1 s.
C. Summary of amplitude of mIPSCs in vS-NAc neurons. Note consistent increase in mIPSC amplitude after ghrelin in scrabled control neurons, with no change in GHSR1a RNAi neurons.
vS-NAc GHSR1a expression is required for peripheral ghrelin-mediated increase in the transition from investigation to eating
Our results suggest that GHSR1a is required for peripheral ghrelin to inhibit the activity of vS-NAc neurons around food investigation, and this reduction in vS-NAc activity is necessary for ghrelin-mediated increases in transitioning from food investigation to food consumption.
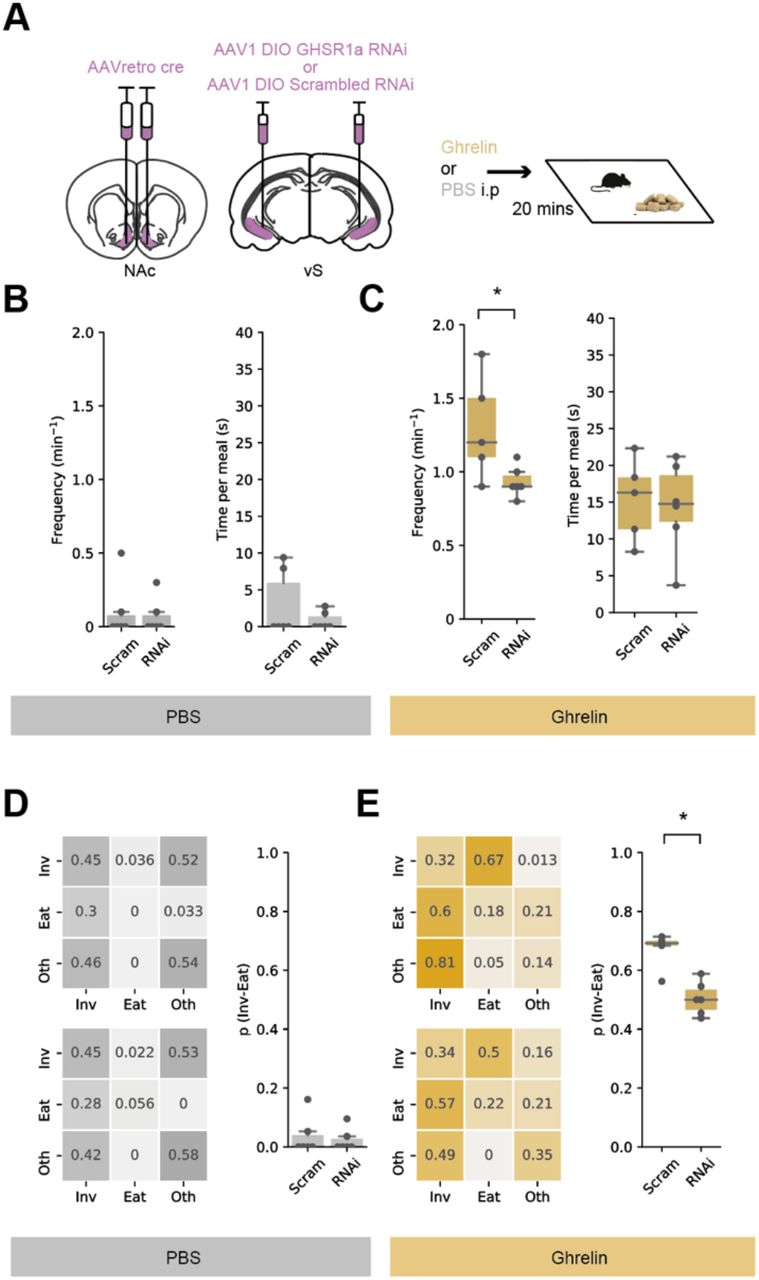
We therefore wanted to investigate the role of vS-NAc GHSR1a in ghrelin induced feeding behaviour. To do this we again intersectionally expressed GHSR1a RNAi bilaterally in vS-NAc neurons, and compared to littermate controls with control RNAi expression (Figure 7A). We then used this approach to investigate the influence of GHSR1a knockdown on feeding in response to peripheral ghrelin.

A. Left, schematic of injections allowing bilateral, intersectional targeting of vS-NAc neurons with either GHSR1a RNAi or scrambled control. Right, schematic of experiment. Mice explored a familiar arena containing chow after an injection of ghrelin or PBS control in a counterbalanced order
B,C. Analysis of frequency of eating, and duration of each eating bout in PBS (B), and ghrelin (C) treated mice with GHSR1a RNAi or control. Note that RNAi mice are equivalent to control mice in PBS conditions. In contrast after ghrelin, RNAi mice show reduced frequency of eating. This decrease was accompanied by no change in eating duration.
D,E. Markov analysis of feeding behaviour during ten-minute session in PBS (D), and ghrelin (E) treated mice with GHSR1a RNAi or control. Left, state transitions for Control (top) and RNAi (bottom). Right, summary of investigation to eat transition across all mice. Note RNAi has no effect on BS treated mice, but results in a decrease in p(inv->eat) in after ghrelin treatment.
We first looked at the effect of GHSR1a knockdown on the frequency and duration of each eating bout. We found no effect of GHSR1a knockout on either feeding metric in PBS treated mice, which consistent with previous experiments had very low frequency and duration (Figure 7B). This suggests that due to a strong floor effect, there is little role for constitutive GHSR1a activity in sated mice (Kern et al., 2015). After ghrelin treatment, control animals consistently increased both frequency of eating bouts and duration of each eating bout (Figure 7C). In contrast, GHSR1a RNAi animals showed a reduced increase in frequency of eating– similar to the effect of artificially activating vS-NAc neurons (Figure 4). Interestingly, and consistent with our analysis so far, this manipulation did not have an effect on the duration of a meal once initiated (Figure 7C) – suggesting that the role of GHSR1a signalling in vH-NAc neurons only influences the anticipation of eating
We next analysed feeding behaviour using Markov analysis, and again saw a consistent and specific impairment of the ghrelin-induced increase in the transition probability from investigation to eating (Figure 7D, E). Notably, while reduction in p(Inv->Eat) was not complete, this may be accounted for by technical issues such as incomplete knockdown (in our hands, our construct was 82% efficient – Supp Fig), and incomplete viral penetration due to the necessary intersectional nature of the expression (Supp Fig).
Overall, we have shown that peripheral ghrelin increases inhibitory synaptic strength onto vS-NAc neurons via a mechanism that requires GHSR1a. This increased inhibition accompanies reduced vS-NAc activity during investigation of food, which promotes the transition from investigation to eating. This mechanism is consistent with a classically described role for the ventral hippocampus in behavioural inhibition (Gray and McNaughton, 2003), and provides a cellular basis of hippocampal resolution of the conditional ambiguity of food cues (Davidson et al., 2007; Gershman, 2017). Moreover, this provides the circuit basis for the direct interaction of cognitive and goal directed brain regions in the control of feeding, and provides a mechanistic locus for the close interaction between diet, health and cognitive ability.
DISCUSSION
In this study we have shown a key circuit mechanism for how peripheral ghrelin dramatically alters feeding behaviour. We observed large increases in vS-NAc activity during investigation of food, and this activity inhibited the transition from food investigation to consumption. Consistent with a key role, we found that increases in peripheral ghrelin act via modulation of this activity through postsynaptic GHSR1a signalling. Through GHSR1a signalling, peripheral ghrelin increases the amplitude of postsynaptic inhibition, reducing vS-NAc activity during food investigation, and thus facilitating an increase in the transition to eating. The identification of a ghrelin-sensitive vS circuit that mediates food-seeking behaviour, provides one of the first mechanistic descriptions of how the hippocampus may sense an internal state like hunger in vivo.
The role of ghrelin in anticipatory versus consummatory behaviour
Our data demonstrate that ghrelin inhibits vS activity specifically during food anticipation, and suggest that it is this inhibition that promotes the transition to eating. On the surface, this goes against classic notions of ghrelin as a ‘hunger hormone’ that mimics fasting by increasing food consumption (Tschöp et al., 2000; Wren et al., 2001). However, this is consistent with several observations suggesting ghrelin mediates food anticipation rather than food consumption. For example, the concentration of circulating ghrelin accurately reflects the anticipation of an upcoming meal (Cummings et al., 2004; Drazen et al., 2006), and studies employing genetic knockouts of GHSR1a show that mice have disrupted anticipatory behaviour preceding a meal (Blum et al., 2009; Kanoski et al., 2013; Verhagen et al., 2011). Furthermore, GHSR1a-null mice have normal body weight (Sun et al., 2008), indicating that ghrelin is dispensable in homeostatic food intake regulation. Importantly, we did observe increases in the duration of each eating bout in ghrelin treated animals, consistent with classic descriptions of ghrelin function (Figure 1). However, only frequency of meal initiation was altered by vS-NAc GHSR1a manipulations (Figure 7C). This dissociation of function suggests that multiple roles of ghrelin may be separated across distinct regions and circuits – while the role of ghrelin in vS seems to be specifically in anticipation of feeding, different effects of ghrelin may be mediated by other brain regions such as hindbrain or hypothalamus (Rossi and Stuber, 2018).
The role of vS in hunger-sensitive goal directed behaviour
It is becoming increasingly understood that the hippocampus not only encodes the relationships between distinct cues in the environment (Eichenbaum, 2017; Rudy and Sutherland, 1995), but also the value of outcomes (Knudsen and Wallis, 2021; Lee et al., 2012). For example, the hippocampal-to-NAc projection has been proposed to be important for the learning of value associations in physical and abstract dimensions (AlSubaie et al., 2021; Duncan et al., 2018; Ito et al., 2008; LeGates et al., 2018; Trouche et al., 2019), and to relay these signals to ventral striatum (Pennartz et al., 2011). This ability is proposed to allow the utilisation of past experience to anticipate the outcome of upcoming behaviour. Consistent with this proposed role, we found that vS-NAc was specifically active around food investigation (Reed et al., 2018), and that this activity ramps up during investigative behaviour, consistent with studies of spatial goal directed navigation (Ciocchi et al., 2015). This activity was anticorrelated with the value of the anticipated outcome (Ciocchi et al., 2015) – when sated, vS-NAc activity was high, and correlated with a low probability of initiating eating (Figure 3). In contrast when peripheral ghrelin was high, this vS-NAc activity was low. Interestingly, this reduction in anticipatory vS-NAc activity during investigation was distinct from a separate decrease in activity upon food consumption that was insensitive to ghrelin (Figure 3) that has been previously described (Reed et al., 2018). Therefore, ghrelin signalling in vS influenced specifically the anticipatory activity leading up to food consumption, not the reduction of activity upon commencement of eating. Together this is in line with a more general role of hippocampus in using contextual cues to anticipate the outcome of upcoming behavioural choices, and to utilise this information to inform decision making (Shadlen and Shohamy, 2016). Our work supports the notion that the hippocampal calculation may also utilise internal state information, such as hunger through ghrelin sensing, in this anticipation.
Mechanisms of ghrelin signalling in vS
Given the tight regulation of substance entry across the blood-brain barrier (BBB), one important question is whether ghrelin and other hormones mediate their effects on vS circuitry by directly binding hippocampal neurons, or are instead signalled indirectly via upstream synaptic inputs that themselves have access to peripheral ghrelin. The hippocampus is situated adjacent to circulating cerebrospinal fluid (CSF) in the ventricles, and has a rich surrounding blood supply from the choroid plexus (Lathe, 2001) that facilitates transfer of molecules across the BBB (Hamasaki et al., 2020), including ghrelin (Banks et al., 2002; Diano et al., 2006). This is consistent with a vast array of peripheral ghrelin mediated structural and functional effects on hippocampal neurons (Diano et al., 2006; Ribeiro et al., 2014), but also the role of ghrelin in influencing behaviour (Diano et al., 2006; Hsu et al., 2015, 2017; Kanoski et al., 2013). Furthermore, the hippocampus more generally expresses functional receptors for a multitude of peptide hormones similar to ghrelin (Lathe, 2001), such as leptin (Irving and Harvey, 2014) and insulin (Soto et al., 2019). This body of work suggests that these circulating hormones are capable of binding to hippocampal neurons to affect their function.
It is important to note however that there is also a separate line of evidence that proposes that peptide hormones like ghrelin, insulin and leptin are unable to cross the BBB (Furness et al., 2011; Kern et al., 2015) without specialised mechanisms (Banks, 2012). While this could be explained by BBB permeability being extremely plastic - for example, accessibility of ghrelin is dependent on the hunger state (Banks et al., 2008; Langlet et al., 2013) – there remains a distinct possibility that direct permeability through the BBB is not the major route for ghrelin to influence vS.
One such line of reasoning proposes that ghrelin does not bind to hippocampal neurons in vivo, and instead its receptor GHSR1a exhibits high constitutive activity at baseline (i.e. without ligand binding) (Petersen et al., 2009). However, this idea is hard to reconcile with past experiments showing that peripheral ghrelin gains access to the hippocampus and influences hippocampal circuit and function (Diano et al., 2006). Furthermore, our GHSR1a knockdown experiments in Figure 5, 6 and 7 showed that there were changes in vS-NAc after peripheral ghrelin administration that was dependent on GHSR1a, suggesting an active role of the receptor beyond constitutive activity. Given these observations, this suggests that there may be a combination of ligand-dependent and ligand-independent activity within the GHSR1a system in hippocampus. A key point of future work will be to understand the distinct roles of these two potential mechanisms. Alternatively, it has been proposed that there may be a source of brain-derived ghrelin, although there is growing consensus that this is unlikely (Cabral et al., 2017; Furness et al., 2011; Sakata et al., 2009).
An additional alternative to direct ghrelin sensing in vS, is that the effect of ghrelin could be mediated by upstream neuromodulatory signalling, such as dopamine D1 receptor signalling in tandem with GHSR1a (Kern et al., 2015). For example, in this scenario ghrelin could indirectly activate ghrelin-sensing LH neurons that then promotes VTA activity (Cone et al., 2014, 2016) to provide a dopaminergic input to hippocampus. Other potential neuromodulators or neuropeptides that could act as co-agonists to ghrelin signalling in vS include acetyl-choline from septal areas (Colgin et al., 2003), serotonin from raphe (Yang et al., 2020) or melanin concentrating hormone from hypothalamus (Noble et al., 2019).
Overall, our study shows that vS-NAc circuitry is sensitive to the level of peripheral ghrelin, and this sensitivity is dependent on postsynaptic expression of the ghrelin receptor GHSR1a. Future work is needed to explore whether ghrelin directly modulates hippocampal activity via BBB permeability and direct binding or indirectly through modulation of upstream synaptic inputs.
Conclusion
In summary, we describe a ghrelin-sensitive hippocampal circuit that shapes feeding decisions. This circuit provides a locus for understanding how internal states and sensory stimuli are integrated into value computations to support anticipatory goal-directed behaviour and how disruption of this process may give rise to disease.
METHODS
Animals
Young adult C57BL/6 male mice (behavioural and anatomical experiments: at least 7 weeks old; whole-cell electrophysiology experiments: 7 – 9 weeks old) provided by Charles River were used for all experiments. All animals were housed in cages of 2 to 4 in a temperature- and humidity-controlled environment with a 12 h light-dark cycle (lights on at 7 am to 7 pm). Food and water were provided ad libitum. All experiments were approved by the UK Home Office as defined by the Animals (Scientific Procedures) Act, and strictly followed University College London ethical guidelines.
Viruses
Stereotaxic surgery
Stereotaxic surgeries were performed according to previously described protocols (Cetin et al., 2006). Mice were anaesthetised with isoflurane (4% induction, 1.5 to 2% maintenance) and secured onto a stereotaxic apparatus (Kopf). A single incision was made along the midline to reveal the skull. AP, ML and DV were measured relative to bregma, and craniotomies were drilled over the injection sites.
Stereotaxic coordinates:
Long-shaft borosilicate pipettes were pulled and backfilled with mineral oil, and viruses were loaded into the pipettes. Viruses were injected with a Nanoject II (Drummond Scientific) at a rate of 13.8 to 27.6 nL every 10 s. Following infusion of the virus, the pipette was left in place for an additional 10 mins before being slowly retracted. For anatomy experiments, following injection of substances into the brain, animals were sutured and recovered for 30 mins on a heat pad. Animals received carprofen as a peri-operative s.c. injection (0.5 mg/kg) and in their drinking water (0.05 mg/mL) for 48 hours post-surgery.
For photometry and optogenetic experiments, fibre cannulae were implanted following virus injection in the same surgery. The skull was roughened and two metal screws were inserted into the skull to aid cement attachment. Photometry cannulas were targeted to ventral CA1/subiculum, optotgenetic cannulas were targeted to NAc shell. Cannulas were secured to the skull by applying two layers of adhesive dental cement (Superbond CB). The skin was attached to the cured dental cement with Vetbond. Animals received a subcutaneous injection of carprofen (∼5 μL of 0.5 mg/mL stock) prior to recovery in a warm chamber for 1 hour and continued receiving carprofen in their drinking water (0.05 mg/mL) for 48 hours post-surgery. Mice were allowed to recover for a minimum of 3 weeks before starting photometry experiments. For projection-specific expression of GCaMP6f, 150 – 200 nL of rAAV2-retro-Syn-Cre (Tervo et al., 2016) was injected into the output site (LH or NAc); in the same surgery, 300 – 400 nL of a 1:3 dilution of AAV1-CAG-Flex-GCaMP6f-WPRE-SV40 in sterile saline was injected into vS. his dilution protocol was used to delay excessive GCaMP expression, which could lead to reduced Ca2+ variance in the signal, affect cellular processes and reduce cell health (Resendez et al., 2016). For combined projection-specific fibre photometry and molecular knockdown experiments, 150 – 200 nL rAAV2-retro-Syn-Cre was injected into NAc, and a 1:1 mix (400 - 500 nL) of AAV1-CAG-Flex-GCaMP6f-WPRE-SV40 and AAV1-EF1a-DIO-mCherry-ghsr-shRNAmir or AAV1-EF1a-DIO-mCherry-scrmb-shRNAmir was injected into vS.
Behaviour
Following at least 3 weeks post-surgical recovery, animals (10 – 12 weeks old) were manually handled for at least 7 days before testing. During the last 3 days of habituation, empty plastic weighing boats and, in a subset of animals, a plastic tube lid and a dollop of peanut butter (Skippy) were provided in the home cage to habituate the animals to these objects. Animals were also habituated to patch cord attachment while placed in the behavioural boxes during the last 3 days of habituation. All behavioural experiments were carried out in MEDPC sound-attenuating chambers containing behavioural boxes (21.59 × 18.08 × 12.7 cm) with blank walls. Video recordings were conducted with infrared cameras positioned above each chamber, and video was acquired at 15 or 25 Hz using Bonsai (Lopes and Monteiro, 2021). The different frame rates were due to a change of PS4 cameras over the course of experiments, and this difference in frame rates did not affect the resolution of capturing naturalistic behaviour given the relatively slower time course of evolving behaviours during feeding. All experiments were performed consistently during the middle-to-end of the light cycle (from 2 pm to 7 pm) to control for circadian rhythm variables.
Mice were habituated over the course of 2 to 3 days with three separate intraperitoneal (i.p.) injections of 100 μL sterile phosphate-buffered saline (PBS) to habituate them to manual scruffing and i.p. injection. Following this, animals were habituated to patch cord attachment for a 10-minute period, as de-scribed above. At the end of this habituation period, animals were given an i.p. injection of either ghrelin (2 mg/kg; Tocris) or vehicle control (phosphate-buffered saline, PBS; pH = 7.2). The order of the injections was counterbalanced across animals. The volume of the i.p. injection was fixed at 100 μL. Animals were allowed 15 mins to recover post-injection before the presentation of non-food and food objects. Animals were then presented with a pellet of chow only or, in a subset of experiments, manually presented with items in the following sequence: a non-food plastic object (universal tube lid), standard lab chow (Envigo), peanut butter and non-food object again for 10 mins each, with 2 mins interval between the end of each presentation and the start of a new presentation. This sequential presentation protocol was used to compare the effect of hunger state on vS activity to non-food object (tube lid) and a high-calorie food item (peanut butter). This sequence of presentations, and more specifically the ordering of chow before peanut butter presentation, was designed to avoid over-sating the animals with peanut butter before chow presentation. The inclusion of a second plastic lid presentation at the end of peanut butter presentation was used to account for the possibility of photobleaching across the session duration. The day of ghrelin injection was selected randomly for each animal, and PBS and ghrelin injection days were spaced apart for a duration of at least 24 hours. After termination of each testing session, the amount of chow or peanut butter consumed during the 10 min presentation was weighed; any spillage of food was recovered and subsequently weighed. The time of food or non-food presentation was noted down and used to manually synchronise the photometry recordings to the start of stimulus presentation. Photometry experiments with apparent failure in equipment or software acquisition were discarded from further analysis. Photometry signals from experiments in which the signal did not exceed >2 standard deviations above a 50-s preceding baseline before food presentation were excluded from subsequent analysis. Data from all animals were included in the final analysis.
Annotation of feeding behaviour
Feeding behaviour was analysed as a composite sequence of five simple, distinct and reproducible behaviours. These elemental behaviours are: Approach (sniffing or tactile interaction with the object or food without eating), Eat (biting food or chewing movements close to food), Rear (standing on hindlegs while elevating head, can be supported on the walls i.e. thigmotaxis), Groom (licking/scratching of fur, limbs or tail, usually high-frequency movement) and Rest (motionless, usually in corner of box). These behaviours together are referred to as the Behavioural Satiety Sequence (BSS, (Halford et al., 1998)). These features were manually scored offline using Ethovision XT13 (Noldus). Where possible, manual scoring was conducted in a blinded fashion to experimental groups. For a subset of videos, two independent scorers conducted manual annotation of the behaviour videos to ensure reproducibility. Manual annotation of BSS behaviours from 10-minute videos spanning the food or non-food object presentation period were con-ducted at 15 or 25 Hz on a frame-by-frame basis. This manual annotation produced vectors of 0s and 1s, where 0 indicates the absence and 1 the presence of the BSS behaviour.
Analysis of feeding behaviour as a stochastic Markov process
Each behavioural dataset exists as a sequence of BSS behaviours. In other words, the behaviour for a given animal is described by a vector of BSS behaviours occurring over time. Although the total time spent engaging in one behaviour can be computed from this vector, additional information regarding an animal’s feeding strategy exists in the sequence of expression of each BSS behaviour (Burnett et al., 2019). To analyse this sequential information in more detail, we analysed the annotated behavioural patterns for each mouse as a stochastic Markov process that defined the animal’s feeding strategy when presented with chow across different states of hunger. Specifically, a Markov chain is a vector of states that change as a function of time. In this case, the Markov chain is comprised of 5 states corresponding to the 5 BSS behaviours. These Markov chains are described fully by a transition matrix P, where the Pij term represents the transition probability from BSS behaviour i to j. As there are 5 BSS behaviours, P is a 5 × 5 transition matrix, where the rows represent the current BSS behaviour, the columns represent the BSS behaviour one-step ahead and the values in each row sums to 1. For display purposes, we constructed simpler, 3 × 3 transition matrices by combining non-feeding behaviours into a single state, and the 5 × 5 matrix analysis is provided in Supp Fig. To compute the empirical transition matrices for each animal, the frequency of each possible transition from behaviour i was calculated and normalised by the total number of behavioural transitions occurring from behaviour i. These transitions are assumed to be Markovian, which simplifies the calculation of the transition probability P(state = j | state = i). Specifically, the probability of transitioning from state i to state j is dependent only on the current state i and not on states preceding state i. For each animal, there were two transition matrices, PPBS and PGhrelin. Importantly, these Markov chain vectors disregarded information relating to duration, i.e. the time spent in engaging in one behaviour and the inter-event duration. In other words, by focusing on transitions between BSS behaviours, this analysis was conducted time-agnostically; this method has been shown to accurately capture moment-to-moment behavioural strategies under differing contexts (Burnett et al., 2019) by focusing on the transition probability from one behavioural bout to the next. For example, the vector [Approach, Approach, Eat, Groom] represents four distinct BSS bouts of variable length within and between bouts, but only the transitions between bouts was analysed. Notably, frame-to-frame transitions were not considered in this analysis.
Analysis of Ca2+ signals from fibre photometry
Measurement of calcium fluorescence signals was carried out as detailed previously (Lerner et al., 2015; Sanchez-Bellot and MacAskill, 2021). 470 nm and 405 nm LEDs were used as excitation sources, and the light amplitudes were modulated sinusoidally at 500 Hz and 210 Hz carrier frequencies, respectively. The excitation light was passed through excitation filters (for 470 nm and for 405 nm wavelengths), and a dichroic mirror to combine the two LEDs into a single beam. A 49/51 beam-splitter was used to split the beam into two independent excitation beams for simultaneous recording of two animals. The excitation light was coupled through a fibre collimation pack-age into a fibre patch cord, and linked to a large core (200 μm), high NA (0.39) implant cannula (Thorlabs). Emitted fluorescence signals were collected through the same fibre. Fluorescence output signal was filtered through a GFP emission filter (transmission above 505 nm) and focused onto a femtowatt photoreceiver. The photoreceiver was sampled at 10 kHz, and each of the two LED signals was independently recovered using quadrature demodulation on a custom-written Labview software: this process involved using an LED channel as a signal reference, taking a 90-degree phase-shifted copy of this reference signal and multiplying these signals in quadrature. The multiplied signal was then low-pass filtered with a Butterworth filter (order = 3, cut-off frequency = 15 Hz). The hypotenuse was then computed using the square root of the sum of squares of the two channels. The result corresponds to the demodulated signal amplitude and was decimated to 500 Hz before storing to disk.
To correct for artefacts resulting from Ca2+-independent processes such as movement, the Ca2+- independent 405 nm isosbestic wavelength signal was scaled to the 470 nm wavelength. The coefficients for the scaling were computed through a least-squares linear regression between the 405 nm and 470 nm signal. This estimated motion (scaled 405 nm) signal was then subtracted from the 470 nm signal to obtain a pure Ca2+-dependent signal.
Calcium activity signals time-locked to the presentation of each item (non-food object, chow, peanut butter) were extracted using the time of presentation manually determined from video recordings. The signal was decimated to 15 Hz, z-score normalised, filtered with a Gaussian filter (σ = 1.5) and baselined to the mean signal in the -50 to -10 seconds preceding the time of presentation of food or non-food object. For event-triggered analysis, the photometry signal was aligned to the onset of each behavioural event obtained from the manually scored behaviour. The behavioural events were clustered into bouts (defined as continuous engagement in the behaviour), and the onset of each bout was taken as the time point to align the photometry signal. A peri-event window of 20 s surrounding the onset of the behaviour was obtained for each signal, and the resulting signal was baselined to the time period from -10 to -7.5 seconds relative to the onset of each event. All trials obtained for an animal were averaged to obtain a nested average event-triggered signal; these signals were then averaged across mice to obtain the population event-triggered average. Due to the stochastic nature of emitting a given behaviour, not all behaviours were present in all animals. Only Approach behaviour of bout length >1 second was considered for analysis, while Eat, Rear, Groom and Rest of all bout lengths were included. Animals displayed Approach behaviour consistently in all internal states of hunger, but the proportion of animals showing Eat, Groom, Rest and Rear behaviours were variable.
Linear encoding model relating behaviour to neural activity
To quantify the contribution of each BSS behaviour to neural activity, a multiple regression model was used. The linear model was constructed using the Python package sklearn, with the z-scored baselined photometry signal as the dependent variable, and a regressor matrix of BSS behavioural arrays as independent variables. The regressor matrix contained 27 regressors in total: 5 behavioural regressors (Approach, Eat, Rear, Groom and Rest), 20 behavioural transition regressors (for example, Approach → Eat), a manual presentation regressor and a velocity regressor. The 5 behavioural regressors were coded as pulses of 0s and 1s, where 1s indicate the engagement in a BSS behaviour and 0s the absence of engagement. The 20 transition regressors were included to account for any possible contribution of behavioural transitions to the photometry signal, and were derived as follows: a Markov chain vector of BSS behaviours was produced at 15 or 25 Hz and any across-BSS transitions (e.g. Approach → Eat, not Approach → Approach) occurring within 5 seconds was emitted as a temporal pulse of 1 at the onset of the next BSS behaviour. To account for temporal distortion of the behavioural transition period in the associated Ca2+ activity, an exponential function was first computed:
 where
where
 where t1/2 is the half-life of the exponential function and set to 2 seconds. The transition regressor was convolved with the exponential function:
 where f(t) is the transition regressor and g(t) is the exponential function. This produces a sharp peak to 1 and a decay rate of t1/2. The exponential decay function was set to have a half-life of 2 s to approximate near-complete decay of the GCaMP6f signal. The presentation regressor was set to an exponential function with a peak time at presentation onset and a decay rate of 5 seconds to capture the salience of stimulus presentation. Finally, the velocity regressor was a continuous variable tracking the instantaneous velocity of the animal derived from position tracking using Ethovision. The velocity signal was smoothed with a rolling mean filter (window = 3 seconds), and missing values from discontinuous position tracking were imputed via linear interpolation.
The final linear encoding model was therefore the following:
 where Y is the dFz in one animal, β0 is the intercept (bias), ε is a Gaussian noise term, NB and NTr are the numbers of the behavioural and transition regressors (5 and 20, respectively), βB, βTr, βP and βV are the beta weights for the behavioural, transition, presentation and velocity regressors, respectively. Specifically, the beta weights βB can be interpreted as the isolated, average neural response to engagement in that BSS behaviour. The crucial aspect of the linear encoding model is the simultaneous inclusion of possible confounding variables, for example, behavioural transitions and velocity, which may each contaminate the neural response. The linear model thus statistically disambiguates the neural response to BSS behaviour engagement from other events in close temporal proximity.
The linear model was fit using ridge regression, a version of the ordinary least-squares regression that penalises the size of the estimated β coefficients by L2 regularisation. This ensures that the β weights were constrained to avoid overfitting, and the penalty term α adjusts the degree of shrinkage of the β weights. Prior to fitting, the dataset was split into an 80% training set to estimate the β weights and 20% test set for evaluating the model predictions. On this training dataset, a nested cross-validation procedure was used: first, the training dataset was split into 5 folds for evaluation. For each fold, the α hyperparameter was tuned using leave-one-out cross-validation (GCV). GCV works analogously to a grid search by exploring the alpha parameter space, and selecting the α value that maximises the prediction accuracy of the model; the values of α tested were 10−3, 10−2, 10−1, 100 and 101, using the function RidgeCV on Python’s sklearn package. The values of α used in the linear models did not differ significantly between the Fed and Fasted states or the PBS and Ghrelin conditions. The photometry signal was resampled to 15 or 25 Hz to match the sampling rate of the predictor matrix, and the predictor matrix was normalised by subtracting the predictor matrix by its mean and dividing by the L2 norm of the matrix, using the function RidgeCV. The β weights were computed analytically using the following formula:
 where X is the predictor matrix, α is the ridge penalty term, I is the identity matrix and Y is the observed dFz. Once fitted, the performance of the linear encoding model was assessed by using the independent test set to compute the explained variance (5-fold, cross-validated R2) value, or the coefficient of determination, defined as:
 where u is residual sum of squares, v is the total sum of squares, yi is the photometry signal at index i, y^ is the predicted photometry signal at index i and y is the mean amplitude of the photometry signal in the test set. Linear models were estimated separately for data from individual animals.
Electrophysiology
Slice preparation
Hippocampal recordings were studied in acute transverse slices. Mice were anaesthetized with a lethal dose of ketamine and xylazine, and perfused intracardially with ice-cold external solution containing (in mM): 190 sucrose, 25 glucose, 10 NaCl, 25 NaHCO3, 1.2 NaH2PO4, 2.5 KCl, 1 Na+ ascorbate, 2 Na+ pyruvate, 7 MgCl2 and 0.5 CaCl2, bubbled with 95% O2 and 5% CO2. Slices (400 μm thick) were cut in this solution and then transferred to artificial cerebrospinal fluid (aCSF) containing (in mM): 125 NaCl, 22.5 glucose, 25 NaHCO3, 1.25 NaH2PO4, 2.5 KCl, 1 Na+ ascorbate, 3 Na+ pyruvate, 1 MgCl2 and 2 CaCl2, bubbled with 95% O2 and 5% CO2. After 30 min at 35 °C, slices were stored for 30 min at 24 °C. All experiments were conducted at room temperature (22–24 °C). All chemicals were from Sigma, Hello Bio or Tocris.
Whole-cell recordings were performed on retrogradely labelled hippocampal pyramidal neurons with retrobeads visualised by their fluorescent cell bodies and targeted with Dodt contrast microscopy. For sequential paired recordings, neighbouring neurons were identified using a 40x objective at the same depth into the slice. The recording order of neuron pairs was alternated to avoid complications due to rundown. Borosilicate recording pipettes (3 – 5 M) were filled with different internal solutions depending on the experiment. For electrical stimulation experiments a Cs-gluconate based internal was used containing (in mM): 135 Gluconic acid, 10 HEPES, 7 KCl, 10 Na-phosphocreatine, 4 MgATP, 0.4 NaGTP, 10 TEA and 2 QX-314. Excitatory and inhibitory currents were electrically isolated by setting the holding potential at -70 mV (excitation) and 0 mV (inhibition) and recording in the presence of APV (50 μM). Alternatively, to record inhibitory miniature currents at -70 mV we used a high chloride internal (in mM): 135 CsCl, 10 HEPES, 7 KCl, 10 Na-phosphocreatine, 10 EGTA, 4 MgATP, 0.3 NaGTP, 10 TEA and 2 QX-314 in the presence of APV (50 μM), NBQX (10 μM) and TTX (1 μM) to block synaptic excitation and spontaneous IPSCs. Recordings were made using a Multiclamp 700B amplifier, with electrical signals filtered at 4 kHz and sampled at 10 kHz.
Statistical analyses
All statistics were calculated using the Python packages scipy, pingouin and statsmodels. Summary data are reported throughout the figures as boxplots, which show the median, 75th and 95th percentile as bar, box and whiskers respectively. Individual data points are also superimposed to aid visualisation of variance. Example physiology and imaging traces are represented as the mean +/- s.e.m across experiments. For the majority of analyses presented, normality of data distributions was determined by visual inspection of the data points. All data were analysed using statistical tests described in the statistical summary. Correction for multiple comparisons was conducted using the Benjamini-Hochberg method, unless otherwise stated. The alpha level was defined as 0.05. No power analysis was run to determine sample size a priori. The sample sizes chosen are similar to those used in previous publications. Throughout the figures and text, the * symbol represents p < 0.05, unless otherwise stated, and n.s. stands for not significant. Animals were randomly assigned to a virus cohort (e.g. ChR2 versus GFP), and where possible the experimenter was blinded to each mouse’s virus assignment when the experiment was performed. This was sometimes not possible due to e.g. the presence of the injection site in the recorded slice.
ACKNOWLEDGEMENTS
We thank members of the MacAskill laboratory for helpful comments on the manuscript. A.F.M. was supported by a Sir Henry Dale Fellowship jointly funded by the Wellcome Trust and the Royal Society (grant number 109360/Z/15/Z) and by a UCL Excellence Fellowship. R.W.S.W. was supported by a UCL Graduate Research Scholarship and a UCL Overseas Research Scholarship. K.M. was supported by the Wellcome Trust 4-year PhD in Neuroscience at UCL (grant number 215165/Z/18/Z).


