

Abstract
Accurate delivery of cargo over long distances through axonal transport requires precise spatiotemporal regulation. Here we discover that Zn2+, either released from lysosomes through TRPML1 or influx via depolarization, inhibits axonal transport. Zn2+-mediated inhibition is neither selective for cargo nor for cell type because elevated Zn2+ (IC50 ≈ 5 nM) reduces both lysosomal and mitochondrial motility in primary rat hippocampal neurons and HeLa cells. We further reveal that Zn2+ directly binds to microtubules and inhibits movement of kinesin motors. Loss of TRPML1 function, which causes Mucolipidosis Type IV (MLIV) disease, impairs lysosomal Zn2+ release, disrupts Zn2+-mediated regulation of axonal transport, and increases overall organellar motility. In addition, MLIV patient mutations in TRPML1 have decreased Zn2+ permeability, which parallels disease severity. Our results reveal that Zn2+ acts as a critical signal to locally pause axonal transport by directly blocking the progression of motor proteins on microtubules.
Significance Statement Disruptions in proper axonal transport have been linked to neurodevelopmental and neurodegenerative diseases. Here we discover that activation of the lysosomal channel TRPML1 arrests lysosomal trafficking. Such lysosome self-regulation mechanism is mediated via TRPML1-mediated Zn2+, not Ca2+. We further reveal that Zn2+ acts as a critical brake signal to pause axonal transport locally by directly decorating microtubules and blocking the movement of motor proteins. Dysfunction of TRPML1, the genetic cause of Mucolipidosis type IV (MLIV), blocks lysosomal Zn2+ release, causing loss of fine-tuning of lysosomal motility. Overall, this study implicates the importance of Zn2+ signals and axonal transport in the pathology of MLIV and reveals new signaling roles for Zn2+ in regulating cell processes involved with microtubule-based transport.
Introduction
The levels of free, labile zinc (referred to herein as Zn2+) are held constant by abundant transporters and buffering proteins under most physiological conditions. However, changes in cytoplasmic Zn2+ levels have been recorded in neurons [1–3], pancreatic beta cells [4, 5], and immune cells [6, 7] in response to various stimuli. Increases in cytoplasmic Zn2+ concentrations can occur as a result of influx from the extracellular milieu through several channels historically defined as Ca2+ channels such as N-methyl-D-aspartate (NMDA) receptor channels, L-type voltage gated Ca2+ channels (reviewed [8, 9]), and TRPA1 channels [10]. Alternatively, Zn2+ can be released from intracellular stores via the transient receptor potential mucolipin 1 (TRPML1) channel [2, 11]. Increases in cytoplasmic Zn2+ concentrations have been shown to have long-term transcriptional effects in neurons [1] by activating Zn2+-sensitive transcription factors such as metal-response element-binding transcription factor-1 (MTF-1) [12]. Bioinformatic studies have suggested that Zn2+ can bind a vast number of human proteins [13, 14], and several in vitro studies have shown that Zn2+ can regulate the enzymatic activity of caspases [15] and tyrosine phosphatases [16, 17]. Additionally, electrophysiological studies have identified Zn2+-mediated gating of ion channels, such as the NMDA [18] and AMPA receptors [19], TRPA1 channels [10], and several others (reviewed [20]). All these lines of evidence suggest that Zn2+ may act as an intracellular signaling molecule, but it has yet to be determined whether changes in cytoplasmic Zn2+ can rapidly elicit downstream effects at timescales comparable to Ca2+ signaling events. Moreover, how and whether Zn2+ might directly affect neurophysiological processes is poorly understood.
TRPML1 is thus far the only known ion channel that can convey Zn2+ from intracellular lysosomal vesicles to the cytoplasm. Loss-of-function mutations in TRPML1 are the sole genetic cause of Mucolipidosis type IV (MLIV), a debilitating lysosomal storage disease that leads to developmental neuropathies and neurodegeneration [21]. Magnetic resonance imaging (MRI) of MLIV patient brains identified the corpus callosum as one of the most impaired regions, which is comprised of millions of axons connecting cerebral cortical neurons between each hemisphere of the brain [22, 23]. In addition, the descending corticospinal tracts are compromised in MLIV patients [24] and axonal spheroids were found in the MLIV mouse models [25], indicating that TRPML1 function is essential for axon health. However, the roles of TRPML1 in axonal function have not yet been determined. TRPML1 is a nonselective cation channel permeable to both Ca2+ and Zn2+ [2, 26, 27]. Consistent with a role for TRMPL1 in Zn2+ transport, MLIV patient fibroblasts and TRPML1-deficient cells both accumulate Zn2+ within their lysosomal lumens [28]. Our previous studies found that agonist-mediated stimulation of TRPML1 in neurons leads to a greater release of Zn2+ in neurites than in the soma, which contrasts with the larger TRPML1-mediated Ca2+ signal release in the soma versus the neurites, suggesting that Zn2+ may play an important role in neurites [2].
Although microtubule-based trafficking is required in almost all eukaryotic cell types throughout the evolutionary spectrum, it is especially notable in neurons, which have axonal and dendritic projections that extend up to ~1 meter in humans. Disruption of microtubule-based transport, which is achieved by the retrograde and anterograde motors dynein and kinesin, respectively (reviewed [29]), can lead to a variety of neurological diseases, including the malformations in cortical development (MCD) family of diseases, and spinal muscular atrophy [30]. Thus, the precise spatiotemporal control of cargo transport is of utmost importance for the establishment and maintenance of cellular, tissue, and organismal health. Dynein and kinesin achieve these functions by walking along a vast network of microtubule filaments that permeate the cellular interior, notably within axons. These motor proteins, their cargo-binding adaptor proteins, as well as the microtubules themselves provide numerous targets for regulation that help the cell accomplish appropriate transport. However, it remains an open question whether and how cellular ions, and the channels that convey them, can affect these processes.
In this manuscript, we reveal a lysosomal self-regulation mechanism in which lysosomal transport is arrested by TRPML1 activation in primary cultured hippocampal neurons. We find that this inhibition is specifically triggered by Zn2+ because high Zn2+ influx during neuron depolarization also leads to rapid attenuation of retrograde and anterograde axonal transport of lysosomes and mitochondria in neurons, while Ca2+ influx slightly increases anterograde axonal transport of lysosomes. Furthermore, we reveal that physiological levels of Zn2+ directly inhibit motility of kinesin via a cargo-adaptor independent mechanism by interacting with microtubules. Further, MLIV disease severity correlates with Zn2+ permeability of TRPML1 patient mutants. TRPML1 dysfunction, and subsequent loss of local Zn2+ signals, leads to the disruption of regulated axonal trafficking, which might contribute to the pathology of MLIV. From a broader perspective, this study corroborates a long-speculated signaling role of intracellular Zn2+ with the discovery that Zn2+ can directly regulate microtubule-based organellar trafficking, which is essential and required for diverse cellular processes.
Results
Activation of TRPML1 inhibits axonal lysosome motility
Given that mutations in TRPML1 are the sole genetic driver of MLIV, this ion channel has been the focus of extensive research that revealed its roles in autophagy [31, 32], Ca2+ signaling [33, 34], and lysosomal tubulation and positioning [35]. However, the exact roles of TRPML1 in regulating neuronal function are not entirely clear. Since thinning of the corpus callosum, abnormal white matter and severe axonal damage are the pathological characteristics of MLIV patient brains [23, 24, 36], TRPML1 might play vital roles in axonal function. Therefore, we sought to determine whether TRPML1 activation could affect axonal trafficking of lysosomes, a critical process that supports neuronal health.
To this end, primary cultured hippocampal neurons were transfected with EGFP-TRPML1 and LAMP1-mCherry. After establishing a baseline for axonal transport within the axons from these neurons, the cells were treated with 50 µM ML-SA1, a synthetic agonist of TRPML1 that exhibits comparable potency to the endogenous TRPML1 agonist phosphatidylinositol-3,5-bisphosphate (PI(3,5)P2) [37]. We quantitated axonal transport in these cells by generating kymographs from time-lapse micrographs, and analyzed them using KymoButler [38], a deep-learning kymograph analysis software. Strikingly, lysosomal motility gradually slowed to near complete inhibition within 5 minutes of addition of ML-SA1 (Figure 1A, Video S1). The inhibition of motility was evident by two metrics: (1) there was a significant reduction in the retrograde speed of tracked LAMP1-positive puncta (Figure 1C & D); and (2) the proportion of stationary lysosomes significantly increased while the proportions of both retrograde and anterograde lysosomes significantly decreased (Figure 1E & F).

Analysis of lysosomal motility in primary cultured rat hippocampal neurons expressing LAMP1-mCherry and either TRPML1WT or TRPML1DDKK. Representative kymographs (left) and measured tracks (identified using KymoButler [38], right) of LAMP1-mCherry motility along an axon treated at 5 minutes with 50 µM ML-SA1 (arrowhead) for TRPML1WT (A) and TRPML1DDKK (B). (C) Time trace of mean instantaneous speed (±SEM) of tracked lysosomes in neurons expressing TRPML1WT (blue) or TRPML1DDKK (purple) treated as in (A) and (B). (D) Mean speed of retrograde- and anterograde-moving lysosomes in neurons expressing TRPML1WT (blue) or TRPML1DDKK (purple) prior (“baseline”, dots; 0 to 300 sec) and subsequent to addition of ML-SA1 (open markers; 300 to 600 sec). Two-tailed paired t-tests (WT, n = 6 axons from 5 independent experiments; DDKK, n = 9 axons from 6 independent experiments). (E) Time trace of instantaneous directional proportion of tracked lysosomes that are stationary (magenta), moving retrograde (blue), or moving anterograde (green), in neurons expressing TRPML1WT (solid lines) or TRPML1DDKK (dotted lines) for baseline and ML-SA1 treatment. (F-G) Mean proportion of lysosomes moving in the indicated directions prior to addition of drug (“baseline”, dots) or subsequent to its addition (open markers) for neurons expressing (F) TRPML1WT (G) TRPML1DDKK (WT, n = 6 axons from 5 independent experiments; DDKK, n = 9 axons from 6 independent experiments). Two-tailed paired t-tests. All experiments were performed in the absence of extracellular Ca2+. *** p < 0.001, ** p < 0.01, * p < 0.05, n.s. not significant.
To determine whether TRPML1-mediated ion release was indeed responsible for the observed reduction in axonal lysosome motility, we repeated this experiment in neurons transfected with a pore-dead TRPML1 mutant (D471K D472K; TRPML1DDKK) [37]. Upon agonist addition, there was no obvious inhibition of axonal motility (Figure 1B, Video S2). Unlike the pore-functional TRPML1 (TRPML1WT), there was no significant decrease in the retrograde velocity of tracked lysosomes upon ML-SA1 treatment (Figure 1C & D), nor any significant increase in the proportion of stationary lysosomes or decrease in the proportion of retrograde or anterograde lysosomes (Figure 1E & G).
To control for any potential effects on motility due to phototoxicity (due to laser exposure) or temperature changes during agonist addition (due to briefly removing the lid of the 37 °C environmental chamber), we assessed the effects of adding carrier alone (DMSO) to either TRPML1WT or TRPML1DDKK-expressing cells (Figure S1). DMSO caused no significant change in lysosomal velocity (Figure S1C & D), no change in the proportion of lysosomal direction for TRPML1DDKK-expressing cells (Figure S1E & G) and only a small change in the proportion of retrograde and stationary lysosomes for TRPML1WT-expressing cells (Figure S1E & F). Taken together, these results indicate that activation of TRPML1 leads to a robust and rapid decrease in axonal lysosome transport.
Zn2+-containing lysosomes autoinhibit their motility through activation of TRPML1
We have previously utilized a genetically encoded sensor GZnP3 to show that TRPML1 is permeable to Zn2+. In the cytosol, GZnP3 can sensitively detect Zn2+ released through TRPML1 from the lysosomal lumen, specifically in neurons [2]. In addition, TRPML1-mediated Zn2+ release is higher in neurites as compared to the soma [2] (Figure 2A). To provide additional evidence to demonstrate that TRPML1 mediates Zn2+ release from lysosomes, we used a recently-developed, rhodamine-based lumenal Zn2+ sensor, ZIGIR [39]. The ZIGIR-dyed compartments colocalized strongly with LAMP1-EGFP, GFP-Rab7a (a late endosomal marker), and EGFP-TRPML1 as determined by an intensity correlation quotient, as defined previously [40] (Li’s ICQ, Figure 2C). Although Zn2+ has been suggested to accumulate in synaptic vesicles [41], we found that ZIGIR had significantly less colocalization with synaptophysin-EGFP (“syn-EGFP”, a synaptic vesicle marker), than all the other endolysosomal markers tested (Figure 2C). Though ZIGIR was originally used to stain insulin granules in pancreatic beta cells, however, we find that it possesses high selectivity for high-Zn2+ containing lysosomes in primary hippocampal neurons (Figure 2C). Upon treatment with 50 µM ML-SA1, the fluorescence of the ZIGIR dye decreased (Figure 2B), confirming that Zn2+ is released from the lysosomes through TRPML1 channel. Further treatment with 100 µM TPEN only slightly reduced the fluorescent signal to the minimum, apo-state of the sensor (Figure 2B). This suggests that there was a near-total depletion of lysosomal Zn2+ upon TRPML1 activation, though ZIGIR fluorescence was still observable after ML-SA1 treatment.

(A) Average traces (±SEM) from soma (blue) or neurites (purple) of primary rat hippocampal neurons co-expressing mCherry-TRPML1 and cytosolic GZnP3, treated with 50 µM ML-SA1 at 0 sec and 100 µM TPEN at 300 sec (n = 3 soma regions, 16 neurite regions, from 3 neurons). (B) Average traces (±SEM) of primary rat hippocampal neurons expressing EGFP-TRPML1 and stained with ZIGIR, treated as in (A). (C) Mean Li’s ICQ values (±SEM) ZIGIR colocalization with EGFP-TRPML1 (yellow, n = 26 neurons), LAMP1-EGFP (green, n = 28 neurons), GFP-Rab7a (turquoise, n = 31 neurons), or synaptophysin-EGFP (“syn-EGFP”; blue, n = 21 axon terminals). One-way ANOVA with post-hoc Tukey HSD. Unlabeled comparisons are not significantly different. (D) Representative kymographs of EGFP-TRPML1 (green, left) and ZIGIR (magenta, center) motility along an axon treated at 5 minutes with 50 µM ML-SA1, in primary hippocampal neurons expressing EGFP-TRPML1 and stained with ZIGIR. Combined channel kymographs overlaid on the right. (E-G) Motility analysis of manually traced ZIGIR(+) TRPML1 puncta. Mean retrograde and anterograde (E) track speed (±SEM) and (F) proportion of time (±SEM) spent moving in each direction, prior (“baseline”; 0 to 300 sec; n = 75 tracked puncta) and subsequent to addition of 50 µM ML-SA1 (300 to 600 sec; n = 52 tracked puncta). Student’s two-tailed unpaired t-tests. (G) Number of puncta tracked per axon during baseline or ML-SA1 treatment. (H-K) Motility analysis of KymoButler-tracked EGFP-TRPML1puncta. (H) Time trace of mean instantaneous speed (±SEM) of tracked EGFP-TRPML1. (I) Mean speed of retrograde-(blue) and anterograde-moving (green) EGFP-TRPML1 puncta prior (“baseline”, dots; 0 to 300 sec) and subsequent to addition of 50 µM ML-SA1 (open markers; 300 to 600 sec). Two-tailed paired t-tests. (J) Time trace of instantaneous directional proportion of tracked EGFP-TRPML1 puncta that are stationary (magenta), moving retrograde (blue), or moving anterograde (green). (K) Mean proportion of EGFP-TRPML1 puncta moving in the indicated directions prior to addition of drug (“baseline”, dots) or subsequent to its addition (open markers). Two-tailed paired t-tests. Data (E-K) from 10 axon segments from 7 individual experimental replicates. All experiments were performed in the absence of extracellular Ca2+. **** p < 0.0001, *** p < 0.001, ** p < 0.01, n.s. not significant.
After establishing that ZIGIR is an effective dye to detect intralumenal lysosomal Zn2+ in neurons, we wanted to simultaneously observe the axonal motility and Zn2+ content of lysosomes in primary hippocampal neurons. To this end, we transfected neurons with EGFP-TRPML1, then stained them with ZIGIR. Our goal was to observe the motility of lysosomes that had high Zn2+ and also possessed TRPML1 channels. Due to the lower number of ZIGIR-positive puncta, and limitations of the KymoButler program, we manually traced these puncta and analyzed their motility using Kymolyzer [42]. Upon treatment with 50 µM ML-SA1, there was a clear decrease in the motility of TRPML1-positive, ZIGIR-dyed (TRPML1+ZIGIR(+)) lysosomes (Figure 2D). There was a significant decrease in both the speed and proportion of retrograde-moving lysosomes, while anterograde movement seemed to be unaffected (Figure 2E & F). In addition, there were significantly fewer TRPML1+ZIGIR(+) puncta after ML-SA1 treatment, as compared to baseline (Figure 2G). Although ML-SA1 treatment resulted in an overall reduction in the motility of EGFP-TRPML1-marked vesicles (Figure 2D), lysosomes that were not strongly stained with ZIGIR seemed to experience less inhibition upon TRPML1 activation (Figure 2D), though the overall speed of TRPML1-positive puncta decreased (Figure 2H). The ZIGIR fluorescence of TRPML1-positive puncta was not correlated with instantaneous speeds during baseline (Figure S2), suggesting that staining itself does not affect lysosomal motility. Finally, the retrograde transport of EGFP-TRPML1-marked vesicles had a larger decrease in speed and proportion of motility, as compared to anterograde motility (Figure 2H–K), similar to what was observed with LAMP1-mCherry (Figure 1C–F).
Zn2+, not Ca2+, arrests organellar transport
Activation of TRPML1 releases both Ca2+ and Zn2+ in neurons [2], though TRPML1-mediated Ca2+ signals have been the center of focus for non-neuronal studies into the effect of TRPML1 on lysosomal function [31, 32, 35, 43]. We next sought to determine how elevated cytoplasmic Zn2+ or Ca2+ affects lysosomal motility. To this end, we increased intracellular Zn2+ or Ca2+ concentrations in neurons expressing LAMP1-mCherry by triggering the opening of voltage-gated Ca2+ channels to allow extracellular Zn2+ or Ca2+ influx [44, 45], and recorded lysosome motility through KymoButler-generated analysis. Membrane depolarization with 50 mM KCl in the presence of 100 µM ZnCl2 led to a significant decrease in the motility of lysosomes marked by LAMP1-mCherry (Figure 3A–E, Video S3). Upon treatment with 100 µM of the Zn2+ chelator TPEN (N,N,N′,N′-tetrakis(2-pyridinylmethyl)-1,2-ethanediamine), motility immediately recovered to near-baseline levels. Interestingly, although both retrograde and anterograde lysosomal motility (speed and proportion) was rescued to baseline levels upon addition of TPEN, anterograde motility was slower to recover. Conversely, we then induced neuron depolarization with 50 mM KCl and 2 mM extracellular CaCl2. Amazingly, there was no significant reduction in lysosome motility, and rather, there was a decrease in the proportion of stationary lysosomes and an increase in the velocity and proportion of anterograde-moving lysosomes (Figure 3F–I, Video S4). Washout and return to Ca2+-free media conditions returned the motility profile of the lysosomes to baseline levels, in both velocity and proportion of stationary, anterograde, and retrograde-moving lysosomes. To our knowledge, this is the first evidence that depolarization induced Ca2+ influx can modulate anterograde flux of lysosomes along axons. Together, this data strengthen our hypothesis that the inhibition lysosomal transport upon TRPML1 activation is a Zn2+-dependent phenomenon.

(A) Representative kymographs (left) and measured tracks (identified using KymoButler; right) of LAMP1-mCherry motility along axons from primary cultured rat hippocampal neurons prior to (“baseline”; top) or after initiation of Zn2+ influx induced by 50 mM KCl depolarization (middle), and then following washout and addition of 100 µM TPEN (bottom). (B) Mean instantaneous speed (±s.e.m.) of lysosomes moving retrograde (blue) or anterograde (green) across baseline, Zn2+ influx by 50 mM KCl depolarization, and TPEN treatment (60-second binned, representing 10 axons). (C) Mean speed (±SEM) of lysosomes moving in the indicated directions for each condition (n = 10 axons from 6 independent replicates). Least-squares regression with post-hoc Tukey HSD. (D) Proportions of lysosomes moving in the indicated directions across baseline, depolarization, and TPEN treatment (60-second binned, representing 10 axons). (E) Mean proportions of lysosomal motility for each condition. (F) Mean instantaneous speed (± SEM) of lysosomes moving retrograde (blue) or anterograde (green) across baseline, 2 mM Ca2+ influx by 50 mM KCl depolarization, and washout (60-second binned, representing 10 axons). (G) Mean speed (±SEM) of lysosomes moving in the indicated directions for each condition (n = 10 axons from 6 independent replicates). Least-squares regression with post-hoc Tukey HSD. (H) Proportions of lysosomes moving in the indicated directions across baseline, 2 mM Ca2+ with 50 mM KCl, and washout (60-second binned, representing 10 axons). (I) Mean proportions of lysosomal motility for each condition.**** p < 0.0001, *** p < 0.001, ** p < 0.01, * p < 0.05, n.s. not significant.
We also observed that Zn2+ influx significantly decreased the motility of mitochondria marked by mito-mCherry (Figure S3A–E, Video S5), a phenomenon which has been previously reported [46]. Upon TPEN addition, we once again observed a fast rescue of retrograde mitochondrial transport, but slower recovery of anterograde transport. In addition, the recovered motility with TPEN treatment could be completely inhibited again by treating the cells with 100 µM ZnCl2 and 2.5 µM pyrithione (a Zn2+ ionophore), indicating a highly reversible mechanism of inhibition for both mitochondria and lysosomes (Figure S3A–H).
These results not only suggest that neuronal excitation-coupled Zn2+ influx can impede axonal transport, but also demonstrate that cellular Zn2+ can act as a reversible brake on the axonal transport of both lysosomes and mitochondria, implicating a universal role of Zn2+, that is distinct from the role of Ca2+, in regulating microtubule-based trafficking.
Zn2+ inhibits organellar motility with a nanomolar IC50 in HeLa cells
We wondered whether Zn2+ could also arrest microtubule-based trafficking in non-neuronal cell types. Consistent with our hypothesis of a ubiquitous role for Zn2+ in affecting transport, we found that inhibition of organellar motility could also be initiated in HeLa cells upon addition of 20 µM ZnCl2 and 1.25 μM pyrithione (Figure S4). As with neurons, the motility of lysosomes and mitochondria could be rescued by Zn2+ chelation with 100 µM TPEN (Figure S4, Video S6). Copper can sometimes act as a competitor for certain Zn2+ binding sites on proteins [47], so we wanted to explore whether copper could induce the same inhibition of motility. Surprisingly, we found no inhibition of lysosomal motility in HeLa cells upon addition of 20 µM CuCl2 and 2.5 µM pyrithione (Figure S5). Given that this seemed to be a Zn2+-specific mechanism of inhibition, we then sought to determine the cytoplasmic concentration of Zn2+ that is necessary to inhibit motility. To this end, we simultaneously quantitated organellar motility and cytosolic Zn2+ concentrations by expressing either LAMP1-mCherry or mito-mCherry, and the genetically encoded Zn2+ sensor GZnP2 sensor (which exhibits a Kd = 352 pM for Zn2+) in HeLa cells (Figure 4A). After acquiring enough frames to establish a baseline for motility, Zn2+ was chelated with 100 µM TPEN to determine the minimum apo-state signal of GZnP2. The TPEN was then washed out, and 100 µM ZnCl2 was added to slowly increase cytosolic Zn2+ (Figure 4B and C). This led to a slow and gradual decrease in organellar motility as the cytosolic Zn2+ increased to < 1 nM. The cells were then treated with 2.5 µM pyrithione to saturate the GZnP2 sensor and achieve maximum cytosolic Zn2+. With the presence of pyrithione, Zn2+ concentration rapidly increased, and the motility sharply decreased (Figure 4B and C). Lysosomal or mitochondrial motility was measured using the “Total Motility” plugin [48] for ImageJ, which calculates the percentage of organellar movements by measuring the area of shifted mitochondria (or lysosomes) out of the total mitochondrial (or lysosomal) area for each acquisition time point in each cell. The motility was then plotted against the corresponding cellular Zn2+ concentrations (see Methods), generating dose-response curves for Zn2+-dependent inhibition of both lysosomes (Figure 4D, IC50 = 7.01 ± 2.08 nM) and mitochondria (Figure 4E, IC50 = 5.50 ± 2.51 nM), which were not statistically different from one another (Figure 4F). This suggests that Zn2+ may inhibit the lysosomal and mitochondrial motility by the same mechanism. Note that we were unable to separately score IC50 values for anterograde and retrograde motility due to the limitations of the Total Motility plugin, the non-uniform polarity of microtubules, and overall difficulty in unambiguously determining the direction of movement in HeLa cells.

(A) Schematic of the IC50 assay in HeLa cells (top) showing cytosolic localization of co-transfected GZnP2 sensor and either lysosomal (left, magenta) or mitochondrial (right, red) mCherry. Representative micrographs of HeLa cells (bottom) illustrating the localization of GZnP2 sensor in the cytoplasm, and either LAMP1-mCherry (left, magenta) or mito-mCherry (right, red). Scale bar = 20 µm. (B and C) Representative plots of [Zn2+] (B; determined using GZnP2; see Methods) and relative lysosomal motility (C; via LAMP1-mCherry) in a HeLa cell treated as indicated (100 µM TPEN at t = 120 sec; a 2 min duration washout at t = 300 sec; 100 µM ZnCl2 at t = 420 sec; and, 5 µM pyrithione at t = 1680 sec). (D and E) Representative plot of relative motility versus [Zn2+] used to calculate IC50 values for LAMP1-mCherry (D) or mito-mCherry (E). Relative motility was determined by measuring motility of particles (using the Total Motility plugin for ImageJ [48]) in a given cell prior to and subsequent to initiation of Zn2+ influx, and normalizing the latter to the former. (F) Mean IC50 values (± SEM) for LAMP1-mCherry (“LAMP1”, magenta; n = 8 cells from 6 individual replicates) and mito-mCherry (“Mito”, red; n = 7 cells from 5 individual replicates). Student’s two-tailed unpaired t-test assuming equal variance. All experiments were performed in the absence of extracellular Ca2+. n.s. not significant.
Zn2+ inhibits KIF5A motility in a dose dependent manner
Given the ability of Zn2+ to directly affect retrograde and anterograde organellar transport in cells, with no clear organelle specificity, we wondered whether this was a consequence of direct modulation of motor-mediated transport, or an indirect effect (e.g., cargo-adaptor proteins). To answer this question, we employed an inducible cargo trafficking assay in which constitutively active motors are recruited to transport vesicular cargoes in a cargo adaptor-independent manner in living cells [49]. A green fluorescent protein (mNeonGreen, mNG) and rapamycin binding fragment (FRB) are fused to the C-terminus of a constitutively active fragment of the kinesin-1 motor protein (KIF5A(1-560)-mNG-FRB), the kinesin responsible for anterograde axonal transport of lysosomes and mitochondria [50–52]. Two FK506 binding proteins (2xFKBP) and a red fluorescent protein (mRFP) are fused to the C-terminus of a peroxisomal membrane targeting sequence (PEX3(1-42)-mRFP-2xFKBP). When the small molecule rapamycin or any of its structural analogs (rapalogs) are added to this system, FRB-FKBP heterodimerization is induced and the motor protein and peroxisome are irreversibly tethered together (Figure 5A), thus resulting in the peroxisomes being transported from their generally static perinuclear position to the cell periphery, where the plus ends of microtubules are generally situated [49, 53]. With this design, we can directly assess the motility of KIF5A by measuring peroxisome movement and localization patterns.

(A) Cartoon schematic of the components of the peroxisome dispersion assay. (B) Representative plots of mean change in peroxisome distance from the cell center over time, for COS-7 cells expressing KIF5A(1-560)-mNG-FRB and PEX3-mRFP-2xFKBP, treated at 0 sec with 1 µM PTO and various concentrations of Zn2+ (none, purple; 2 µM, blue; 3 µM, teal; or 5 µM, lime), and 100 nM Zotarolimus (“Zota”) at 300 sec. (C) Representative micrographs of COS-7 cells expressing KIF5A(1-560)-mNG-FRB (green, top), PEX3-mRFP-2xFKBP (magenta, middle), or merged channels (bottom), at 0 seconds (“baseline”) or 25 minutes after treatment with 100 nM Zotarolimus (“post-Zota”) in the presence of the indicated Zn2+ concentrations. Scale bar = 10 µm. (D-F) Fluorescent intensity averages of PEX3-mRFP-2xFKBP in COS-7 cells co-expressing KIF5A(1-560)-mNG-FRB. Cells were imaged and aligned by their geometric centers after the following treatments and fixation: (D) 2 µL DMSO for 5 minutes, then an additional 2 µL DMSO for 25 minutes (n = 42 cells); (E) 1 µM PTO for 5 minutes, then 100 nM Zotarolimus for 25 minutes (n = 44 cells); (F) 10 µM ZnCl2 and 1 µM PTO for 5 minutes, then 100 nM Zotarolimus for 25 minutes (n = 46 cells). Black dotted line indicates the area within 10 µm of the center. (G) Box plots and individual points representing the proportion of PEX3-mRFP-2xFKBP fluorescence within 10 µm of the geometric cell center, for the each of the conditions in (D-F). One-way ANOVA with post-hoc Tukey HSD. All experiments were performed in the absence of extracellular Ca2+. **** p < 0.0001, ** p < 0.01.
COS-7 cells were co-transfected with a KIF5A(1-560)-mNG-FRB and a PEX3-mRFP-2xFKBP [53]. In the control experiment, cells were imaged for a 5 minute period (to establish a baseline), then treated with 1 µM pyrithione for 5 minutes, and then treated with 100 nM Zotarolimus (a rapalog) for 25 minutes. Within seconds of Zotarolimus treatment, generally cytosolic KIF5A(1-560)-mNG-FRB fluorescent signal was visibly recruited to the peroxisomal membranes (PEX3-mRFP-2xFKBP fluorescent puncta; Figure 5C) and the peroxisomes were rapidly dispersed to the cell periphery (Figure 5C, Video S7), as measured by the average change in distance of mRFP puncta from the geometric center of the cell (Figure 5B). Strikingly, when ZnCl2 (2, 3, or 5 µM) was added along with the pyrithione, the extent of peroxisome dispersion was dramatically reduced in a dose-dependent manner (Figure 5B & C, Video S7). We quantified the inhibitory effect on peroxisomal distribution after 25 minutes of Zotarolimus treatment. Radial analysis of fluorescence intensity from the geometric center of the cell was conducted using a custom image processing macro written for ImageJ, and representative averages of all analyzed cells were generated (Figure 5D–F). Zotarolimus treatment led to a significant dispersion of peroxisomes compared with DMSO treatment, while the peroxisomal dispersion was almost entirely inhibited after Zn2+ influx (Figure 5G).
We repeated this assay using a constitutively active fragment of the kinesin-1 KIF5C (KIF5C(1-559)-mNG-FRB) and observed that Zn2+ was also able to inhibit peroxisome dispersion by this motor protein (Figure S6A–C). Both mNG-tagged kinesins were still visibly recruited to the peroxisomes in the presence of 5 µM Zn2+ (Figure 5C, Figure S6C), indicating that Zn2+ does not interfere with heterodimerization of FRB-FKBP, but rather that it modulates motility by acting on either the motor protein, the microtubules, or the interaction between them.
Zn2+ redistributes KIF5A in COS-7 cells
Since KIF5A(1-560) proteins are constitutively active, the majority of them continually traffic along microtubules away from the microtubule organizing center and toward the plus ends of microtubules. We thus examined how Zn2+ affects the localization pattern of KIF5A(1-560) in COS-7 cells (expressing both mNG-tagged KIF5A(1-560) and mCherry-α-tubulin). Using oblique illumination microscopy, we noted that the KIF5A(1-560)-mNG-FRB was highly enriched at the periphery of the cell, often exhibiting little to no enrichment in the cell center (Figure 6A). The peripheral KIF5A(1-560) fluorescence exhibited linear morphology, which colocalized with the mCherry-α-tubulin signal, confirming that KIF5A is interacting with and likely walking along microtubules toward the plus ends (Figure 6A). After 5 minutes of treatment with 20 µM ZnCl2 and 2.5 µM pyrithione, there was a significant shift of the KIF5A(1-560) signal toward the center of the cell and away from the periphery (Figure 6A & C), quantified by the ratio of edge:center fluorescence intensity (Figure 6D). Pyrithione treatment alone had no effect on the distribution of KIF5A(1-560) (Figure 6B–C). We confirmed this Zn2+-dependent redistribution of KIF5A(1-560) by performing confocal timelapse imaging, which also revealed no changes in the distribution of mCherry-α-tubulin (Figure 6D, Video S8). By employing oblique illumination microscopy with rapid (40 Hz) timelapse imaging, we were able to observe motility of individual KIF5A(1-560) motors that were largely inhibited upon addition of 20 µM ZnCl2 and 1 µM pyrithione, but not pyrithione alone (Figure S7A). Our data suggest that Zn2+ does not cause a massive microtubule catastrophe event, but rather reduces the movement of motor proteins along the microtubule lattice. It is important to note that addition of Zn2+ did not result in an apparent unbinding of KIF5A from microtubules, as was apparent from its localization pattern in cells both before and after Zn2+ treatment (Figure 6A), but rather appears to directly inhibit motility (Figure S7A), suggesting that Zn2+ induces a rigor state in the motor.

(A-B) Representative oblique illumination micrographs of COS-7 cells expressing KIF5A(1-560)-mNG-FRB (green, left) and mCherry-α-tubulin (magenta, middle), and merged channels (right). Cells were imaged at baseline (top) and 5 minutes after treatment (bottom) with (A) 20 µm ZnCl2 and 2.5 µM pyrithione (PTO), or (B) 2.5 µM PTO alone. (C) Ratio of edge-to-center fluorescence of KIF5A(1-560)-mNG -FRB in COS-7 cells as treated in (A) and (B) (Zn2+-treated, n = 16 cells from 3 individual biological replicates; PTO control, n = 13 cells from 3 individual biological replicates). Two-tailed paired t-tests. (D) Representative timelapse of edge-to-center fluorescence of KIF5A(1-560)-mNG-FRB (green) and mCherry-α-tubulin (magenta) in COS-7 cells, treated as in (A). All in situ experiments were performed in the absence of extracellular Ca2+. (E-F) Microtubule-stimulated ATPase activity of (E) purified recombinant human kinesin (KIF5a), and (F) a minimally processive, artificially dimerized yeast dynein fragment (GST-dynein331) across a range of precisely-buffered Zn2+ concentrations (see Supplementary Methods), normalized to the maximum and minimum ATPase activity within each individual replicate, replicates denoted by separate colors and marker shapes (kinesin, n = 4 individual replicates; dynein, n = 3 individual replicates). Each assay was performed in the presence of 2 µM microtubules. Black line shows cumulative data fitted to cubic model with log transformation of [Zn2+] concentration, with corresponding R2 values shown in the top right corner. (G) Mean normalized microtubule-stimulated ATPase activity (±SEM) for a minimally processive, artificially dimerized yeast dynein fragment (GST-dynein331, purple) and recombinant human kinesin (KIF5A, blue) in the presence of 500 µM CaCl2 (n = 3 replicates each). (H) Mean (±SEM) in vitro fluorescent intensity (488 nm excitation, 525 nm emission) for solutions containing 1 µM FluoZin-3, 1 µM ZnCl2, 1 mM DTT, and varied concentrations of pre-formed, taxol-stabilized porcine microtubules (MT) (n = 4 individual replicates). **** p < 0.0001, n.s. not significant.
Zn2+ directly inhibits the microtubule-stimulated ATPase activity of kinesin and dynein in vitro
Our live cell imaging data have clearly demonstrated that Zn2+ arrests axonal transport by inhibiting motor protein motility. To determine whether Zn2+ can directly impact motor protein activity, we examined whether Zn2+ affects the microtubule-stimulated ATPase activity of motor proteins using purified proteins and the EnzChek ATPase assay. We tested a commercially available human recombinant kinesin heavy chain (KIF5A, #KR01 Cytoskeleton) as well as an artificially dimerized, truncated yeast dynein motor domain fragment, which is sufficient for processive motility [54]. Human dynein was not chosen because it requires additional factors for processive motility (i.e., the dynactin complex and any one of a number of adaptor proteins [55, 56]. The yeast dynein heavy chain, which is responsible for microtubule-binding and ATPase activity – exhibits a high degree of sequence and structural homology to the human dynein heavy chain, including the region of the motor domain that binds the microtubule surface (the microtubule-binding domain, or MTBD; reviewed [57]). By using this dynein, we were able to analyze how Zn2+ directly affects dynein motility without the potential complications of ion-mediated effects on dynein-dynactin-adaptor complex assembly, or adaptor regulation. For example, ion-mediated effects have been noted for Miro, a Ca2+-sensitive mitochondrial adaptor molecule [58] as well as CRACR2a, a Ca2+-sensitive dynein adaptor protein [59].
We tested the microtubule-stimulated ATPase activity of these motors at varying Zn2+ concentrations spanning the entire physiological range of labile Zn2+ concentrations (using precisely formulated buffers; see Methods). Interestingly, we observed that KIF5A ATPase activity increases in response to picomolar levels of Zn2+ (peaking around 100 pM), but then is reduced as Zn2+ increases into the nanomolar range (Figure 6E, Figure S7B). Alternatively, dynein activity is relatively stable across all picomolar Zn2+ concentrations, and exhibits a similar decrease as Zn2+ increases into the nanomolar and micromolar range (Figure 6F, Figure S7C). Finally, we observed that there was little to no reduction of ATPase activity of either kinesin or dynein in the presence of 500 µM Ca2+ (Figure 6G), suggesting that cationic concentration alone is likely not responsible for this inhibition of motor protein function.
Given that both kinesin and dynein ATPase activity can be inhibited by Zn2+ in vitro, we reason that Zn2+ might directly act on the microtubules to inhibit the motor protein motility. Previous studies have demonstrated that tubulin proteins have potential Zn2+ binding sites [60]. To determine whether pre-polymerized canonical microtubules could chelate labile Zn2+ out of solution, we used the small molecule Zn2+ sensor FluoZin-3 (Kd = 15 nM) pre-bound with Zn2+. Interestingly, as microtubule concentration increased, FluoZin-3 fluorescence intensity decreased (Figure 6H), suggesting that microtubules can indeed chelate Zn2+ from solution. Both the motor ATPase assay and microtubule-Zn2+ binding assay suggest that Zn2+ might directly bind to the microtubules in cells and thus inhibit motor-mediated axonal transport by an unknown mechanism.
TRPML1 dysfunction perturbs Zn2+ homeostasis and organellar motility
Various MLIV patient mutations in TRPML1 display a wide range of disease severity. To further clarify the roles of TRPML1-mediated Zn2+ in neuron function, we defined how different patient mutations perturb Zn2+ permeability. We selected reported mutations in patients harboring a single missense or in-frame deletion mutation in one allele, where the other allele doesn’t encode a structurally significant TRPML1 subunit, and where disease severity was clinically cited. Overexpressed TRPML1 is targeted partly onto the plasma membrane[61] and its Zn2+ permeability can be detected with the cytosolic sensor GZnP3 in HeLa cells [2]. A rapid Zn2+ influx was detected through TRPML1, while TRPML1DDKK completely blocked Zn2+ permeability (Figure 7A–B). All missense mutations caused significantly lower activation-induced Zn2+ uptake (Figure 7B, black asterisks). TRPML1WT, TRPML1F408Δ, TRPML1D362Y, and TRPML1R403C had significantly higher Zn2+ uptake as compared to TRPML1DDKK (Figure 7B, magenta asterisks), whereas all other mutations showed virtually no permeability to Zn2+. This trend of Zn2+ permeability correlates considerably to the severity of MLIV disease (Figure 7B). For example, the patient harboring the F408Δ mutation has the mildest known form of MLIV, is fluently bilingual, graduated high school, and has only mild neurological impairment with no motor impairment [36]. The D362Y mutation has been described as a mild form of MLIV[36], and the R403C mutation is a moderate form of MLIV[62]. Patients expressing the other missense mutations have the typical, most severe forms of MLIV (i.e. unable to sit up or feed independently, severe developmental delay and cognitive impairment) [21, 36]. The Zn2+ permeability of TRPML1 aligns surprisingly well with MLIV disease severity and neurological impairment, implicating the essential roles of TRPML1-mediated Zn2+ signals and their fine-tuning of axonal transport in neuron function.

(A) Representative traces of zinc uptake in overexpressed TRPML1WT, TRPML1WT, and select MLIV patient TRPML1 mutations in HeLa cells co-expressing GZnP3. (B) Rate of agonist-induced zinc uptake through TRPML1 channels overexpressed on the plasma membrane of HeLa cells upon the addition of agonist ML-SA1 (50 µM). (WT, n = 17 cells; F408Δ, n = 11 cells; D362Y = 17 cells; R403C, n = 15 cells; T232P, n = 25 cells; V446L, n = 11 cells; L447P, n = 16 cells; C463Y, n = 31 cells; F465L, n = 22 cells; DDKK, n = 16 cells). One way ANOVA, with Hsu’s MCB test comparison to TRPML1WT (black asterisks) and TRPML1DDKK (magenta asterisks). (C) Histogram representing binned instantaneous velocities of retrograde (blue) and anterograde (green) moving lysosomes (LAMP1-mCherry, analyzed with KymoButler [38]) during 5 minute baseline recordings after 24 hour treatment with 2 µL DMSO (dark bars) or 10 µM ML-SI4 (light bars) (DMSO, n = 61,417 non-zero retrograde instantaneous velocity measurements, n = 27,769 non-zero anterograde instantaneous velocity measurements, from 16 axons across 5 individual dishes; ML-SI4, n = 62,423 non-zero retrograde instantaneous velocity measurements, n = 25,460 non-zero anterograde instantaneous velocity measurements, from 20 axons across 5 individual dishes). Wilcoxon test. (D) Mean proportion of lysosomes moving in the indicated directions after 24 hour treatment with DMSO or 10 µM ML-SI4 for neurons expressing LAMP1-mCherry. (DMSO, n = 16 axons from 5 independent experiments; ML-SI4, n = 20 axons from 5 independent experiments). Two-tailed unpaired t-tests. (E) Comparison of cytoplasmic [Zn2+] between cultured human fibroblasts from normal (n = 7 cells from 4 individual dishes) and MLIV (n = 9 cells from 4 individual dishes) patients as measured using NES-ZapCV2 calibration. Two-tailed unpaired t-test. (F) Box plot comparing mitochondrial motility (mito-mCherry, analyzed with Total Motility plugin [48]) between cultured human fibroblasts from normal (n = 18 cells from 3 individual dishes) and MLIV patients (n = 20 cells from 3 individual dishes). Two-tailed unpaired t-test. All experiments were performed in the absence of extracellular Ca2+. (G-H) Proposed models of Zn2+-dependent motility inhibition upon cytosolic Zn2+ increase. Zn2+ (green circles) can flux into the cytosol from (G) lysosomal stores through the TRPML1 channel or (H) through voltage gated Ca2+ channels (VGCCs) or NMDA receptors (NMDARs) at dendritic spines. When cytosolic Zn2+ is increased, it may bind to microtubules and inhibit motor protein (kinesin and dynein) motility, pausing organellar transport. **** p < 0.0001, ** p < 0.01, * p < 0.05, n.s., not significant.
Neurons rely heavily on properly regulated transport of organelles, and small perturbations in this regulation could have a large impact on neuronal function. Therefore, given that lysosomal Zn2+ release is blocked upon loss of TRPML1 function[2], we next investigated whether axonal transport of lysosomes could be perturbed when TRPML1 is pharmacologically blocked. We treated neurons expressing LAMP1-mCherry for 24 hours with either 10 µM ML-SI4, a potent TRPML1 inhibitor [2, 63], or DMSO, then measured lysosomal motility via KymoButler-generated analysis. As compared to DMSO controls, the instantaneous velocities of lysosomes in neurons treated with ML-SI4 increased for both retrograde- and anterograde-moving lysosomes (Figure 7C). In addition, the proportion of retrograde and anterograde lysosomes slightly increased in ML-SI4-treated neurons, while the proportion of stationary lysosomes slightly decreased (Figure 7D), though these changes were not statistically significant.
Further, if lysosomes are unable to release Zn2+ through dysfunctional TRPML1, Zn2+ homeostasis would be expected to be perturbed in MLIV disease cells. To investigate this, we measured the resting (i.e., unstimulated) cytosolic concentrations of Zn2+ using the FRET-based Zn2+ sensor, ZapCV2 [64], which is a ratiometric sensor that can minimize the effects caused by cell thickness and sensor protein expression levels among different cell types. We found that cytoplasmic Zn2+ concentrations were reduced in MLIV patient fibroblasts (GM02048, Coriell Institute) as compared to normal human fibroblasts (GM03440, Coriell Institute) (Figure 7E). These MLIV patients cells are from a patient who is heterozygous for two different severe TRPML1 mutations: c.406-2A>G (a splice mutant skipping exon 4 and loss of reading frame) and c.511del6434 (a 6534 bp deletion removing exons 1-7 (of 15) entirely) [28, 37]. These results showed that loss of TRPML1 function indeed disrupts resting Zn2+ homeostasis, indicating that TRPML1 plays essential roles in tuning cytosolic Zn2+ concentrations that cannot be compensated for by other Zn2+ transporters and buffering proteins.
We next sought to determine whether the altered cytoplasmic Zn2+ levels in MLIV patient cells leads to changes in motor-mediated organellar motility. Since microtubule-based lysosomal motility is difficult to distinguish from Brownian motion in fibroblasts, and in light of the cholesterol-dependent perinuclear lysosomal clustering and trafficking defects in MLIV patient fibroblasts [65], we focused our analysis on mitochondrial motility. This revealed that total mitochondrial motility was indeed increased in MLIV patient fibroblasts with respect to control cells (Figure 7F).
Taken together, these results indicate that TRPML1 inhibition leads to de-regulation of axonal transport of lysosomes in neurons. Further, chronic TRPML1 dysfunction leads to lower resting cytoplasmic Zn2+ concentrations, and dysregulated microtubule-based organellar motility in MLIV patient cells. In addition, the Zn2+ permeability of TRPML1 aligns surprisingly well with MLIV disease severity and neurological impairment, implicating the essential roles of TRPML1-mediated Zn2+ signals and their fine-tuning of axonal transport in neuron function.
Discussion
It is well established that Zn2+ plays several catalytic and structural roles in various proteins [66], however, a role for Zn2+ in transducing signals and rapidly affecting downstream cellular processes has not been fully determined until now. Our work clarifies a signaling role for Zn2+ in directly modulating axonal transport. We demonstrated that increased intracellular Zn2+ due to either lysosomal release by TRPML1 activation or influx by depolarization inhibits axonal transport (Figure 1, Figure 2, and Figure 3). Such inhibition can be detected when Zn2+ concentration is increased into the nanomolar range (Figure 4), which is within the range of the physiological dynamic changes in Zn2+ concentration (picomolar to nanomolar range) by previous estimations [66–68].
Long-distance axonal transport, which is essential to maintain neuron health and function, requires complex, coordinated, and precise regulation to ensure delivery of the appropriate cargo to its requisite destination. Localized signaling molecules such as Ca2+ can inhibit mitochondrial motility [58]. Increased Ca2+ signals can be sensed by the cytosolic EF-hand domains of the Miro protein, a transmembrane protein localized on the outer-mitochondrial membrane [58]. Ca2+ binding to Miro promotes binding to the heavy chain of kinesin, outcompeting kinesin binding to microtubules, and therefore arresting microtubule-based mitochondrial motility [58]. Previous studies also reported that high levels (micromolar) of Zn2+ inhibit axonal mitochondrial motility [46]. Our results here reveal that Ca2+ does not inhibit lysosomal motility, but Zn2+ can inhibit both mitochondrial and lysosomal trafficking along axons. Our previous studies demonstrated that TRPML1-mediated Zn2+ signals were higher in neurites than in the soma [2], suggesting the former are the likely targets of Zn2+-mediated regulation. Interestingly, our prior work also showed that TRPML1-mediated Ca2+ signals – which do not appear to directly affect motor function – were much smaller in neurons than the Ca2+ signals observed in HeLa cells, and further, that these signals were lower in neurites than the soma [2]. Together, these data suggest that although Ca2+ have the capacity to arrest mitochondrial transport by affecting adaptor proteins [58], TRPML1-mediated Zn2+ may be a more potent and relevant signal in the regulation of axonal transport when TRPML1 channels are activated.
We further clarify that Zn2+-dependent inhibition is mediated by directly affecting kinesin motility in cells (Figure 5), but not disrupting KIF5A landing on microtubules. Our in vitro work in this paper suggests that Zn2+ ions directly bind to sites along microtubules (Figure 6H) to inhibit motor activity. The presence of Zn2+ binding sites on microtubules were also supported by previous studies that high (millimolar) concentrations of Zn2+ can assemble purified tubulin into 2-dimensional sheets and macrotubes [60, 69, 70]. Zn2+ has also been shown to directly inhibit the ATPase activity of the anterograde motor kinesin, albeit with an IC50 in the micromolar range [71]. Here, we demonstrated that nanomolar concentrations of Zn2+ are able to reduce the ATPase activity of both kinesin and dynein in vitro (Figure 6E–F). The biphasic response of kinesin ATPase activity (Figure 6E) suggests the presence of at least two distinct Zn2+ binding sites: a high affinity binding site that enhances kinesin activity, and a lower affinity binding site that inhibits its activity. Although the kinesin superfamily is comprised of ~ 45 members (reviewed [72]), they all contain a highly conserved motor domain core that includes an ATP-binding module, and a microtubule-binding domain. Since dynein and kinesin are both inhibited at higher Zn2+ concentrations, this lower affinity Zn2+ binding site may exist on the microtubule at a shared motor-binding region, or at a site that exhibits allosteric effects on this region. The biphasic response of kinesin ATPase activity (Figure 6E) reveals the extent of differential motor-protein-mediated transport in response to Zn2+ levels where suboptimal low levels of Zn2+ are more favorable for dynein-mediated retrograde transport, while both kinesin- and dynein-mediated transport is most favored at resting Zn2+ concentrations (Figure 6E–F). This is also supported by our observations in cells that chelation of Zn2+ with TPEN after Zn2+-mediated inhibition of motility results in rapid recovery of retrograde transport as compared to delayed recovery of anterograde transport (see Figure 3B–E, Figure S3B–E).
Our data suggest that TRPML1-mediated release of lysosomal Zn2+ acts as autoinhibitory mechanism that may affect lysosome transport spatially (at specific regions of the axon), and in a manner that might be related to the maturation status and Zn2+ content of the lysosome. The notion of cargos modulating their own transport has emerged as a common thread within the microtubule motor field. For instance, dynein activity is activated by the binding of dynactin and cargo adaptor proteins [55, 56], which link dynein-dynactin to a multitude of vesicular and non-vesicular cargoes [73–79]. A similar mode of cargo-activated transport has been noted for the kinesin superfamily [80–84]. Our data provide insight into a new layer of motor regulation: that the vesicular cargoes themselves (e.g., lysosomes) contain an ionic signaling molecule that has the capacity to directly and potently disrupt their own motor-mediated transport.
Such autoinhibitory and fine-tuning mechanism provides spatiotemporal control of lysosomal trafficking, which might play essential roles in maintaining neurite health. TRPML1 is activated by the endogenous lipid agonist PI(3,5)P2 which is mainly confined to mature endolysosomal membranes [37, 85]. Although PI(3,5)P2 is a low-abundant phosphoinositide lipid, neurons are sensitive to loss of PI(3,5)P2 and mutations in genes involved in the synthesis and regulations of PI(3,5)P2 are associated with several neurological disorders such as ALS [86], epilepsy [87], and Yunis–Varón syndrome [88] (reviewed [89]). We propose that when lysosomes are trafficked along axons, transient increase in PI(3,5)P2 activates TRPML1 channels. Brief, highly local bursts of Zn2+ would consequently arrest lysosomal motility in a highly restricted spatial manner within a very short time scale by directly impeding the transport of the lysosome-bound motor proteins along microtubules (Figure 7G), allowing lysosomes to perform specific functions such as picking up RNA granules [90] or damaged mitochondria [91]. To this point, TRPML1 can also be activated by reactive oxygen species (ROS)[63]. This could provide a direct way for damaged mitochondria to be detected by lysosomes, wherein a damaged mitochondria releasing high amounts of ROS could trigger TRPML1, releasing Zn2+ and allowing the lysosome to transiently pause, allowing time for mitochondria-lysosome contact, which has been shown to promote mitochondrial fission[92]. Finally, local increases in cytosolic Zn2+ can also result from NMDA-dependent Zn2+ influx at a synapse, and may signal organelles to stop or pause in order to deliver their cargo, specifically at only active synapses (Figure 7H). For example, studies have found that Zn2+ can recruit Shank proteins to the postsynaptic regions during synaptogenesis and synapse maturation [93].
As neurons rely on the well-coordinated transport of various axonal cargoes with a high degree of spatial and temporal precision, these findings provide an important new role for Zn2+ and the consequences of its imbalance in the development and progression of neuronal disease. Given the different responses of dynein and kinesin to low concentrations of Zn2+, the amount of Zn2+ that is locally released can potentially favor either anterograde or retrograde trafficking events. This could play an important role in the balance of motor protein “tug-of-war” for cargoes which are decorated with both kinesin and dynein. Long-term changes in Zn2+ concentrations may also signal a cell-wide change in motility, wherein motility in the anterograde (i.e., high picomolar to low nanomolar Zn2+), retrograde (i.e., low picomolar Zn2+), or neither (i.e., > 10 nM Zn2+) direction is favored. In patients with MLIV, the inability of endolysosomes to release TRPML1-mediated Zn2+ may affect normal spatiotemporal control of lysosomal transport resulting in their improper distribution, and possible axonal defects [21]. Here, we observed that pharmacological TRPML1 inhibition increases lysosomal trafficking along axons (Figure 7C–D), confirming that lysosomal Zn2+ release might act as a brake signal. Further, we observed reduced cytosolic Zn2+ and increased mitochondrial motility in MLIV fibroblasts (Figure 7E–F). In addition, perinuclear clustering of lysosomes have been reported in TRPML1-deficient fibroblasts23, which might be caused by the favored retrograde versus anterograde transport due to the loss of Zn2+-mediated regulation of microtubule-based transport. The vital roles of Zn2+-regulated axonal transport is further supported by the inverse correlation between Zn2+ permeability of MLIV patient mutants with disease severity (Figure 7E–F). This indicates that even subtle perturbation in the regulation of axonal cargo transport between the soma and axonal growth cones or synaptic terminals may contribute to the pathology of axonal dystrophy seen in MLIV patients [21]. The importance of proper axonal transport is apparent by the clear correlation between disruptions in this process and several adult onset neurodegenerative diseases, including Alzheimer’s disease, Huntington’s disease, amyotrophic lateral sclerosis (ALS), spinal muscular atrophy with lower extremity dominance (SMA-LED), and Parkinson’s disease (reviewed [94]). Unsurprisingly, mutations in several components of the transport machinery (e.g., dynein, cargo adaptors, LIS1, kinesin) have been linked to both neurodevelopmental and neurodegenerative diseases (reviewed [30, 95]). Neurons are especially susceptible to dysfunctions in microtubule-based transport regulation due to their highly elongated and extensively branched morphology. Thus, in order to understand the mechanism underlying the establishment and maintenance of neuronal health and develop strategies to prevent or reduce the severity of disease, it is imperative that we understand the mechanisms that can affect and regulate axonal transport. Our findings reveal insight into a new mode of axonal transport regulation and a new pathological mechanism of MLIV.
Materials and Methods
Animal care
Pregnant Sprague Dawley rats were purchased from Charles River (strain: 400). Animal treatment and maintenance were performed by the University of Denver Animal Facility (AAALAC accredited). All experimental procedures using animals were approved by the Institutional Animal Care and Use Committee (IACUC) of the University of Denver.
Plasmid generation
Expression plasmids were constructed using traditional molecular biological techniques, and were all verified by sequencing. TRPML1-HA [96] was a gift from Craig Montell (Addgene plasmid #18825; http://n2t.net/addgene:18825; RRID:Addgene_18825). EGFP-TRPML1 and mCherry-TRPML1 were created by PCR amplifying EGFP or mCherry and TRPML1 from TRPML1-HA, and ligating the fluorophore on the N-terminus of TRPML1 and into pcDNA3.1+. To construct LAMP1-mCherry, mCherry was PCR amplified from mCherry-Rab7a-7, LAMP1 was PCR amplified from LAMP1-RFP, and both were ligated into pcDNA3.1+. mCherry-Rab7a-7 was a gift from Michael Davidson (Addgene plasmid #55127; http://n2t.net/addgene:55127; RRID:Addgene_55127). Lamp1-RFP [97] was a gift from Walther Mothes (Addgene plasmid # 1817; http://n2t.net/addgene:1817; RRID:Addgene_1817). We used site-directed mutagenesis to engineer D471K and D472K into EGFP-TRPML1, yielding EGFP-TRPML1DDKK. All MLIV patient TRPML1 mutations were generated by site-directed mutagenesis of mCherry-TRPML1.
Primary rat hippocampal neuron culture and transfection
Primary hippocampal neurons were prepared from rat embryos at embryonic day 18 (E18) in dissection medium containing 10X HBSS, 1 M HEPES buffer (pH 7.3) and 50 µg/mL gentamycin. The hippocampi were minced and treated with 1000 U/mL papain added to the dissection medium, and dissociated by trituration in 1 mg/mL DNase I. Cells were plated on 1 mg/mL poly-L-lysine-coated 10 mm round glass coverslips at a density of 20,000–25,000 cells/coverslip per dish in neuron plating medium (MEM supplemented with glucose and 5% FBS). After checking that cells were adhered, neuron plating medium was replaced with Neurobasal medium (Thermofisher) supplemented with 0.3X GlutaMAX (Thermofisher) and 1X B-27 (Thermofisher). Cultures were maintained at 37 °C, 5% CO2. Neurons were transfected between 5 and 15 days in vitro (DIV), using the Lipofectamine 3000 transfection kit (Thermofisher) in 500 µL Opti-MEM. The reagent-DNA mixture was incubated for a minimum of 25 min at room temperature before direct addition to the neuron imaging dishes. Before adding reagent-DNA, 1 mL media was removed from each imaging dish and syringe filtered with an equal volume of fresh neuron culture media (50:50 media). After incubation at 37 °C for 4 h, neurons were washed three times with 1 mL prewarmed neuron culture media. Then, 2 mL of the 50:50 media was added to the neuron imaging dishes and they were incubated at 37 °C until imaging.
Drug treatment and live cell imaging of neurons, and analysis of axonal motility
Live cell imaging of neurons was performed more than two days after transfection. Neurons were washed and imaged in HEPES-Buffered Hanks Balanced Salt Solution (HHBSS) lacking Ca2+ and Zn2+. For experiments in which TRPML1 was stimulated, neurons were imaged for 5 minutes to determine baseline motility, then treated for 5 minutes with 50 µM ML-SA1. For experiments in which Zn2+ influx was induced by depolarization, neurons were treated with Ca2+-free HHBSS supplemented with 50 mM KCl and 100 µM ZnCl2 during the acquisition period (lasting 20 minutes in duration). For experiments in which chelation followed depolarization-induced Zn2+ influx, neurons were washed 3 times with Ca2+-free HHBSS, then treated with 100 µM TPEN and immediately imaged. For experiments in which Zn2+ influx was induced with pyrithione treatment, neurons were washed 3 times with Ca2+-free HHBSS and then treated with 100 µM ZnCl2 and 2.5-5 µM pyrithione. For experiments in which baseline lysosomal motility was measured, neurons were treated for 24 hours with either 2 µL DMSO or 10 µM ML-SI4, then washed and imaged in HHBSS lacking Ca2+ and Zn2+, but containing equivalent concentrations of DMSO or ML-SI4, respectively.
All live neuron imaging was performed on an inverted Nikon/Solamere CSUX1 spinning disc confocal microscope equipped with a 40x 1.4 NA oil immersion objective, and a variable 1.0x or 1.5x OptiVar tube lens. Axonal motility imaging was performed in a LiveCell imaging chamber kept at 37°C, 5% CO2, and 80% humidity. The microscope was controlled with MicroManager software and image analysis was performed using Fiji [98] (see below for details on image analysis). To image lysosomal and mitochondrial motility (via LAMP1-mCherry or mito-mCherry, respectively), fluorescence images were acquired every 0.5–2.5 seconds, with 50-100 millisecond exposures with a 561 nm laser at 1-5 mW power. To analyze organellar axon motility, image contrast of each movie was enhanced by first employing a bandpass filter to remove frequencies larger than 7 px and less than 2 px. Fiji’s built in “Background subtraction” was then run using a 5 px rolling ball radius. Image stacks were then stabilized (if needed) using the Manual Drift Correction plugin for Fiji. Kymographs were generated using the Kymolyzer plugin [42], and background kymograph noise was removed using a custom code (ImageJ Macro Language). These kymographs were then analyzed using the KymoButler [38] plug-in for Mathematica (Wolfram Research, Inc.). Instantaneous velocities measured by the KymoButler plug-in were extracted using custom code (Wolfram Language) in order to get a more accurate description of motility, as the density of bidirectionally moving lysosomes reduced the accuracy of computer-generated track averages. Axons were manually traced back to their soma to confirm orientation, which was used to classify retrograde or anterograde motility. KymoButler-measured tracks with durations less than 4 seconds were also removed entirely from analysis to eliminate the measurement of kymograph noise artifacts. For manual tracking of ZIGIR + EGFP-TRPML1 (Figure 4E–G, Figure S4), the Kymolyzer plugin [42] was used, and instantaneous velocities were extracted from the Kymolyzer plugin using custom code (ImageJ Macro Language).
Non-neuronal cell culture and transfection
HeLa cells and COS-7 cells (African Green Monkey fibroblast-like cell line) were maintained in high glucose Dulbecco’s Modified Eagle Medium (DMEM) supplemented with 10% fetal bovine serum (FBS). COS-7 cells were grown in 100 U/mL Penicillin G and 100 µg/mL Streptomycin. All cells were maintained at 37°C and 5% CO2. HeLa and COS-7 cell transfections were performed with polyethyleneimine (PEI; dissolved to 1 mg/ml in water at pH 7.2, with long-term storage at −20°C and short term storage at 4°C). For each transfection, 3-6 µL of PEI and 1-1.25 µg of DNA were mixed in 250 µL Opti-MEM, incubated for > 25 min at room temperature, then added to one imaging dish with cells (~40-50% confluent). Imaging dishes were incubated at 37°C until imaged as described above.
Zn2+ concentration measurement using GZnP fluorescent probes
For simultaneous analysis of Zn2+ concentrations and organellar motility, GZnP2 was co-transfected into HeLa cells with either mito-mCherry or LAMP1-mCherry. After acquiring images to determine baseline Zn2+ concentration and motility, 100 µM TPEN was added to chelate Zn2+. Cells were then washed 3 times to remove TPEN, treated with 100 µM ZnCl2, then treated with 2.5 µM pyrithione (as indicated on respective plots). Fluorescence intensity values were converted to Zn2+ concentrations using the equation,
 where Kd is the Zn2+ equilibrium dissociation constant, n is the Hill coefficient, I is background-subtracted fluorescence intensity, and Imin and Imax are minimum and maximum fluorescence intensities, respectively. Kd and Hill coefficients were experimentally determined using purified GZnP2, which revealed Kd = 352 pM, and n = 0.49 [68]. Data points that yielded [Zn2+] > 100 µM (no more than 3 data points out of 300+ total data points per cell) were removed from further analysis since theoretically cytosolic [Zn2+] shouldn’t exceed the concentration of the exogenous buffer. Normalized motility values (see below) were plotted against the calculated Zn2+ concentrations, and fit to a sigmoidal curve using KaleidaGraph (Synergy Software), which was used to calculate the Zn2+ IC50 concentration.
To determine cytosolic Zn2+ concentrations in fibroblasts, NES-ZapCV2 (NES, nuclear export signal) was expressed in cells. After acquiring baseline images, cells were treated with 100 µM TPEN, washed 3 times in HHBSS, then treated with 100 µM ZnCl2 and 1.25–2.5 µM pyrithione (PTO). FRET ratio, R (acceptor:donor emission), was converted to Zn2+ concentration using the same equation as above, replacing I with R. ZapCV2 has an experimentally determined Kd of 2.3 nM and n of 0.53 [99].
GZnP2 fluorescence was acquired by excitation with 488 nm, and collecting 525 nm emission. ZapCV2 fluorescence was acquired by excitation with 445 nm excitation, and collecting both the acceptor and donor emission wavelengths, 535 nm and 480 nm, respectively.
Organellar motility analysis in HeLa cells
The Total Motility plugin [48] for Fiji was used to determine the relative motility of organellar structures. Images were binarized by automatic thresholding, then processed by the Total Motility plugin. Motility data were normalized to baseline using the equation,
 where x equals the raw motility data output from the Total Motility plugin, xmin equals the minimum raw motility data point, and xbaseline equals the average motility value for all baseline timepoints. The raw motility data output from the Total Motility plugin is the proportion of thresholded binary pixels that changed from one frame to the next, as a percentage of the total number of positive (white, non-background) pixels in that frame. Images of LAMP1-mCherry or mito-mCherry were acquired every 5 seconds with a 50–100 millisecond exposure of 561 nm laser excitation at 1–5 mW power. The raw motility output was normalized to average baseline motility for each cell. Extreme motility changes that were clearly due to observable stage shift (i.e. during drug addition) were removed from further analysis.
ZIGIR dye protocol and motility experiments
For all experiments using ZIGIR, neurons were incubated with 1 µM ZIGIR for 20 minutes, then incubated in dye-free media for 10 minutes before switching to 0 Ca2+ HHBSS for imaging. ZIGIR fluorescence was measured using 561 nm laser excitation, and 605 nm emission filters (standard TRITC filter set). Colocalization was performed and ICQ values were obtained using the Coloc 2 plugin for ImageJ.
Peroxisome dispersion assays and analysis in COS-7 cells
For rapalog-induced peroxisome dispersion assays, COS-7 cells were co-transfected with PEX3-mRFP-2xFKBP and either KIF5A(1-560)-mNG-FRB or KIF5C(1-559)-mNG-FRB, and imaged within 24 hours as longer transfection resulted in altered localization of the PEX3 construct and cell morphology. Peroxisome dispersion assays were imaged on the Nikon/Solamere CSUX1 spinning disc confocal microscope as described above. For timelapse experiments, cells were imaged for a 5 minute baseline, then 1 µM pyrithione and varying Zn2+ concentrations (as indicated) for 5 minutes. Finally, 100 nM Zotarolimus was added to induce heterodimerization, and cells were imaged for 25 minutes. Images were acquired every 10 seconds with a 50-200 ms exposure for both 488 nm and 561 nm laser excitation at 10 mW and 5 mW power, respectively. Custom code (ImageJ Macro Language) was used to detect PEX3-mRFP maxima and quantify average distance of peroxisomes from the center of the cell.
As a non-dispersed peroxisome control, COS-7 cells were treated with 2 µL DMSO for 5 min (vehicle control for pyrithione), then another 2 µL DMSO for 25 minutes (vehicle control for Zotarolimus). As a positive control, COS-7 cells were treated with 1 µL PTO for 5 minutes, 100 nM Zotarolimus for 25 minutes. Finally, to test the effect of Zn2+, COS-7 cells were treated with 10 µM Zn2+ and 1 µM PTO for 5 minutes, 100 nM Zotarolimus for 25 minutes. After treatment, cells were fixed with 4% paraformaldehyde in 0.1 M PBS with 4% sucrose at 4 °C for 10 minutes. Fixation was quenched with 0.1 M glycine for 5 minutes, then cells were washed with PBS and imaged. Custom code (ImageJ Macro Language) was used to measure fluorescence intensity of PEX3-mRFP as a function of distance from the geometric cell center.
Oblique illumination imaging of motor proteins and microtubules in COS-7 cells
COS-7 cells were co-transfected with KIF5A(1-560)-mNG-FRB and mCherry-α-tubulin, and imaged within 48 hours. Images were taken using a ONI Nanoimager with oblique illumination (55.1° illumination angle), 1-2% 488 nm laser power, 6-8% 561 nm laser power, and 25 ms to 100 ms exposure times. High-frequency images for in situ kinesin motility (Figure S7A) were taken at 40 Hz.
Yeast dynein complex protein purification
Purification of the artificially dimerized (by glutathione-S-transferase, GST) minimal dynein motor fragment (GST-dyneinMOTOR-HaloTag) was performed as previously described [100]. Briefly, yeast cultures were grown in YPA supplemented with 2% glucose (for the intact dynein complex) or 2% galactose (for GST-dyneinMOTOR), harvested, washed with cold water, and then resuspended in a small volume of water. The resuspended cell pellets were drop frozen into liquid nitrogen and then lysed in a coffee grinder. After lysis, 0.25 volume of 4X lysis buffer (1X buffer: 30 mM HEPES, pH 7.2, 50 mM potassium acetate, 2 mM magnesium acetate, 10% glycerol, 0.2 mM EGTA, 1 mM DTT, 0.1 mM Mg-ATP, 0.5 mM Pefabloc SC) was added, and the lysate was clarified at 22,000 x g for 20 min. The supernatant was then incubated with IgG sepharose 6 fast flow resin (GE) for 1 hour at 4°C, which was subsequently washed three times in lysis buffer, and twice in TEV buffer (50 mM Tris, pH 8.0, 150 mM potassium acetate, 2 mM magnesium acetate, 1 mM EGTA, 0.005% Triton X-100, 10% glycerol, 1 mM DTT, 0.1 mM Mg-ATP, 0.5 mM Pefabloc SC). The protein was then incubated in TEV buffer supplemented with TEV protease for 1 hour at 16°C. Following TEV digest, the solution was collected, and the resulting protein solution was aliquoted, flash frozen in liquid nitrogen, and stored at −80°C.
In vitro motor ATPase assays
For in vitro motor protein ATPase assays, the EnzChek® Phosphate Assay Kit (#E-6646, ThermoFisher) was used. Pre-formed, taxol-stabilized microtubules and recombinant human kinesin (KIF5A) was purchased from Cytoskeleton™. A minimally processive, artificially dimerized yeast dynein fragment (GST-dynein331) was purified as described above. Motor protein assay buffer (MPAB: 30 mM HEPES, pH 7.2, 50 mM potassium acetate, 2 mM magnesium acetate, 10% glycerol) was prepared using Chelex-treated H2O to remove all metal ion contaminants. 10 µM taxol, 500 µM DTT, 200 µM MESG, 1 U/mL purine nucleoside phosphorylase, 2 mM ATP, 1 µM taxol-stabilized microtubules, and 1x buffered zinc solutions (as previously described [67]; detailed methods in Supplement) were added to MPAB, then plated into a 96 well plate. Plates were spun down at 2250 rpm for 2 minutes, then incubated at room temperature for 10 minutes. Plates were read on a Synergy HTX Multi-Mode Microplate Reader (BioTek), collecting absorbance at 360 nm every 10 seconds. Background phosphate release was measured for 5 minutes, then either 5 nM GST-dynein331 or 10 nM KIF5A was added to each well, and absorbance at 360 nm was read for an additional 10 to 20 minutes. A phosphate standard was collected as described in the EnzChek Phosphate Assay Kit.
In vitro microtubule-Zn2+ chelation assays
Pre-polymerized microtubules were purchased from Cytoskeleton™. Varying concentrations of microtubules were added to buffer (15 mM PIPES, 5 mM MgCl2, pH 7.0) supplemented with 10 µM taxol and 500 µM DTT. 1 µM ZnCl2 (prepared with Chelex-treated H2O) was then added and the reaction was incubated for 10 minutes. 1 µM FluoZin-3 tetrapotassium salt (ThermoFisher) was then added to each reaction, plated into a 96-well plate, and incubated at room temperature for 10 minutes. Fluorescence was measured using a Synergy HTX Multi-Mode Microplate Reader (BioTek), collecting fluorescence every 30 sec at 525 nm emission using a 488 nm excitation, for 5 minutes. As an internal control, 250 µM TPEN was added to each well to chelate all Zn2+ and plates were measures for 20 minutes, or until a fluorescent minimum plateau was reached. Data was normalized by subtracting the minimum post-TPEN fluorescence.
In situ agonist-induced Zn2+-permeability assays
For agonist-induced TRPML1 Zn2+ permeability assays, HeLa cells were co-transfected with GZnP3 and mCherry-TRPML1WT, mCherry-TRPML1DDKK, or mCherry-TRPML1 with MLIV patient mutations (F408Δ, D362Y, R403C, T232P, V446L, L447P, C463Y, or F465L), and imaged after 48 hours. Cells were imaged for a 5 minute baseline, then treated with 100 µM ZnCl2 for 5 minutes, then treated with 50 µM ML-SA1 for 5 minutes. Images were acquired every 10 seconds with a 200 ms exposure of 488 nm laser excitation at 10 mW power.
Data analysis and statistics
Imaging data were analyzed with Fiji (ImageJ, National Institutes of Health) and raw data output from Fiji were analyzed using Excel in combination with JMP software (JMP®, Version 13.0. SAS Institute Inc., Cary, NC), and Mathematica (Wolfram Research, Inc., Version 12.1, Champaign, IL (2020)). Statistical analysis was performed using Excel or JMP software, using the appropriate statistical tests. All unpaired t-tests were preceded by an F-test to analyze variance equality. t-tests were then performed with consideration for the determined variance equality or inequality. Least-squares regression with comparisons across all groups used restricted maximum likelihood estimation (REML) and post-hoc multiple comparisons used Tukey HSD. All measurements were taken from distinct samples. No region of interest (ROI) was measured repeatedly. When selecting a ROI in the soma for cytosolic sensors that were also present in the nucleus, care was taken to avoid selecting nuclear areas. For time traces of fluorescence intensity, background fluorescence was subtracted from ROIs. For single wavelength sensors, changes in fluorescence intensity (ΔF = F−F0) were normalized to the baseline preceding the 0 second time point (F0), indicated as ΔF/F0. For FRET sensors, images were acquired for both the acceptor and donor emission wavelengths, and the changes in the ratio of acceptor to donor emission was calculated for each time point (ΔR = R−R0). Again, these signals were normalized to the baseline preceding the 0 s time point (R0), indicated as ΔR/R0.
Supplemental Figures

Analysis of lysosomal motility in primary cultured rat hippocampal neurons expressing LAMP1-mCherry and either TRPML1WT or TRPML1DDKK. Representative kymographs (left) and measured tracks (identified using KymoButler [5], right) of LAMP1-mCherry motility along an axon treated at 5 minutes with 10 µL DMSO for TRPML1WT (A) and TRPML1DDKK (B). (C) Time trace of mean instantaneous speed (±SEM) of tracked lysosomes in neurons expressing TRPML1WT (blue) or TRPML1DDKK (purple) treated as in (A) and (B). (D) Mean speed of retrograde- and anterograde-moving lysosomes in neurons expressing TRPML1WT (blue) or TRPML1DDKK (purple) prior (“baseline”, dots; 0 to 300 sec) and subsequent to addition of DMSO (open markers; 300 to 600 sec). Two-tailed paired t-tests (WT, n = 4 axons from 3 independent experiments; DDKK, n = 3 axons from 3 independent experiments). (E) Time trace of instantaneous directional proportion of tracked lysosomes that are stationary (magenta), moving retrograde (blue), or moving anterograde (green), in neurons expressing TRPML1WT (solid lines) or TRPML1DDKK (dotted lines) for baseline and ML-SA1 treatment. Mean proportion of lysosomes moving in the indicated directions prior to addition of DMSO (“baseline”, dots) or subsequent to its addition (open markers) for neurons expressing (F) TRPML1WT (G) TRPML1DDKK (WT, n = 4 axons from 3 independent experiments; DDKK, n = 3 axons from 3 independent experiments). Two-tailed paired t-tests. All experiments were performed in the absence of extracellular Ca2+. n.s. not significant.

Velocity data and fluorescent measurements were taken from the same axon motility experiments from Figure 4D–G.

(A) Representative kymographs (left) and measured tracks (identified using KymoButler; right) of mito-mCherry motility along axons from primary cultured rat hippocampal neurons prior to (“baseline”; top) or after initiation of Zn2+ influx by high K+ depolarization (middle-top), following washout and addition of 100 µM TPEN (middle-bottom), and then washout and addition of 100 µM Zn2+ and 2.5 µM PTO (bottom). (B) Mean instantaneous speed (±SEM) of mitochondria moving retrograde (blue) or anterograde (green) across baseline, Zn2+ influx by high K+ depolarization, TPEN, and Zn2+ + PTO treatment (60-second binned, representing 7 axons). (C) Mean speed (±SEM) of mitochondria moving in the indicated directions for each condition (n = 7 axons from 3 independent replicates). (D) Proportions of mitochondria moving in the indicated directions across baseline, depolarization, TPEN, and Zn2+ + PTO treatment (60-second binned, representing 7 axons). (E) Mean proportions of mitochondrial motility for each condition. (F) Mean instantaneous speed (±SEM) of lysosomes moving retrograde (blue) or anterograde (green) across baseline, Zn2+ influx by high K+ depolarization, following washout and addition of 100 µM TPEN, and then washout and addition of 100 µM Zn2+ and 2.5 µM PTO (bottom). (60-second binned, representing 6 axons). (G) Mean speed (±SEM) of lysosomes moving in the indicated directions for each condition (n = 6 axons from 3 independent replicates). (H) Proportions of lysosomes moving in the indicated directions across baseline, Zn2+ influx by high K+ depolarization, TPEN, and Zn2+ + PTO treatment (60-second binned, representing 6 axons). All experiments were performed in the absence of extracellular Ca2+. **** p < 0.0001, *** p < 0.001, ** p < 0.01, * p < 0.05, n.s. not significant.

(A and C) Representative lysosomal (A) and mitochondrial (C) motility (determined using the Total Motility plugin [6] for Fiji; see Methods) in HeLa cells treated with 20 µM ZnCl2 and 1.25 µM pyrithione (PTO), then washed and treated with 100 µM TPEN (treatments added at time points indicated on plots). (B and D) Mean (±SEM) lysosomal (B) and mitochondrial (D) motility normalized to their respective baselines (n = 4 and 5 cells, from 4 and 3 independent replicates, respectively). One-way repeated measures ANOVA, with post-hoc Tukey HSD. All experiments were performed in the absence of extracellular Ca2+. *** p < 0.0001, ** p < 0.01, * p < 0.05, n.s. not significant.

(A) Representative traces of lysosomal motility (determined using the Total Motility plugin for Fiji; see Methods) in HeLa cells stained with LysoTracker Red and treated with 2.5 µM pyrithione and either 20 µM CuCl2 (teal lines) or 20 µM ZnCl2 (black line) at 0 sec. All experiments were performed in the absence of extracellular Ca2+.
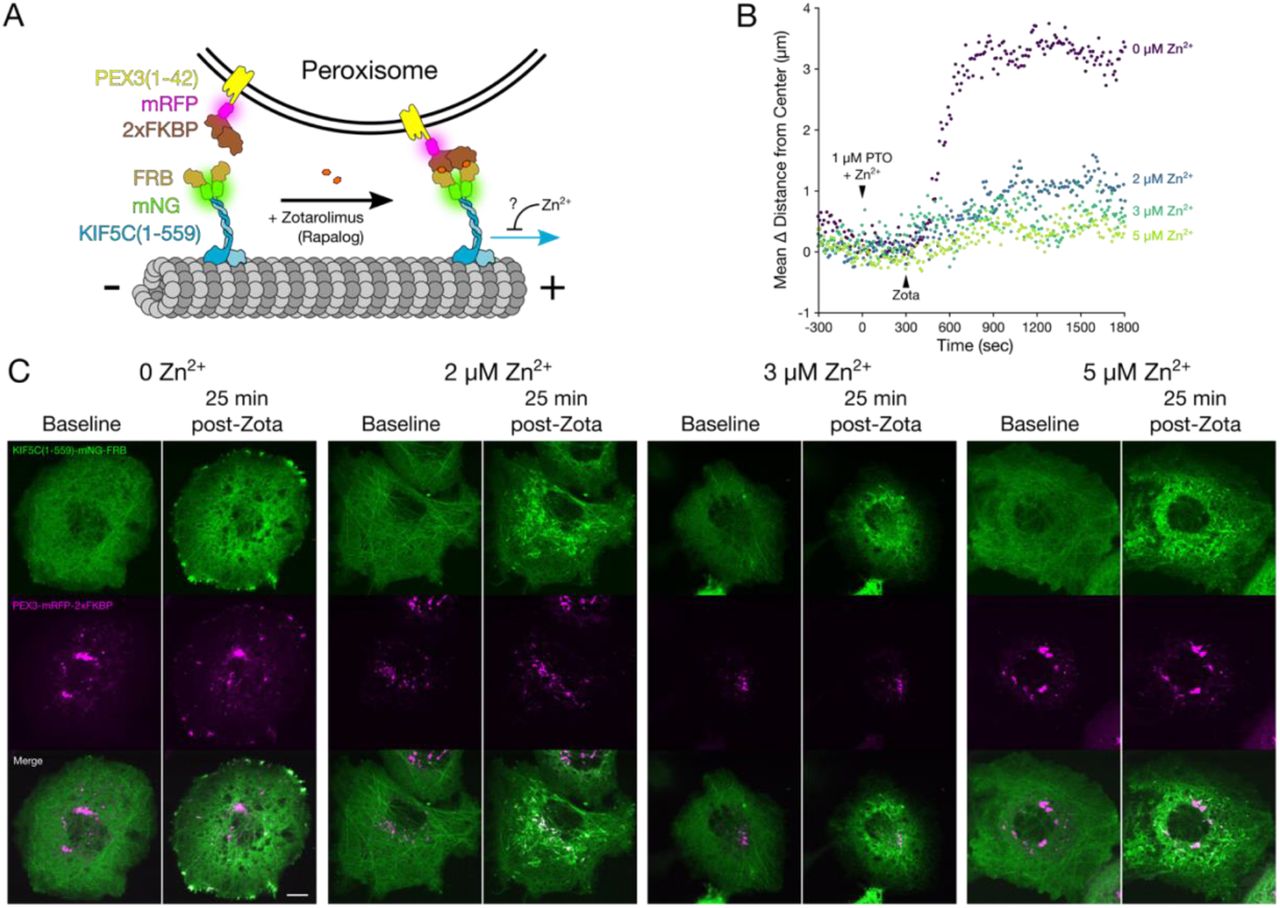
(A) Cartoon schematic of the components of the peroxisome dispersion assay. (B) Representative plots of mean change in peroxisome distance from the cell center over time, for COS-7 cells expressing KIF5C(1-559)-mNG-FRB and PEX3-mRFP-2xFKBP, treated at 0 sec with 1 µM PTO and various concentrations of Zn2+ (none, purple; 2 µM, blue; 3 µM, teal; or 5 µM, lime), and 100 nM Zotarolimus (“Zota”) at 300 sec. (C) Representative micrographs of COS-7 cells expressing KIF5C(1-559)-mNG-FRB (green, top), PEX3-mRFP-2xFKBP (magenta, middle), or merged channels (bottom), at 0 seconds (“baseline”) or 25 minutes after treatment with 100 nM Zotarolimus (“post-Zota”) in the presence of the indicated Zn2+ concentrations. Scale bar = 10 µm. All experiments were performed in the absence of extracellular Ca2+.

(A) Kymographs of KIF5A(1-560)-mNG-FRB motility along mCherry-α-tubulin tagged microtubules in COS-7 cells, during baseline (top) and after the addition of 2.5 µM PTO without Zn2+ (left) or with 20 µM Zn2+ (right). Experiments were performed in the absence of extracellular Ca2+. (B-C) Representative microtubule-stimulated ATPase activity showing non-normalized ATPase activity per motor domain per second for purified (B) recombinant human kinesin (KIF5A) or (C) a minimally processive, artificially dimerized yeast dynein fragment (GST-dynein331) across a range of Zn2+ concentrations (from same dataset as Figure 6F–G).
Supplemental Video Captions
Video S1: Activation of TRPML1 inhibits axonal lysosome motility. LAMP1-mCherry labeled lysosomes moving along axons of primary rat hippocampal neurons expressing TRPML1WT during baseline and ML-SA1 treatment. Related to Figure 1.
Video S2: Activation of TRPML1DDKK has no effects on lysosomal motility. LAMP1-mCherry labeled lysosomes moving along axons of primary rat hippocampal neurons expressing TRPML1DDKK during baseline and ML-SA1 treatment. Related to Figure 1.
Video S3: Depolarization-induced influx of Zn2+ arrests axonal transport of lysosomes. LAMP1-mCherry labeled lysosomes moving along axons of primary rat hippocampal neurons during baseline, depolarization induced Zn2+ influx (High K + Zn2+), and washout followed by TPEN treatment. Related to Figure 3.
Video S4: Depolarization-induced influx of Ca2+does not inhibit axonal transport of lysosomes. LAMP1-mCherry labeled lysosomes moving along axons of primary rat hippocampal neurons during baseline, depolarization induced Ca2+ influx (High K + Ca2+), and washout. Related to Figure 3.
Video S5: Zn2+ influx arrests axonal transport of mitochondria. mito-mCherry labeled mitochondria moving along axons of primary rat hippocampal neurons during baseline, depolarization induced Zn2+ influx (High K + Zn2+), washout followed by TPEN treatment, and washout followed by Zn2+ and pyrithione (PTO) treatment. Related to Figure S3.
Video S6: Zn2+ inhibits organellar motility with nanomolar IC50 in HeLa cells. Simultaneous imaging of Zn2+ (using GZnP3 sensor) and either lysosome (LAMP1-mCherry) or mitochondria (mito-mCherry) motility in HeLa cells. Related to Figure 4.
Video S7: Zn2+ inhibits KIF5A movement in situ in a dose dependent manner. Peroxisome dispersion assays in COS-7 cells expressing KIF5A(1-560)-mNG-FRB and PEX-mRFP-2xFKBP, during baseline, treatment with pyrithione (PTO) and varying concentrations of Zn2+, and subsequent treatment with Zotarolimus. Related to Figure 5.
Video S8: Zn2+ redistributes KIF5A in COS-7 cells. Distribution of KIF5A(1-560)-mNG-FRB and mCherry-α-tubulin in COS-7 cells during baseline and after Zn2+ and pyrithione (PTO) treatment. Related to Figure 6.
Acknowledgments
This work was funded by the NIH (R01NS110590 to Y.Q.; R01GM118492 and R35GM139483 to S.M.M; R01 GM132610 to W.L.; R35GM131744 to K.V.)
Footnotes
↵* Yan Qin: Email: yan.qin{at}du.edu
Competing Interest Statement: The authors declare no competing interest.
References
- 1.↵
- 2.↵
- 3.↵
- 4.↵
- 5.↵
- 6.↵
- 7.↵
- 8.↵
- 9.↵
- 10.↵
- 11.↵
- 12.↵
- 13.↵
- 14.↵
- 15.↵
- 16.↵
- 17.↵
- 18.↵
- 19.↵
- 20.↵
- 21.↵
- 22.↵
- 23.↵
- 24.↵
- 25.↵
- 26.↵
- 27.↵
- 28.↵
- 29.↵
- 30.↵
- 31.↵
- 32.↵
- 33.↵
- 34.↵
- 35.↵
- 36.↵
- 37.↵
- 38.↵
- 39.↵
- 40.↵
- 41.↵
- 42.↵
- 43.↵
- 44.↵
- 45.↵
- 46.↵
- 47.↵
- 48.↵
- 49.↵
- 50.↵
- 51.
- 52.↵
- 53.↵
- 54.↵
- 55.↵
- 56.↵
- 57.↵
- 58.↵
- 59.↵
- 60.↵
- 61.↵
- 62.↵
- 63.↵
- 64.↵
- 65.↵
- 66.↵
- 67.↵
- 68.↵
- 69.↵
- 70.↵
- 71.↵
- 72.↵
- 73.↵
- 74.
- 75.
- 76.
- 77.
- 78.
- 79.↵
- 80.↵
- 81.
- 82.
- 83.
- 84.↵
- 85.↵
- 86.↵
- 87.↵
- 88.↵
- 89.↵
- 90.↵
- 91.↵
- 92.↵
- 93.↵
- 94.↵
- 95.↵
- 96.↵
- 97.↵
- 98.↵
- 99.↵
- 100.↵


