

Abstract
Stomatal closure regulates transpiration and gas exchange in response to environmental cues. Drought upregulates ABA signaling, which elevates levels of reactive oxygen species (ROS). However, the subcellular location and identity of these ROS has received limited study. We found that in guard cells, ABA increased fluorescence of the general redox sensor, dichlorofluorescein (DCF), in distinct subcellular locations including chloroplasts, cytosol, nuclei, and cytosolic puncta. These changes were lost in an ABA-insensitive quintuple receptor mutant and accentuated in an ABA-hypersensitive mutant. ABA induced ROS accumulation in these subcellular compartments was lost in mutants with defects in genes encoding H2O2 elevating respiratory burst oxidase homolog (RBOH) enzymes and guard cells treated with the RBOH inhibitor VAS2870, while exogenous H2O2 treatment is sufficient to close guard cells. The H2O2-selective probe, peroxy orange 1, also showed ABA-dependent increases in chloroplasts and cytosolic puncta. Using the more sensitive genetically-encoded H2O2 reporter roGFP-Orp1, we also detected significant H2O2 increases in the cytosol and nucleus. These cytosolic puncta accumulate ROS after ABA treatment and show colocalization with Mitotracker and with a mitochondrial targeted mt-roGFP2-Orp1, which also reports ABA-increased H2O2 in mitochondria. These results indicate that elevated H2O2 after ABA treatment in these subcellular compartments is necessary and sufficient to drive stomatal closure.
Introduction
Drought stress negatively impacts plant growth due to excess water loss, which is a growing concern for crop yields as a result of global climate changes that include increased drought (Fahad et al., 2017). Stomatal closure reduces excess water loss, but can limit CO2 entry thereby negatively impacting the photosynthetic rate (Lamaoui, Jemo, Datla, & Bekkaoui, 2018). Due to this tradeoff, stomatal aperture must be tightly controlled (Nilson & Assmann, 2007). Reduction in guard cell turgor to close stomata is mediated by the drought hormone abscisic acid (ABA), which signals in guard cells during states of decreased water availability (Li, Wang, Liu, Pei, & Shi, 2017; Qi et al., 2018; Qu et al., 2018; Tõldsepp et al., 2018; Xu, Jiang, Jia, & Zhou, 2016).
The binding of ABA to the PYR/PYL/RCAR family of soluble receptors initiates ABA signaling (Park et al., 2009). The ABA bound receptors form a complex with Clade A protein phosphatases type 2C (PP2Cs), which negatively regulate ABA signaling in the absence of the hormone (Hsu, Dubeaux, Takahashi, & Schroeder, 2021). Formation of this complex inhibits PP2C activity, releasing the negative regulation of the pathway (Ma et al., 2009; Nishimura et al., 2010; Park et al., 2009). Reduced phosphatase activity allows for increased phosphorylation of a variety of proteins including Sucrose nonfermenting Related Kinase 2 family members (SnRK2s) (Takahashi et al., 2020). Active SnRK2s can then initiate a signaling cascade through phosphorylation of a number of downstream targets including Respiratory Burst Oxidase Homologs (RBOH) enzymes, also called NADPH oxidase (NOX) enzymes (Sirichandra et al., 2009). Consistent with RBOH activation, ROS accumulation in guard cells following ABA treatment has been observed in multiple plant species (Kwak et al., 2003; Pei et al., 2000; Watkins, Chapman, & Muday, 2017; Watkins, Hechler, & Muday, 2014). These elevated ROS act as second messengers to activate guard cell ion channels ultimately resulting in increased K+ efflux and the reduction of guard cell turgor, which leads to stomatal closure (Demidchik, 2018; Geiger et al., 2009).
ROS bursts resulting from RBOH activation have been characterized in plants in response to a myriad of developmental and environmental signals (Chapman, Muhlemann, Gayomba, & Muday, 2019). These enzymes function in the production of extracellular superoxide through the transfer of electrons from NADPH or FADH2 to molecular oxygen (Suzuki et al., 2011). Superoxide may be rapidly converted to H2O2 spontaneously or by enzymatic means via superoxide dismutases (Fukai & Ushio-Fukai, 2011). Extracellular H2O2 may then enter plant cells through plasma membrane localized aquaporins (Bienert et al., 2007; Rodrigues et al., 2017; Tian et al., 2016). The Arabidopsis genome encodes 10 RBOH family members (RBOHA-RBOHJ) with distinct expression patterns and functions that regulate a variety of developmental and cellular processes (Chapman et al., 2019). Genetic approaches have identified a role of RBOHF during ABA-induced stomatal closure (Kwak et al., 2003). Both the rbohf single mutant and the rbohd/f double mutants had reduced ABA-driven increase in redox state and stomatal closure as compared to wild-type guard cells (Kwak et al., 2003).
ROS, most notably hydrogen peroxide (H2O2) and superoxide, play critical roles in signaling cascades in numerous organisms including plants (Foyer & Noctor, 2020). Prior studies examining ABA-dependent increases in ROS accumulation have largely examined changes in fluorescence of dichlorofluorescein (DCF) (An, Liu, Chen, & Wang, 2016; Kwak et al., 2003; Pei et al., 2000; Wu et al., 2017; X. Zhang et al., 2001). However, since DCF is a general redox sensor, information on which types of ROS are increased by ABA cannot be inferred from this sensor (Winterbourn, 2014). Additionally, the types of imaging used in previous studies prevented identification of the subcellular locations where these ROS increase during ABA signaling. Enzymes in plant cells that produce ROS in multiple subcellular locations have been identified (Noctor & Foyer, 2016). Insight into the subcellular localization of where ROS accumulates after ABA treatment, as well as the type of ROS that are increased are needed to understand how these molecules function in ABA signaling (Gadjev et al., 2006). Recent technological advances in both microscopic resolution and detection of ROS using chemical or genetically encoded sensors (Nietzel et al., 2019; Ugalde, Schlößer, Dongois, Martinière, & Meyer, 2021; Winterbourn, 2014) have provided the ability to gain better insight into this spatial accumulation of different ROS species in response to environmental stresses like ABA.
This study examined how ABA affects the accumulation and localization of H2O2 within Arabidopsis guard cells during the ABA response and how each of these intracellular compartments contribute to total ROS changes during stomatal closure. The subcellular distribution of the general redox sensor, DCF, was examined across multiple subcellular locations including the guard cell chloroplasts, cytosol, nuclei, and puncta within the cytosol. To verify that the changes in ROS were directly tied to ABA signaling, we examined how mutations that block ABA signaling or accentuate signaling affect DCF fluorescence. Both Peroxy Orange 1, a chemical probe selective for H2O2, and the roGFP2-Orp1 genetically encoded sensor were used to ask whether H2O2 increased and in what locations. To identify the cellular localization of puncta we used a GFP construct targeted to peroxisomes, dyes targeted to mitochondria and a genetically-encoded H2O2 biosensor targeted to the mitochondrial matrix to reveal the mitochondrial character of these puncta. Genetic approaches and hydrogen peroxide treatment reveal that localized ROS accumulation in guard cells is both necessary and sufficient for stomatal closure.
Results
ABA Significantly Increases DCF Fluorescence in Arabidopsis Guard Cells
To verify ABA-induced redox changes within Arabidopsis guard cells, we monitored fluorescence intensity changes using multiple ROS-responsive fluorescent probes. We began with CM 2,7-dihydrodichlorofluorescein diacetate (CM H2DCF-DA), which is a frequently utilized fluorescent chemical probe to monitor changes in redox state (Halliwell & Whiteman, 2004). CM H2DCF-DA diffuses across the plasma membrane, where it is trapped within the cell after cleavage by cellular esterases (Swanson, Choi, Chanoca, & Gilroy, 2011). The probe is then converted to highly fluorescent DCF upon oxidation by cellular oxidants. Whole leaves of Col-0 were excised in the early morning and placed in a stomatal opening solution for 3 hr under white light to fully open stomata. This was followed by incubation with 20 µM ABA or a control treatment for 45 min. Treatments were then removed and leaf peels were incubated with CM H2DCF-DA for 15 min. Laser scanning confocal microscope (LSCM) images of guard cells with control or ABA treatment are shown in Figure 1A. The images of DCF fluorescence are shown directly and after conversion to lookup tables (LUT), which displays the range of fluorescence across these cells. Quantification of whole guard cell DCF fluorescence showed that ABA significantly increased guard cell oxidation state during ABA-induced stomatal closure (Figure 1B).

ABA increases DCF fluorescence within Arabidopsis guard cells.
A) Confocal micrographs of DCF fluorescence of Arabidopsis guard cells treated with buffer control or 20 µM ABA shown directly or after conversion to lookup tables (LUT). Scale bar: 20µm. B) Quantifications of DCF fluorescence in the entire guard cell with and without ABA treatment in 30-50 whole stomata per treatment from three separate experiments. Each individual value is shown with the average as well as lower and upper quartiles indicated. P-values from paired student t-tests for samples compared to untreated controls are reported.
ABA Signaling Mutants Display Differences in Guard Cell ROS Accumulation
To determine whether the increased DCF accumulation seen following ABA treatment occurred via the canonical ABA signaling pathway, we examined two Arabidopsis mutant lines that have altered ABA sensitivity. An ABA receptor quintuple mutant pyl1-1; pyr1-1; pyl4-1; pyl5; pyl8-1 (abbreviated pyl-11458) which has impaired ABA sensitivity (L. Zhang et al., 2020) and ABA overly sensitive 6 (abo6), which displays increased ABA response in primary root inhibition linked to a mutation in a mitochondrial DEXH box RNA helicase (J. He et al., 2012). To examine ABA sensitivity in both of these genotypes, we compared stomatal closure in Col-0, pyl-11458, and abo6 guard cells following treatment with ABA. Leaves were excised and peeled and then covered with stomatal opening buffer for 3 hrs as described previously. Epidermal peels were then treated with 20 μM ABA or control buffer for 45 min and guard cells were immediately imaged (Fig. 2A). Stomatal apertures of at least 90 stomata per genotype for each time point were quantified over three separate experiments (Figure 2B). Initial apertures after incubation in opening solution were not significantly different between Col-0, pyl-11458, and abo6. Consistent with altered ABA response in these mutants, pyl-11458 showed a significant reduction in ABA-dependent closure, while abo6 showed a significant increase in ABA dependent closure relative to Col-0.
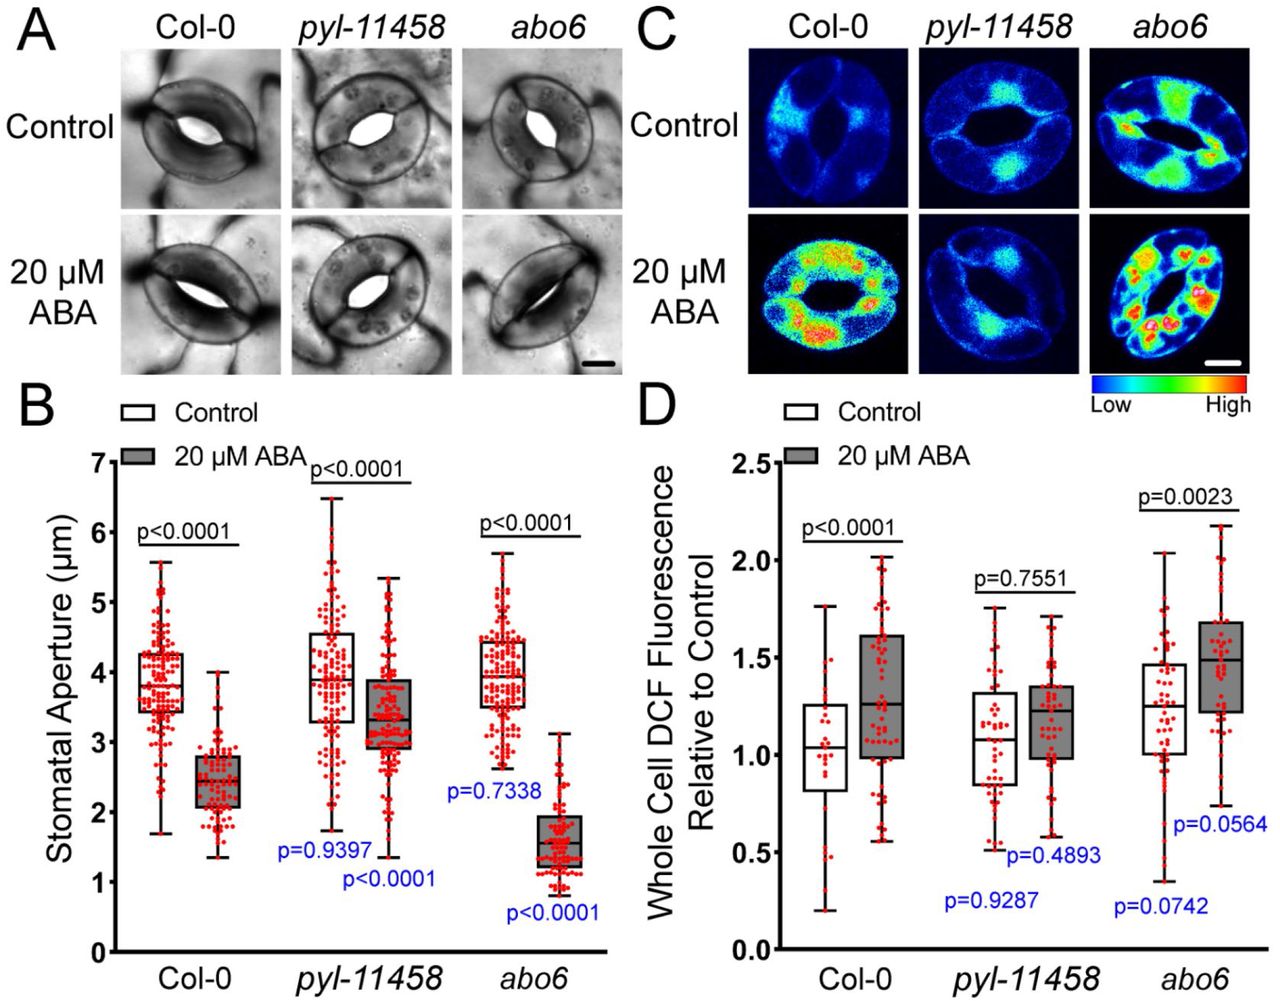
ABA signaling mutants have altered ABA-dependent guard cell closure and differences in DCF fluorescence. A) Stomatal apertures of leaves of Col-0, the pyl-114588 quintuple mutant (pyr1;pyl1;pyl4;pyl5;pyl8), and abo6 are shown following ABA treatment for 45-min. B) Stomatal apertures of Col-0, pyl-114588, and abo6 leaves were quantified with and without ABA treatment for 45 min. C) Confocal micrographs of DCF fluorescence converted to lookup tables (LUT) of Col-0, pyl-114588, and abo6 cells treated with buffer or 20 µM ABA. D) Quantifications of DCF fluorescence in the entire guard cell of each genotype with and without ABA treatment from three separate experiments. The p-values in black font shown above the bar in B and D represent the statical significance of differences between treatments in the same genotype. The p-values in blue font shown below the bars represent differences between mutant genotypes and Col-0 under similar treatments. The reported p-values are from a one-way ANOVA followed by Tukey’s post hoc test from three separate experiments examining 50-62 stomata/sample. Scale bar: 5µm.
We also examined ABA-dependent DCF fluorescence increases in these mutants under the same conditions described above and images of DCF fluorescence converted to LUT are shown in Figure 2C. Under control conditions, guard cells of pyl-11458 and abo6 had similar levels of DCF fluorescence to Col-0 (Figure 2C-D). However, the significant increase in whole guard cell DCF fluorescence following ABA-treatment in Col-0 was absent in the pyl-11458 mutant, consistent with its impaired stomatal closure. In contrast, treatment of abo6 with ABA increased DCF fluorescence in this mutant to levels that were significantly higher than Col-0 guard cells under the same treatment conditions, suggesting that enhanced ROS accumulation in this mutant drives the enhanced stomatal closure response. These findings are consistent with ABA signaling driving ROS increases in guard cells and with the degree of ABA sensitivity being directly correlated with the amount of ROS production in these genotypes.
ABA Drives Compartmentalized ROS Increases within Guard Cells
The images in Figure 1A and 2C suggest that ABA increases DCF signal in a range of distinct subcellular localization. We therefore performed higher resolution imaging of individual guard cells to identify where within the cell ABA increases ROS. Figure 3A reveals that ABA treatment increased DCF fluorescence within multiple subcellular regions. The DCF signal increases in the chloroplast and nucleus were verified through spectral unmixing of the DCF signal from chlorophyll autofluorescence and DAPI fluorescence, respectively (Figure 3-figure supplement 1A-B) ** Note to reviewer: All figure supplements can be found at the end of this document**. DCF fluorescence is largely excluded from the vacuole, but there are increases in DCF signal after ABA treatment in the cytosol and small cytosolic punctate structures. To determine how each of these subcellular regions contribute to overall ROS changes, we quantified increases in each of these locations. Following 20 µM ABA treatment, we observed the largest increase within the chloroplasts at 1.8-fold over untreated guard cells (Figure 3B). We also observed significant increases in other locations with a 1.3-fold ABA-induced increase within guard cell nuclei (Figure 3C), a 1.4-fold cytosolic increase (Figure 3D), and a 1.5-fold increase in small punctate structures found in the cytosol (Figure 3E).
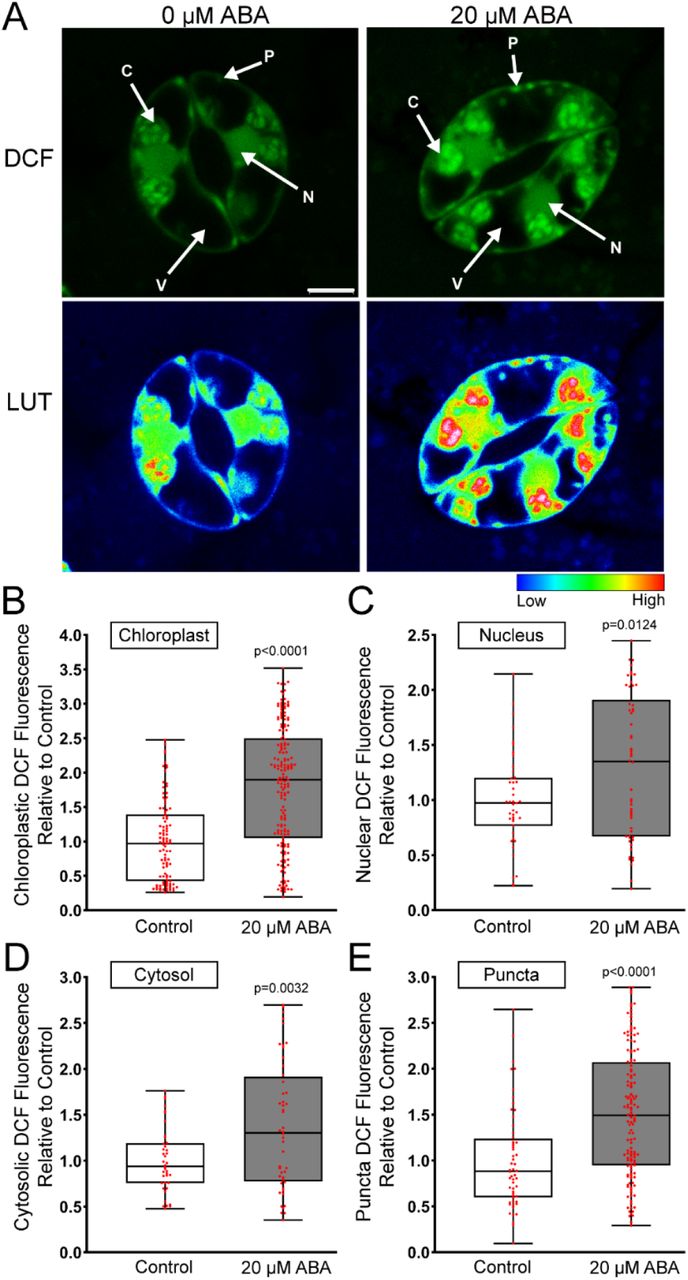
ABA increases DCF fluorescence in several locations within Arabidopsis guard cells.
A) Confocal micrographs of DCF fluorescence shown directly or after conversion to LUT for Arabidopsis guard cells treated with buffer or 20 µM ABA. Subcellular compartments are indicated on each image (C: Chloroplast, N: Nucleus, P: Puncta, V: Vacuole). Scale bar: 5µm. Quantifications of DCF fluorescence in the B) chloroplast, C) nucleus, D) cytosol and E) cytosolic puncta with and without ABA treatment from three separate experiments with each bar represented by (chloroplast n>100, nuclear n>48, cytosol n>48 and puncta n>56). The p-values were generated by student t-tests comparing ABA to control in each cellular location.
To determine whether the differences in DCF fluorescence between subcellular locations was a function of differential dye uptake rather than changes in redox state, we monitored uptake of a non-oxidizable variant of DCF, fluorescein diacetate (FDA). This probe displayed the same localization as DCF (Figure 3-figure supplement 1C), which is consistent with increases in DCF fluorescence that proceed ABA treatment being due to changes in redox state and not differential dye uptake. These data suggest that ABA increased ROS in many intracellular locations within guard cells. As RBOH enzymes have been implicated in ABA-induced ROS accumulation, we next asked whether ABA-induced ROS increases in all of these subcellular locations are dependent on RBOH enzymes.
Mutants Deficient in rbohd and rbohf Have Impaired ABA-Induced ROS Accumulation in Several Subcellular Locations
RBOH enzymes are well-characterized producers of signaling ROS that regulates a myriad of plant developmental processes and environmental responses (Chapman et al., 2019). To determine whether RBOH enzymes are required for the increase in ROS accumulation in the cytosol and other cellular localizations following ABA treatment, we examined DCF fluorescence in Arabidopsis mutants with defects in the genes encoding RBOHD and RBOHF, which were previously reported to function in ABA-induced stomatal closure (Kwak et al., 2003).
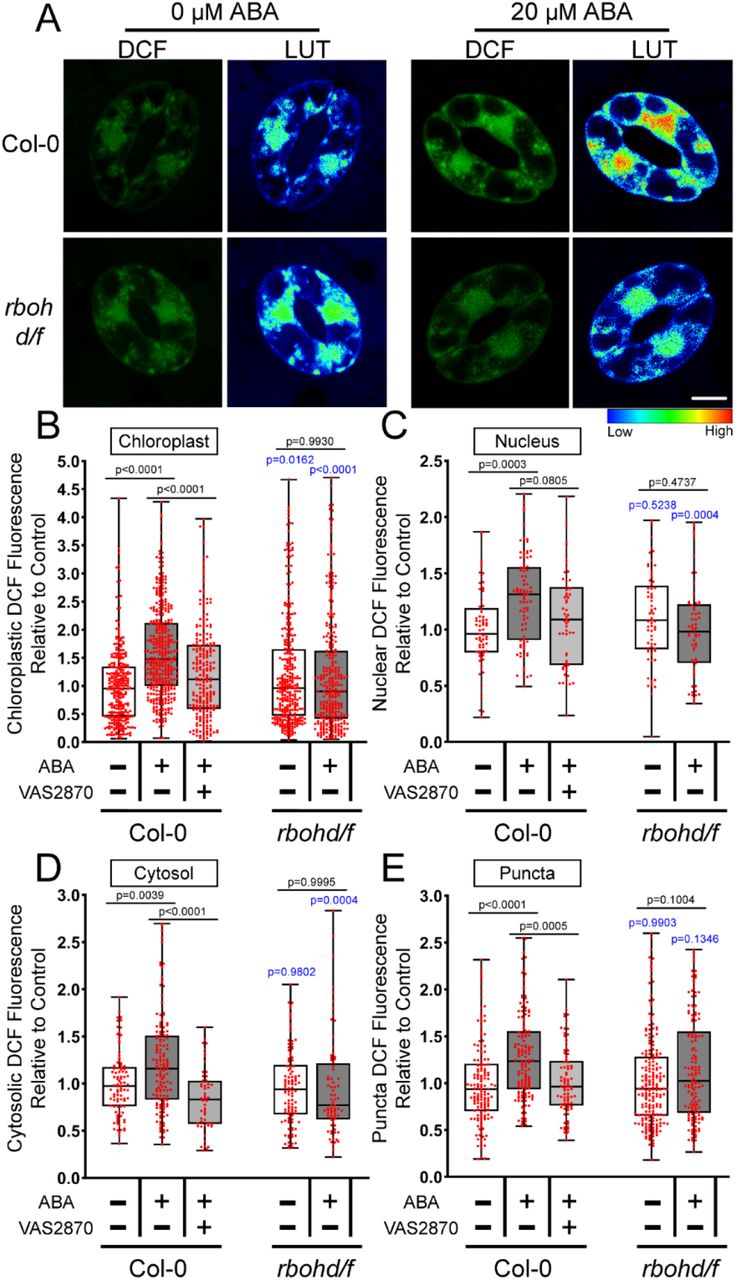
Figure 4A contains images of DCF fluorescence reported as lookup tables in Col-0 and the double mutant rbohd/f. The striking ABA-induced increase in nuclear DCF signal in Col-0 is clearly diminished in this mutant. To ask whether this effect is significant, as well as changes in chloroplast, cytosol, and puncta, we quantified DCF fluorescence in each of these locations. The rbohd/f double mutant not only exhibited reduced DCF accumulation in the cytosol following 20 µM ABA treatment for 45 minutes (as predicted by the known function of RBOH proteins in controlling cytosolic ROS), but we also observed a significant reduction in signal in chloroplasts, nuclei, as well as the cytosolic puncta (Figure 4B-E).

RBOH enzymes contribute to ABA-increased ROS accumulation in several subcellular localizations. A) Confocal micrographs of DCF fluorescence or DCF images converted to LUT of Col-0 or rbohd/f guard cells treated with buffer control or 20 µM ABA. Scale bar: 5µm. Quantifications of DCF fluorescence in the B) chloroplast, C) nucleus, D) cytosol and E) cytosolic puncta following treatment with control buffer, ABA, or pre-treated with VAS2870 and then treated with ABA from three separate experiments (chloroplast n>239, nuclear n>59, cytosol n>52 and puncta n>85). P-values in black font represent the significance of differences between treatments in the same genotype spanning the compared treatments. P-values in blue font representing the significance of differences between the indicated genotypes and Col-0. P-values are recorded according to one-way ANOVA followed by Tukey’s post hoc test.
We also utilized the pan NADPH-oxidase (NOX) inhibitor VAS2870. This compound selectively targets an active-site cysteine that is conserved in mammalian NOX enzymes as well as plant RBOHs (Yun et al., 2011). We confirmed that VAS2870 regulated ABA responses in guard cells by evaluating its effect on ABA-induced stomatal closure. Pre-treatment with 10 µM VAS2870 for 1 hr prior to ABA treatment was able to significantly inhibit ABA-dependent stomatal closure compared to guard cells treated with ABA alone, suggesting it is an effective RBOH inhibitor in guard cells (Figure 4-figure supplement 1C) and supporting the requirement of RBOH activity for full ABA-induced stomatal closure.
Pre-incubation with VAS2870 resulted in a significant dampening in the ABA-dependent DCF increase in the chloroplasts, although ABA still had a small, but significant effect on DCF signal in this organelle when compared to control guard cells (p=0.0155) (Figure 4B). VAS2870 abolished ABA-induced ROS increases in both the cytosol and puncta, while the ABA-increased DCF signal in the nucleus was not significantly different from control treated cells or those treated with ABA alone (Figure 4C-E). Altogether, these findings are consistent with RBOH enzymes driving ABA-dependent ROS accumulation in multiple subcellular compartments in Arabidopsis guard cells, which are required for guard cell closure. Since DCF is oxidized by multiple ROS, our next step was to use a dye with greater specificity toward H2O2, which plays an important role in cell signaling.
ABA Increases H2O2 in Subcellular Regions Including Chloroplasts and Cytosolic Punctate Structures to Induce Stomatal Closure
We utilized the H2O2-selective chemical probe Peroxy Orange 1 (PO1) to ask whether ABA increased H2O2. PO1 is a membrane-permeable, boronate-based probe that is non-fluorescent in its reduced form, which becomes fluorescent upon irreversible oxidation by H2O2. The spectral profile of PO1 was isolated and unmixed from leaf auto-fluorescence including chloroplasts and the signal in the absence and presence of 20 and 100 µM ABA is shown in Figure 5A. Treatment with 20 µM ABA did not result in a significant increase in whole guard cell PO1 signal (Figure 5-figure supplement 1B). To determine if higher concentrations of ABA were sufficient to stimulate H2O2 increases throughout guard cells, we increased concentration of ABA to 100 µM. Treatment with 100 µM ABA also resulted in no significant increases in PO1 fluorescence when quantifying the whole guard cell (Figure 5B). Examination of these confocal images suggests that some regions showed substantial PO1 signal increases, so we also quantified signal in subcellular locations.
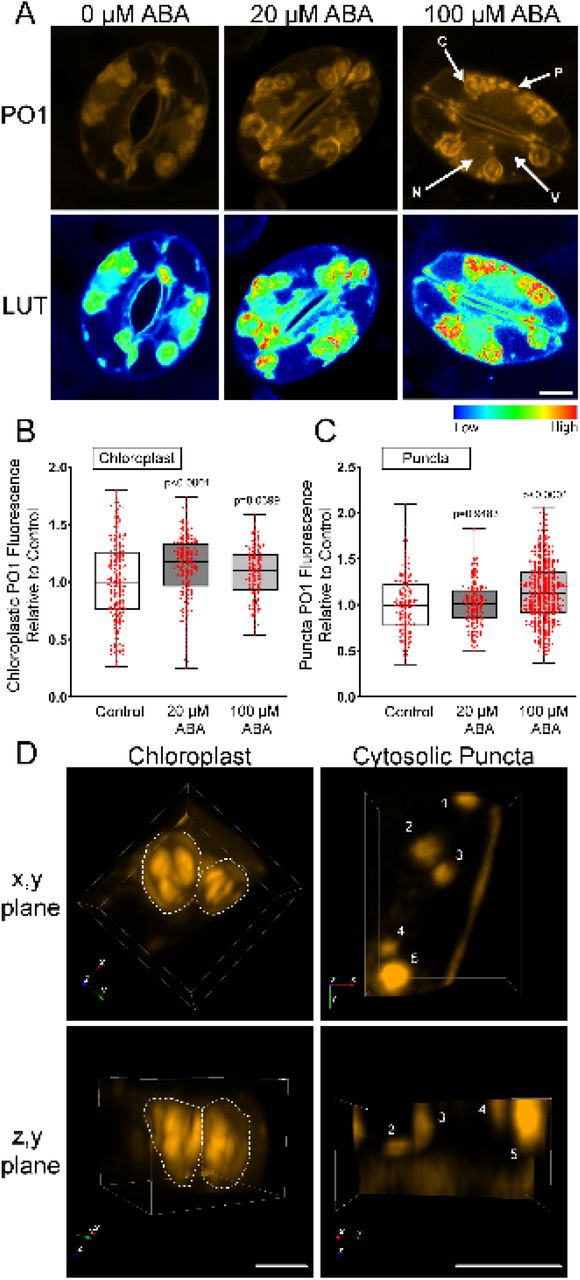
ABA increases PO1 fluorescence in guard cells. A) Confocal micrographs displaying PO1 fluorescence shown directly (top) or after conversion to LUT (bottom) after treatment with buffer or 20 µM or 100 µM ABA. Subcellular compartments are denoted as follows: (C: Chloroplast, N: Nucleus, P: Puncta, V: Vacuole). Scale bar: 5µm. Quantifications of PO1 fluorescence with and without ABA treatment in the B) chloroplast, C) cytosolic puncta. Data are reported from three separate experiments with a total of n>140 (chloroplasts) and n>148 (puncta). The p-values from a one-way ANOVA followed by a Tukey’s multiple comparisons test report differences to untreated controls. D) 3-dimensional renderings of PO1 fluorescence from a guard cell section displaying either a chloroplast or a cytosolic region containing punctate structures. Renderings are oriented in (x,y) plane or (z,y) plane to show depth. Scale bar: 3µm.
We quantified PO1 in the cytosol, nucleus, chloroplasts, and cytosolic puncta. Following treatment with 20 µM and 100 µM ABA, we observed significant increases in PO1 signal within guard cell chloroplasts. Treatment with 100 µM ABA (but not 20 µM ABA) also resulted in significant increases in PO1 signal within cytosolic puncta. In contrast to our results with DCF, after 100 µM ABA treatment, PO1 signal within the cytosol and nucleus were not significantly different from control treatments (Figure 3B). This raises the possibility that PO1 is not adequately taken up by all organelles within Arabidopsis guard cells, or that PO1 may not be sensitive enough to detect small changes in signaling H2O2. To verify that PO1 fluorescence is ROS responsive in all these locations, we treated guard cells with 250 µM exogenous H2O2 (Figure 5-figure supplement 2A). Treatment with exogenous H2O2 resulted in a 1.5-fold increase in nuclear PO1 fluorescence indicating that PO1 can be sufficiently taken up by Arabidopsis guard cell nuclei to detect large increases in H2O2 (Figure 5-figure supplement 2B). This raises the possibility that ABA-induced increases in H2O2 in guard cells may need more sensitive tools for their detection.
Additionally, the effect of this exogenous H2O2 treatment on guard cell closure was quantified in Figure 5-figure supplement 2B. This treatment was sufficient to close stomata after 30 minutes of treatment to levels consistent with ABA-dependent closure.
In the chloroplast, we observed ABA-induced PO1 accumulation into distinct structures within inner chloroplast compartments. However, two-dimensional images of maximum intensity projection make it difficult to discern if these are cytosolic puncta localized to the chloroplast membrane, or another structure entirely. Therefore, we created three-dimensional renderings of PO1 labeled guard cells to gain insight into chloroplast PO1 distribution. These renderings show that bright PO1 regions span the chloroplast and are not just on the surface, revealing a sophisticated ROS accumulation pattern with the chloroplast while the cytosolic puncta are circular structures with uniform PO1 signal. These findings suggest that these regions of more intense chloroplast PO1 fluorescence are different from cytosolic punctate structures in that they are entirely confined within chloroplasts and are of similar position and size to the accumulation of starch grains (Leshem & Levine, 2013) (Figure 5C).
The Genetically-Encoded ROS Biosensor roGFP2-Orp1 Showed Rapid ABA-Dependent H2O2 Increases Within Guard Cell Nuclei and Cytosol
The inability to identify increases in H2O2 in the cytoplasm using PO1 suggested that a more sensitive detection approach was needed. Therefore, we further evaluated changes in H2O2 using the genetically encoded biosensor, roGFP2 linked to yeast Orp1, which has enhanced sensitivity relative to chemical probes (Nietzel et al., 2019). In the presence of H2O2, the yeast peroxidase Orp1protein (also known as glutathione peroxidase 3) becomes oxidized to sulfenic acid (Cys-SOH) on a reactive cysteine residue that rapidly forms an intramolecular disulfide bond with a nearby cysteine. This disulfide is then efficiently transferred via thiol-disulfide exchange to a pair of cysteines on roGFP2, resulting in a conformational change that alters the optical properties of the fluorophore (Gutscher et al., 2009). When reduced, the sensor has increased signal intensity after excitation with the 488 nm laser line, while oxidation leads to elevated signal following 405 nm excitation. Therefore, dividing signal intensity after 405 nm excitation by intensity following 488 nm excitation provides a ratiometric readout which has an internal control for expression levels within a particular tissue. We excised fully mature Arabidopsis leaves containing roGFP2-Orp1 and placed epidermal leaf peals in stomatal opening buffer as described above. The process of generating an epidermal leaf peel is a mechanical stress, that increased roGFP2-Orp1 oxidation. We verified that incubation of the epidermal leaf peals in stomatal opening buffer for 4 hrs prior to any treatment returned oxidation to baseline levels, consistent with a prior report (Scuffi et al., 2018).
Stomatal opening buffer was then removed following equilibration and replaced with a similar solution containing 100 µM ABA or a control treatment for 45 min. The increase in oxidation as evidenced by increasing signal after ABA treatment is evident in Figure 6A. To demonstrate the dynamic range of this sensor, we treated with 20 mM DTT to reduce this protein, which leads to a low 405/488 fluorescence ratio (Figure 6C). In contrast, treatment with H2O2 increases protein oxidation leading to an elevated 405/488 fluorescence ratio. We quantified the effect of ABA treatment in roGFP2-Orp1 oxidation in whole stomata, which resulted in a 1.3-fold increase in oxidation ratio when compared to control guard cells (Figure 6A-B). This graph is shown with the dynamic range of the sensor as judged by DTT and H2O2 treatment defining the minimum and maximum. These data are consistent with ABA driving an increase in guard cell H2O2 during stomatal closure.

roGFP2-Orp1 is able to detect rapid bursts of within the guard cell cytosol and nuclei. A) Confocal micrographs of Arabidopsis guard cells expressing roGFP2-Orp1 treated with 100 µM ABA for 45 min. Ratiometric images display fluorescence ratios calculated from images taken using sequential excitation at 488 nm and 405 nm for each treatment group. B) Quantification of intracellular roGFP2-Orp1 ratios following 100 µM ABA or control treatment. Ratios are calculated by dividing fluorescence intensity collected at emission window 500-535 nm after excitation at 405 nm by the intensity collected in the same emission window after 488 nm excitation. Normalized ratios are then calculated relative to the 0 min timepoint. Data are reported from three separate experiments (n=42-57 whole stomata for each treatment). P-values were calculated from student t-test. C) Confocal micrographs of Arabidopsis guard cells expressing roGFP2-Orp1 treated with 100 µM ABA for 0, 15, 30, 45 min. Minimum and maximum sensor oxidation are shown by treatment with 20 mM DTT or 10 mM H2O2, respectively. Ratios are calculated as above. Normalized ratios are then created relative to the 0 min timepoint. D) Quantification of roGFP2-Orp1 ratio in the cytosol and E) nucleus following 100 µM ABA for 0, 15, 30, 45 min. Data are reported from three separate experiments (n>80 guard cells for each time point). Minimum and maximum sensor oxidation is represented on graphs by gray dashed lines. The significance of differences between indicated time points were determined by one-way ANOVA followed by a Tukey’s multiple comparisons test and are shown on the graph. Scale bar: 5µm.
To examine the temporal dynamics of H2O2 accumulation within the cytosol and nucleus following ABA treatment, we monitored oxidation shifts in guard cells transformed with roGFP2-Orp1 by drawing ROIs in these locations. Although this variant of roGFP2-Orp1 is targeted to the cytosol, the biosensor also shows signal in the guard cell nucleus (Babbar, Karpinska, Grover, & Foyer, 2021; Nietzel et al., 2019), allowing us to also monitor H2O2 changes in this organelle. Leaves expressing roGFP2-Orp1 were peeled and equilibrated in stomatal opening solution as described above. Opening buffer was then removed following equilibration and replaced with 100 µM ABA for 0, 15, 30, or 45 min (Figure 6C). Though roGFP2-Orp1 was still slightly oxidized in both the cytosol and nucleus after 4 hr incubation in stomatal opening solution, treatment with 100 µM ABA resulted in a significant increase in oxidation above baseline in both locations within 15 min (Figure 6D-E). ABA treatment led to continued oxidation of the sensor in a time-dependent manner, reaching a maximum of 1.3-fold increase over baseline in the cytosol and 1.4-fold in the nucleus at 30 min and with signal starting to return to baseline at 45 mins (Figure 6C-E). These results are consistent with increases in DCF signal observed in both the cytosol and nuclei after ABA treatment that are, at least in part, due to increases in H2O2 accumulation. Additionally, the kinetics of the increases in H2O2 after ABA treatment show similar kinetics to ABA-dependent stomatal closure.
ABA Treatment Results in DCF and PO1 Increases within Guard Cell Mitochondria
Both DCF and PO1 localized to small cytosolic punctate structures in addition to chloroplasts and nuclei. This subcellular pattern was also observed previously in tomato guard cells using the same chemical probes, although the identity of these structures was not examined (Watkins et al., 2017). These cytosolic puncta showed a striking 1.5-fold increase in DCF signal following 20 µM ABA treatment when compared to control treated guard cells (Figure 3E). PO1 fluorescence also increased in these structures, displaying a 1.2-fold increase in intensity following incubation with 100 µM ABA (Figure 5C). We used colocalization of chemical ROS probes with fluorescent organelle dyes and an organelle targeted GFP to ask whether these puncta are ROS producing peroxisomes or mitochondria.
To evaluate whether cytosolic ROS puncta were peroxisomes, we examined an Arabidopsis transgenic line with a GFP tagged with a type 1 peroxisomal targeting signal (GFP-PTS1) (Ramón & Bartel, 2010) (Figure 7A). GFP-PTS1 and PO1 have emission peaks that can be spectrally unmixed. We used the Zen colocalization module to draw ROIs around cytosolic punctate structures that did not overlay on a chloroplast (Figure 7B). Although the GFP-PTS1 signal accumulated into punctate structures within the guard cell cytosol, they did not colocalize with the puncta labeled with PO1 (Figure 7C)

ABA treatment results in increased ROS accumulation in cytosolic puncta that colocalize with mitochondria. A) Confocal micrographs of PO1 fluorescence (orange), chlorophyll autofluorescence (red), PO1 fluorescence and GFP-PTS1 (green), and a merged image. Maximum intensity projection of full z-stack is shown. B) Regions of interest used to generate weighted colocalization coefficient are circled in white, highlighting the absence of PO1 fluorescence colocalizing with GFP-PTS1 fluorescence. C) Colocalization graph generated with the ZEN Black colocalization module from regions of interest highlighting cytosolic puncta. D) Confocal micrographs of DCF fluorescence (green), chlorophyll autofluorescence (red), Mitotracker Red (magenta), and a merged image showing DCF colocalized with Mitotracker Red (white). Individual optical slices of the same guard cells are shown. E) Regions of interest used to generate weighted colocalization coefficient are circled in white, showing DCF fluorescence colocalizing with Mitotracker Red fluorescence. F) Colocalization graph generated with the ZEN Black colocalization module from regions of interest highlighting cytosolic puncta. Scale bars: 5µm.
To determine whether these puncta colocalize with mitochondria, we labeled Col-0 guard cells with Mitotracker Red prior to staining with CM H2DCF-DA. Figure 7D shows Mitotracker (magenta), DCF signal (green), and chlorophyll signal (red), separately and in an overlay. All of the DCF puncta appeared to contain Mitotracker red signal. To explore this apparent colocalization in greater detail, we drew ROIs around more than 40 DCF puncta (Figure 7E). Also, these structures display higher PO1 intensity than most other localizations which allowed us to use the lowest intensity puncta to define the colocalization threshold and generate a colocalization graph (Figure 7F). A majority of pixels in the designated ROIs contain both DCF and Mitotracker Red signals and we calculated the average weighted colocalization coefficient to be 0.96. These results are consistent with the punctate structures showing ABA-dependent redox changes being mitochondria.
ABA Treatment Increases the Oxidation of Mitochondrial Targeted roGFP2-Orp1
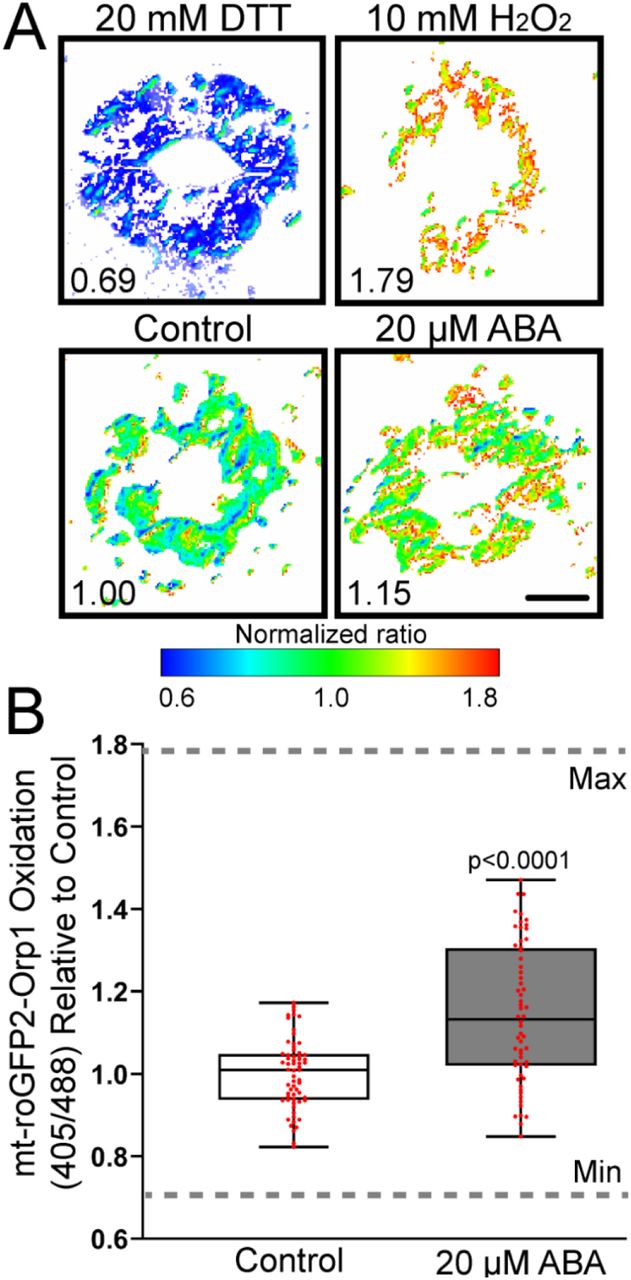
To confirm that ABA perception drives H2O2 accumulation in guard cell mitochondria, we examined a transgenic line expressing roGFP2-Orp1 specifically in the mitochondrial matrix (mt-roGFP2-Orp1) (Nietzel et al., 2019). To minimize oxidation due to generation of the leaf peel, we again equilibrated samples in stomatal opening solution for 4 hours before imaging. We again determined the dynamic range of this reporter using DTT to fully reduce the reporter and H2O2 to fully oxidize it, as shown in Figure 8A. It is evident that the signal of this reporter is dispersed in puncta throughout the cytosol, which is most evident in the H2O2 treated samples. This is consistent with the distribution of mitochondria revealed by Mitotracker Red.

roGFP2-Orp1 targeted to guard cell mitochondria shows ABA-dependent H2O2 increases. A) Confocal micrographs of Arabidopsis guard cells expressing mt-roGFP2-Orp1 treated with 100 µM ABA or control buffer for 45 min. Ratiometric images display fluorescence ratios calculated from separate images taken using sequential excitation at 488 nm and 405 nm for each time point. Ratios are calculated by dividing fluorescence intensity collected at emission window 500-535 nm after excitation at 405 nm by the intensity collected in the same emission window after 488 nm excitation. Scale bar: 5µm.B) Quantification of mt-roGFP2-Orp1 ratio in the entire guard cell following 100 µM ABA or buffer control for 45 min. Minimum and maximum sensor oxidation are shown by treatment with 20 mM DTT or 10 mM H2O2, respectively. Data are reported from three separate experiments (n>60 stomata). Minimum and maximum sensor oxidation is represented on graphs by gray dashed lines. Listed p-values were determined by one-way ANOVA followed by Tukey’s post hoc test.
Treatment with ABA resulted in a significant increase in this mitochondrial sensor 45 minutes after ABA treatment. (Figure 8B). The magnitude of the ABA-dependent oxidation of mt-roGFP2-Orp1 is less pronounced than the cytosolic sensor, but it is evident that the signal shows a broader range across the cell and mt-roGFP2-Orp1 oxidation state across the entire mitochondrial population may not be as uniform as previously seen in the sensor targeted to the cytoplasm (Figure 8A). Since GFP signal is easily unmixed from that of PO1 emission, we also used to this sensor to verify that PO1 labeled puncta were also identified as mitochondria through colocalization of these two signals (Figure 8-figure supplement 1). Altogether, these results are consistent with ABA-driven increases in H2O2 within guard cell mitochondria.
Discussion
Plants regulate stomatal aperture in response to environmental and hormonal signals through the control of guard cell turgor pressure (Nilson & Assmann, 2007). During drought stress, plants increase ABA synthesis (Boominathan et al., 2004), which initiates a complex signaling pathway that ultimately leads to stomatal closure (Vishwakarma et al., 2017). Included in this signaling cascade is the activation of RBOH enzymes that trigger a burst of ROS that act as second messengers in guard cell closure (Kwak et al., 2003). The accumulation of ROS following ABA treatment has been detected primarily by increases in DCF fluorescence, a nonspecific chemical ROS sensor, with signal quantified across the whole guard cell (Pei et al., 2000; Postiglione & Muday, 2020; Watkins et al., 2017; Watkins et al., 2014). However, technological advances in microscopic resolution as well as ROS detection, using both chemical and genetically encoded biosensors (Nietzel et al., 2019; Ugalde et al., 2021; Winterbourn, 2014), have allowed us to ask more precise questions to identify which ROS are elevated by ABA and where these ROS increases are found within guard cells. In this study, we use both ROS-responsive fluorescent dyes and genetically encoded biosensors combined with spectral unmixing and 3D rendering of Airy scans to demonstrate that ABA increases H2O2 within specific subcellular compartments in Arabidopsis guard cells and to understand the signaling and enzymatic machinery that drives synthesis of these ROS.
The ability of ABA to significantly increase ROS accumulation in Arabidopsis guard cells was confirmed using the generic ROS dye, CM H2DCF-DA. We used spectral unmixing to remove chloroplast autofluorescence and find that there are significant increases in DCF fluorescence that are temporally coincident with stomatal closure. To verify that these responses are directly tied to the canonical ABA signaling pathway we examined the response in the quintuple ABA receptor mutant pyl-11458. In this mutant ABA-induced guard cell closure and DCF fluorescence increases are reduced as compared to Col-0. In contrast in the abo6 mutant, which was isolated for elevated ABA signaling in roots, both ABA-induced DCF fluorescence and stomatal closure are enhanced. These findings tightly link ABA-elevated ROS in guard cells to stomatal closure.
Our images of DCF fluorescence reveal that ABA increases ROS in localized regions, suggesting that the ABA-dependent ROS increases may have precise spatial coordination. The changes in fluorescence intensity of the general ROS probe, DCF, was quantified in multiple subcellular regions including the cytoplasm and distinct puncta within the cytoplasm, as well as nuclei and chloroplasts. All of these locations showed significant increases in DCF signal in response to ABA, with the most striking increases observed in the chloroplast and cytosolic puncta. A critical question is what is the enzymatic machinery that drives these localized ROS accumulation patterns.
The ABA-dependent cytosolic increases in DCF fluorescence are consistent with prior reports that also suggested a role of RBOH enzymes in ROS signaling in guard cells (Drerup et al., 2013; Hsu et al., 2018; Kwak et al., 2003). ROS increases within the guard cell cytoplasm during ABA response have been observed previously in multiple reports (Postiglione & Muday, 2020). This ROS increase has been linked to RBOH enzymes using mutants in genes encoding RBOHD and RBOHF (Kwak et al., 2003) and relatively nonspecific RBOH inhibitor, Diphenyleneiodonium (DPI) (Watkins et al., 2017). RBOH enzymes have well established roles in hormone induced ROS synthesis in mammals (Vermot, Petit-Härtlein, Smith, & Fieschi, 2021) and plants (Chapman et al., 2019). These enzymes produce superoxide in the apoplast, which can be rapidly dismutated into H2O2 via superoxide dismutase. The influx of H2O2 into the cytoplasm is facilitated by aquaporins, making it available to reversibly oxidize cytoplasmic protein targets (Rodrigues et al., 2017; Tian et al., 2016). Yet, whether RBOH enzymes drive ROS accumulation in guard cells in regions beyond the cytoplasm has not been examined.
To better understand the mechanism behind cytoplasmic ROS increases during ABA response, we evaluated spatial localization of DCF in the rbohd/f double mutant and after treatment with a RBOH inhibitor. We quantified the levels of ROS in the cytoplasm of this rbohd/f double mutant and find that there is a significant decrease in ABA-induced DCF fluorescence in the cytoplasm of this mutant consistent with the established paradigm for this enzyme. Similarly, treatment with the RBOH specific inhibitor VAS2870 (Reis et al., 2020), reduces ABA-induced cytosolic ROS and ABA-dependent guard cell closure. Therefore, these approaches support the role of RBOH in regulating cytoplasmic ROS. Additionally, treatment with exogenous H2O2 was sufficient to lead to complete stomatal closure, indicating the requirement of RBOH induced ROS synthesis in stomatal closure.
We also examined the accumulation of DCF signal in chloroplasts, nucleus, and the cytosolic puncta. Intriguingly, in the rbohd/f double mutant and treatment with the highly specific VAS2870 inhibitor (Reis et al., 2020), the ABA-induced signal is significantly reduced in all three of these locations. This finding both emphasizes the role of RBOH in ABA-induced ROS, but also suggests that RBOH either directly or indirectly increases ROS in cellular locations beyond the cytosol, which is an important insight into the function of this class of signaling driven, ROS synthesizing enzymes. As RBOH activity can ultimately result in elevated levels of H2O2 within target cells, as described above, we wanted to verify that the ROS changes detected with DCF included increased H2O2.
We used two approaches to quantify H2O2 changes, examining both the H2O2-selective chemical probe, PO1 and the H2O2 responsive cytoplasmic targeted genetically-encoded sensor roGFP2-Orp1. This highly reactive biosensor contains a ratiometric readout which provides advantages over chemical dyes, which can be influenced by differences in dye uptake. Although, this reporter is limited in its ability to detect ROS changes in all cellular locations as its synthesis is targeted to specific compartments. PO1 reveals interesting subcellular ROS accumulation patterns with significantly increased signal in chloroplasts and cytosolic puncta in response to ABA. The chloroplast localization pattern of PO1 is not uniform, so we evaluated its distribution using three-dimensional rendering of these PO1 images. These reveal that the PO1 signal is not just on the surface of the chloroplasts but spans this organelle with uneven distribution consistent with localized accumulation within regions of the chloroplast. In contrast, the cytosolic puncta show uniform signal. Yet, we were unable to detect significant changes in PO1 in the cytosol even at higher doses of ABA. We therefore examined the highly sensitive genetically encoded roGFP2-Orp1 sensor.
The roGFP2-Orp1 genetically encoded ROS biosensor is a powerful new tool to record H2O2 changes in tissues to which it is targeted (Gutscher et al., 2009). It has a cysteine residue that is oxidized by H2O2 leading to a conformational change that changes its optical properties. When reduced, the sensor has elevated signal intensity following excitation with the 488 nm laser line, while oxidation leads to elevated signal following 405 nm excitation. The dynamic range of this sensor can be set by treating with DTT to fully reduce the sensor and H2O2 to fully oxidize it. Using this sensor, we reveal that ABA treatment leads to a significant increase in H2O2 when fluorescence in the whole guard cell is quantified and when the signal in the cytosol is quantified. This reporter has also been previously reported to accumulate in the nucleus in guard cells (Babbar et al., 2021) and we also detected ABA-increased ROS accumulation in the guard cell nucleus with this biosensor. This finding is consistent with ABA driving H2O2 increases the cytosol and nucleus of guard cells.
Treatment with ABA led to significant DCF and PO1 increases in cytosolic punctate structures, consistent with one prior report in tomato guard cells (Watkins et al., 2017). An important question is whether these puncta are distinct organelles. Therefore, we used colocalization approaches to ask whether these structures overlaid other ROS producing organelles, with a focus on peroxisomes and mitochondria. We observed extensive colocalization of DCF with the mitochondrial marker Mitotracker Red. In contrast we used a GFP reporter with a peroxisomal targeting signal and found no overlap with this signal. These results reveal that ABA may alter ROS status in mitochondria of guard cells, which has not been previously reported.
We utilized a mitochondria-targeted version of the genetically encoded roGFP2-Orp1 to ask whether ABA-increased H2O2 could also be detected in mitochondria. The mitochondrial targeted mt-roGFP2-Orp1 (Nietzel et al., 2019) was examined to validate the surprising ROS increases in this organelle. We then quantified the oxidation state of whole guard cells expressing this reporter in response to ABA treatment, revealing a statistically significant increase in reporter oxidation in guard cells treated with 100 µM ABA. We also stained leaves containing this sensor with PO1 and found that the cytosolic puncta labeled with PO1 displayed strong colocalization with mt-roGFP2-Orp1. This is an exciting new finding linking ABA signaling to the mitochondria in guard cells.
The linkage between ABA and mitochondria has been suggested in roots, when the ability of ABA to inhibit primary root growth was used as the basis of a genetic screen (J. He et al., 2012; Yang et al., 2014). A previous report identified the abo6 mutant, which has enhanced ABA response and elevated ROS within the mitochondria (J. He et al., 2012). We examined this mutant and found that it has hypersensitive ABA response in guard cells. We find increases in both ABA-induced stomatal closure and the amount of total ROS accumulation within guard cells of this mutant. The abo6 mutation maps to a gene encoding a mitochondrial DEXH box RNA helicase that functions in the splicing of several transcripts that are required for proper function of complex I in the mitochondrial electron transport chain. Because complex I is a major source of ROS production, impairment at this site can result in increased electron leakage and thus elevated mitochondrial ROS, though how ABA drives H2O2 increases here is not well understood. With ROS synthesis in both chloroplasts and mitochondria being tied to metabolic function, it would be fascinating to determine whether ABA signaling interacts with these organelles to specifically upregulate ROS used downstream for signaling, or if ABA is driving altered metabolic rate in these organelles, or both of these responses
Treatment with ABA led to significant increases in both DCF and PO1 within a second site of metabolic ROS synthesis: chloroplasts. Since chloroplasts generate a substantial amount of ROS during photosynthesis (Asada, 2006; Foyer & Noctor, 2003) it is not surprising that significant increases in signal intensity of both chemical probes were detected in this organelle. ABA-dependent ROS increases in chloroplasts are consistent with previous reports observing ABA-induced increases in DCF in mesophyll and guard cell chloroplasts (Wang et al., 2016), with our study being the first to display increases of H2O2 specifically. However, the function of chloroplast ROS increases within the context of ABA-dependent stomatal closure has become an evolving area of interest in recent years. Previous reports have shown that chemical inhibition of photosynthetic electron transport (PET) and mutants that lack chlorophyll in guard cells are still able to close stomata following ABA treatment (Azoulay-Shemer et al., 2015; Wang et al., 2016), while others find the inhibition of guard cell PET impairs ABA sensitivity (Iwai et al., 2019). Therefore, the consequences of ABA-triggered ROS production in guard cell chloroplasts may need further evaluation to reach a clear understanding of its function during stomatal closure.
The nuclei of guard cells showed ABA-dependent increases of DCF fluorescence and roGFP2-Orp1 oxidation, a surprising finding due to limited information on nuclear localized ROS production. This ABA response was reduced in the rbohd/f double mutant, suggesting that an RBOH dependent signaling pathway affected accumulation of nuclear ROS. In mammalian systems, NOX1 and NOX4 have been shown to localize within the nucleus to directly affect redox state within this organelle (Chamulitrat et al., 2003; Kuroda et al., 2005; Saez, Hong, & Garvin, 2016), suggesting that plant RBOHs may function in a similar way. Consistent with ROS synthesizing machinery being localized to the nucleus, previous work utilizing tobacco Bright Yellow-2 suspension cells demonstrated that calcium application was able to trigger ROS production in isolated nuclei (Ashtamker, Kiss, Sagi, Davydov, & Fluhr, 2007). ROS has also been shown to accumulate in plant nuclei in response to environmental signals via diffusion from the cytosol or as a result of retrograde signaling from other sites of ROS production (Caplan et al., 2015; Exposito-Rodriguez, Laissue, Yvon-Durocher, Smirnoff, & Mullineaux, 2017).
Increases in ROS within the nucleus may function to regulate the activity of redox-regulated transcription factors with redox regulation identified for members of the WRKY, MYB, NAC, heat shock factors (HSF) families, and ZAT (H. He, Van Breusegem, & Mhamdi, 2018). The canonical machinery within the ABA-signaling pathway has previously been shown to regulate transcriptional cascades in guard cells (Fujita, Fujita, Shinozaki, & Yamaguchi-Shinozaki, 2011). ABA-dependent upregulation of nuclear ROS may provide an additional level of control over gene expression through changes in oxidation state of specific transcription factors.
The regulation of stomatal aperture in response to environmental stimuli, such as drought, is a crucial process in plant adaptation to stress. Although ROS accumulation in guard cells in response to the drought hormone ABA had been previously reported, our goal was to identify whether H2O2 was part of this ROS accumulation, as well the spatial regulation of these ROS. We observed ABA-dependent ROS increases, using ROS-responsive chemical probes and genetically encoded biosensors, within distinct subcellular locations including the chloroplast, cytosol, nuclei, and mitochondria. We demonstrated that RBOH enzymes are required for ABA-induced ROS synthesis in multiple cellular locations, and that H2O2 is sufficient to induce stomatal closure. Using a H2O2-responsive chemical and a genetic sensor, we reveal ABA-induced H2O2 increases in mitochondria. In support of a function of this mitochondrially derived ROS, a mutant with increased mitochondrial ROS production displayed an increased rate of ABA-induced stomatal closure, suggesting ROS production in this organelle functions in ABA signaling. Together these results indicate that ABA-induced H2O2 accumulation exhibits tight spatial regulation that influences stomatal closure and guard cell physiology.
Methods and Materials
Plant Growth Conditions
Arabidopsis thaliana seeds that were used include Col-0, rbohd/rbohf single and double mutants (Miller et al., 2009), pyl1-1; pyr1-1; pyl4-1; pyl5; pyl8-1 quintuple mutant (pyl-11458) (L. Zhang et al., 2020), ABA overly sensitive 6 (abo6) (J. He et al., 2012), GFP-PTS1 reporter (Ramón & Bartel, 2010), roGFP2-Orp1 (Nietzel et al., 2019), and mt-roGFP2-Orp1 (Nietzel et al., 2019). Arabidopsis plants were germinated on 1× Murashige and Skoog medium, pH 5.6, Murashige and Skoog vitamins, and 0.8% (w/v) agar, buffered with 0.05% (w/v) MES and supplemented with 1% (w/v) sucrose. After vernalization at 4°C for 48 h, plates were placed under 24-h 120 µmol m−2 s−2 cool-white light. Seven days after germination, seedlings were transferred to SunGro Redi-Earth Seed Mix. Plants are then grown under a short-day light cycle (8 h light/ 16 h dark) of 120 µmol m−2 s−2 cool-white light with relative humidity kept between 60-70%. Experiments were conducted on leaves from plants 3 to 4 weeks after germination, unless noted otherwise.
Stomatal Closure Assay
ABA-induced stomatal closure assays were performed with plants 3 to 4 weeks after germination. Epidermal strips were prepared by evenly spraying a microscope slide with a silicone-based medical adhesive (Hollister stock #7730). After 10 min, the abaxial epidermis of the leaf was pressed into the dried adhesive coat, a drop of water was placed on the leaf surface, and the leaf was gently scraped with a razor blade until only the fixed epidermis remains. Fresh epidermal peels were then fully covered in opening solution (50 mM KCl, and 10 mM MES buffer, pH 6.15) and incubated under cool-white light (120 µmol m−2 s−1) for 3 hrs. To induce stomatal closure, opening buffer was replaced with equal volume of a similar solution with 20 µM or 100 µM ABA added to induce closure. For quantification of stomatal aperture, leaf peels were imaged on an ECHO Revolve microscope using transmitted light. Images were acquired using an Olympus UPlanSApochromat 40x/0.95NA objective.
DCF Staining, Imaging, and Quantification
CM 2,7-dihydrodichlorofluorescein diacetate (CM-H2DCF-DA) was dissolved in dimethyl sulfoxide to yield a 50-μM stock. This was diluted in deionized water to yield a final concentration of 4.3 µM with 0.1% (v/v) dimethyl sulfoxide. Epidermal peels were prepared and guard cells were fully opened as described above, then treated with 20 µM ABA or a control buffer. Pre-treatments were fully removed, and the epidermis was stained for 15 min with 4.3 µM H2DCF-DA stain and washed with deionized water. Microscopy was performed on the Zeiss LSM880 laser scanning confocal microscope with a 32-detector GaAsP array for spectral unmixing. The Plan Apochromat 63x/1.2NA water objective for acquisition. The 488 nm laser line was used to excite the leaf surfaces with 0.4% maximum laser power with a 3.5 digital gain. The gain settings were optimized to produce maximum DCF signal while preventing oversaturation. All micrographs were acquired using identical offset, gain, and pinhole settings using the same detectors for each experiment. Settings were defined to spectrally separate the DCF and chlorophyll signal by capturing the emission spectrum for each compound in regions which there was no overlap. Total emission was collected using lambda scanning with a 1 Airy Unit pinhole aperture yielding a 0.9 µm section, the DCF signal alone would later be unmixed from the image for quantification.
Images used for quantification were taken with averaging of 2 with minimal pixel dwell time making sure to limit excess exposure to the laser that may induce ROS. Maximum intensity projections were produced from Z-stacks. The images shown in the figures were captured at high resolution using separate but identically treated samples with increased averaging, digital zoom, and pixel dwell time to increase resolution and were not included in any quantification. Individual images were selected that were representative of the magnitude of responses in the images generated for quantification. To produce heat maps, we converted pixel intensities of DCF fluorescence using the look-up tables (LUT) function in the Zen Blue Software. DCF fluorescence intensities were measured in ImageJ by drawing ROIs around the whole stomata, chloroplasts, cytosol, nuclei, and cytosolic puncta of multiple guard cells. The average intensity values within each ROI were acquired and averaged from three biological replicates with 2-3 technical replicates per experiment.
PO1 Staining, Imaging, and Quantification
Peroxy Orange 1 (PO1) is an H2O2 sensor, which was dissolved in dimethyl sulfoxide to yield a 5 mM stock. This was diluted in deionized water to yield a final concentration of 50 µM. Epidermal peels were prepared and guard cells were fully opened as described above, then treated with 20 µM or 100 µM ABA or a control buffer. Pre-treatments were fully removed, and the epidermis was stained for 30 min with 50 µM PO1 dye and washed with deionized water. Microscopy was performed as described in the above section.
Three-dimensional images of PO1 were acquired on the Zeiss LSM880 system equipped with 32-detector GaAsP array for Airyscan acquisition. Samples were excited with an argon 488 nm laser line using 6% laser power and a Plan Apochromat 63x/1.2NA water objective was used for image acquisition. Total emission was collected using Airyscan of a z-stack spanning the entire depth of a whole guard cell pair, using the optimal optical slice size calculated by the ZEN Black acquisition software. Images were then rendered in three dimensions using Aivia image analysis software. x,y and z,y projections were then acquired of cropped regions containing chloroplasts or cytosolic regions occupied by punctate structures.
To produce heat maps displayed in Fig. 5, we converted pixel intensities of PO1 fluorescence using the look-up tables (LUT) function in the Zen Blue Software. PO1 fluorescence intensities were measured in ImageJ by drawing ROIs around the entire stomata, chloroplasts, cytosol, nuclei, and cytosolic puncta of each guard cell. The average intensity values within each ROI were acquired and averaged from three biological replicates with three technical replicates per experiment.
Imaging and Analysis of ROS-Sensitive Genetically Encoded Biosensors
Fully mature Arabidopsis rosettes containing roGFP2-Orp1 or mt-roGFP2-Orp1 were excised, and peeled prior to being submerged in stomatal opening buffer to equilibrate for 4 hrs to establish a baseline. Stomatal opening buffer was then removed following equilibration and replaced with a similar solution containing 100 µM ABA for 0, 15, 30, or 45 min. Microscopy was performed on the Zeiss LSM880 laser scanning confocal microscope with a Plan Apochromat 63x/1.2NA water objective was used to sequentially excite leaf surfaces at 405 and 488 nm with 1% maximum laser power. Emission was recorded between 505–535 nm with a 2.4 Airy Unit pinhole aperture yielding a 2.0 µm section. Images used for quantification were taken with averaging of 1 with minimal pixel dwell time to limit laser-induced oxidation of the sensor. Dynamic range of each sensor was defined by treating equilibrated samples with 20 mM DTT or 10 mM H2O2 to determine the maximum reduction or maximum oxidation, respectively.
Images of roGFP2-Orp1 targeted to the cytosol were captured as described above and maximum intensity projections were analyzed in ImageJ by drawing a region of interest in the nucleus or a cytosolic region of each guard cell. Images of mt-roGFP2-Orp1 were analyzed by drawing a region of interest around the entire stomata and thresholding to exclude pixels of background intensity values from each measurement. Ratios were calculated by dividing fluorescence intensity following excitation at 405 nm by fluorescence intensity collected after 488 nm excitation. Ratiometric micrographs were generated using the Ratio Redox Analysis MatLab program package (Fricker, 2016).
Colocalization of Cytosolic Puncta and ROS Chemical Probes
For evaluation of peroxisomal colocalization, Arabidopsis leaves containing PTS1-GFP were peeled and labeled with 50 µM PO1 as described above. For evaluation of mitochondrial colocalization, Col-0 Arabidopsis leaves were peeled and treated with 8.6 µM CM H2DCF-DA as described above and then 1 µM Mitotracker Red for 15 min. Leaves were then visualized using the Zeiss 880 LSCM device as described earlier. Each signal was resolved in lambda scanning mode, with emission spectra for each individual spectra being obtained prior to colocalization analysis by imaging single labeled samples. Images were taken at multiple Z-positions, though not combined into maximum intensity projections as to not misrepresent colocalization of signals that might be found in the same vertical plane but at different depths. Emission spectra for each signal were then unmixed from corresponding images to better evaluate how either signal contributed to a particular location. For colocalization analysis, samples were examined using the Zeiss Zen colocalization module. The threshold for PO1, GFP-PTS1, DCF, MitoTracker Red, mt-roGFP2-Orp1 was determined in each image, via regions that contained only one fluorescent signal. Regions of interest surrounding cytosolic puncta in PO1 or DCF were then selected and evaluated for colocalization with either GFP-PTS1, mt-roGFP2-Orp1, or Mitotracker Red. Colocalization was then calculated using Pearson’s coefficients (weighted colocalization coefficients) and respective scatterplots were generated.
Figure Supplements

ROS-sensitive fluorescent probes accumulate in chloroplasts and nuclei. A) Confocal micrographs of DCF fluorescence (green), chlorophyll autofluorescence (magenta) and merge of both images. B) Confocal micrographs of PO1 (orange) combined with chlorophyll autofluorescence (magenta), DAPI nuclear fluorescence (blue) and merge of both images. C) Confocal micrograph of Fluorescein Diacetate (FDA), which becomes fluorescent upon cellular uptake, but is not oxidized by ROS and displays similar accumulation pattern as the redox-sensitive variant of the probe Dichlorofluorescein (DCF). Maximum intensity projections of full z-stacks are shown in for each image. Scale bar: 5µm
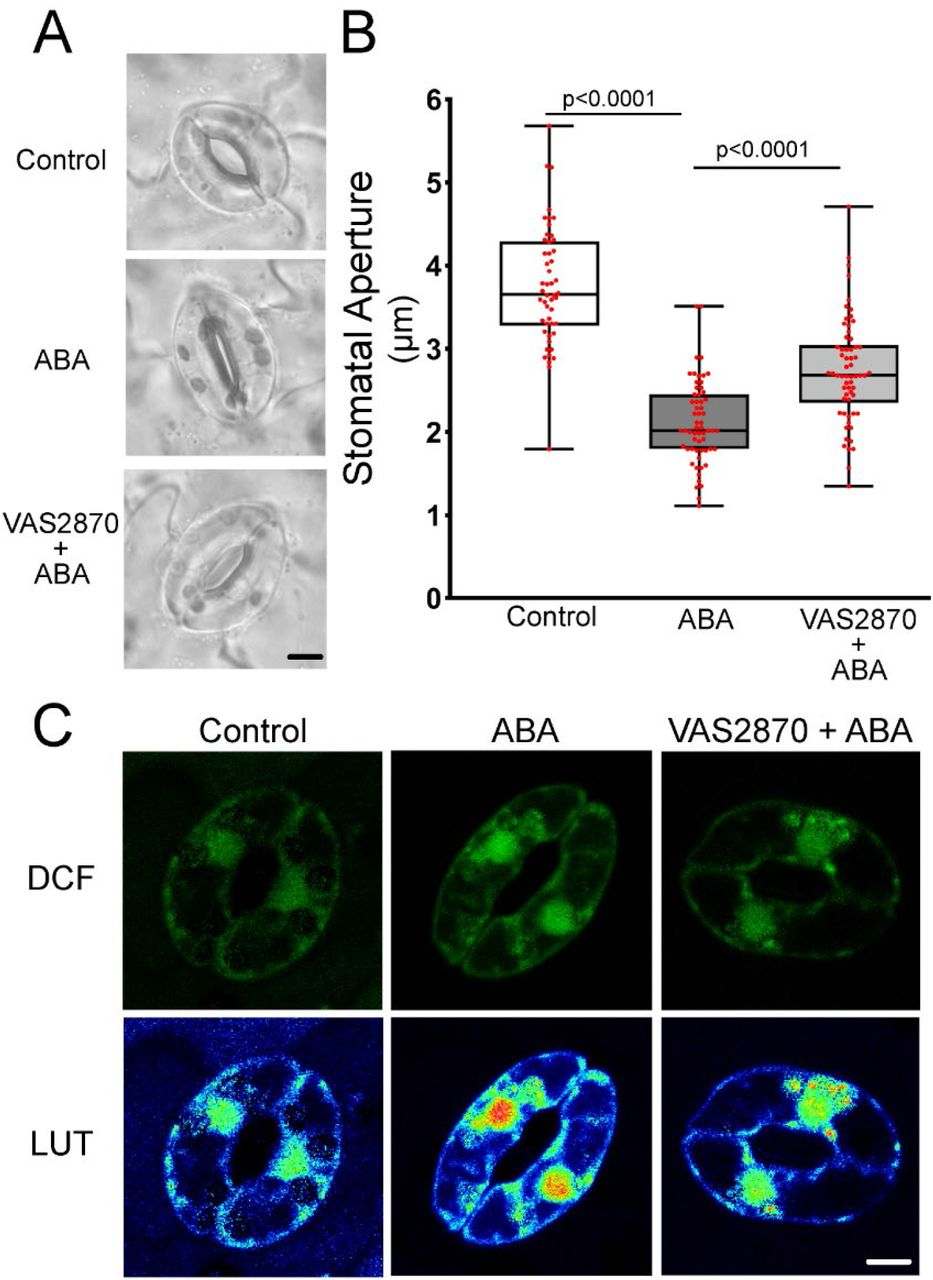
The RBOH-selective inhibitor VAS2870 reduces ABA-dependent guard cell closure and DCF accumulation. A) Confocal micrographs of DCF fluorescence or DCF images converted to lookup tables (LUT) of Col-0 guard cells treated with buffer control, 20 µM ABA, or pre-treated with 10 µM VAS2870 followed by ABA treatment. Scale bar = 5µm. B) Stomatal apertures of leaves of Col-0 treated with a buffer control, ABA, or pre-incubated with 10 µM VAS2870 for 1 hr followed by ABA treatment for 45 min. C) Stomatal apertures of buffer control, ABA, or VAS2870 + ABA were quantified immediately following treatment. P-values are listed above lines designating the treatment groups being compared. P-values are recorded according to one-way ANOVA followed by Tukey’s post hoc test from at least 50 stomata for each genotype per time point from two separate experiments. Scale bar: 5µm

ABA treatment does not increase PO1 fluorescence in the whole guard cell, cytosol, or nucleus. A) Confocal micrographs of PO1 fluorescence converted to Lookup Tables (LUT) after treatment with 20 µM or 100 µM ABA or buffer control. Maximum intensity projection of full z-stack is shown. Scale bar: 20µm. B) Quantifications of PO1 fluorescence in the B) whole cell, C) cytosol, or D) nucleus. All p-values were calculated by one-way ANOVA followed by a Tukey’s multiple comparisons test from at least three separate experiments (whole guard cell n>62, nuclear n>50, cytosol n>50).

PO1 can detect large-scale changes in guard cell nuclei. A) Confocal micrographs of PO1 fluorescence or PO1 fluorescence converted to Lookup Tables (LUT) of Col-0 guard cells treated with buffer control or 250 µM H2O2. Maximum intensity projection of full z-stack is shown. Quantifications of stomatal aperture with 250 µM H2O2 treatment or with buffer control. B) Quantifications of nuclear PO1 fluorescence with H2O2 treatment or buffer control. P-values are recorded according to one-way ANOVA followed by Tukey’s post hoc test from at least three separate experiments (n>45). Scale bar: 5µm

ABA treatment results in increased ROS accumulation in cytosolic puncta that colocalize with mitochondria. A) Confocal micrographs of PO1 fluorescence (magenta), chlorophyll autofluorescence (red), and mt-roGFP2-Orp1 (green), and a merged image showing PO1 colocalized with mt-roGFP2-Orp1 (white). An individual optical slice is shown. B) Regions of interest used to generate weighted colocalization coefficient are circled in white, highlighting PO1 fluorescence colocalizing with mt-roGFP2-Orp1 fluorescence. C) Colocalization graph generated with the ZEN Black colocalization module from regions of interest highlighting cytosolic puncta. Scale bars: 5µm.
Acknowledgments
We would like to acknowledge the assistance of Dr Heather Brown Harding (Microscopy core facility) with imaging. We also appreciate the generosity of Dr Andreas Meyer and Dr Jose Ugalde in sharing roGFP2-Orp1 and mt-roGFP2-Orp1 seeds as well as Dr Gad Miller for providing us with rbohd/f seeds. Lastly, we would like to thank members of the Muday lab for valuable input on the manuscript. This work was funded by NSF IOS-1558046 to G.K.M and an NIH T32 GM127261 fellowship to A.E.P. The content is solely the responsibility of the authors and does not necessarily represent the official view of the National Institutes of Health.
References


