

Abstract
The canonical NF-κB transcription factor RELA is a master regulator of immune and stress responses and is commonly upregulated in PDAC tumours. Using live imaging, we characterised single cell RELA translocation dynamics in two human PDAC cell lines and identified high cell-to-cell variability in RELA responses to TNFα, including unresponsive, damped, and sustained nuclear RELA localisation. Using a combination of quantitative single cell imaging and Bayesian analysis, we determined that heterogeneity in RELA nuclear translocation between and within PDAC cell lines is dependent on cytoskeletal organisation, in particular actin abundance and distribution. Subsequently, RELA nuclear localisation could be up or downregulated through biochemical modulation of cell shape and the cytoskeleton, particularly by disrupting nucleation of actin stress fibres and branched actin via formin and ARP2/3 inhibition. Together, our data provide evidence that actin configuration regulates RELA translocation during the inflammatory response and that targeting actin dynamics can be used to modulate misregulated NF-κB signalling in PDAC.
Introduction
The NF-κB transcription factor RELA is an essential mediator of the inflammatory and immune responses in all mammals (Hayden et al., 2006) and is central to the canonical NF-κB signalling pathway (Ghosh et al., 1998). As a transcription factor, RELA activation is controlled in large part through its subcellular localisation. Inactive RELA is sequestered in the cytoplasm by IκB proteins. Degradation of IκB by upstream cues, such as the potent inflammatory cytokine Tumour Necrosis Factor α (TNFα), enables RELA translocation to the nucleus where it regulates gene expression (DiDonato et al., 1997; Zandi et al., 1997).
Live imaging experiments using RELA localisation and activity reporters have shown that RELA oscillates between the nucleus and cytoplasm in response to TNFα (Nelson et al., 2004; Tay et al., 2010; Sero et al., 2015; Zambrano et al., 2016). Oscillations are driven by a negative feedback loop between RELA and particular IκB family members, since the genes encoding IκB proteins are RELA transcriptional targets (Sun et al., 1993; Hoffmann et al., 2002). The pattern of RELA translocation has been shown to dictate the specificity and timing of RELA target gene expression, including the genes encoding IκBα, IκBε and the chemokine RANTES (Ashall et al., 2009; Lane et al., 2017). However, most studies characterising RELA translocation dynamics following stimulation use hyperphysiological TNFα concentrations (10 ng/ml) and exogenous RELA reporters.
Cell shape can be a readout of a cell’s signalling state and predictive of several properties, including invasiveness, tumour formation and metastatic potential (Thiery and Sleeman, 2006; Wu et al., 2020). We previously showed that cell shape is an important regulator of RELA dynamics in breast cancer cell lines (Sero et al., 2015) and RELA activity, coupled to cell shape, is predictive of breast cancer progression (Sailem and Bakal, 2017). Specifically, we demonstrated that breast cancer cells with mesenchymal cell shape (protrusive with low cell-cell contacts) have higher RELA nuclear translocation. Because RELA activation itself promotes the epithelial-to-mesenchymal transition (EMT) (Huber et al., 2004; Pires et al., 2017), we provided evidence that cell shape establishes a positive feedback loop that can lead to sustained RELA activation (Sero et al., 2015). Although the mechanistic basis for how cell shape regulates RELA remains poorly understood, studies have shown that chemically inhibiting actin or tubulin dynamics can increase RELA binding to DNA and RELA-dependent gene expression (Rosette and Karin, 1995; Bourgarel-Rey et al., 2001; Németh et al., 2004).
Despite frequent upregulation of both TNFα and RELA in PDAC tumours (Weichert et al., 2007; Zhao et al., 2016), the single cell RELA translocation dynamics in PDAC cells are unknown. Here, we characterised live endogenous RELA translocation dynamics in single living PDAC cells from two different origins and identified distinct groups of responses, including sustained, damped, and unresponsive. We use Bayesian analysis to identify that inter-line and intra-line differences in actin organisation are predictive of heterogeneity in RELA localisation. Subsequently, small-molecule inhibition of actin and tubulin modulated TNFα-mediated RELA ratios. In particular, formin and ARP2/3 inhibition downregulated RELA nuclear localisation, indicating a role of actin nucleation and branching in TNFα-mediated RELA translocation.
Results
TNFα-induced RELA nuclear translocation dynamics is heterogenous and sustained in MIA PaCa2 cells
To study dynamic changes in RELA localisation over time, we used CRISPR-CAS9 gene editing to fluorescently tag endogenous RELA at the C-terminus with eGFP (abbreviated as RELA-GFP) in the human PDAC cell lines MIA PaCa2 and PANC1 (Figure 1A). MIA PaCa2 and PANC1 cells are epithelial in origin and share mutations common in PDAC, including KRAS and p53 mutations and homozygous deletions in CDKN2A/p16 (Deer et al., 2010). We also introduced mScarlet-I to the C-terminus of PCNA (Proliferating Cell Nuclear Antigen; abbreviated as PCNA-Scarlet) – a processivity factor for DNA polymerase δ that functions during replication – which served as a nuclear marker for segmentation and as a cell cycle marker (Kurki et al., 1986; Barr et al., 2017) (Figure 1B).

(A-B) Schematic of CRISPR-CAS9 gRNA and homology constructs generated for endogenous C-terminal tagging of RELA and PCNA with fluorescent proteins. (C) Confocal microscopy of endogenous RELA-GFP and PCNA-Scarlet in MIA PaCa2 and PANC1 cells in control or 0.1 ng/ml TNFα conditions. (D) Example of automated segmentation of nuclear and ring regions using PCNA-Scarlet. RELA localisation is measured by the ratio of RELA-GFP intensity in the nucleus to the ring region. RELA ratios are calculated for single cells tracked prior to and following TNFα treatment.
To observe live RELA translocation dynamics in response to inflammatory stimuli, we used timelapse confocal microscopy with automated image analysis to track changes in RELA-GFP localisation on a single cell level in response to treatment with TNFα. 0.01 ng/ml TNFα is a physiological dose relevant to both healthy and malignant tissue, while 0.1 ng/ml TNFα is found in highly inflammatory PDAC microenvironments (Zhao et al., 2016). 10 ng/ml TNFα was used in several studies assaying RELA translocation and is included for comparison, but is substantially above physiological levels (Zhao et al., 2016). RELA localisation was measured using the RELA ratio: mean nuclear RELA-GFP intensity divided by mean ring region RELA-GFP intensity (Figures 1C and 1D).
At the population level, varying TNFα levels in MIA PaCa2 led to largely monophasic RELA translocation responses (Figure 2A). However, we observed extensive cell-to-cell variability in RELA translocation dynamics. We collated single cell RELA ratio traces from all TNFα treatments and used hierarchical clustering software to identify groups of RELA translocation responses (Dobrzyński et al., 2020). We identified four groups of RELA dynamics in MIA PaCa2 cells (Figures 2B and 2C).

(A) Average RELA-GFP translocation responses in MIA PaCa2 cells per TNFα dose (0.01 ng/ml, 0.1 ng/ml and 10 ng/ml) from 120 min prior to until 600 min following TNFα treatment. n = 50-60 tracked cells per TNFα dose for each of two biological repeats. Lines denote the mean and grey ribbons represent the standard error of the mean (SEM). (B-C) Hierarchical clustering of RELA ratio tracks of MIA PaCa2 collated from all TNFα treatments (0.01 ng/ml, 0.1 ng/ml and 10 ng/ml) into four groups using Time Course Inspector in R with the ‘Ward D2’ linkage method and ‘Manhattan’ dissimilarity measure. n = 50-60 tracked cells per TNFα dose for each of two biological repeats. Heat map is coloured according to the RELA ratio and each row represents an individual tracked cell. Individual tracks per cluster are shown to the left. Clusters from MIA PaCa2 cells are prefixed with ‘M’. (D) Amplitude and (E) Time of first RELA-GFP ratio peak in individual MIA PaCa2 cells per cluster M1-M4. Boxplots show median and interquartile range. M = median per cluster. σ = standard deviation per cluster. (F) Proportion of MIA PaCa2 tracks per TNFα treatment in each cluster M1-M4. (G) Average RELA-GFP translocation responses in PANC1 cells per TNFα dose. n = 50-60 tracked cells per TNFα dose. (H-I) Hierarchical clustering of RELA ratio tracks for PANC1 cells collated from all TNFα treatments. Clusters from PANC1 cells are prefixed with ‘P’. (J) Amplitude and (K) Time of first RELA-GFP ratio peak in individual PANC1 cells per cluster P1-P4. Boxplots show median and interquartile range. M = median per cluster. σ = standard deviation per cluster. (L) Proportion of PANC1 tracks per TNFα treatment in each cluster P1-P4.
To profile clusters quantitatively, we detected peaks in RELA ratio tracks and calculated the amplitude and time after TNFα addition to reach the first peak. Clusters differed significantly in median first peak RELA ratios, ranging from 1.02 (Cluster M1) to 1.44 (Cluster M4). (Figure 2D). Interestingly, 32% cells from Cluster M1, equivalent to 5% of all tracked MIA PaCa2 cells, maintained predominantly cytoplasmic RELA (peak RELA ratio <1) following TNFα addition.
Across TNFα doses, MIA PaCa2 cells had a median time to first peak of 40 min, which is comparable to our findings in breast epithelial cells (Sero et al., 2015). However, we also observed heterogeneity in terms of the rate of RELA translocation, as clusters with higher peak RELA ratio peaked at a shorter time after TNFα addition (Figure 2E).
All TNFα doses evoked multiple RELA response classes with reproducible amounts of heterogeneity. There was a trend for increasing doses of TNFα to be associated with more rapid and more intense peak RELA ratios. M1 and M2 classes predominate at the TNFα low doses, while 10 ng/ml responses were enriched for M4 and M3 classes. All four classes were observed at physiological TNFα levels (0.1 ng/ml), leading to the highly heterogeneous responses (Figure 2F).
PANC1 cells exhibit more homogeneous and damped RELA dynamics in response to TNFα
We also assayed TNFα stimulated RELA dynamics in PANC1 cells. Overall, PANC1 cells had lower RELA nuclear translocation compared to the MIA PaCa2 cells. Moreover, 0.01 ng/ml and 0.1 ng/ml TNFα induced similar responses in PANC1 cells but not in MIA PaCa2 cells (Figure 2G), indicating a higher threshold before inflammation triggers a RELA response in PANC1 cells.
As with MIA PaCa2 cells, we identified four classes of TNFα-induced RELA responses in PANC1 cells: weakly responsive (Class P1); moderately responding with sustained peak RELA ratio (Class P2), or strong response with damped nuclear RELA localisation (Clusters P3 and P4) (Figures 2H and 2I). 21% of cells in Class P1, and 12% of all PANC1 cells, maintained cytoplasmic localisation following TNFα stimulation (peak RELA ratio <1) indicating around twice as many non-responsive PANC1 cells compared to MIA PaCa2 cells. PANC1 Clusters P3 and P4 represent a type of translocation response uncommon in MIA PaCa2 cells in which RELA nuclear localisation significantly drops after peaking. Thus, in contrast to MIA Paca2 cells where many cells sustain high nuclear RELA localisation, RELA activation declines following TNFα stimulation in PANC1 cells, typically resulting in re-localisation to the cytoplasm within 10 hours. As negative feedback signalling is a widely reported feature of RELA signalling (Hoffmann et al., 2002), these data suggest that negative feedback regulation is intact in PANC1 cells but compromised in MIA PaCa2 cells.
PANC1 and MIA PaCa2 cells also differed in the proportion of cells falling into each RELA translocation class, especially at physiological TNFα doses. In MIA PaCa2 cells, RELA translocation dynamics exhibit a continuity of responses at TNFα physiological levels (Figure 2F), as they can be grouped into all classes (M1-M4). Moreover, MIA Paca2 which makes incremental responses to increased dose. However, RELA responses to TNFα in PANC1 cells appear to be more ‘all-or-none’. RELA either responds very little at physiological doses (class P1 and P2) or is ‘all in’ for hyperphysiological doses (class P3 and P4) (Figure 2L).
Strikingly, although MIA PaCa2 and PANC1 cells showed fluctuations in RELA ratio over time, neither demonstrated the amplitude or regularity of periodic oscillations on a single cell level observed in other cell lines (Nelson et al., 2004; Tay et al., 2010; Sero et al., 2015; Zambrano et al., 2016). As oscillations are driven by negative feedback in RELA signalling (Hoffmann et al., 2002), lack of oscillations provides further evidence that negative feedback by IkBα is absent in MIA PaCa2 cells. Interestingly, although some form of negative feedback appears to be present in PANC1 cells, the pathway parameters do not support oscillations.
RELA translocations dynamics are cell cycle independent in PDAC cells
Our data suggest that RELA translocation in some cells is unresponsive to TNFα-stimulation (Figures 2B and 2H). As RELA nuclear translocation was identified as suppressed during S-phase of the cell cycle in HeLa cells (Ankers et al., 2016), we tested whether RELA translocation is cell cycle dependent in PDAC cells. To this end, we used changes in the appearance and intensity of endogenous PCNA-Scarlet to mark cell cycle transitions. Consistent with prior observations of PCNA appearance (Kurki et al., 1986), our endogenously tagged PCNA-Scarlet appeared uniform in G1, punctate during S-phase, and uniform with high intensity in G2 (Figures S1A and S1B).
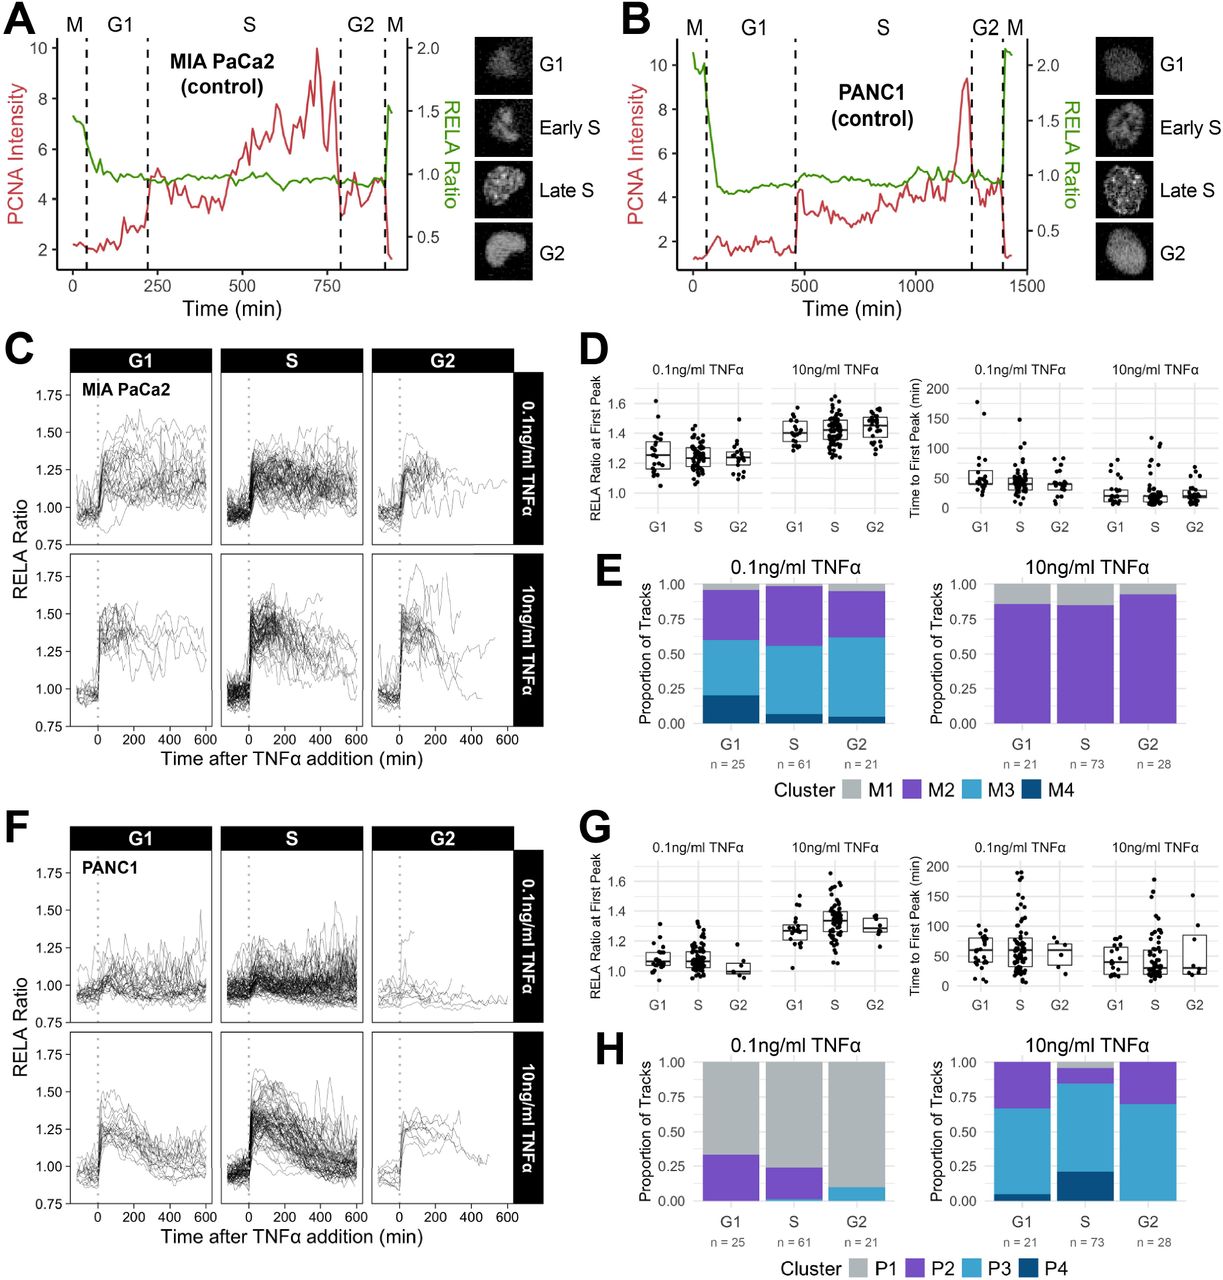
(A-B) Live imaging traces of endogenous PCNA-Scarlet and RELA ratio from during cell division across the cell cycle until the next division in a single representative untreated (A) MIA PaCa2 cell (B) PANC1 cell. Images taken at 10 min intervals. Nuclear PCNA-Scarlet (floored mean) and nuclear and ring region RELA-GFP measurements were calculated in Nuclitrack software. Cell cycle stage transitions based on PCNA intensity and appearance changes are marked with dashed lines. Images of PCNA-Scarlet corresponding to the tracked cell are on the right of each trace. (C) Single cell RELA ratio tracks for MIA PaCa2 cells categorised by cell cycle stage at the time of TNFα addition, based on PCNA-Scarlet intensity and appearance. (D) Single cell measurements for MIA PaCa2 cells of the RELA ratio at first peak (amplitude) and time to first peak per cell cycle stage and TNFα dose. Boxplots show median and interquartile range. (E) Proportion of RELA ratio tracks from MIA PaCa2 cells in each RELA translocation cluster grouped by cell cycle stage at the time of TNFα addition calculated separately for 0.1 ng/ml or 10 ng/ml TNFα treatment. (F) Cell cycle stage categorised single cells tracks for PANC1 cells. (G) Single cell measurements of RELA ratio at first peak (amplitude) and time to first peak per cell cycle stage and TNFα dose for PANC1 cells. (H) Proportion of RELA ratio tracks from each PANC1 RELA translocation cluster grouped by cell cycle stage.
We categorised each tracked cell by cell cycle stage at the time of 0.1 ng/ml or 10 ng/ml TNFα addition and calculated the amplitude and timing of the first peak of RELA ratio, as well as the RELA translocation cluster distribution (Figures S1C-H). Broadly, we did not find differences in the time series profiles of RELA translocation responses between cells in different cell cycle stages (Figures S1C and S1F). We also did not find differences in the amplitude, time to RELA ratio peak, or enrichment of cell cycle stages in different RELA response clusters (Figures S1D-E and S1G-H). Altogether, our data indicate that cell cycle progression does not underlie the observed heterogeneity in RELA translocation to TNFα in PDAC cells.
Actin organisation differences are predictive of heterogeneity in TNFα-mediated RELA localisation between and within PDAC cell lines
Because the same TNFα concentration can lead to variable responses, we propose there are cell-intrinsic mechanisms dictating the extent of RELA translocation in PDAC cells. Having previously identified relationships between cell shape and RELA localisation in breast cells (Sero et al., 2015), we hypothesised that differences in actin and tubulin organisation, which lead to cell shape differences, may explain differences in RELA dynamics. To test this, we expanded our dataset to include images of the human immortalised PDAC cell lines MIA PaCa2, PANC1, Capan1, SW1990 and PANC05.04, and the non-malignant retinal epithelial line RPE1. Cell lines were treated with TNFα (1 hr) and stained for DNA, RELA, F-actin and α-tubulin (Figure S2A). We used automated image analysis to segment cell regions and measured 35 geometric, cytoskeletal and Hoechst features, as well as RELA ratio (Figure S2B) in ∼160,000 cells. We used hierarchical clustering to reduce the 35 cell features to ten independent features (Figure S2C). The selected features included ‘Tubulin texture’ which identifies dense clusters of α-tubulin, as well as the ratio of ‘Actin filament area’ to ‘Cell area’ which assays actin stress fibre abundance. Features were compared between cell lines using principal component analysis (PCA) (Figure S3). PCA largely clustered data by cell line, indicating distinct cell morphology and cytoskeletal organisation between cell lines.

(A) Staining by immunofluorescence (α-tubulin and RELA) and dyes marking DNA (Hoechst) and F-actin (phalloidin). Cell regions were segmented using Hoechst and α-Tubulin stains and features were measured in these regions using the four stains. (B) RELA ratio is calculated by dividing RELA intensity in the nucleus by RELA intensity in the ring region (region around nucleus in cytoplasm). (C) Hierarchical clustering of 35 normalised cell features (excluding RELA measurements) measured in five PDAC cell lines and RPE1. Independent features selected (one per cluster) are highlighted in the dendrogram and displayed in images beside.

Principal Component Analysis (PCA) of the ten reduced features used in Bayesian analysis for five PDAC cell lines and RPE1 using two principal components. Overlayed is a biplot (arrows) denoting the absolute contribution of each cell feature to the two PCs. Circles represent technical replicates (four technical replicates for each of three biological repeats). Horizontal bar graphs for individual cell lines show mean Z-scores for each feature, calculated across the six cell lines to compare differences in each feature between the cell lines. Z-scores were calculated using the mean and standard deviation for control measurements across all lines for each biological repeat. Displayed is the mean Z score across biological repeats. Images for each cell line show Hoechst, phalloidin (F-actin), α-tubulin and RELA staining by immunofluorescence.
Across the five PDAC cell lines the variance of RELA ratios generally increased with TNFα concentration. Cell lines also had varied sensitivity to TNFα in RELA localisation (Figure 3A). Consistent with our observations of endogenously tagged RELA, we confirmed that MIA PaCa2 cells have significantly higher nuclear RELA localisation with increasing TNFα treatment, while PANC1 cells have only slightly higher nuclear localisation in physiologically high (0.1 ng/ml) compared to physiologically low (0.01 ng/ml) TNFα.
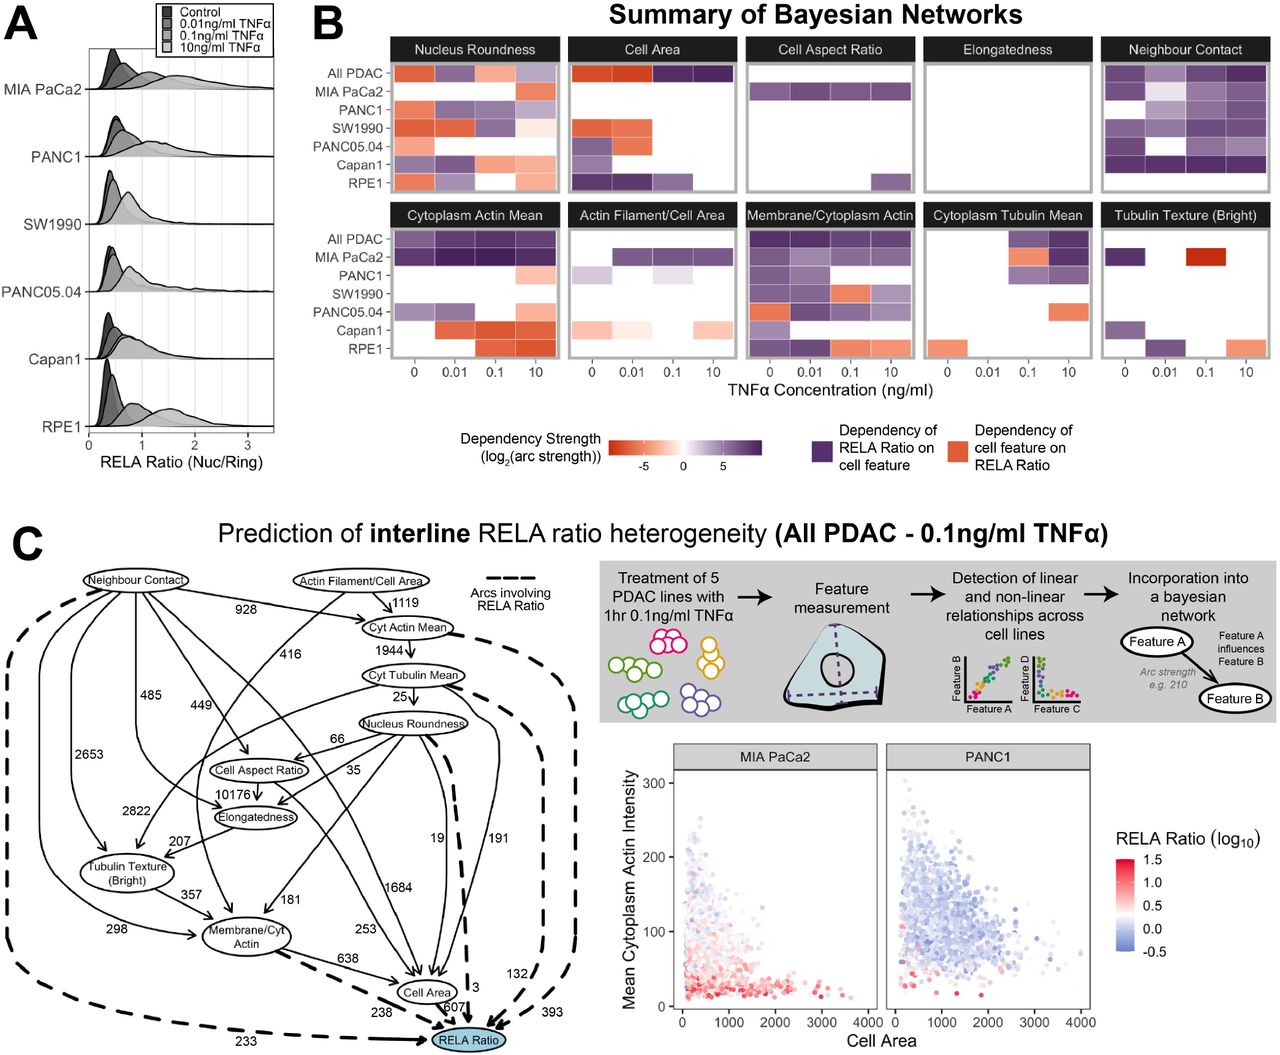
(A) Single cell RELA ratio distributions by immunofluorescence and automated image analysis. (B) Dependencies involving RELA ratio in Bayesian network models generated with single cell data for individual treatments or cell lines, or for all PDAC cell lines collated (top row per cell feature section). Purple represents a dependency of RELA on the cell feature in the Bayesian network model. Orange represents a dependency of a cell feature on RELA. Dependency strengths are calculated as log2(|arc strength|), multiplied by -1 for dependencies of cell features on RELA ratio. (C) Bayesian networks model incorporating data from all PDAC lines (RPE1 excluded) treated with 1 hr 0.1 ng/ml TNFα. Values next to arcs represent the strength of the probabilistic relationship expressed by the arc (arc strength). Arcs leading to or away from RELA Ratio are dashed. Top right: schematic of construction of the Bayesian network model. Bottom right: single cell measurements for cell area, cytoplasmic actin intensity, and RELA ratio.
To identify features correlating with RELA localisation differences, we collated and incorporated normalised single cell measurements for the ten independent cell features into Bayesian networks. Bayesian networks are models consisting of nodes, representing measured features, and arcs between nodes depicting predicted dependencies based on statistical inference. Bayesian network models can represent linear and non-linear relationships, direct and indirect interactions, and illustrate multiple interacting nodes simultaneously (Friedman, 2004; Sachs et al., 2005). We employed a hybrid class of Bayesian algorithm (‘rsmax2’), which uses a combination of constraint-based and score-based approaches (Scutari et al., 2018).
To establish patterns in RELA dependencies across PDAC lines, we generated Bayesian network models for each cell line for varying TNFα concentrations and summarised dependencies involving RELA ratio in Figure 3B. RELA ratio had a strong and consistent relationship with neighbour contact across all PDAC lines but not in the non-malignant line RPE1. RELA ratio was frequently dependent on cytoplasm actin intensity, cytoplasm tubulin intensity and membrane/cytoplasm actin, suggesting that TNFα mediated RELA nuclear translocation is dependent on cytoskeletal dynamics in PDAC cells. Conversely, nucleus roundness was predicted to be dependent on RELA ratio in several contexts. Some dependencies between RELA ratio and a cell feature changed with TNFα, including the dependency of RELA ratio on cytoplasm tubulin mean which was more probable with TNFα, while correlations between RELA ratio and cell area were more probable in basal conditions.
To identify cell features that likely explain RELA localisation differences between cell lines at high levels of inflammation, we focused on the Bayesian model for 1 hr 0.1 ng/ml TNFα incorporating data from all five PDAC lines (Figure 3C). The features with the strongest statistical likelihood of influencing RELA localisation differences between cell lines were cell area and cytoplasm actin mean, which both negatively correlated with RELA ratio. These data suggest that the smaller cell area and lower actin abundance of MIA PaCa2 cells compared to PANC1 cells contribute to increased RELA nuclear translocation in MIA PaCa2 cells in response to TNFα.
We assessed which features underlie heterogeneity in RELA localisation within PDAC cell lines (Figure 4A-C). RELA ratio differences within both the MIA PaCa2 and PANC1 cell lines were predicted to depend on actin stress fibre abundance. MIA PaCa2 cells showed additional dependencies on actin cytoplasm intensity and actin membrane/cytoplasm intensity, which we interpret as the amount of cortical actin and could reflect membrane tension, while PANC1 cells showed unique dependencies of RELA localisation on tubulin abundance and nuclear roundness. Overall, our data show that the relationship between RELA localisation and the cytoskeleton, in particular actin networks, is cell-line specific.

(A-C) Bayesian networks models were generated each incorporating single cell data from a single PDAC cell line. (D) Mean RELA ratio +/- standard deviation against (rounded) neighbour contact by treatment.
Interestingly, neighbour contact was predicted by Bayesian modelling to influence several cytoskeletal features in both MIA PaCa2 and PANC1 cells. Having previously identified a negative correlation between RELA ratio and breast epithelial cells (Sero et al., 2015), we tested this relationship in PDAC cells by calculating the RELA ratio at each TNFα dose for cells grouped by neighbour contact. RELA ratio was lower in cells with higher neighbour contacts for most TNFα doses and PDAC lines, suggesting that RELA nuclear translocation is contact inhibited in PDAC cells (Figure 4D).
Cytoskeletal and cell shape features correlate with RELA translocation classes
Next, we tested whether relationships exist between cell geometry and cytoskeleton features and the different TNFα-induced live RELA translocation dynamics we observed. To do this, we took a statistical reconstructive approach. We used RELA-GFP-expressing MIA PaCa2 and PANC1 cells fixed at 60 min following 0.1 ng/ml TNFα treatment and stained for F-actin, α-Tubulin and DNA for measurement of geometry and cytoskeletal features. We then placed each cell into each of the single cell dynamics clusters identified in Figure 2, by using the mean and standard deviation of RELA ratio to identify stringent ranges of RELA ratio associated with each cluster at the 60 minutes time point (see methods) (Figure 5A).

(A) Schematic illustrating method for RELA translocation response cluster classification. RELA ratio limits per cluster are defined by the mean and number (n) of standard deviations from the mean, calculated from live imaged cells. Cells are independently sorted into clusters based on RELA ratio at the same timepoint after 0.1 ng/ml TNFα addition. Below are cluster prediction accuracies calculated as the percentage of clustered cells tracked through live imaging with the correct cluster identified using the model limits. (B) t-SNE analysis of MIA PaCa2 and PANC1 cells by RELA translocation cluster separated by well averages of the cell shape and cytoskeletal features used for Bayesian analysis, excluding Neighbour Contact. (C-D) Single cell data for four measured cell features with high statistical significance by ANOVA between RELA translocation clusters. Bars show mean +/- SD. (E) Summary of identified relationships between RELA ratio and cell features by cross referencing cell shape and RELA translocation clusters (tested by ANOVA) and independently by Bayesian analysis. (F) Schematic summarising identified relationships between cell shape and cytoskeletal features with RELA translocation response to TNFα. MIA PaCa2 cells with more actin stress fibres, low cortical actin, low cell aspect ratio, and more spread tubulin are more likely to have high nuclear RELA translocation in response to 0.1 ng/ml TNFα. PANC1 cells can be unresponsive or responsive to 0.1 ng/ml TNFα, with responsiveness correlated to actin stress fibre and tubulin abundance, as well as nucleus roundness and cell area.
T-distributed stochastic neighbour embedding (tSNE) analysis of ten independent cell shape and cytoskeletal features showed that cells with the same RELA translocation response profile cluster together and therefore have similar cell shape and cytoskeletal organisation (Figure 5B). Features that differ between RELA translocation clusters were identified by ANOVA, using all clusters (M1-M4) for MIA PaCa2 cells and clusters P1-P3 for PANC1 cells, due to a lack of P4-type responding cells to 0.1 ng/ml TNFα. MIA PaCa2 cells with a high number of actin filaments, less cortical actin, higher cell aspect ratio (width to length) and less bundled tubulin were more likely to fit a higher nuclear RELA translocation response to 0.1 ng/ml TNFα (Figure 5C). Conversely, PANC1 cells with more actin filaments were more likely to be unresponsive (Cluster P1) to 0.1 ng/ml TNFα, while cells with smaller cell area, higher tubulin abundance and low nucleus roundness were more likely to induce RELA nuclear translocation following 0.1 ng/ml TNFα (Clusters P2 and P3) (Figure 5D).
In Figure 5E and Figure 5F, we summarised the identified relationships between RELA ratio and cell features by the two statistical methods: 1) cross referencing cell shape and RELA translocation response assayed by ANOVA, 2) Bayesian analysis. In MIA Paca2 cells, decreased cortical actin, but increased stress fibre assembly, increased cell roundness, and expansion of tubulin networks are predicted to high and chronic RELA nuclear translocation. Meanwhile, PANC1 cells with fewer stress fibres, deceased cell area, and distorted nuclei have higher RELA nuclear translocation. However, in contrast to MIA PACA2 cells, RELA activation occurs acutely and becomes suppressed in PANC1 cells. Overall, our analyses show that heterogeneity in RELA translocation dynamics is linked to heterogeneity in cell shape and cytoskeletal organisation in PDAC cells in a cell-line dependent manner.
Biochemical perturbation of the cytoskeleton modulates the effect of TNFα on RELA translocation
As cytoskeletal organisation was a strong predictor of TNFα-induced RELA translocation, we tested the effect of perturbing cytoskeletal dynamics on RELA localisation using small-molecules targeting tubulin, actin, myosin, or focal adhesion (FA) dynamics. We ascertained doses by treating MIA PaCa2 cells with concentration ranges for 24 hr, or 3 hr for SMIFH2 (Figure S4A-H).

(A-G) Dose responses of cytoskeleton-targeting drugs and representative images of MIA PaCa2 cells (absence of TNFα). n = four technical replicates per drug dose. (H) Cytoplasm actin intensity (y-axis), Elongatedness (point size) and cytoplasm tubulin intensity (point colour) of cells treated with selected drug concentrations in the presence or absence of 1 hr 0.1 ng/ml TNFα. All measurements are normalised to the DMSO control for each cell line and TNFα dose (0 or 0.1). Points show two technical (well) replicates for three biological repeats per treatment combination.
To assay the effect of cytoskeleton interference on TNFα-stimulated RELA translocation, we treated MIA PaCa2 and PANC1 cells with selected drug doses for 2 hr then simultaneously with 10 ng/ml TNFα for 1 hr. Broadly, we found that inhibitors with similar mechanisms induce analogous effects on RELA translocation. In MIA PaCa2 cells, targeting actin had inhibitor-specific effects on RELA localisation (Figure 6A). Actin nucleation is the formation of complexes of actin monomers from which actin filaments can form. CK666 inhibits the ARP2/3 complex – a key mediator of actin filament nucleation and branching (Mullins et al., 1998), while SMIFH2 inhibits formins (Rizvi et al., 2009), which promote nucleation and elongation of pre-existing actin filaments to produce long straight filaments (Pruyne et al., 2002). SMIFH2, and to a lesser extent CK666, significantly downregulated nuclear RELA localisation in MIA PaCa2, indicating that nucleation of both branched actin and actin stress fibres function in TNFα-mediated RELA nuclear translocation. Cytochalasin D, which binds to the growing end of actin filaments and inhibits polymerisation (Schliwa, 1982), caused no effect on RELA ratio, indicating that actin organisation, rather than actin polymerisation itself, contributes to RELA nuclear translocation.

(A-B) Fold-changes for cell shape and cytoskeletal measurements following 3 hr drug treatment normalised to the DMSO control. Below are the corresponding fold-changes for RELA ratio (10 ng/ml TNFα/no TNF) normalised to the DMSO control. Data shown for technical replicates/well averages (two per n = 3 biological repeats). PTX = paclitaxel; Noc = nocodazole; Dem = Demecolcine; Cyto D = Cytochalasin D; Blebb = Blebbistatin; PF228 = PF573228. (C) Single cell RELA ratios in MIA PaCa2 and PANC1 cells treated with 0.1 ng/ml TNFα, with SMIFH2 treatment or 24 hr transfection with CA-mDia1-GFP (constitutively active mDia1). Representative images per cell line and condition are shown. (D) RELA nuclear translocation is dependent on actin structure in PDAC cells, with a higher dependency on the nucleation of stress fibres in MIA PaCa2 cells and on the nucleation of branched actin in PANC1.
In MIA PaCa2 cells, inhibition of myosin/ROCK and FAK increased cell area and elongation as expected but had minimal effects on actin and tubulin abundance and distribution, and all increased RELA nuclear translocation. These data suggest that cell contractility or focal adhesion dynamics may suppress TNFα-induced RELA nuclear translocation independently of actin and tubulin dynamics.
Similar to MIA PaCa2 cells, actin perturbations caused reductions in RELA ratio in PANC1 cells (Figure 6B), however, PANC1 cells were more sensitive to CK666 and cytochalasin D compared with MIA PACa2. Myosin and FAK inhibition caused milder effects on cell shape in PANC1 cells compared to MIA PaCa2, which may be related to the flat/less contractile morphology of PANC1 cells observed in Figure S3, and these drug groups caused non-significant RELA ratio changes in PANC1 cells. While targeting tubulin had no effect on RELA localisation in MIA PaCa2 cells, PANC1 cells were sensitive to tubulin inhibition, in particular tubulin depolymerisation by vinblastine and demelcocine caused reductions in RELA ratio. This supports our predictions using Bayesian modelling that RELA is dependent on tubulin dynamics in PANC1 cells but not in MIA PaCa2 cells.
Having screened for drugs targeting the cytoskeleton that perturb RELA nuclear translocation and identified SMIFH2 as a significant hit, we investigated the relationship between formin dynamics and RELA activity. On the single cell level, MIA PaCa2 and PANC1 cells had more cytoplasmic RELA localisation with SMIFH2 and TNFα combination compared to TNFα alone, with a more significant change in MIA PaCa2 cells (Figure 6C). Formin overactivation via constitutively active mDia1 (CA-mDia-GFP) (Rao et al., 2013) resulted in an increase in RELA ratio with TNFα in MIA PaCa2 cells, but no difference in PANC1 cells, compared to TNFα alone.
Altogether, our data identify that actin structure and dynamics in PDAC cells modulate RELA subcellular localisation, however, the precise mechanism for this is different between MIA PaCa2 and PANC1 cells, as predicted by differing influences by actin features on RELA ratio assessed by Bayesian analysis. RELA nuclear translocation is highly dependent on nucleation of actin stress fibres in MIA PaCa2 cells, while RELA nuclear translocation is more dependent on nucleation of branched actin in PANC1 cells (Figure 6D).
Discussion
RELA activity is upregulated in multiple cancers (Karin, 2009), including Pancreatic Ductal Adenocarcinoma (PDAC), in which high RELA expression is associated with a poor prognosis (Weichert et al., 2007). Despite the importance of RELA in PDAC, RELA translocation dynamics with TNFα stimulation in PDAC cells, and how these might be therapeutically manipulated, is poorly understood. Here, we profiled live endogenous RELA nuclear subcellular localisation changes on the single cell level in PDAC cells with varying TNFα levels. We found that PDAC cells are highly sensitive to TNFα stimulation in terms of RELA nuclear translocation, as the majority of MIA PaCa2 cells maintained predominantly nuclear RELA. Moreover, even though PANC1 cells displayed post-stimulation damped RELA translocation dynamics, a characteristic observed in cell lines of other tissue origins (Nelson et al., 2004; Sero et al., 2015; Zambrano et al., 2016), other studies reported more rapid cytoplasmic RELA relocalisation (within 2 hours of TNFα treatment) compared to PANC1 cells, where RELA ratio falls below 1 between 6-8 hours after TNFα treatment (clusters P3 and P4). Nonetheless, we identified similarities in the timing of RELA translocation with previous reports, with peak RELA nuclear localisation at a median of 40 min following TNFα treatment for MIA PaCa2 cells and 50 min for PANC1 cells.
Notably, we observed extensive heterogeneity in single cell RELA responses within PDAC cell lines, which could be categorised into distinct classes of dynamics. We used Bayesian modelling of five PDAC lines as an unbiased and high dimensional approach to determine whether descriptors of cell shape and the cytoskeleton correlate with RELA localisation. We previously used Bayesian modelling to show that RELA localisation in a panel of breast cells is strongly dependent on neighbour contact, cell area, and protrusiveness in the presence and absence of TNFα (Sero et al., 2015). In the present study, we extended our analysis to include measurements of actin and tubulin organisation and found that differences in cytoplasmic actin intensity, as well as measures of actin localisation (cortical versus cytoplasmic actin), correlated with RELA ratio differences within and between PDAC cell lines.
We tested the effect of modulating the cytoskeleton and cell shape, using small-molecule inhibitors, on RELA subcellular localisation with TNFα in PDAC cells and identified that perturbing actin dynamics downregulates RELA nuclear localisation. However, RELA nuclear localisation was more perturbed by formin inhibition in MIA PaCa2 cells and by ARP2/3 inhibition in PANC1 cells, suggesting differing contributions of actin stress fibres and branching to the overall organisation of actin and subsequently cell shape in these two cell lines, in addition to differing influences of the nucleation of actin branches and stress fibres on RELA nuclear translocation. The higher impact of inhibition of actin polymerisation by cytochalasin D on RELA translocation in PANC1 cells compared to MIA PaCa2 cells suggests that actin structures are more dynamic in PANC1 cells. As the serum response factor coactivator MAL is sequestered in the cytoplasm by monomeric actin and then released when actin is incorporated into F-actin filaments (Miralles et al., 2003), we hypothesised that actin may regulate RELA in a similar manner. However, the insufficiency of cytochalasin D to affect RELA nuclear translocation in MIA PaCa2 cells suggests that actin polymerisation alone is insufficient to regulate RELA localisation.
Furthermore, the relationship between neighbour contact, actin remodelling, and RELA translocation remains a source for further study. As we observed a negative correlation between neighbour contact and RELA, as well as several dependencies of actin features on neighbour contact predicted by Bayesian modelling in Figure 4B and C, we suggest that neighbour contact may regulate RELA by altering actin structure. This may represent a mechanism used by PDAC cells to sense the environment – and whether in contact with extracellular matrix or other cells – to modulate RELA activity accordingly. Mechanistically, one route which may be mediating transduction of contact information is through beta or p120 (delta) catenin proteins, which regulates the stability of adherens junctions. p120 inhibits RELA activity as p120 null epidermal cells have activated nuclear RELA and p120 null mice have chronic inflammation (Perez-Moreno et al., 2006).
We hypothesise that the cell signalling between actin dynamics and RELA likely involves RhoGTPases, which are central regulators of actin previously linked to the NF-κB pathway (Tong and Tergaonkar, 2014). For instance, NIH-T3 cells with dominant negative mutant CDC42 or RhoA, but not Rac-1, have significantly lower NF-κB transcriptional activity with TNFα compared to their wildtype counterparts (Perona et al., 1997). We have also shown that RELA regulation by cell shape and neighbour contact is regulated by RhoA in breast cells (Sero et al., 2015). It would therefore be interesting to screen for RhoGTPases regulating actin nucleation and branching and RELA translocation in PDAC.
Potential mechanisms for actin regulation of RELA may also be hypothesised from research on the mechanosensitive transcriptional regulator YAP. For example, YAP nuclear translocation is upregulated when forces are applied to ECM adhesions, which stretch nuclear pores via the actin cytoskeleton (Elosegui-Artola et al., 2017). Actin remodelling may therefore affect RELA localisation by reshaping nuclear pores, which could impact RELA nuclear import or export.
Targeting RELA nuclear translocation is an attractive therapeutic strategy, as RELA activity may promote a high-inflammatory PDAC tumour microenvironment through regulation of cytokine production (Ling et al., 2012; Steele et al., 2013), in addition to regulating cell processes that underlie PDAC oncogenesis (Melisi et al., 2009) and therapeutic resistance (Arlt et al., 2003). Our data suggest that RELA activation may be fine-tuned in PDAC by targeting both the cytoskeleton and inflammation. For instance, anti-TNFα therapy previously determined ineffective in advanced pancreatic patients (Wu et al., 2013) may be effective when combined with therapy targeting the cytoskeleton. Moreover, tissue specific and patient specific actin or tubulin dynamics may present a therapeutic opportunity.
Although compounds directly targeting actin are toxic and unusable in the clinic, there is potential to target actin-regulating proteins (Bryce et al., 2019). Ability to target actin in cancer cells selectively may be enabled by tissue specificity and isoform diversity of ARP2/3 complex components (Abella et al., 2016; Jay et al., 2000), or upregulation of the Tpm3.1 isoform of the actin binding protein Tropomyosin in cancer cells (Stehn et al., 2013).
Author Contributions
F.B., J.E.S., and C.B. conceived the study. F.B. performed the experiments and image analysis. F.B. wrote the manuscript with support and discussion from C.B, J.E.S. and L.D..
Declaration of Interests
The authors declare no competing interests.
Materials and Methods
Further information and requests for resources should be directed to and will be fulfilled by the Lead Contact, Francesca Butera (francesca.butera{at}icr.ac.uk).
Cell Line and Cell Culture
Cell lines were maintained at 37°C and 5% CO2 in Dulbecco’s Modified Eagle Medium (DMEM; Gibco) supplemented with 10% heat-inactivated Fetal Bovine Serum (Sigma) and 1% Penicillin/Streptomycin (Gibco).
Generation of cell lines with fluorescently tagged RELA and PCNA by CRISPR-CAS9
RELA and PCNA were tagged endogenously at each C-terminus using CRISPR-mediated gene editing in MIA PaCa2 and PANC1 cells. RELA was tagged with enhanced GFP (Zhang et al., 1996) and PCNA was tagged with mScarlet-I (Bindels et al., 2017), abbreviated throughout this manuscript as RELA-GFP and PCNA-Scarlet respectively. RELA-GFP was first introduced into wildtype cell lines then PCNA-mScarlet was added to validated RELA-GFP clones.
Homology constructs were generated by extracting the region around the stop codon of each gene by PCR. The product was used as a template to amplify the left homology arm (LHA) and right homology arm (RHA) by PCR. PCRs were carried out using High-Fidelity Q5 DNA Polymerase (NEB) according to the manufacturer’s protocol. The RHA contains a mutation corresponding to the gRNA PAM site to prevent repeat targeting by the Cas9 nuclease. Primers used to amplify the homology arms included overlaps for 1) a DNA cassette encoding a linker protein, the fluorescent protein, and antibiotic resistance (kindly donated by Francis Barr); 2) the pBluescript II SK (-) vector (Agilent) following EcoRV digestion. The final homology construct was generated from the four DNA oligos by Gibson assembly using the NEB Gibson Assembly Master Mix and according to the NEB protocol.
gRNA oligos were designed using CRISPR.mit.edu. Forward and reverse oligos were phosphorylated, annealed and ligated into a BbsI-digested pX330 U6 Chimeric hSpCas9 plasmid, gifted from Feng Zhang (Cong et al., 2013).
Cells were transfected with homology and gRNA constructs using Lipofectamine 2000 (ThermoFisher) according to the manufacturer’s protocol. Cells were expanded and selected for antibiotic resistance for three weeks. FP-positive cells were selected using FACS and sorted into single cells per well in 96-well plates and clones were expanded and tested for FP presence using Western blotting. The C-terminus of the RELA and PCNA genes of genomic DNA from the selected clones was amplified and sequenced to confirm the presence of the linker and eGFP or mScarlet DNA.
Cell seeding and treatment for fixed image analysis
Cells were seeded at a density of 1,000 cells per well in 384-well plates unless otherwise specified.
For comparison of cell shape and cytoskeletal features in the five PDAC and RPE1 cell lines, cells were fixed 2 days after seeding, including 1 hr TNFα treatment. The experiment was carried out with three times (biological repeats) in total, each with four technical replicates (wells) per condition.
TNFα treatment
Cells were treated with human recombinant TNFα diluted in complete medium at a final concentration of 0.1 ng/ml, or 1 ng/ml and 10 ng/ml when specified. TNFα sourced from Sino Biological was diluted in water and used to treat the panel of PDAC lines for Bayesian analysis (Figure 3). Due to lack of availability, TNFα was sourced from R&D Systems and diluted in 0.1% BSA/PBS for all other experiments.
Immunofluorescence
Cells were fixed with warm formaldehyde (FA) dissolved in PBS at a final concentration of 4% for 15 min at 37°C then washed three times with PBS. Cells were permeabilised in 0.2% TritonX-100 (Sigma Aldrich) dissolved in PBS for 10 min and blocked in 2% BSA/PBS for 1 hr at RT (room temperature). Cells were stained with 10µg/ml Hoechst (Sigma Aldrich) in PBS (1:1,000) for 15 minutes, washed three times and left in PBS/azide before imaging.
Cells were incubated with primary antibodies for 2 hr at RT or overnight at 4 °C, washed three times with PBS, and incubated with secondary antibodies for 90 min at RT.
Primary antibodies used were rabbit anti-p65/RELA NF-κB (Abcam; 1:500), rat anti-α-tubulin (Bio-Rad; 1:1000), and pFAK Tyr397 (Invitrogen; 1:250).
Cells were incubated with secondary antibodies for 90 min at RT. Secondary antibodies used were Alexa 488/568/647 goat anti-rabbit/mouse/rat IgG (Invitrogen).
For F-actin staining, cells were incubated with Alexa-568 phalloidin (lnvitrogen; 1:1000) for 90 min simultaneously with secondary antibodies.
Imaging and automated analysis of fixed cells
A minimum of 21 fields of view per well were imaged using the PerkinElmer Opera confocal microscope using a 20x air objective. Image analysis was performed using custom image analysis scripts created and executed on PerkinElmer’s Columbus 2.6.0 software platform. Scripts detected and segmented individual nuclei using Hoechst and the cytoplasm using Tubulin, or RELA when Tubulin is not included in the staining set. Cells touching the image border are filtered out and neighbour contact (% cell border touching another cell) for each remaining cell is calculated. The nuclear region is reduced by 1 px from the nuclear outer border from Hoechst segmentation and the ring region is set as the area 2 px to 6 px outside of the nuclear outer border. Intensities of all stains are calculated in all segmented regions on a single-cell level. A total of 32 geometric, cytoskeletal and Hoechst features were measured in addition to measurements of RELA/RELA-GFP. RELA Ratio is calculated by dividing the mean nuclear intensity of RELA/RELA-GFP by the mean ring region intensity of RELA/RELA-GFP. Texture features were calculated using SER methods with region normalisation. Bright and Spot textures were smoothed to a kernel of 4px to detect large patches (bundles) of actin/tubulin. Ridge texture was non-smoothed to detect sharp ridges (filaments) of actin/tubulin. Elongatedness was calculated as ((2*Cell Length)2/Cell Area). Actin Filament Area was measured using Columbus’s ‘Find Spots’ function applied to the actin channel. Neighbour contact was calculated using an inbuilt Columbus algorithm calculating the percentage of a cell’s border in contact with other cell borders. Grouped neighbour contact measurements were generated from non-normalised data rounded to the nearest multiple of ten.
Live cell imaging and analysis
MIA PaCa2 RELA-GFP PCNA-Scarlet and PANC1 RELA-GFP PCNA-Scarlet cells were seeded (1,000 cells/well) in a 384-well plate one day prior to imaging. 4 fields per well were imaged at 10 min intervals using the Opera QEHS imaging system with a 20x air objective and an environmental control chamber set to 80% humidity, 5% CO2 and 37°C. Cells were imaged for 2 hr prior to and 48 hr following TNFα addition. Nuclear and ring region measurements of RELA and PCNA were carried out using Nuclitrack software (Cooper et al., 2017), with 50-60 cells tracked per treatment, cell line and biological repeat (n = 2). Cells were tracked for only 10 hr following TNFα treatment while the total 48 hr imaging period was used to ascertain cell fate (division or death).
Intensity measurements in the second biological repeat were normalised to the first based on control (BSA/PBS) well measurements (TNFα absence) to account for photobleaching and laser power changes. Each biological repeat consisted of eight technical (well) replicates per cell line and treatment.
For each cell line, tracks from all treatments and biological repeats were collated and trimmed to 120 min prior to until 600 min following TNFα treatment then clustered using Time Course Inspector (Dobrzyński et al., 2020) in R, with Ward D2 linkage and the Manhattan dissimilarity measure.
RELA ratio peaks were detected in Excel as RELA ratios fitting either of two criteria: 1) more than 0.02 above both of the average RELA ratio of the previous two time points and the average RELA ratio of the following three timepoints; 2) greater than 1 and is the maximum RELA ratio in the surrounding 40 min window, and more than 0.01 above the average RELA ratio of the previous two time points and the average RELA ratio of the following two timepoints. The ‘first peak’ is the earliest occurring peak following TNFα addition.
Cytoskeletal Drug Treatments
2,000 MIA PaCa2 RELA-GFP cells/well were seeded in 384-well plates and treated the next day with the following drugs for 24 hr without TNFα at the specified dose ranges: Paclitaxel (6.25-200nM; Sigma), Vinblastine (3.125-100nM; Sigma), Nocodazole (12.5-400nM; Sigma), Demecolcine (6.25-200nM; Sigma), Cytochalasin D (0.125-4µM; Sigma), CK666 (12.5-400µM; Sigma), H1152 (1.25-40µM; Tocris), Blebbistatin (1.25-40µM; Sigma), PF573228 (0.625-20µM; Tocris), and Defactinib (0.625-20µM; Selleckchem). Cells were treated with SMIFH2 (3.125-100µM; Abcam) for only 3 hr due to reported cycles of de- and re-polymerisation of 4-8 hr and inefficacy after 16 hr (Isogai et al., 2015). Ranges were selected according to literature and manufacturers’ recommendations. Doses for further analysis were selected based on the observed effect on the cytoskeletal target and cell morphology, as quantified in Figure S4. Doses for H1152 and blebbistatin were based on cell spreading, measured as cell elongatedness, as a proxy of myosin inhibition (Figure S4D).
MIA PaCa2 and PANC1 RELA-GFP cells were seeded at 2,000 cells/well in 384-well plates and treated the following day with selected doses of the small-molecule inhibitors for 2 hr plus additional 1 hr co-incubation with 10 ng/ml TNFα (or DMEM control) prior to fixation. n = 3 biological repeats. Cell feature measurements were calculated as fold changes to controls (DMSO and BSA/PBS) then Z-scored across TNFα treatments and cytoskeletal drugs by cell line. RELA ratios were calculated as fold changes to the TNFα and cytoskeletal drug control then calculated as Z-scores across all TNFα treatments by cell line.
Constitutive activation of mDia1
3,000 wildtype MIA PaCa2 or PANC1 cells were seeded in 100µl DMEM per well in a PerkinElmer Ultra 96 well plate. The following day, cells were transfected with GFP-CA-mDia1 using Effectene (Qiagen) according to the manufacturer’s protocol. Cells were fixed the following day with control (BSA/PBS) or TNFα treatment, stained for RELA by immunofluorescence and with phalloidin 568 and Hoechst, then imaged on a confocal microscope. GFP-positive cells were analysed using CellProfiler.
Quantification and Statistical Analysis
To analyse cell-to-cell differences in the 35 geometric, cytoskeletal and Hoechst features within and between PDAC and RPE1 cell lines, single cell and well (mean) data were collated from all cell lines and treatments from three biological repeats. Features were normalised to the mean across all treatments and cell lines for each biological repeat. Features were reduced for Bayesian analysis by clustering normalised single cell measurements into ten clusters using the ‘ComplexHeatmap’ package in R (Gu et al., 2016), clustering by the Spearman’s Rank coefficient with average linkage, as shown in Figure S2. Bayesian network models and arc strengths were generated in R using normalised single cell data for the ten reduced features via the ‘bnlearn’ R package (rsmax2 method) (Scutari, 2010). This algorithm depicts unidirectional arcs, so reverse relationships can exist but are not as statistically likely as the directional relationships indicated.
MIA PaCa2 and PANC1 RELA-GFP cells fixed after 1 hr 0.1 ng/ml TNFα were allocated to RELA translocation clusters based on RELA ratio, using the mean RELA ratio +/- 0.6*standard deviation for live tracked cells at 60 min for each RELA translocation cluster (M1-M4 and P1-P4) to define RELA ratio limits per cluster. Fixed cells were stained for actin and tubulin and Z-scores for the ten independent cytoskeletal and cell shape features used in Bayesian analysis were calculated by cell line. t-SNE analysis was carried out in R (“Rtsne” package) using Z-score data. Statistical difference between RELA translocation clusters for each cell feature by cell line were identified by ANOVA.
Z-scores in Figure S3 were calculated per technical replicate using the mean and standard deviation for control measurements for each feature across all lines for each biological repeat (n = 3). Mean Z-scores per feature and cell line were calculated by averaging Z-scores for technical replicates across all biological repeats.
Statistical tests were carried out using the ‘Rstatix’ package in R. Principal Component Analysis (PCA) was carried out in R using the inbuilt ‘prcomp’ function using Z-score data. Graphs were generated in R using the ‘ggplot’ package (Wickham, 2016).
Acknowledgements
We gratefully acknowledge funding for this work by Cancer Research UK, awarded to F.B. (S_3567). We thank Andrea Brundin for assistance with single cell tracking and Lucas Dent for helpful comments on the manuscript.
Footnotes
↵3 Lead contact


