

Abstract
In mammals, threat-related behavior is typically induced by a noxious physical stressor and is associated with a broad range of behavioral responses such as freezing and avoidance. These behavioral responses are associated with the regulation of pain responses allowing individuals to cope with noxious stimuli. Whereas the structures and mechanisms involved in pain behavior are well documented, little is known about the precise neuronal circuits mediating the emotional regulation of pain behavior. Here we used a combination of behavioral, anatomical, optogenetic, and electrophysiological approaches to show that somatostatin-expressing neurons in the ventrolateral periaqueductal gray matter (vlPAG SST cells) promote antinociceptive responses during the presentation of conditioned stimuli (CS) predicting footshocks. Whereas the optogenetic inhibition of vlPAG SST cells during CS presentation promoted analgesia, their optogenetic activation reduced analgesia by potentiating pain responses in the spinal cord through a relay in the rostral ventromedial medulla (RVM). Together these results identify a brainstem circuit composed of vlPAG SST cells specifically projecting to the RVM and mediating fear conditioned analgesia (FCA) to regulate pain responses during threatful situations.
Introduction
Displaying adaptive behavioral responses to threat-predicting stimuli is a fundamental process allowing mammals to survive. This process critically depends on the ability of mammals to associate specific cues with their harmful consequences and establish long-lasting predictions about future aversive outcomes. Freezing and avoidance are among the most studied behavioral responses in response to specific threat-predicting cues and are associated with a simultaneous regulation of pain responses allowing accurate behavioral responses1. Indeed, it is now widely accepted that specific threats can modulate pain processing through either a reduction (analgesia) or an increase (hyperalgesia) of pain sensitivity in case of acute and chronic threat exposure, respectively2–4. Moreover, recent reports in humans revealed a strong comorbidity between anxiety-related disorders and pain-related disorders5, suggesting that the deregulation of the neuronal circuits controlling pain processing could lead to the development of anxiety-related pathology. In addition, there is also a strong overlap between the neuronal structures mediating aversive learning and pain processing, including the medial prefrontal cortex (mPFC) and the periaqueductal grey (PAG), two central structures in fear and pain modulation6–9. An interesting model to study the emotional regulation of pain behavior is FCA2, in which a fearful event can lead to a reduction in pain sensitivity. Because the PAG is a midbrain structure receiving many cortical and subcortical inputs from structures involved in fear processing10–12 and projecting to the spinal cord through a brainstem relay in the rostral ventromedial medulla6 (RVM), it is ideally located to allow the emotional regulation of pain behavior. The ventrolateral part of the PAG (vlPAG) is crucial for the descending control of pain in the dorsal horn of the spinal cord6 (DH), and several reports indicated that electrical stimulation of the vlPAG selectively inhibits responses to noxious stimuli in a variety of pain test conditions6, 8, 13–15. Moreover, it has been documented that analgesia induced upon vlPAG stimulation is opioid-dependent16, 17 and involves direct descending projections to the RVM and the DH. In addition, recent data indicated that vlPAG activation induces analgesia through the recruitment of local GABAergic neurons, which is consistent with our knowledge on the role of the GABAergic system in the descending control of pain9, 13, 18. However, to date, the precise neuronal elements and circuits involved in FCA at the level of the vlPAG are still largely unknown.
Results
FCA depends on associative learning
To evaluate the contribution of specific vlPAG cells in the emotional modulation of pain behavior, we developed a novel fear conditioned analgesia (FCA) procedure during which mice were first submitted to a discriminative auditory fear conditioned paradigm followed by a pain sensitivity assay (Figure 1a). In this paradigm, an initially neutral stimulus (the conditioned stimulus, CS) is associated with a mild coincident aversive footshock (the unconditioned stimulus, US). Twenty-four hours following conditioning, re-exposure to CS associated with the US (CS+), but not to the control non-conditioned CS (CS-) promoted freezing behavior, which we used as a behavioral fear readout (Figure 1a, b and Supplementary Figure 1a, b). Following the fear retrieval session, mice were exposed to a hot plate test session (HP) in which the basal plate temperature was progressively increased (6°C per min), and paired with either the CS- or the CS+ presentation until mice display a classical nociception response (Supplementary Figure 1d, Material and Methods). The CS- and CS+ presentation order was counterbalanced across animals.
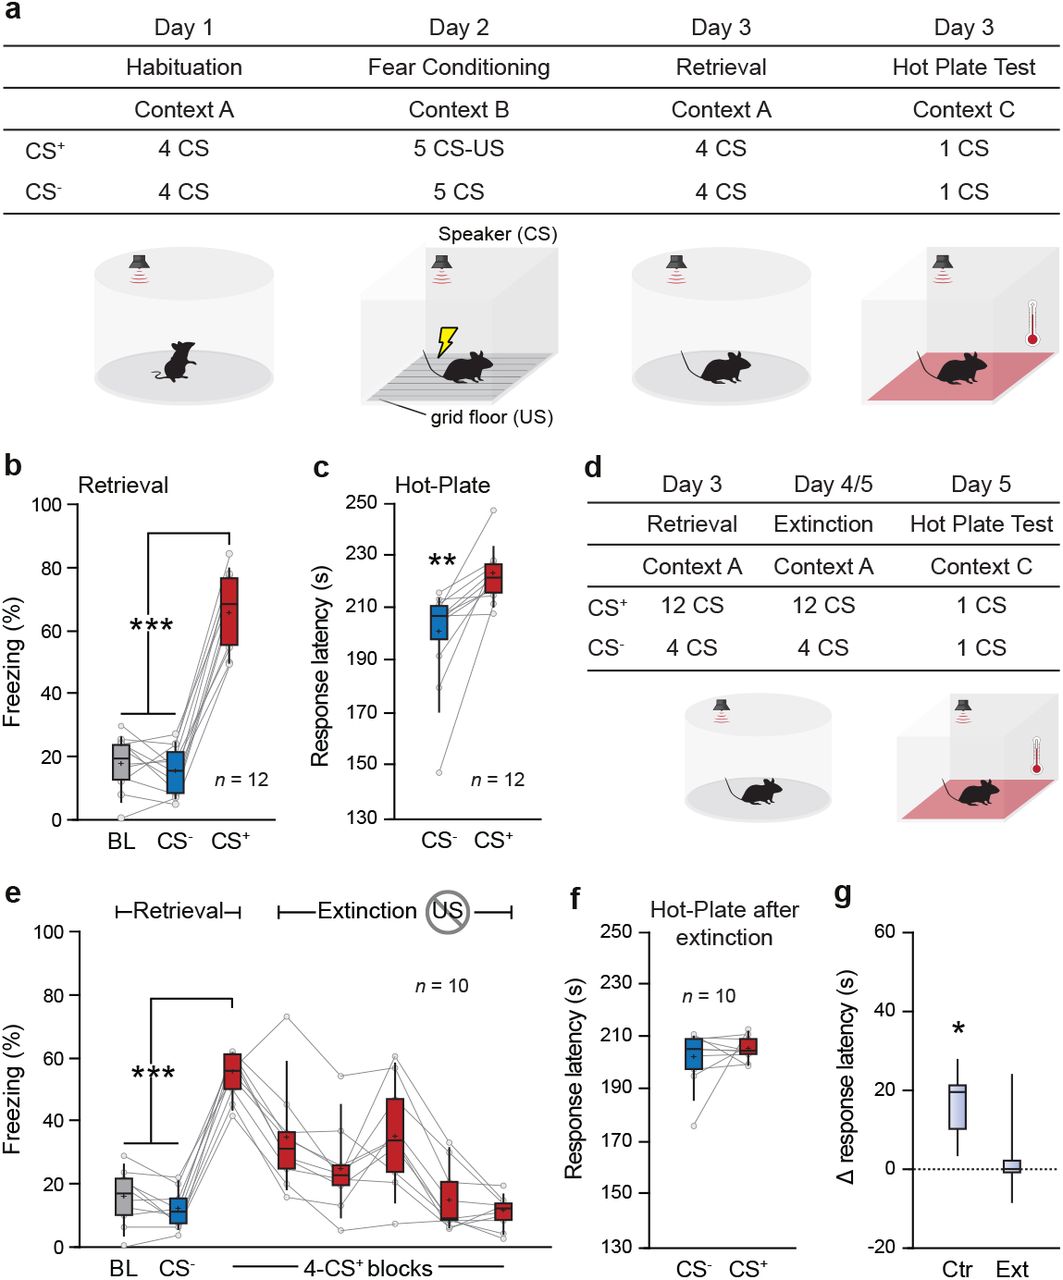
a. Schematic of the setup and the FCA paradigm. On Day 1, mice were habituated to the context and tones. On the conditioning day, one of the tones (CS+) terminated with the onset of mild foot-shock (US) while the other tone remained neutral (CS-). 24h later, the CS-US association was tested during the retrieval where both tones are presented alone. Following retrieval, mice were submitted to the HP test. Each mouse underwent two HP trials, one for each tone. The tones were presented while the temperature gradually increased. The trial terminated once mice displayed a nociception response. b. During retrieval, the average freezing values for CS+ was higher than CS- or baseline (BL) periods (***, P < 0.001, one-way repeated-measures ANOVA, F = 160.861, n = 12 mice). c. Time of nociceptive response on the HP test during CS- and CS+ trials. The emotional modulation of pain behavior led to an average increase in the nociceptive time response by 22 s (**, P < 0.01, one-way repeated-measures ANOVA, F = 15.901, n = 12 mice). d. For the extinction protocol, 24 CS+ were presented across two separate extinction sessions. After the CS-US association was extinguished, mice were submitted to the HP test. e. Mean freezing values throughout the extinction protocol. Mice acquired the CS-US association (1st CS+ block vs BL/CS- ***, P < 0.001, one-way repeated-measures ANOVA, F = 149.912, n = 10 mice), followed by a rapid extinction (5th & 6th block of CS+ vs BL/CS-ns, P > 0.05, one-way repeated measured ANOVA, F = 1.482). f. After extinction, there was no difference in the time of response between the two trials of the HP test (ns, P > 0.05, one-way repeated-measures ANOVA, F = 0.663, n = 10 mice). g. Difference in the time of nociceptive response between the CS+ and CS- trials for the extinction (Ext, n = 10 mice) and the control group (normal FCA protocol; Ctr, n = 12 mice). The extinction group had a significantly lower difference in time of nociceptive response than the control group (*, P < 0.05, One-way factorial ANOVA, F = 7.623, n = 21 mice). Box-whisker plots indicate median, interquartile range, and 5th - 95th percentiles of the distribution. Crosses indicate means. Bullets indicate individual mice values.
Interestingly, mice exposed to the CS+ in the HP test exhibited a significant delay in the nociceptive response compared to CS- exposure, which reflected the development of a CS-specific analgesic response (Figure 1c and Supplementary Figure 1c).
To control that FCA was due to fear associative processes and not merely sensory processing of the CSs, several controls were performed. First, naïve mice were submitted to the HP test without CSs presentation (Supplementary Figure 2a). This test allowed us to measure the basal nociceptive response during the increasing-temperature HP test. Another group of naïve mice were submitted to the HP test with CSs presentations where the CS-US association was never reinforced (Supplementary Figure 2a). In both conditions, we failed to observe any analgesic responses (Supplementary Figure 2c-d). Second, mice were fear conditioned and tested in the HP test without CS presentations, a condition in which we observed analgesia (Supplementary Figure 2a-c). Next, a subset of conditioned mice was submitted to an extinction procedure consisting of 24 non-reinforced exposures to the CS+, which lead to complete inhibition of conditioned fear responses (Figure 1d, e). As expected, extinguished mice exposed to the HP test failed to exhibit FCA responses during CS+ presentations. (Figure 1f, g, and Supplementary Figure 2e). Together these data indicate that FCA depends on associative processes and does not rely on sensory processing of the CS.
Furthermore, the FCA responses observed upon CS+ exposure in the HP test were stable upon multiple exposures to the HP test (Supplementary Figure 3a-e) and not due to a competition with freezing responses evoked by the CS+ as mice did not freeze before the nociceptive response (Supplementary Figure 1d, e).
The use of thermal nociception test in FCA has been reported to lead to possible erroneous interpretations. Indeed, the fearful stimulus can lead to vasoconstriction17 which could result from a redirection of the blood flow to the skeletal musculature, thus decreasing the temperature in the extremities of the body. If so, this phenomenon by itself could explain the delay observed for the nociceptive response during CS+. To further evaluate this possibility, we monitor changes in the back and tail temperature of mice submitted to the HP during CS- and CS+ presentations without increasing the temperature of the HP device (Supplementary Figure 3f-h). Our results did not reveal any difference in tail or back temperature between CS- and CS+ presentations, thereby ruling out a potential vasoconstriction effect that could explain our results.
Inhibition of vlPAG SST cells mediate FCA
Previous publications indicated that the ventrolateral PAG (vlPAG) is a critical region involved in analgesia8, 9, 14, 15. To identify the cell types in the vlPAG mediating our analgesic effect in the FCA task, we focused on GABAergic neurons, which activity are supposed to be inhibited during analgesia through a µ-opioid receptor-dependent (MOR) mechanism6, 13, 16. Because somatostatin-expressing interneurons (SST) are the most abundant inhibitory cell class in the PAG19, we focused on this cell population. We first evaluated the expression of Sst mRNAs in excitatory and inhibitory cell populations in the PAG of SST-Cre mice using single-molecule fluorescent in situ hybridization (smFISH, see Methods). Our results indicated that Sst mRNAs were expressed in both the dorsal PAG (dlPAG) and ventral PAG (vlPAG) with a high specificity (percent of Sst+ cells among Cre+ cells: dlPAG: 94%; vlPAG: 88%) and sensitivity (percent of Cre+ cells among Sst+ cells: dlPAG: 84%; vlPAG: 99%). We also noticed that Sst+ cells were more abundant in the vlPAG compared to the dlPAG (Figure 2a-c). Moreover, when considering Sst mRNAs expression in inhibitory (Slc32a1+ or Vgat cells) or excitatory (Slc17a6+ or Vglut2 cells) neurons, we observed that the vast majority of dlPAG Sst mRNAs were expressed in excitatory neurons (91% of Slc17a6+ cells were Sst+ cells). In contrast, the vast majority of vPAG Sst mRNAs were expressed in inhibitory neurons (95% of Slc32a1+ cells were Sst+ cells; Figure 2d-g).

a. Representative picture of single-molecular fluorescent in situ hybridization for Sst mRNAs in the PAG. Scale bar, 400 µm. b, c. Single-molecular fluorescent in situ hybridization for Sst (green) and Cre (red) mRNAs in the vlPAG (left). Histograms showing the co-expression of Sst/Cre as percentage of Sst-expressing cells (green) and as percentage of Cre-expressing cells (red) in the dlPAG and vlPAG (right). Scale bar, 20 µm. d. Single-molecular fluorescent in situ hybridization for Sst (red) and Slc32a1 (green) within the dlPAG (upper panel) and vlPAG (bottom panel). Scale bar, 20 µm. e. Quantification of colocalization within the dlPAG (upper panel) and vlPAG (bottom panel) of Sst+ and Slc32a1+. In the dlPAG approximately 19% of Slc32a1+ cells are Sst+ and 17% of Sst+ cells are Slc32a1+. On the contrary, in the vlPAG approximately 95% of Slc32a1+ cells are Sst+ and 61% of Sst+ cells are Slc32a1+. f. Single-molecular fluorescent in situ hybridization for Sst (red) and Slc17a6 (green) within the dlPAG (upper panel) and vlPAG (bottom panel). Scale bar, 20 µm. g. Quantification of colocalization within the dlPAG (upper panel) and vlPAG (bottom panel) of Sst+ and Slc17a6+. In the dlPAG approximately 91% of Slc17a6+ cells are Sst+ and 38% of Sst+ cells are Slc17a6+. On the contrary, in the vlPAG approximately 34% of Slc17a6+ cells are Sst+ and 33% of Sst+ cells are Slc17a6+.White arrows indicate colocalization.
Next, to evaluate the contribution of vlPAG SST inhibitory neurons in FCA, SST-Cre mice were injected in the vlPAG with a Cre-dependent AAV expressing the Channelrhodopsin (ChR2), Archaerhodopsin (ArchT), or GFP and optic fiber were implanted above the area of interested and submitted to the FCA task (see Methods; Figure 3a, b). Following conditioning, mice displayed a significant increase in freezing behavior during CS+ compared to CS- presentations or baseline activity (Figure 3c, e). Moreover, the conditioning levels during retrieval were not different between opsin and control groups (Supplementary Figure 4a-d). In the HP test following fear retrieval, the optogenetic activation of SST cells in the vlPAG during CS- had no effect, whereas the same manipulation performed during CS+ blocked the analgesic effect compared to GFP controls (Figure 3d and Supplementary Figure 5a). Conversely, optogenetic inhibition of vlPAG SST cells promoted analgesia in both CS- and CS+ conditions in comparison to GFP controls (Figure 3f and Supplementary Figure 5b). Importantly, we controlled that the increased delay and temperature at which mice displayed the nociceptive response during optogenetic manipulation of vlPAG SST cells was not due to motor or aversive components by submitting SST-Cre mice to optogenetic manipulation in an open field and a real-time place avoidance task (Supplementary Figure 5c-f). Moreover, the optogenetic effect observed during FCA was not due to alteration of somatostatin levels in our homozygous SST-Cre mice as we observed the same effect in heterozygous SST-Cre mice (Supplementary Figure 6a-d). Finally, and in striking contrast with vlPAG STT cells, the optogenetic inhibition of another important class of vlPAG inhibitory neurons expressing the vasoactive intestinal peptide (VIP) did not change the analgesic levels observed during CS- or CS+ presentations (Supplementary Figure 6e-h). Together, these data demonstrate that the selective inhibition of vlPAG SST cells promoted analgesia, whereas its activation suppressed FCA during CS+ presentations.
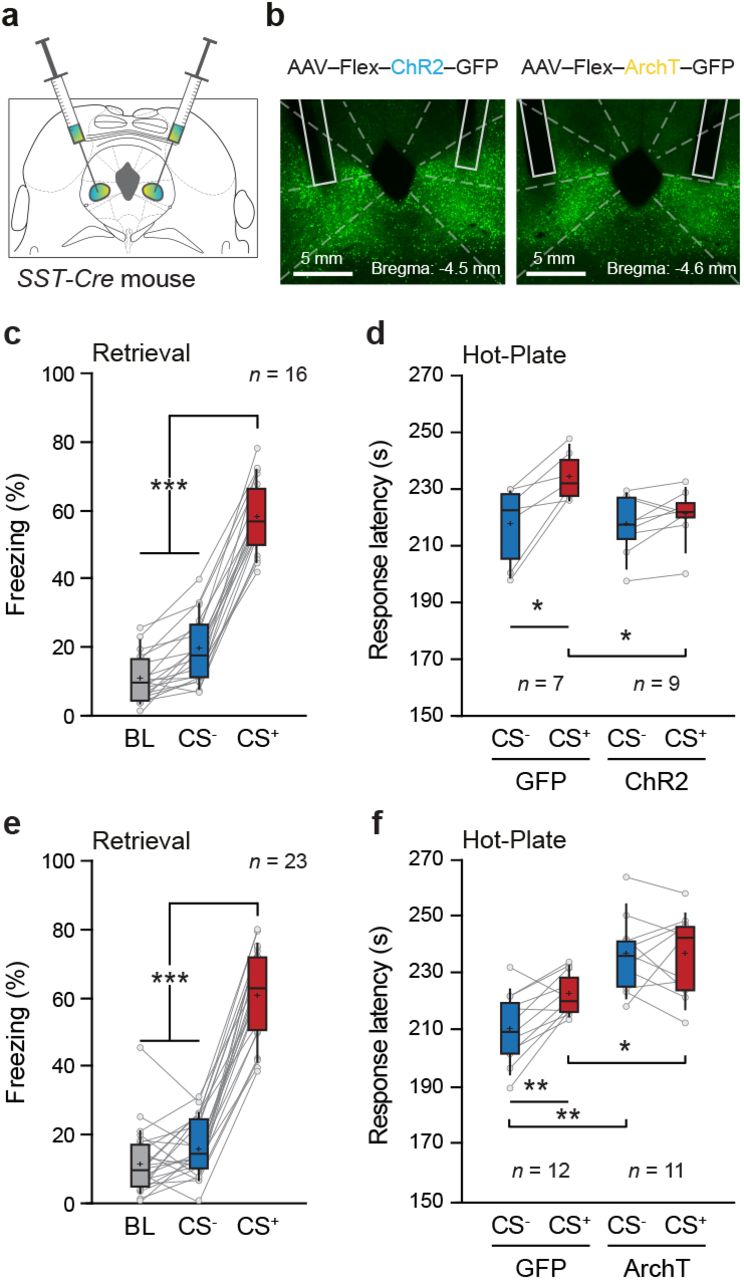
a. SST-IRES-Cre mice received bilateral injection of opsins in the vlPAG, and optic fibers were implanted above the region of interest. b. Representative example of expression patterns of ChR2 (left) and ArchT (right) within SST+ vlPAG neurons. c, e. Average freezing values during retrieval for ChR2-(c) and ArchT-infected mice (e) and their respective GFP-infected mice. The opsin and respective control groups were pulled together because no difference was found in the conditioning level (see Supplementary Figure 4). The average freezing values during CS+ was higher than CS- or baseline (BL) periods (***, P < 0.001, one-way repeated-measures ANOVA, (c) F = 396.787, n = 16 mice and (e) F = 280.420, n = 23 mice). d. Light activation of SST+ neurons abolished the analgesic effect of the fear modulation (*, P < 0.05, n = 7 GFP, n = 9 ChR2, opsin x CSs - two-way repeated-measures ANOVA, F(1,14) = 8.514). The nociception response time for the CS+ was significantly different between the ChR2 and GFP group (**, P = 0.0091, unpaired t-test). For the ChR2 group, the nociception response time during CS+ was equivalent to the CS- (ns, P = 0.4028, ChR2, unpaired t-test). On the contrary, the nociception response time between the CSs was different for the GFP group (*, P = 0.0157, GFP, unpaired t-test). f. Light inhibition of SST+ neurons increased the analgesic effect for the ArchT group when compared to the GFP (**, P < 0.01, n = 12 GFP, n = 11 ArchT, opsin effect - two-way repeated measured ANOVA, F(1,21) = 20.548, post hoc Bonferroni P = 0.0002). There was also a significant effect for the interaction between the opsins and the tones (**, P < 0.01, n = 12 GFP, n = 11 ArchT, opsin x CSs - two-way repeated measured ANOVA, F(1,21) = 10.637). The nociception response time for the CS- and CS+ was significantly different between the ArchT and GFP group (CS-: **, P < 0.0001, unpaired t-test; CS+:*, P = 0.0145, unpaired t-test).For the GFP group, the time of nociception response was higher for the CS+ trials when compared to the CS-trials (**, P = 0.0015, GFP, unpaired t-test), yet this was not the case for the ArchT group (ns, P = 0.9561, ArchT, unpaired t-test). Box-whisker plots indicate median, interquartile range, and 5th - 95th percentiles of the distribution. Crosses indicate means. Bullets indicate individual mice values.
Activation of vlPAG SST cells reduced fear expression and promoted spinal cord-related pain signals
Because our novel FCA paradigm is dependent on fear associative processes (Figure 1e-g and Supplementary Figure 2), it is possible that the optogenetic manipulation of vlPAG SST cells may have altered the expression of aversive memories (i.e., freezing) and thereby the expression of FCA. To control for this possibility, we optogenetically activated or inhibited vlPAG SST cells during a fear retrieval session 24 hrs following auditory fear conditioning (Figure 4a). Our data indicate that whereas the optogenetic inhibition of vlPAG SST cells had no effect on fear expression relative to GFP controls, their optogenetic activation reduced fear expression (Figure 4b-c). Importantly, the optogenetic activation of vlPAG SST cells did not modify fear learning when delivered concomitantly to the US (Supplementary Figure 7). These data clearly indicated that the manipulation of vlPAG SST cells did not interfere with the acquisition of conditioned fear behavior but that the activation of vlPAG SST cells impaired fear expression. These results have significant consequences as they might represent a main confound for the reduction in FCA observed during the optogenetic activation of vlPAG SST cells in the HP test during CS+ presentations (Figure 3). Indeed, the reduction of the response latency and temperature observed in the HP test could have been due to a decrease in freezing behavior rather than a direct reduction of FCA induced by vlPAG SST cells activation.

a. Protocol for optogenetic manipulation during fear retrieval. Day 1 and 2 were done as described previously for the FCA paradigm. During retrieval, there were 12 CS+ presentations divided by three blocks. The optogenetic manipulation was done during the 2nd block of the CS+ presentation. b. Light inhibition of SST+ neurons in the vlPAG did not modulate freezing levels (ns, P = 0.0984, n = 6, GFP 1st vs. 2nd CS+-block, unpaired t-test; ns, P = 0.5979, n = 8, ArchT 1st vs. 2nd CS+-block, unpaired t-test). c. Light activation of the SST+ neurons in the vlPAG had no effect on the GFP group (ns, P = 0.1768, n = 9, GFP 1st vs 2nd CS+-block, unpaired t-test) but it transiently decreases the levels of freezing for the ChR2 group (***, P = 0.001, n = 8, ChR2 1st vs. 2nd CS+-block, unpaired t-test). Box-whisker plots indicate median, interquartile range, and 5th - 95th percentiles of the distribution. Crosses indicate means. Bullets indicate individual mice values. Yellow and blue shaded rectangles represent the period of optical inhibition and activation, respectively.
To control for this possibility, we reasoned that activation of vlPAG SST cells might reduce FCA in the HP test by promoting nociception directly at the level of the spinal cord DH. Therefore, we performed extracellular recording of the spinal cord network before, during, and after optogenetic stimulation of vlPAG SST cells in mice under anesthesia to determine if nociceptive-mediated field potentials were modified by the optogenetic activation or inhibition of vlPAG SST cells (Figure 5a). Our results indicated that the optogenetic activation of vlPAG SST cells during suprathreshold electrical stimulation of the paw potentiated, whereas their optogenetic inhibition reduced, nociceptive field potentials (Figure 5b, c). To determine if this effect was specific for the nociceptive network, we recorded wide dynamic range (WDR) neurons in the DH, known to receive both tactile and nociceptive information. Suprathreshold C-fiber stimulations induced a fast burst of spikes (0-80 ms), mediated by large-diameter myelinated non-nociceptive fibers, followed by a slow burst of spikes (80-150 ms) mediated by low diameter unmyelinated nociceptive C-fiber (Figure 5a bottom). Interestingly, the optogenetic activation of vlPAG SST cells increases both responses, with a larger effect on nociceptive C-fibers (Figure 5d). Conversely, the optogenetic inhibition of vlPAG SST cells specifically inhibited nociceptive responses while non-nociceptive responses remained unaffected (Figure 5e). To confirm that vlPAG SST cells manipulation acts predominantly on the nociceptive network, we performed two additional experiments. First, under conditions in which subthreshold electrical stimulations failed to elicit WDR neuronal responses, we observed that the optogenetic activation of vlPAG SST cells promoted WDR responses at a latency corresponding to nociceptive fibers (Figure 5f). Second, we performed a windup protocol inducing WDR short-term sensitization specific of nociceptive networks (see Methods). Our results indicated that windup amplitude increased when vlPAG SST cells were activated and decreased when vlPAG SST cells were inhibited compared to GFP controls (Supplementary Figure 8). Consistent with our observation in freely moving mice in the HP test, these data strongly suggest that activation and inhibition of vlPAG SST cells decreased and increased FCA by specifically promoting nociception and antinociceptive responses in the spinal cord DH, respectively.

a. Optogenetic manipulation of vlPAG SST cells with concomitant noxious electrical stimulation of the paw in anesthetized mice while recording nociceptive field potentials in the lumbar spinal cord. b. Representative trace of nociceptive field potentials in the lumbar spinal cord before and during optogenetic activation of vlPAG SST cells (upper panel). The activation of vlPAG cells induces a significant increase in the nociceptive fields (bottom panel; OFF1 = 0.000095 ± 0.00001 µV/ms; ON = 0.00017 ± 0.00002 µV/ms, OFF2 = 0.000090 ± 0.00002 µV/ms; ***, P < 0.001, one-way repeated-measures ANOVA, F = 17.943) c. Representative trace of nociceptive field potentials in the lumbar spinal cord before and during optogenetic inhibition of vlPAG SST cells (upper panel). The inhibition of vlPAG cells induces a significant decrease in the nociceptive fields (bottom panel; OFF1 = 0.00017 ± 0.00009 µV/ms; ON = 0.00006 ± 0.00002 µV/ms, OFF2 = 0.00012 ± 0.00004 µV/ms; n = 6. *, P < 0.05, Wilcoxon signed-rank test). d. Representative trace single-unit recordings of WDR neurons before and during optogenetic activation of vlPAG SST neurons (upper panel). The activation of vlPAG SST cells induces a significant and global increase in WDR response to both C and A mediated peripheral fibers (bottom panel; *, P < 0.05, one-way repeated-measures ANOVA, FA-fiber = 4.998; ***, P < 0.001, one-way repeated-measures ANOVA, Fc-fiber = 22.966). e. Representative trace single-unit recordings of WDR neurons before and during optogenetic inhibition of vlPAG SST neurons (upper panel). The inhibition of vlPAG SST cells induces a significantly and, specifically, inhibition of WDR response to C-mediated peripheral fibers (bottom panel; ***, P < 0.001, Wilcoxon signed-rank test). f. Representative traces of single-unit recordings of WDR neurons with subthreshold electrical stimulation accompanied by optogenetic activation of vlPAG SST neurons (upper panel). The optogenetic activation of vlPAG SST cells elicits WDR response to C-mediated peripheral fibers (ns, P =0.1215, A-fiber ON vs OFF; ***, P < 0.001, C-fibers OFF vs ON - Wilcoxon signed-rank test).
vlPAG SST cells mediating FCA contact RVM spinal cord-projecting neurons
These data raise the question of whether vlPAG SST cells mediate their pronociceptive effect by contacting directly WDR neurons in the spinal cord or alternatively by contacting center structures projecting to the spinal cord. To address this question, we performed anatomical tracing in mice injected in the vlPAG with a Cre-dependent AAV expressing GFP. Our analyses revealed massive labeling of SST fibers in the rostral ventromedial medulla (RVM) (Figure 6a, b) and sparse labeling within the spinal cord but not in the DH where nociceptive projections neurons are present (data not shown). Importantly, in the same animals, fluorogold retrograde labeling of RVM neurons projecting to the DH revealed close apposition of SST putative boutons and RVM neurons projecting to the DH (Figure 6d), indicating that vlPAG SST cells project to the RVM and contact DH-projecting RVM neurons. To address the function of these indirect vlPAG SST cells inputs to the DH, we performed optogenetic activation of vlPAG SST inputs in the RVM (Figure 6e) while recording from WDR neurons during electrical stimulation of the paw. Optogenetically activating vlPAG SST inputs in the RVM resumed the WDR pain-response potentiation observed by stimulating vlPAG SST compared to GFP controls (Figure 6e-g and Supplementary Figure 9). Importantly, to exclude the contribution of potential “en passant” fibers projecting directly to the spinal cord, we performed recordings of WDR neurons while directly optogenetically manipulating descending fibers above the dorsal column. In contrast to direct vlPAG SST cells manipulation that increased nociceptive response, the optogenetic manipulation of vlPAG SST inputs in the DH had no effect on nociceptive transmission (Figure 6h). To further confirm in behaving animals that activation of vlPAG SST neurons projecting to the RVM mediate FCA without interfering with freezing behavior, SST cre mice were injected in the vlPAG with an AAV expressing ChR2 and optic fibers placed above the RVM (Figure 7a). We first observed that activating vlPAG SST neurons projecting to the RVM had no effect on fear expression (Figure 7 b) supporting the notion that freezing behavior and FCA are mediated by distinct pool of vlPAG SST neurons. Next, another cohort of AAV injected mice were fear conditioned and tested in the HP test. Following conditioning, mice displayed a significant increase in freezing behavior during CS+ compared to CS- presentations or baseline activity (Figure 7c). In the HP test following fear retrieval, the optogenetic activation of vlPAG SST terminals in the RVM during CS- had no effect, whereas the same manipulation performed during CS+ blocked the analgesic effect compared to GFP controls (Figure 7d). Altogether, these data clearly demonstrate that vlPAG SST mediates FCA by contacting RVM neurons projecting to the DH and suggest the existence of two populations of vlPAG SST neurons mediating respectively FCA and freezing behavior.

a. Representative example of expression patterns of GFP within SST+ vlPAG neurons. b. A representative example of the same mouse as in (a), GFP labelled fibers are present in the RVM (left panel). Higher magnification reveals putative axonic buttons in the RVM (right panel; white arrows for putative axonic buttons). c. SST Cre mice were injected concomitantly with GFP in the vlPAG and fluorogold in the lumbar dorsal horn of the spinal cord. d. Fluorogold positive neurons (red) cross vlPAG SST fibers in the RVM (green). Higher magnification shows close contacts between the putative SST+ button and fluorogold+ neurons or fibers (white arrows). e. Single-unit recordings of WDR neurons in the lumbar spinal cord during optogenetic activation of vlPAG SST inputs to the RVM (left panel). The optogenetic activation of vlPAG SST inputs to the RVM induces a significant increase in WDR response to both C and A-mediated peripheral fibers stimulation (right panel; *, P < 0.05, A-fibers; **, P < 0.01, C-fibers - Wilcoxon signed-rank test). f. Activation of vlPAG SST inputs to the RVM switches a subliminal peripheral stimulation in a supraliminal response (OFF = 0.06 ± 0.04 spikes; ON = 4.2 ± 1.2 spikes, n=10, **, P < 0.01, OFF vs. ON - Wilcoxon signed-rank test). g. Windup coefficient of WDR cells is significantly increased by optogenetic activation of vlPAG SST inputs to the RVM (OFF = 28 ± 18; ON = 78 ± 22, n=6, **, P < 0.01, OFF vs. ON - Wilcoxon signed-rank test). h. Single-unit recordings of WDR neurons in the lumbar spinal cord during optogenetic activation of vlPAG SST cells with optic fibers placed either above the vlPAG or above the lumbar spinal cord (left panel). Light delivery above the vlPAG increased the WDR response to nociceptive C-fiber stimulation but not if the light was delivered above the lumbar spinal cord (right panel; ***, P < 0.001, vlPAG ON vs. OFF; ns, P = 0.2412, Spinal cord ON vs. OFF - Wilcoxon signed-rank test).

a, top. SST-IRES-Cre mice received bilateral injection of an AAV expressing ChR2 or GFP in the vlPAG, and optic fibers were implanted above the RVM. Bottom, Representative example of SST+ vlPAG neurons terminals in the RVM. b. Light activation of vlPAG SST+ neurons projecting to the RVM did not modulate freezing levels (ns, P = 0.0775, n = 7, GFP 1st vs. 2nd CS+-block, unpaired t-test; ns, P = 0.0642, n = 6, ChR2 1st vs. 2nd CS+-block, unpaired t-test). c. Average freezing values during retrieval for ChR2 and GFP-infected mice. The opsin and respective control groups were pulled together because no difference was found in the conditioning level. The average freezing values during CS+ was higher than CS- or baseline (BL) periods (***, P < 0.001, one-way repeated-measures ANOVA, (c) F = 274.215, n = 14 mice). d. Light activation of SST+ neurons abolished the analgesic effect of the fear modulation (**, P < 0.05, n = 7 GFP, n = 6 ChR2, opsin x CSs - two-way repeated-measures ANOVA, F(1,12)= 19.875). For the ChR2 group, the nociception response time during CS+ was equivalent to the CS- (ns, ChR2, unpaired t-test P = 6458). On the contrary, the nociception response time between the CSs was different for the GFP group (**, P < 0.01, GFP, unpaired t-test).
Discussion
In this study, we demonstrated that inhibitory SST neurons located within the vlPAG are causally involved in the regulation of pain responses during a threatful situation. First of all, our data indicate that the development of FCA as shown with a reduction in thermal pain sensitivity following cued fear conditioning depends on associative processes. Moreover, the use of a cue as a conditioned stimulus instead of a context allows for a time-marked onset and offset. We argue that using a cue makes the FCA model more suitable for time-controlled manipulations such as optogenetics and electrophysiology recordings. To our knowledge, this is the first demonstration of a conditioned analgesia paradigm using a cue as a CS instead of a context.
Second, our data indicate that the activation of vlPAG SST neurons impaired FCA, whereas their inhibition increases analgesia in a CS-independent manner. Third, we observed that activation and inhibition of vlPAG SST cells decreased and increased FCA by specifically promoting pronociceptive and antinociceptive responses in the spinal cord DH. Finally, we demonstrated that vlPAG SST mediates FCA by contacting RVM neurons projecting to the DH. Together these results identify a novel brainstem circuit composed of vlPAG SST cells specifically projecting to the RVM and mediating FCA to regulate pain responses during threatful situations.
Our observation that the optogenetic activation of vlPAG SST cells reduced FCA by promoting pronociception at the spinal cord while simultaneously impacting freezing behavior opens interesting questions. First, our results are in a contrast with the seminal study of Helmstetter and Fanselow, who demonstrated that injection of the opioid antagonist naltrexone reversed conditioned analgesia without impacting freezing behavior20. Our data on vlPAG SST cells rather suggest the existence of an overlap between the neuronal circuits mediating the expression of freezing behavior and those involved in the regulation of pain processes. Indeed, a recent report demonstrated that freezing expression critically depends on vlPAG disinhibitory mechanisms involving local GABAergic interneurons9. This fear circuit recruits long-range inhibitory inputs from the central medial amygdala contacting local inhibitory cells within the vlPAG, which inhibition promoted the disinhibition of vlPAG excitatory neurons projecting to the motor center, ultimately leading to freezing behavior. In this model, activating the local vlPAG inhibitory neurons reduced fear expression, an observation similar to the effect we observed when we optogenetically activated vlPAG SST cells (Figure 4c). This effect was accompanied in our case with a reduction of FCA, which depends on the vlPAG SST projection to the RVM (Figure 3d). Although these results may indicate that local vlPAG inhibitory neurons involved in freezing expression correspond to vlPAG SST cells, our observation that the optogenetic inhibition of vlPAG SST cells did not induce freezing behavior as observed in Tovote et al. suggests otherwise. First of all, it is possible that different populations of SST neurons exhibiting local or distinct remote connectivity co-exists within the vlPAG, which could explain why the optogenetic manipulation in the vlPAG decreases both freezing expression and FCA. An alternative explanation could be that other vlPAG interneuronal types are involved in freezing expression and FCA. However, our optogenetic manipulation of another major class of vlPAG inhibitory cells expressing VIP did not impact FCA (Supplementary Figure 6e-h). Additional vlPAG microcircuits studies will be necessary to disentangle these issues.
Our data also indicate that the optogenetic activation of vlPAG SST cells reduced FCA during CS+ presentations, whereas their inhibition was less specific and promoted FCA to both the CS- and CS+ (Figure 3). Although we do not know whether vlPAG SST cells change their firing activity during FCA, these data suggest that vlPAG SST cells activity is reduced during FCA and that normalizing their activity using optogenetic activation is sufficient to prevent FCA. However, the fact that optogenetically activating vlPAG SST cells during CS- presentations has no effect on the pain threshold indicates that vlPAG SST cells do not play a direct role in nociception mechanisms when emotional systems are not engaged (i.e., during CS- presentations) or alternatively is indicative of a floor effect. Our data also suggest that inhibiting vlPAG SST cells activity promoted analgesia even under conditions in which FCA is not induced (i.e., during CS- presentations), further supporting the idea that antinociception in the context of FCA is specifically mediated by a reduction in the firing activity of vlPAG SST.
Our data also complement the classical lateral inhibition model of antinociception within the PAG, relying on the activation of PAG excitatory neurons projecting to the RVM. More precisely, in this model, analgesia is thought to occur through an opioid-dependent inhibition of GABAergic neurons, ultimately disinhibiting excitatory neurons projecting to the RVM13, 21. This hypothesis was recently confirmed by optogenetic experiments in which the optogenetic activation of PAG glutamatergic neurons induced analgesia9. Our data indicate that in addition to this disinhibitory mechanism, analgesia is also mediated by the inhibition of a direct long-range inhibitory projection onto RVM neurons projecting to the DH (Figure 6). Thus, thermal analgesia relies on both excitatory and inhibitory pathways projecting to the RVM. Further studies will be required to identify which cells types are involved at the level of the RVM and whether other forms of analgesia also rely on these excitatory and inhibitory inputs to the RVM. Finally, understanding the circuits and mechanisms mediating FCA will extend our knowledge on the interplay between emotional and pain systems.
METHODS
Subject details
We used either male C57BL6/J mice (Janvier), heterozygous or homozygous SST-IRES-Cre mice (Jackson laboratory), or heterozygous VIP-IRES-Cre mice (Jackson Laboratory) age 8-14 weeks that were individually housed under a 12 h light-dark cycle and provided with food and water ad libitum. All procedures were performed in accordance with standard ethical guidelines (European Communities Directive 86/60-EEC) and were approved by the committee on Animal Health and Care of Institut National de la Santé et de la Recherche Médicale and the French Ministry of Agriculture and Forestry (agreement #A3312001).
Behavioral apparatus
Fear conditioned analgesia task was performed in three different contexts (Figure 4a). Context A was used for Habituation and Retrieval and consisted of a plexiglass cylinder (25 x 24 cm diameter) with a grey, smooth plastic floor, and house-lights. Context B was used for Conditioning and consisted of a square plexiglass (25 x 40 cm) with a grid floor connected to a shocker (Coulbourn Instruments) and brighter house-lights. A total of 5 scrambled foot-shocks of 1 s duration and intensity of 0.8 mA were delivered via the grid floor and served as the unconditioned stimulus (US). Context A and B were cleaned, respectively, with 70% ethanol or 1 % acetic acid between different mice. Both contexts contained an infrared beams detection that automatically scored freezing periods. Mice were considered freezing if no movement, except respiratory movement, was detected for at least 2 s.
Context C was used for the Hot Plate test (HP test). A steady increase in temperature was controlled by the Incremental Hot/Cold Plate Analgesia Meter (IITC) device. The device had a testing surface enclosed in a square plexiglass surface (20.3 x 10 x 20.5 cm) to restrain the mice movement. The mice’s temperature and surroundings were recorded with an infrared digital thermographic camera (Testo 885) placed ∼ 50 cm above the testing surface. The thermal camera had a spatial resolution of 320 × 240 pixels, a sampling rate of 25 Hz, and thermal sensitivity of 0.03 °C at 30 °C. The testing surface of context C was cleaned with water between different mice. All three contexts were enclosed in an acoustic foam isolated box with speakers mounted on the top of each compartment. The auditory conditioned stimulus (CS) consisting of either 7.5 kHz or white-noise 50 ms pips at 1 Hz repeated 27 times, 2 ms rise and fall, 80 dB sound pressure level.
Open field task was performed in a square plexiglass arena (36 x 36 x 25cm). A LED mounted on the top-right side of the arena signaled the start and end of different epochs for offline analyses. A video camera recorded from above the arena at 30 fps for offline video-tracking purposes.
Real-Time Place Preference (RTPP) task was performed in a shuttlebox consisting of a plexiglass box (40 x 10 x 30 cm) with a floor grid, where a small plastic hurdle (1 cm height) divided the arena into two equal compartments while infrared beams detection automatically monitored the mice shuttling between compartments (Imetronic). A video camera recorded from above the arena at 30 fps for offline video-tracking purposes. For both the open field and RTPP task, a free user video-tracking software (idTracker: Tracking individuals in a group by automatic identification of unmarked animals) together with in-house codes in Matlab (The MathWorks, Inc., Natick, MA, USA) were used to analyze each condition.
Behavioral paradigm
Fear conditioned analgesia
WT Mice (n = 12) were habituated to the context and tones (Day 1). Four white-noise (CS-) and four 7.5 kHz (CS+) tones were presented sequentially and without US reinforcement. In Conditioning (Day 2), five CS- and five CS+ were presented in an intermingled fashion. The CS+ presentations were paired with a mild foot-shock (US) at tone offset, whereas the CS- was never reinforced. The retrieval session (Day 3) was done 24h after Conditioning and in the same context as the Habituation session. As in Habituation, four CS- and four CS+ were presented sequentially and without US reinforcement (Figure 4a).
Since the focus of this study was the emotional modulation of pain sensitivity, it was compulsory to evaluate the associative fear levels before measuring its impact on pain sensitivity. Two indices were computed: the discrimination index (DI), to assess the level of discrimination between CS- and CS+, and the conditioning index (CI), which indicated the level of freezing to the tone predicting the US. These indexes were calculated as follows:  and CI = DI × (Freezing to CS+). Based on preliminary data, mice were only submitted to the HP test if DI ≥ 0.4 & CI ≥ 0.3. Mice that did not fit the criteria were conditioned a second time. There was a minimum time interval of 2 h between the retrieval and the HP test.
The HP test consisted of two trials, one trial where the CS+ was presented (HP_CS+) and another where the CS- was presented (HP_CS-). The two trials were counterbalanced within group. The testing surface was set at 30 °C (Supplementary Figure 1d), and after a 60 s acclimatization period, its temperature gradually increased at a rate of 6 °C per minute (HP start). Tone presentation (CS+ or CS-) started 130 s after the HP start. Temperature increase and tone presentation terminated concomitantly with the display of a nociception response. Valid nociception readout responses included jumping or licking the hind-paw. The effect of the emotional modulation on pain sensitivity was assessed by comparing the time (or temperature) of the nociceptive response between the two HP trials: [ΔHP= (HP_CS+) - (HP_CS-)]. There was a minimum of 30 min interval between the two trials for each mouse, during which mice returned to their home cage.
Freezing levels during the HP test were manually scored offline. Three periods for the HP freezing were defined: i. baseline period, 30 s before the CS onset; ii. early period, first 30 s of CS presentation; iii. late period, 30 before CS offset (Supplementary Figure 1d). Freezing scoring was calculated using the videos from the infrared digital thermographic camera. The nature of the trial was blinded to the researcher.
Extinction training
On Day 3 and 4, mice (n =10) were submitted to an extinction training protocol established by Courtin et al.7. Briefly, there were 4 CS- and 12 CS+, presented in a non-reinforced manner (Figure 4d). Mice were considered as having successfully extinguished the fear expression if the level of freezing in the last 4 CS+ was not statistically different from the CS-. After fear extinction, mice were submitted to the HP test, using the same parameters as in the FCA paradigm.
Stability training
The first three days consisted of the classical FCA paradigm. On Day 4, mice (n = 10) repeated the protocol applied on Day 3 (Supplementary Figure 3a). All mice that passed the fear conditioning criteria (DI ≥ 0.4 & CI ≥ 0.3) on Day 3 were kept for the following day, independent of their level of Conditioning on Day 4.
Vasoconstriction assay
To determine if vasoconstriction was a confound of the HP test outcomes, we used a modified version of the FCA paradigm (Supplementary Figure 3f). During the HP test (n = 13), the temperature was not gradually increased but maintained at 30 °C while CSs were presented. The tones (CS+ or CS-) were presented for 120 s, and mice were kept for an additional 50 s before the HP trial terminated. Offline, with the infrared videos, mice back and tail were measured at 30 s intervals. For each measuring point, the temperature of three spots of the two body part was averaged to create the body temperature for the back and tail for a given time point and mouse.
Basal nociception assay
Naïve mice (n = 10) were submitted to the HP test (Supplementary Figure 2a, left panel). Each mouse underwent two identical trials. The HP test was identical to the one described in the FCA paradigm, except no tones were presented. There was a minimum of 30 min interval between the two trials, during which mice returned to a restful state on their home cage.
Tone-specific nociception assay
Naïve mice (n = 12) were submitted to the HP test without auditory fear conditioning (Supplementary Figure 2a, middle panel). Each animal underwent two trials, one trial with a 7.5 kHz tone presentation and another with a WN tone presentation. The tone presentation was counterbalanced. The HP test parameters were identical to the one described for the FCA except that both tones were unconditioned.
Conditioning-specific nociception assay
Mice (n = 7) were submitted to the classical FCA paradigm with one exception: on Day 3 during the HP test, no CSs were presented (Supplementary Figure 2a, right panel). Mice were submitted to two identical HP trials.
Open Field assay
This test was used to determine the effect of optogenetic stimulation on locomotion. Therefore, only mice from optogenetic experiments were submitted to this assay. Mice could freely move during the entire test. The locomotion assay had a total duration of 9 min and was divided into 3 min epochs. The first and third epochs were OFF periods in which no optical stimulation occurred. During the second epoch, mice received optical stimulation (ON period). The optogenetic stimulation effect was analyzed by comparing the overall distance traveled between the OFF and ON epochs (Supplementary Figure 5c, d). Mice injected with GFP were used to test the effect of heat and light of the stimulation itself.
Real-time Place Preference assay
During the entire duration of the assay, mice could freely shuttle between the two compartments. Under a closed-loop stimulation, mice received photo-stimulation upon entry in one of the two compartments. The stimulated compartment was counterbalanced within the group. The optical stimulation effect was assessed by comparing the time spent in the stimulated compartment between the ChR2 and GFP groups (Supplementary Figure 5f).
Virus injections and optogenetics
For optogenetic manipulation of SST-Cre neurons in the vlPAG, 0.15-0.2 µL of either ChR2 (AAV5-EF1a-DIO-hChR2(H134R)-EYFP, titer: 3.2×10¹² - Vector Core, University of North Carolina), ArchT (AAV9-CAG-FLEX-ArchT-GFP, titer: 4.7×10¹² - Vector Core, University of North Carolina) or GFP (AAV5-FLEX-GFP, titer: 4.5×10¹² - Vector Core, University of North Carolina) were bilaterally injected into the vlPAG of 8/9 weeks old SST-Cre mice from glass pipettes (tip diameter 20-30 µm) at the following coordinates relative to bregma: - 4.4 mm AP; ± 1.5 mm ML; -2.45 mm DV from dura, with a 20 degrees angle. Injection coordinates for manipulation of VIP-Cre neurons in the vlPAG were the following: - 4.4 mm AP; ± 1.35 mm ML; -2.5 mm DV from dura, with a 20 degrees angle.
At two weeks after the injections, mice were bilaterally implanted with custom-built optic fibers (diameter: 200 µm; numerical aperture: 0.39; Thorlabs) above the vlPAG at the following coordinates relative to bregma: i) SST-IRES-Cre mice: - 4.4 mm AP; ± 1.0 mm ML; -1.8 mm DV from dura, with a 10 degrees angle; ii) VIP-IRES-Cre mice: - 4.4 mm AP; ± 0.8 mm ML; -2.0 mm DV from dura, with a 10 degrees angle. Mice for RVM manipulations were implanted at the following coordinates relative to bregma: -5.8 mm AP; 0.0 mm ML; -5.2 DV from the dura. All implants were secured using three stainless steel screws and Super-Bond cement (Sun Medical). During surgery, long- and short-lasting analgesic agents were injected (Metacam, Boehringer; Lurocaïne, Vetoquinol). After surgery, mice were allowed to recover for at least five days. Afterward, mice were daily handled to familiarize themselves with being restrained for the connection of the optic fibers. Behavioral experiments were performed at least four weeks after viral injections. Only mice with correct placement of optic fibers and virus expression restricted to vlPAG were included in the analyses.
For optogenetic excitation, light stimulation consisted of blue light (473 nm, ∼8-10 mW at fiber tip) delivered with 2 Hz frequency and 5 ms pulse duration. In contrast, optogenetic inhibition, light stimulation consisted of green light (532 nm, ∼8-10 mW at fiber tip) delivered continuously. For optogenetic manipulations during the FCA paradigm of either vlPAG SST or VIP cells, the light was delivered during the HP test and paired with the tone presentation.
For stimulation during the fear conditioning, two sets of experiments were performed in a sequential manner. First, the foot-shock US was replaced by the optical stimulation. Then, the US became the optical stimulation combined with the foot-shock (Supplementary Figure 7a). For both conditions, the optogenetic stimulation started 5 s before and lasted until 5 s after CS+ offset. The same mice were used for both experiments. For the manipulations during the fear retrieval, there were 12 CS+ presentations divided into blocks of 4 CS+. The optogenetic stimulation was paired with the second block of CS+.
Fluorogold injection
An incision between one to two cm was made slightly caudal to the peak of the dorsal hump to expose the lumbar spinal region. The vertebra of interest was identified, and then a small incision was made between the tendons and the vertebral column on either side. The vertebra was then secured using spinal adaptor clamps, and all tissue was removed from the surface of the bone. Pulled borosilicate glass capillaries (Ringcaps, disposable capillary pipettes with ring mark, DURAN, Hirschmann Laborgeräte, Germany) was inserted in the space between 2 vertebrae and allow to microinject 50 nL of fluorogold 2% in the dorsal horn of the spinal cord on both sides.
In vivo electrophysiology
Mice were anesthetized with isoflurane 4% for induction then 1.5% maintenance. The experiment was started as soon as there was no longer any reflex. The colorectal temperature was kept at 37 °C with a heating blanket. Two metal clamps were used to set the animal spine in a stereotactic frame (M2E, France) for stability during electrophysiological recordings. Then, a laminectomy was performed at T13-L1 to expose the lumbar part of the spinal cord. The dura mater was carefully removed. A vaseline pool was formed around the exposed spinal segments to ensure that no drug was administered beyond the area of interest. Custom-made optical fibers were placed 1mm above the dorsal spinal cord for optogenetic manipulations. C-fiber-evoked field potentials were recorded in the deep lamina of the DH (at a depth range of 250 and 500 µm) with borosilicate glass capillaries (2 MΩ, filled with NaCl 684 mM; Harvard Apparatus, Cambridge, MA, USA). Field potentials were recorded with an ISODAM-amplifier (low filter: 0.1Hz to high filter: 0.1 kHz; World Precision Instruments, USA) in response to electrical stimulation of the ipsilateral paw. Single unit recordings of WDR DH neurons were made with the same borosilicate glass capillaries mentioned above and placed in the dorsal part of the spinal cord. The criterion for selecting a neuron was the presence of an A-fiber-evoked response (0-80 ms) followed by a C-fiber-evoked response (80-150 ms) to electrical stimulation of the ipsilateral sciatic nerve.
Trains (every 30 s) of electrical stimulation at two times the threshold for C-fibers were performed before, during, and after optogenetic stimulations with an optic fiber place above the recording site. Subthreshold stimulations were performed below the threshold for C-fiber and A-fiber, respectively. Windup was recorded by ten repetitive electrical stimulations at 1 Hz at two times the C-fibers threshold.
Histology analyses
Mice were administered a lethal dose of Exagon and underwent transcardial perfusions via the left ventricle with 4% w/v paraformaldehyde (PFA) in 0.1 M PB. Following dissection, brains were post-fixed for 24 h at 4°C in 4% PFA. Brain sections of 80 µm-thick were cut on a vibratome, mounted on gelatin-coated microscope slides, and dried. For verification of correct viral injections and optic fiber location, serial 80 µm-thick slices containing the regions of interest were mounted in VectaShield (Vector Laboratories) and were imaged using an epifluorescence system (Leica DM 5000) fitted with a 10-x dry objective. The location and the extent of the injections/infections were visually controlled. Only infections targeting the vlPAG and optic fibers terminating, depending on the experiment, above the vlPAG or RVM were included in the analyses. For a subset of animals, verification of both viral expression in the vlPAG and location of optic fiber in RVM, serial of 20 µm thin slices containing the RVM were incubated free-floating in 0.1 M PBS containing Triton X-100 (0.3%), Bovine Serum Albumin (1%; Sigma-Aldrich), and chicken anti-GFP antibody (1:1000; Averlabs) overnight at 4 °C. After washing in 0.1 M PBS, secondary antibodies, Alexa fluor 488–conjugated goat anti-chicken (1:500), were added in 0.1-M PBS for 2 hours at room temperature. Sections were finally viewed on a confocal microscope (Leica TCS SPE, Mannheim, Germany) fitted with a 20-x dry objective, and both 40-x and 63-x oil immersion 1.3 NA objective and confocal image stacks (0.75 µm steps) were acquired for each sample.
Single molecular in situ hybridization
Analyses of Sst, Cre, Slc32a1 and Slc17a6 mRNAs expression were performed using single molecule fluorescent in situ hybridization (smFISH). Brains from 2 Sst-Cre male mice were rapidly extracted and snap-frozen on dry ice and stored at -80°C until use. Fourteen µm coronal sections of the PAG (bregma -4.60 mm) were collected directly onto Superfrost Plus slides (Fisherbrand). RNAscope Fluorescent Multiplex labeling kit (ACDBio Cat No. 320850) was used to perform the smFISH assay according to manufacturer’s recommendations. Probes used for staining are Mm-Sst (ACDBio Cat No. 404631), Mm-Slc32a1-C2 (ACDBio Cat No. 319191-C2), Mm-Slc17a6-C2 (ACDBio Cat No. 319171-C2), Cre (ACDBio Cat No. 312281) and Mm-Sst (ACDBio Cat No. 404631-C2). After incubation with fluorescent-labeled probes, slides were counterstained with DAPI and mounted with ProLong Diamond Antifade mounting medium (Thermo Fisher scientific P36961). Confocal microscopy and image analyses were carried out at the Montpellier RIO imaging facility. Image covering the entire PAG was single confocal sections acquired using sequential laser scanning confocal microscopy (Leica SP8) and stitched together as a single image. Triple-labeled images from each region of interest (dPAG and vPAG) were single confocal sections captured using sequential laser scanning confocal microscopy (Leica SP8). Values in the histograms represent co-expression as percentage of Sst-expressing cells (green) and as percentage of cells expressing the other markers tested (Cre, Slc32a1 and Slc17a6) (3-4 images in the dPAG and vPAG per mouse, n = 2 mice).
Statistics
All data are presented as means ± s.e.m. Box-whisker plots indicate median, interquartile range, and 5th - 95th percentiles of the distribution. Statistical analyses were performed with StatView software. No statistical methods were used to predetermine sample sizes, but sample sizes were based on our lab prior studies. No randomization was used to assign experimental groups. Blinding for the opsin was done for optogenetics experiments. Animals used for the FCA paradigm not satisfying the fear conditioning criteria after two conditioning sessions were discarded from the study. Mice with an incorrect injection of the opsins or misplace location of the optic fibers were discarded. No other mice or data points were excluded. Significance levels are indicated as follows: *p<0.05, **p<0.01, ***p<0.001.
For in vivo electrophysiology, field potentials were measured as the area above the curve in the C-fiber range (80-300 ms). Absolute values were used to compare values in each condition (OFF vs. ON optogenetic manipulation). In single-unit recordings, the number of A- and C-fiber induced spikes of WDR neurons were measured after each electrical stimulation, during and after optogenetic manipulation. An average of the four stimulations for each WDR recorded was used for statistical analysis. For windup measurement, a series of 10 repetitive electrical stimulations at 1 Hz and two times over the threshold for C-fibers were performed. A windup coefficient was measured as the sum of C-spikes of the ten different stimulations subtracted ten times the response to the first stimulation (Sum (R1+R2+…+R10)-10*(R1)). A Wilcoxon matched-pairs signed-rank test was performed to compare the response before and during optogenetic manipulation.
AUTHOR CONTRIBUTIONS
N.W and S.V performed behavioral experiments. N.W and D.J performed optogenetic experiments on freely moving animals. F.A performed electrophysiological and optogenetic experiments on anesthetized animals. L.C, E.V, N.W, F.A, D.J and GZ performed histology. N.W, M.L, S.V. P.F and C.H. designed the experiments. N.W, F.A, D.J and E.V analysed the data, N.W, P.F and C.H wrote the paper.
SUPPLEMENTARY FIGURES
Supplementary Figure 1: Fear-conditioned analgesia behavior. a. During habituation, the freezing levels for the context (BL) and the two tones were low but significantly different (***, P < 0.001, one-way repeated-measures ANOVA, F = 15.562, n = 12). b. Conditioning curves for CS+ and CS-. Overall, average freezing levels for BL was different when compared to the CSs (***, P < 0.001, one-way repeated-measures ANOVA, F = 9.273, n = 12). Freezing levels for the last tone presentation during conditioning was not significantly different between CS+ and CS- (ns, P = 0.7805, one-way repeated-measures ANOVA, F = 0.082, n = 12) c. -Temperature at which a nociceptive behavioral response was observed in the HP. The temperature of nociception response was higher during CS+ trials when compared to the CS- trials (**, P < 0.01, one-way repeated measures ANOVA, F = 20.067, n = 12). d. Schematics of the HP kinetics. Mice had 1 min to acclimatize to the context. Then the temperature steadily increase at 6 °C per min (HP start). The CSs started 130 s after the HP start and continued until mice displayed a nociception response (licking the hind-paw or jumping). At this point, both the CS and the temperature increase stopped, ending the trial. Offline, 3 points were determined: i. Baseline, 30 s before CS onset; ii. Early, first 30 s of the CS; iii. Late, last 30 s of the CS offset. In purple, an exemplary trace of a trial recorded with the infrared digital thermographic camera. e. Freezing levels during the HP test for CS- and CS+ presentation. Freezing levels were measured offline during baseline, early and late periods (see Methods). Freezing was significantly higher during the CS+ presentation but only during the early period (***, P < 0.001, one-way repeated measures ANOVA, F = 94.753, n = 12). Box-whisker plots indicate median, interquartile range, and 5th - 95th percentiles of the distribution. Crosses indicate means. Bullets indicate individual mice values.
Supplementary Figure 2: FCA depends on associative processes. a, Left, protocol for the basal nociceptive assay: mice were submitted to two HP trials without conditioning nor tone presentation. Center, protocol for the tone-specific assay: mice were submitted to two HP trials paired with tone presentation (7.5 kHz or WN). Right, protocol for the conditioning-specific assay: mice were submitted to auditory fear conditioning. However, during the HP test, no CSs were presented. b. Mice submitted to auditory fear conditioning. During retrieval, the average freezing values for CS+ was higher compared to CS- or baseline (BL) periods (***, P < 0.001, one-way repeated-measures ANOVA, F = 228.840, n = 7 mice). c, d. Time and temperature of nociception response for all the tests mentioned above. Fear conditioning induced analgesia compared to the basal nociception and the tone-specific assay (Response latency: ***, P < 0.001, two-way repeated measures ANOVA, type of assay F(2,26) = 11.567, post hoc Bonferroni PFC vs basal nociception < 0.001 and PFC vs tone assay = 0.0013 ; Temperature : **, P < 0.01, two-way repeated measures ANOVA, type of assay F(2,26) = 8.510 post hoc Bonferroni P FC vs basal nociception = 0.0004 and P FC vs tone assay = 0.007). Trials between the same type of test were not significantly different (Response latency: ns, P > 0.05,two-way repeated measures ANOVA, trial effect F(1,26) = 0.380; Temperature: ns, P > 0.05,two-way repeated measures ANOVA, trial effect F(1,26) = 0.093=). Box-whisker plots indicate median, interquartile range and 5th - 95th percentiles of the distribution. Crosses indicate means. Bullets indicate individual mice values. e, After fear extinction, there was no difference in temperature response between the two CSs (ns, P > 0.05, one-way repeated measures ANOVA, F = 1.071, n = 10 mice).
Supplementary Figure 3: The FCA paradigm is stable and is not mediated by changes in body temperature. a. Protocol for stability training (see methods). Mice were submitted to two rounds of the FCA paradigm. During retrieval (b, c), average freezing values during CS+ was higher than CS- or baseline (BL) periods (***, P < 0.001, one-way repeated-measures ANOVA, Fretrieval1 (b) = 558.250 / Fretrieval2 (c) = 55.997, n = 10 mice). No differences were observed between the freezing levels of retrieval 1 (b) and retrieval 2 (c) (ns, P > 0.05, two-way repeated-measures ANOVA, F(1,9) = 4.078, n = 10 mice). d, e. Time of nociception response during CS- and CS+ trials. The emotional modulation of pain behaviour increased the time of nociception response in HP1 (d, Response latency : **, P < 0.01, one-way repeated-measures ANOVA, F = 16.435, n = 10 mice; Temperature: **, P < 0.01, one-way repeated-measures ANOVA, F = 26.876, n = 10 mice) and in HP2 (e, Response latency : *, P < 0.05, one-way repeated-measures ANOVA, F = 6.046, n = 10 mice; Temperature:*, P < 0.05, one-way repeated-measures ANOVA, F = 7.272, n = 10 mice)., No differences were found in the pain responses between the two tests (Response latency: ns, P > 0.05, test effect, two-way repeated-measures ANOVA, F(1,9) = 0.134, n = 10 mice; Temperature: ns, P > 0.05, test effect, two-way repeated-measures ANOVA, F(1,9) = 0.160, n = 10 mice). f. Schematic representation of the protocol used (top). After fear conditioning, mice were submitted to the HP test in which the temperature of the testing surface was kept at 30 °C for the entire duration of the test. The CSs were introduced at 130 s and were played for 120 s. Mice were kept in the HP device for another 60 s. The temperature of the mice back and tail were measured by the infrared digital thermographic camera (bottom) and analysed offline (see Methods). The average temperature of the mice back (g) and tail (h) while the CS+ or the CS- were presented. The were no differences on body temperature for the different CSs trials (ns, P > 0.05, two-way repeated-measures ANOVA, F(1,11) back = 0.328 / F(1,11) tail = 0.191, n = 13 mice). Dashed lines correspond to the average time of nociception response for the CS+ (red) and CS- (blue) during the standard FCA protocol. Box-whisker plots indicate median, interquartile range, and 5th - 95th percentiles of the distribution. Crosses indicate means. Bullets indicate individual mice values.
Supplementary Figure 4: Comparable fear levels prior to the HP test. After retrieval, fear conditioning levels between the opsins and their respective GFP group was tested to ensure equivalent fear levels. The discrimination index (see methods) between the GFP and ChR2 (a, ns, P > 0.05, one-way factorial ANOVA, F = 0.280, n = 16 mice) or ArchT (b, ns, P > 0.05, one-way factorial ANOVA, F = 0.573, n = 23 mice) were not significantly different. All the mice discriminated equally between CSs. The conditioning index (see methods) between the GFP and ChR2 (c, ns, P > 0.05, one-way factorial ANOVA, F = 1.553, n = 16 mice) or ArchT (d, ns, P > 0.05, one-way factorial ANOVA, F = 2.455, n = 23 mice) were also not significantly different. All mice displayed a similar high freezing level to the CS+. Box-whisker plots indicate median, interquartile range, and 5th - 95th percentiles of the distribution. Crosses indicate means. Bullets indicate individual mice values.
Supplementary Figure 5: Optogenetic controls for SST vlPAG neurons mediating FCA. a. Optogenetic activation of SST+ neurons abolished the analgesic effect induced during exposure to the CS+ (*, P <0.05, n = 7 GFP, n = 9 ChR2, opsin x CSs - two-way repeated-measures ANOVA, F(1,14)= 11.400). The temperature of the nociception response for the CS+ was significantly different between the ChR2 and GFP group (**, P = 0.0081, unpaired t-test). For the ChR2 group, the temperature of nociception response during CS+ was equivalent to the CS- (ns, P = 0.3459, ChR2, unpaired t-test). On the contrary, the temperature of the nociception response between the CSs was different for the GFP group (*, P = 0.0108, GFP, unpaired t-test). b. Optogenetic inhibition of SST+ neurons augmented the analgesic effect for the ArchT group when compared to the GFP (**, P < 0.01, n = 12 GFP, n = 11 ArchT, opsin effect - two-way repeated-measures ANOVA, F(1,21) = 18.020, post hoc Bonferroni P = 0.0042). The effect was also significant for the interaction between the opsins and the tones (**, P <0.01, n = 12 GFP, n = 11 ArchT, opsin x CSs - two-way repeated-measures ANOVA, F(1,21) = 10.841). The nociception temperature response for the CS- and CS+ was significantly different between the ArchT and GFP group (CS-: **, P < 0.0001, unpaired t-test; CS+:*, P = 0.0472, unpaired t-test).For the GFP group, the temperature of nociception response was higher for the CS+ trials when compared to the CS- trials (**, GFP, unpaired t-test P = 0.0014), yet this was not the case for the ArchT group (ns, ArchT, unpaired t-test P = 0.9288). c. Optogenetic excitation of SST+ vlPAG neurons was performed during the ON epoch (blue shaded area), and the average distance travelled was not different from the OFF epochs when comparing the two opsins (ns, P > 0.05, n = 7 GFP, n = 9 ChR2, opsin x distance - two-way repeated-measures ANOVA, F(2,28) = 0.685). b. Optogenetic inhibition of SST+ vlPAG neurons was performed during the ON epoch (yellow shaded area) and the average distance travelled was not different from the OFF epochs when comparing the two opsins (ns, P > 0.05, n = 12 GFP, n = 11 ArchT, opsin x distance - two-way repeated measures ANOVA, F(2,42) = 0.924). e. Real-time place-preference location plot from a representative animal while submitted to optogenetic activation of SST vlPAG neurons in the left compartment throughout the 15-min session. f. There was no difference between ChR2-expressing mice and the control group in the time spent on the stimulated compartment (ns, unpaired t-test P=0.19). Box-whisker plots indicate median, interquartile range and 5th - 95th percentiles of the distribution. Crosses indicate means. Bullet points indicate individual mice values.
Supplementary Figure 6: Optogenetic effect observed during FCA is not due to alteration of somatostatin levels nor mediated by VIP vlPAG neurons. a. SST-IRES-Cre heterozygotic mice received a bilateral injection of opsins in the vlPAG, and optic fibers were implanted above the region of interest. b. A representative example of expression patterns of ChR2 within SST+ vlPAG neurons. c. Average freezing values during retrieval. The ChR2 and GFP group were pulled together because no differences were found in the conditioning level (data not shown). The average freezing values during CS+ was higher than CS- or baseline (BL) periods (***, P < 0.0001, one-way repeated-measures ANOVA, F = 293.847, n = 13 mice). d. Optogenetic activation of SST+ heterozygotic neurons abolished the analgesic effect of the fear modulation (**, P <0.01, n = 6 GFP, n = 7 ChR2, opsin x CSs - two-way repeated-measures ANOVA, F(1,11) = 12.390). The temperature of the nociception response for the CS+ was significantly different between the ChR2 and GFP group (*, P = 0.0200, unpaired t-test). For the ChR2 group, the latency of nociception response during CS+ was equivalent to the CS- (ns, ChR2, unpaired t-test P = 0.4419). On the contrary, the latency of nociception response between the CSs was different for the GFP group (**, GFP, unpaired t-test P = 0.0011). e. VIP-IRES-Cre mice received a bilateral injection of opsins in the vlPAG, and optic fibers were implanted above the region of interest. f. Representative example of the expression pattern of ArchT within VIP+ vlPAG neurons. g. The ArchT and GFP groups were pulled together because no differences were found in the conditioning level (data not shown). The average freezing values during CS+ was higher than CS- or baseline (BL) periods (***, P < 0.0001, one-way repeated-measures ANOVA, F = 147.078, n = 10 mice). h. Optogenetic inhibition of VIP+ neurons did not change the analgesic effect for the ArchT group when compared to the GFP (ns, P > 0.05, n = 5 GFP, n = 5 ArchT, opsin effect - two-way repeated measure ANOVA, F(1,8) = 1.527). The effect was also not significant for the interaction between opsins and tones (ns, P > 0.05, n = 5 GFP, n = 5 ArchT, opsin x CSs - two-way repeated measured ANOVA, F(1,8) = 0.398). The latency of nociception response was higher for the CS+ trials when compared to the CS- trials (**, unpaired t-test PGFP = 0.002 / PArchT = 0.0002). Scale bars, 0.5 mm Box-whisker plots indicate median, interquartile range, and 5th - 95th percentiles of the distribution. Crosses indicate means. Bullet points indicate individual mice values.
Supplementary Figure 7: SST vlPAG neurons do not modulate the CS-US association. a. Protocol for optogenetic manipulations during fear conditioning. On Day 2, mice received 5 CS-US associations. The US was either optogenetic stimulation alone or optogenetic stimulation plus foot-shock. b. Average freezing curve during the CS-US association of optogenetic stimulation alone. There was no difference in the overall freezing levels for the CS- and CS+ between ChR2 and GFP (ns, P > 0.05, optogenetic stimulation effect - two-way repeated-measures ANOVA, F(1,11) = 0.983, n = 13 mice). c. During retrieval, average freezing values for CS+ was not significantly different from CS- periods (ns, P > 0.05, CSs effect - two-way repeated-measures ANOVA, F(1,11) = 0.095, n = 13 mice). There was no effect on fear expression upon activation of SST+ vlPAG neurons as an US (ns, P > 0.05, CSs x opsin effect - two-way repeated-measures ANOVA, F(1,11 = 3.020, n = 13 mice). d. Average freezing curve during the CS-US association of optogenetic stimulation plus foot-shock. There was no difference in the overall freezing levels for the CS+ and CS- between ChR2 and GFP (ns, P > 0.05, optogenetic stimulation effect - two-way repeated-measures ANOVA, F(1,11) = 0.9575, n = 13 mice). e. During retrieval, the average freezing values during CS+ was higher than CS- or baseline (BL) periods for both GFP and ChR2 (***, P < 0.001, one-way repeated-measures ANOVA, FGFP = 146.847, n = 6 mice / FChR2 = 40.793, n = 7 mice). However, there was no difference of the fear expression by the activation of the SST+ vlPAG neurons (ns, P > 0.05, CSs x opsin effect - two-way repeated-measures ANOVA, F(1,11) = 0.110; (ns, P > 0.05, CSs x opsin effect - two-way repeated-measures ANOVA, F(1,11) = 0.110,n = 13 mice). Box-whisker plots indicate median, interquartile range, and 5th - 95th percentiles of the distribution. Crosses indicate means. Grey bullet points indicate individual mice values.
Supplementary Figure 8: Windup protocol during optogenetic manipulation. Repetitive suprathreshold stimulations induce a progressive increase in WDR response, called the windup effect. a. Optogenetic activation of vlPAG SST cells increased the windup coefficient (**, P < 0.01, OFF vs. ON – Wilcoxon matched-pairs signed-rank test). b. Optogenetic inhibition decreased the windup coefficient (*, P < 0.05, OFF vs. ON – Wilcoxon matched-pairs signed-rank test). c. Mice expressing GFP in SST vlPAG, optogenetic manipulation of the SST vlPAG had no effect on the windup effect (ns, P > 0.05, OFF vs. ON – Wilcoxon matched-pairs signed-rank test).
Supplementary Figure 9: Optogenetic manipulation of GFP expressing vlPAG neurons had no effect on nociception. a. Single-unit recordings of WDR neurons in the lumbar spinal cord during optogenetic manipulation of GFP expressing SST vlPAG inputs to the RVM (left panel). Light illumination of vlPAG SST inputs to the RVM had no effect in WDR response to both C and A-mediated peripheral fibers stimulation (right panel; ns, P > 0.05, Wilcoxon signed-rank test). b. Light illumination of vlPAG SST inputs to the RVM did not change the subliminal peripheral stimulation in a supraliminal response (ns, P > 0.05, Wilcoxon signed-rank test). c. Windup coefficient of WDR cells did not change upon light illumination of vlPAG SST inputs to RVM (ns, P > 0.05, Wilcoxon signed-rank test).
ACKOWLEDGMENTS
We thank the Herry team for fruitful discussions and careful reading of the manuscript; K. Deisseroth and E. Boyden for generously sharing material, S. Laumond, J. Tessaire and the technical staff of the housing and experimental animal facility of the Neurocentre Magendie. Microscopy was performed in the Bordeaux Imaging Center of the CNRS-INSERM and Bordeaux University, member of France BioImaging. This work was supported by grants from the French National Research Agency (ANR-FEARLESSPAIN, ANR-DOPAFEAR, ANR-10-EQPX-08 OPTOPATH) and the Fondation pour la Recherche Médicale (FRM-PhD grant to NW 2020-2021).
REFERENCES


