

Abstract
Spreading depolarization (SD) is a slow-moving wave of neuronal depolarization accompanied by a breakdown of ion concentration homeostasis, followed by long periods of neuronal silence (spreading depression), and associated with several neurological conditions. We developed multiscale (ions to tissue slice) computer models of SD in brain slices using the NEURON simulator: 36,000 neurons (2 voltage-gated ion channels; 3 leak channels; 3 ion exchangers/pumps) in the extracellular space (ECS) of a slice (1 mm sides, varying thickness) with ion (K+, Cl−, Na+) and O2 diffusion and equilibration with a surrounding bath. Glia and neurons cleared K+ from the ECS via Na+/K+pumps. SD propagated through the slices at realistic speeds of 2–5 mm/min, which was augmented by 25–30% in models incorporating the effects of hypoxia or of propionate. In both cases, the speedup was mediated principally by ECS shrinkage. Our model allows us to make the following testable predictions: 1. SD can be inhibited by enlarging ECS volume; 2. SD velocity will be greater in areas with greater neuronal density, total neuronal volume, or larger/more dendrites; 3. SD is all-or-none: initiating K+ bolus properties have little impact on SD speed; 4. Slice thickness influences SD due to relative hypoxia in the slice core, exacerbated by SD in a pathological cycle; 5. Higher neuronal spike rates and faster spread will be observed in the core than the periphery of perfused slice during SD.
Significance Spreading depolarization (SD) is a slow moving wave of electrical and ionic imbalances in brain tissue and is a hallmark of several neurological disorders. We developed a multiscale computer model of brain slices with realistic neuronal densities, ions, and oxygenation. Our model shows that SD is exacerbated by and causes hypoxia, resulting in strong SD dependence on slice thickness. Our model also predicts that the velocity of SD propagation is not dependent on its initiation, but instead on tissue properties, including the amount of extracellular space and the total area of neuronal membrane, suggesting faster SD following ischemic stroke or traumatic brain injury.
Introduction
Spreading depolarization (SD), is a slow-moving (1.7–9.2 mm/min), long-lasting (minutes) wave of neuronal depolarization accompanied by a breakdown in homeostatic maintenance of intra- and extracellular ion concentrations, and associated with reduced neuronal activity (spreading depression) [Woitzik et al., 2013, Newton et al., 2018, Cozzolino et al., 2018, Dreier, 2011]. SD has been observed in a number of species, can be elicited experimentally both in vivo and in brain slices, and has been implicated in several neurological conditions, including ischemia, migraine, traumatic brain injury, and epilepsy [Cozzolino et al., 2018]. SD is difficult to detect in humans noninvasively [Zandt et al., 2015], making it important to study SD in experimental preparations and computer simulation to better understand its role in human disease, and possible treatments.
SD has been studied in brain slices from a wide range of species and brain regions, including neocortex, hippocampus, brainstem, and retina [Martins-Ferreira et al., 2000, Balestrino et al., 1988, Aitken et al., 1998, Müller and Somjen, 1998, Andrew, 2016, Devin Brisson et al., 2013, Hrabe and Hrabetova, 2019]. It can be triggered experimentally by various means, including electrical stimulation; mechanical insult; K+, glutamate, and ouabain application [Cozzolino et al., 2018]. In brain slices, it can be elicited by inducing hypoxia [Balestrino et al., 1988, Aitken et al., 1991, Müller and Somjen, 1998], and it can be facilitated by applying propionate to the slice [Tao et al., 2002, Hrabe and Hrabetova, 2019]
In this paper, we use multiscale computational modeling of SD to relate the microscopic levels of ion and O2 diffusion, channels, and pumps to the neuronal level of cell spiking up to the macroscopic level of tissue activation patterns (Fig. 1). Our baseline model is composed of 36,000 biophysically detailed point-neurons in an extracellular space (ECS) of a square slice (1 mm sides, 400 μm thick) with O2 perfusion and ion flux with a surrounding bath where relevant concentrations are held constant at their baseline values in the ECS. We simulated SD in both perfused and hypoxic slices. Our model confirms that SD speed is augmented by propionate and hypoxia and suggests that changing the ECS is the principle mechanism through which they influence SD. We predict that SD speed will change with slice thickness due to core hypoxia, increase with the total neuronal surface area in the tissue. SD speeds in all conditions were enhanced by hypoxia. We also predict that increasing the size of the ECS relative to the tissue will inhibit SD. Finally, we identified a depth-dependent relationship with greater SD propagation through core of the slice compared to the periphery.
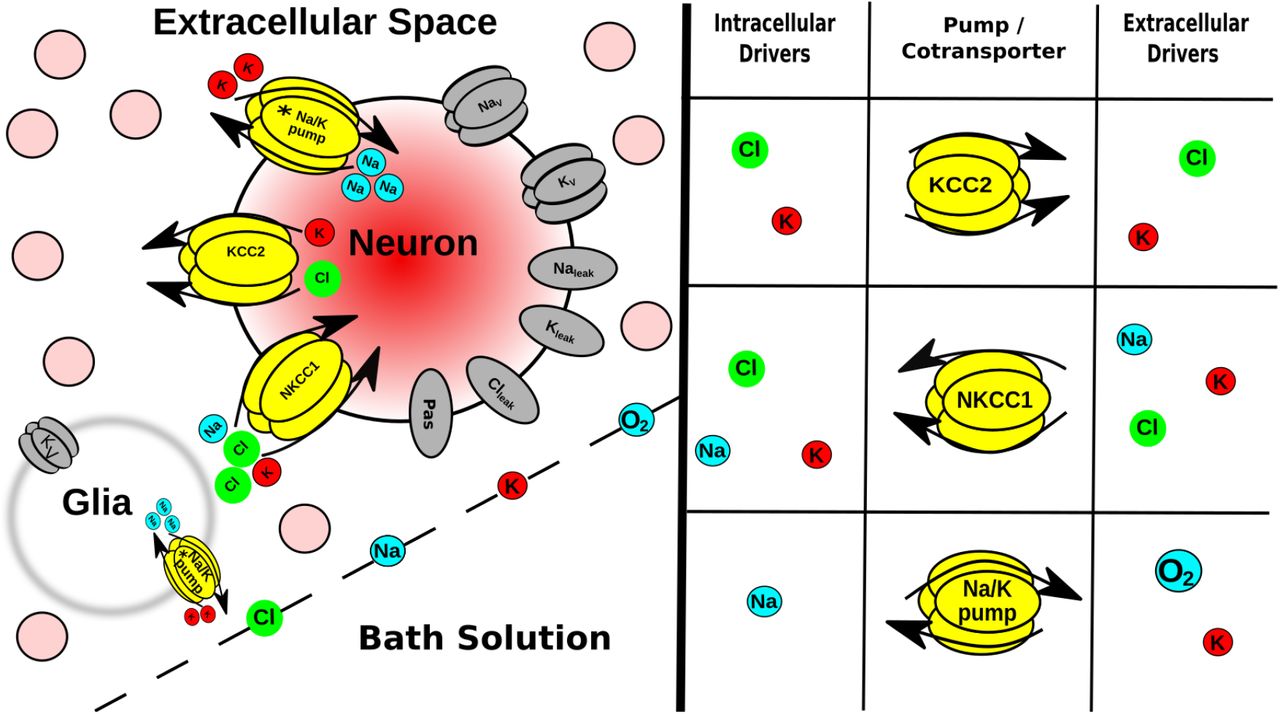
Multiscale model expanded. Tissue scale: A few of the 36·103 neurons (pink circles) in brain slice submerged in bath; glia are not explicitly modeled, instead represented as a field of sinks in every ECS voxel. Cell scale: Each neuron has ion channels, 2 co-exchangers; Na+/K+ pump (asterisk indicates ATP/O2 dependence) Ions are well-mixed within each neuron (no intracellular diffusion). Protein scale: Table (right) indicates species that control the activity of the intrinsic mechanisms in neurons and in glial-field. [Ion] scale: Ions diffuse between ECS voxels by Fick’s law using diffusion coefficients in Table 1.
Materials and methods
We developed a tissue-scale model of SD in slices by extending the framework developed by Wei et al. 2014 [Wei et al., 2014] from a single cell in its local micro-environment to 36,000 cells (baseline) embedded in an ECS. We used the NEURON simulator and its extracellular reaction-diffusion framework (RxD-ECS) to simulate the electrophysiology of those neurons, the exchange of ions between them and the ECS, diffusion of ions and O2 through the slice, and exchange of ions and O2 between the slice and the bath solution in which it was submerged [Newton et al., 2018]. Our model is not specific to any particular brain area, as we aimed to reproduce general properties applicable to different brain regions and to different pathophysiologies.
Model
Model neurons were all point-neurons (1 compartment) which included voltage-gated K+ and Na+ channels; Na+, K+, and Cl− leak channels; K+-Cl− (KCC2) [Payne et al., 2003] and Na+-K+-Cl− (NKCC1) cotransporters; and Na+/K+ pumps (Fig. 1), ported from Wei et al. (2014) [Wei et al., 2014]. In order for cells to balance a steady-state resting membrane potential in a slice with dynamic ion and O2 concentrations, we added a passive electrical conductance with reversal potential Erev = −70 mV and conductance g = 0.1 mS/cm2. Neurons were closed-ended cylinders (no flux from ends).
To explore the effects of surface area to volume (S:V) ratio, we used RxD-ECS to independently define a neural surface entirely separated from its volume – hence NOT following the overall geometry of the structure. This is possible since we used the concept of fractional volumes, rather than providing actual volume-occupying structures [McDougal et al., 2013]. Neuronal volume fraction βnrn is defined as the ratio of total neuronal volume (Volnrn) to total tissue volume:  (compare with αECS which is
  )[Rice and Russo-Menna, 1998]. Given a chosen tissue volume, βnrn, and a total number of neurons Nnrn (based on cell density times Vol tissue), the volume of a single neuron volnrn is:
 (Note case: volnrn for single cell; Volnrn for cumulative neuronal volume) In NEURON, neural compartments are cylinders, omitting the ends. In the present case, our point-neurons are each a single cylinder, defined by length L and diameter d. Setting L = d for simplicity, the surface area is defined as Snrn = π · d2. The associated volume, calculated for this cylinder, was not used. We therefore used RxD-ECS’s FractionalVolume class to scale the volume of a cell with the desired S:V to volnrn, while the cell retains its original Snrn[McDougal et al., 2013].
To establish a biologically realistic range for S:V, we analyzed morphological reconstructions of neurons from neuromorpho.org. We used results for cells with intact soma and dendritic reconstructions in 3 dimensions from animals older than two weeks. In rat neocortex, average S:V was 3.4 ± 1.2 μm−1 for both pyramidal cells (n=96) and interneurons (n=108) [Radman et al., 2009, Boudewijns et al., 2013, Larkum et al., 2004, Vetter et al., 2001, Meyer et al., 2010, Kubota, 2014]. Higher S:V was grossly associated with larger dendritic trees; S:V scales inversely with diameter in cylindrical structures (excluding ends):  . For our baseline simulations, we used S:V = 3.0 μm−1; βnrn = 0.24; neuronal density = 90·103 neurons/mm3, typical of neocortex [Rice and Russo-Menna, 1998, Keller et al., 2018].
Simulated slices were 1mm x 1mm and ranged in thickness 100 – 800 μm with 45·103 – 120·103 neurons/mm3. The baseline simulation was 400 μm slice with 90·103 neurons/mm3 (36·103 neurons in total). Neurons were situated randomly throughout extracellular space (ECS) with diffusion of  , and O2 with diffusion coefficients (D) given in Table 1. Extracellular volume fraction (αECS: ratio of extracellular space volume to total tissue volume) and tortuosity (λECS: hindrance to diffusion in tissue compared to free medium) were the same for all ions. This results in a lower effective diffusion coefficient (D*) for ions but not O2, which diffuses through the slice unhindered. Diffusion through the ECS was calculated with a voxel size of 25 μm x 25 μm x 25 μm. Simulated slices were submerged in simulated bath solution where ion and O2 concentrations were equivalent to those estimated for ECS (Table 1, [Cressman et al., 2009, Wei et al., 2014]) with Dirichlet boundary conditions.
Diffusion coefficients and baseline concentrations for ions and O2 in perfused slice [Haynes, 2014, Samson et al., 2003, Wei et al., 2014]
In the perfused slice, [O2] = 0.1 mM (corresponding to a bath solution aerated with 95% O2:5% CO2 [Wei et al., 2014]), αECS = 0.2, and λECS = 1.6 [Syková and Nicholson, 2008]. We modeled the effects of hypoxia by decreasing [O2] to 0.01 mM, decreasing αECS to 0.07, and increasing λECS = 1.8 [Pérez-Pinzón et al., 1995, Zoremba et al., 2008]. We modeled the effects of propionate, which ‘‘primes” the tissue for SD, by reducing αECS to 0.12 and total Cl− content in the slice by 50%, but keeping [O2] = 0.1 mM and λECS = 1.6 [Hrabe and Hrabetova, 2019].
Studies have shown that αECS changes dynamically over the course of SD [Mazel et al., 2002, Hrabe and Hrabetova, 2019]. Since the biophysics of ECS changes during SD have not been elucidated at the time scale of our simulations, for a subset of simulations we incorporated these changes phenomenologically to obtain αECS 0.05-0.1 during passage of the SD [Mazel et al., 2002]. In each ECS voxel:

This model of dynamic αECS only accounts for the drop in αECS during SD, not its recovery after SD, which occurs on the time-scale of minutes [Mazel et al., 2002, Hrabe and Hrabetova, 2019].
Glia were modeled by a background voltage-gated K+ current and Na+/K+ pump in each ECS voxel [Cressman et al., 2009, Øyehaug et al., 2012, Wei et al., 2014], rather than as individual cells.
Simulations
SD was initiated by elevating initial [K+]ECS within a spherical bolus at the center of the slice at t=0. Baseline simulations were run with K+ bolus with radius = 100 μm; [K+]ECS= 70 mM. To follow the position of SD over time, we tracked the position of the K+ wavefront: the furthest location where [K+]ECS exceeded 15 mM. Propagation speed was indicated as 0 if the K+ wave didn’t propagate. Most simulations ran for 10 seconds, which was sufficient for SD to propagate throughout the entire slice.
In the course of this study, we ran over 600 simulations covering a range of slice sizes, cell densities, and durations on a number of different architectures. Simulating a 1 mm x 1 mm x 400 μm slice with a cell density of 90k neurons/mm3 (36·103 neurons) for 10 s of simulation-time took approximately 12.5 hours on a parallel Linux system using 48 nodes on a 2.40 GHz Intel Xeon E5-4610 CPU. Incorporating dynamic αECS into the same model on the same machine increased simulation time to approximately 18 hours. Due to these computational limitations we restricted out simulations to 10 sec which meant that we could not continue to the termination phase of SD which would require considerably greater temporal and spatial scales. Simulations were run using Neuroscience Gateway [Sivagnanam et al., 2013], Google Cloud Platform, and the on-site high performance computer at SUNY Downstate Health Sciences University. All code for simulation, data analysis, and visualization was written in Python/NEURON and is available on GitHub and ModelDB.
Results
In our model of an O2-perfused slice, a small bolus of elevated K+ (70 mM, 100 μm radius) initiated a propagating K+ wave with associated spreading depolarization (SD) producing neuronal spiking (Fig. 2). The K+ wave travelled radially outward from the bolus in 3 dimensions towards the edges of the slice at 2.4 mm/min, comparable to optical and electrophysiological measurements of SD propagation velocity in brain slices [Aitken et al., 1998, Joshi and Andrew, 2001, Hrabe and Hrabetova, 2019]. Within the K+ bolus, most cells fired a single spike and went immediately into depolarization block. Outside the K+ bolus, cells fired a 200-900 ms burst of action potentials as [K+]ECS increased around them. During the course of the SD-associated burst, instantaneous firing rates increased to as high as 250 Hz with decreasing spike heights during the burst, comparable to experimental observations [Devin Brisson et al., 2013, Lemaire et al., 2021]. Cells then remained in depolarization block for the full 10 s measured (see Methods for computational limitations) [Devin Brisson et al., 2013, Andrew, 2016]. Spreading depolarization, seen intracellularly, produced Na+ channel inactivation and prevented further spiking. Absence of spiking would be seen extracellularly as spreading depression – a silent region in the slice. The K+ wave and spreading depolarization (SD) were coincident in time and space, with spreading depression following closely behind; we primarily followed the K+ wave since this was easiest to localize across conditions.

A. [K+]ECS averaged across slice depth (400 μm) at 4 time points during SD. B. Spike raster plot of 250 randomly-selected neurons (out of 36·103) during SD. Cells are ordered on y-axis by their radial distance from the center of the K+ bolus. Blank area under spikes represents region of spreading depression. Baseline values: [O2] = 0.1 mM; αECS = 0.2; λECS = 1.6; [C1−]ECS = 130.0 mM; [Cl−]i = 6.0 mM.
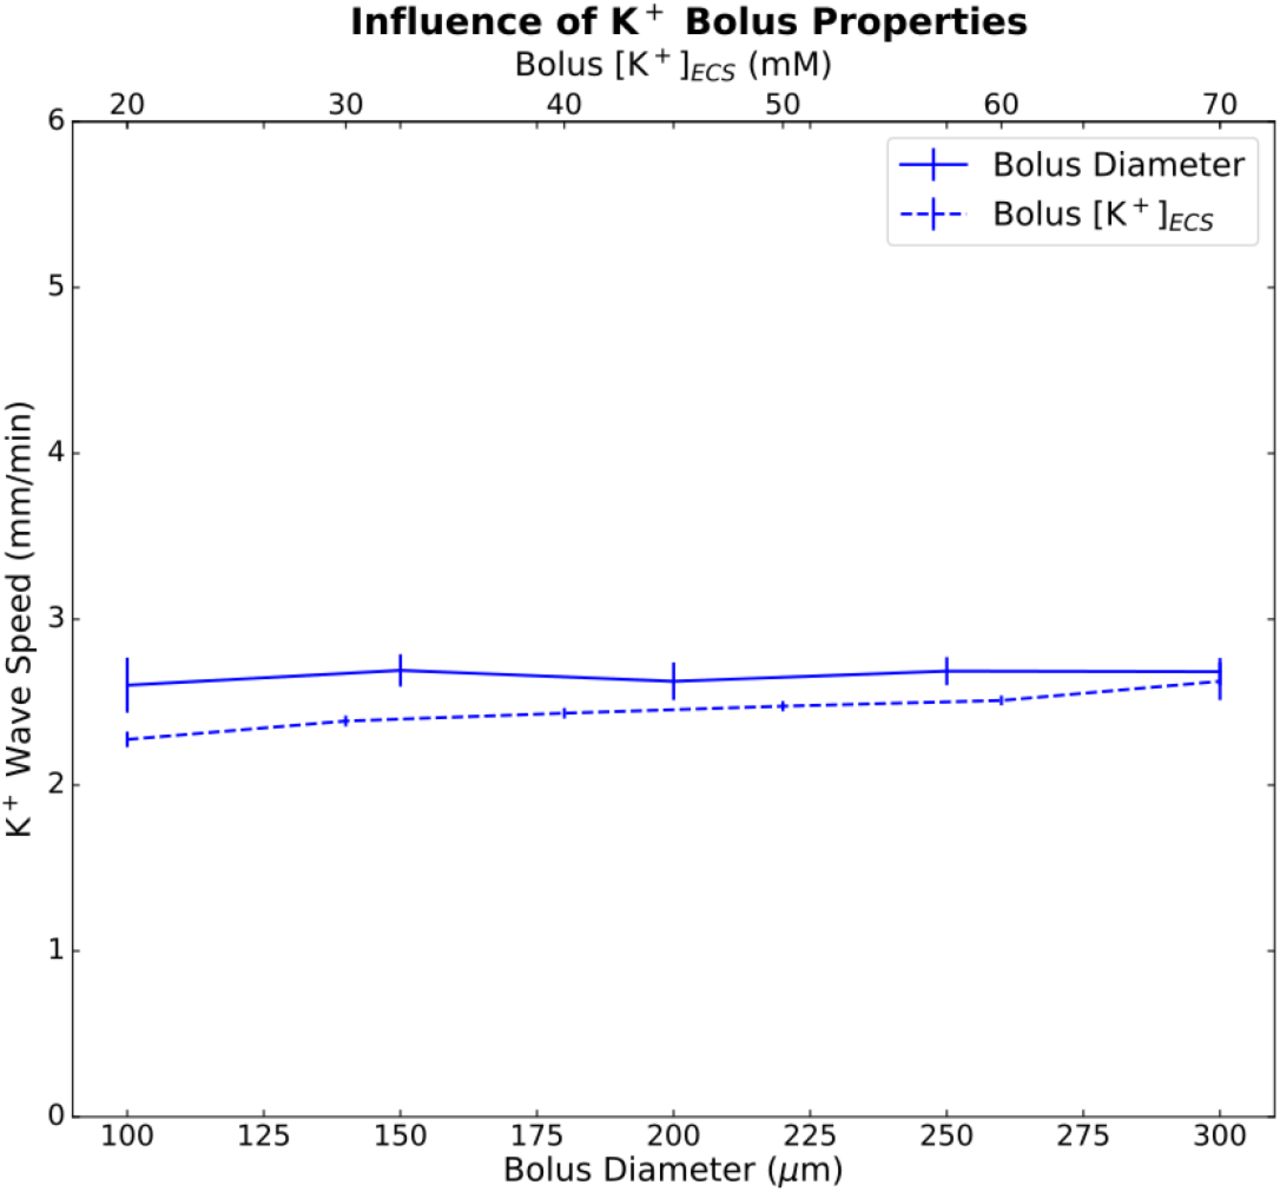
SD was an all-or-none process; it could only be initiated above a certain threshold measured either in concentration − [K+]ECS ≥ 20 mM (bolus diameter 200μm), or in bolus diameter – diameter ≥ 100μm ([K+]ECS 70 mM) (Fig. 3). Beyond these thresholds, different K+ bolus concentrations and diameter had only a minimal effect on wave speed.

Mean and standard deviations (n = 5) for K+ wave speed by bolus diameter (solid line; bolus [K+]ECS=70 mM; 5 random cell position initializations); bolus concentration (dashed line; diameter=200 μm).
Underpinning SD was a wave of pronounced imbalance of transmembrane ion concentrations (Fig. 4). Excess K+ is briefly eliminated from the ECS via neural and glial homeostatic mechanisms. Once the K+ wave arrived however, the cells dumped large quantities of K+ into the ECS due to the burst and subsequent prolonged depolarization (note rapid depletion of [K+]i – Fig. 4B). The Na+/K+ pump activity which contributed to K+ elimination from the ECS in the core of the slice created a high demand for O2, exceeding the rate at which it could diffuse in from the bath. This resulted in much of the tissue becoming hypoxic before the arrival of the K+ wave (compare rapid fall-off of O2 in Fig. 4E to much slower rise of extracellular K+ in Fig. 4F). The rapid spread of O2 deficit explains the total pump failure at intermediate locations in the slice. There were small upward deflections in the first 3 traces in Fig. 4B reflecting homeostatic inward pumping. There was no upward deflection in the other 3 traces – O2 has disappeared before the K+ wave arrives. The preservation of pumping in the final, most peripheral, trace of Fig. 4B is due to this measurement being at the edge of the slice, proximal to the O2 source of the bath. Once [K+]ECS reached ~14 mM, cellular homeostatic mechanisms totally broke down, with dramatic increases in intracellular Na+and Cl−(Fig. 4C,D).

A. Cells within the K+ bolus produced a single spike, while cells in the path of the K+ wave fired a burst; all cells remained in depolarization block for seconds afterward. B-C. Intracellular ion concentrations of those same cells. E-H. Extracellular O2 and ion concentrations in ECS voxels at those locations.
K+ wave propagation was facilitated by incorporating the effects of hypoxia or propionate treatment on the slice (Fig. 5). Simulating the effects of hypoxia ([O2] to 0.01 mM with decreased αECS=0.07 and increased λECS=1.8 [Pérez-Pinzón et al., 1995, Zoremba et al., 2008]), increased K+ wave propagation speed to 4.5 mm/min. Simulating propionate application (decreased αECS=0.12; halving [Cl−]i and [Cl−]ECS [Tao et al., 2002, Hrabe and Hrabetova, 2019]), increased K+ wave speed similarly (Fig. 5A). Comparable speedups were also observed in the depolarization waves (Fig. 5B). Since these manipulations included combined changes to [O2], Cl−, αECS, and/or λECS, we investigated their individual contributions over the relevant ranges. Since both hypoxia and propionate decrease αECS, we also tested increasing αECS to as high as 0.42, which has been observed when making the ECS artificially hypertonic [Kume-Kick et al., 2002]. αECS had the largest influence on propagation, changing K+ wave speed by >2 mm/min over the range tested, while K+ wave speed changed by <0.5 mm/min for the ranges of [O2], λECS, and [Cl−] values tested (Fig. 5C).

A. K+ wave position over time during SD in perfused, hypoxic, propionate-treated slices, and with dynamic changes in αECS. Hypoxia and propionate facilitated propagation. B. SD wave, as represented by time to first spike (126 of 36·103 cells). C. K+ wave speeds when changing a single variable from baseline (Fig. 2). (x-axis ranges: [O2]=0.01−0.1 mM; αECS=0.07-0.42; λECS=1.4-2.0; [C1−]ECS:[Cl−]i=3.0:65.0–6.0:130.0 mM)
Experimental studies have demonstrated dynamic changes in αECS occurring during SD, with αECS dropping to as low as 0.05 at the peak of the depolarization [Mazel et al., 2002, Hrabe and Hrabetova, 2019]. Given the strong influence of constant αECS on SD propagation (Fig. 5C - orange line), we also explored the influence of dynamic αECS (Fig. 5A - purple line). Dynamically decreasing αECS was modeled as a local function of increasing [K+]ECS (see Methods), such that αECS dropped to 0.06 in the wake of SD, within the experimentally-observed range of 0.05 - 0.1 [Mazel et al., 2002]. Incorporating a dynamic ECS increased the speed of SD propagation in perfused slice from 2.4 mm/min to 3.3 mm/min. The stereotyped characteristics of neuronal firing patterns during depolarization wave remained unchanged by dynamic changes in αECS.
Different brain areas have different cell densities and their neurons have different morphological characteristics. We manipulated our generic model so as to explore 3 properties of neural tissue organization and shape: neuronal surface area to volume ratio (S:V); fraction of tissue volume occupied by neurons (βnrn); and cell density (Fig. 6). Neuronal S:V varies across cell types, brain regions, and species. Examination of representative morphologies showed that S:V values are generally in a range of 2–10 μm−1 (see Methods), with neocortical principal cell S:V of 3.4 ± 1.2 μm−1 (n=96) significantly greater than brainstem principal cell S:V of 2.2 ± 1.2 μm−1 (n=74; p<0.001, Mann-Whitney U test) [Williams et al., 2019, Ros et al., 2010, Núñez-Abades et al., 1994, Raslan et al., 2014, Radman et al., 2009, Boudewijns et al., 2013, Larkum et al., 2004, Vetter et al., 2001, Meyer et al., 2010]. Neuronal volume fraction βnrn may differ with different brain areas, and will differ under the pathological condition of cytotoxic edema. Cell density varies across different neural areas.

Effects of varying A S:V (0 speed – no wave); B. βnrn; C. density, constant S,V; D. density, constant βnrn. E. Pooled results: K+ wave speed increased linearly with total neuronal surface area in both perfused and hypoxic slices.
Realistic (>1 μm−1) S:V was necessary for initiating SD (Fig. 6A) – SD could not be initiated using the actual 3D geometry of single-cylinder point-neurons with diameter and height selected to produce baseline βnrn of 0.24 (S:V = 0.02 μm with 90k neurons/mm3, perfused or hypoxic). Above this threshold, K+ wave speed increased with S:V. K+ wave speed also increased with increased βnrn while keeping S:V and cell density constant (Fig. 6B). Cell density effects were less marked, whether through keeping surface area and volume constant (Fig. 6C), or keeping βnrn and S:V constant (Fig. 6D). In all cases, change with altered parameters was more pronounced in the hypoxic slice. Pooled together, we found a near linear relationship of K+ wave speed with total neuronal surface area in the tissue (Fig. 6E).
Slice thickness (100–800 μm) influenced SD by altering the ability of O2 to penetrate to the tissue core (Fig. 7). The K+ wave could not be initiated in 100 μm perfused slice – SD was not sustainable with full O2 availability. With increasing thickness, an increasingly hypoxic core (despite O2 perfusion of the bath) allowed K+ wave speed to increase from 1.7-2.1 mm/min over 200-400 μm thickness (Fig. 7A). Above 400 μm there was no increased speed with increased thickness. This pattern of increased speedup to 400 μm was also seen in our hypoxic condition, but with faster speeds and proportionally more speed increase: 2.8-4.9 mm/min. The important effect of relative hypoxia suggested the possibility of differential K+ spread in the slice core vs. the periphery; this was demonstrable primarily in our perfused case (core: Fig. 7C, 7A - blue dashed, vs periphery: 7B, 7A - blue solid). K+ wave speeds were similar between the core and periphery in hypoxic slices (Fig. 7A).

A. K+ wave speed in core (±50μm of center) and periphery (within 50 μm of bath) in perfused and hypoxic slices. B. Periphery: [K+]ECS in perfused slice at 4 time points. C. Core: [K+]ECS in same slice, same times.
In addition to the K+ wave, we also observed depth-dependent differences in propagation of the depolarization wave (the SD itself) and neuronal spike rates in perfused slice (Fig. 8); spike rate represents a local tissue measure which could be more readily observed experimentally. While a K+ wave propagated through the center of the slice (Fig. 8A), neurons in the periphery of the slice only underwent a modest depolarization and fired regularly at 10-70 Hz, without the stereotyped bursting characteristic of SD (Fig. 8B). By contrast, SD at the periphery of the hypoxic slice kept closely behind SD in the core, with cells beyond 300 μm from the center of the K+ bolus firing almost simultaneously in core and periphery (Fig. 8C,D).
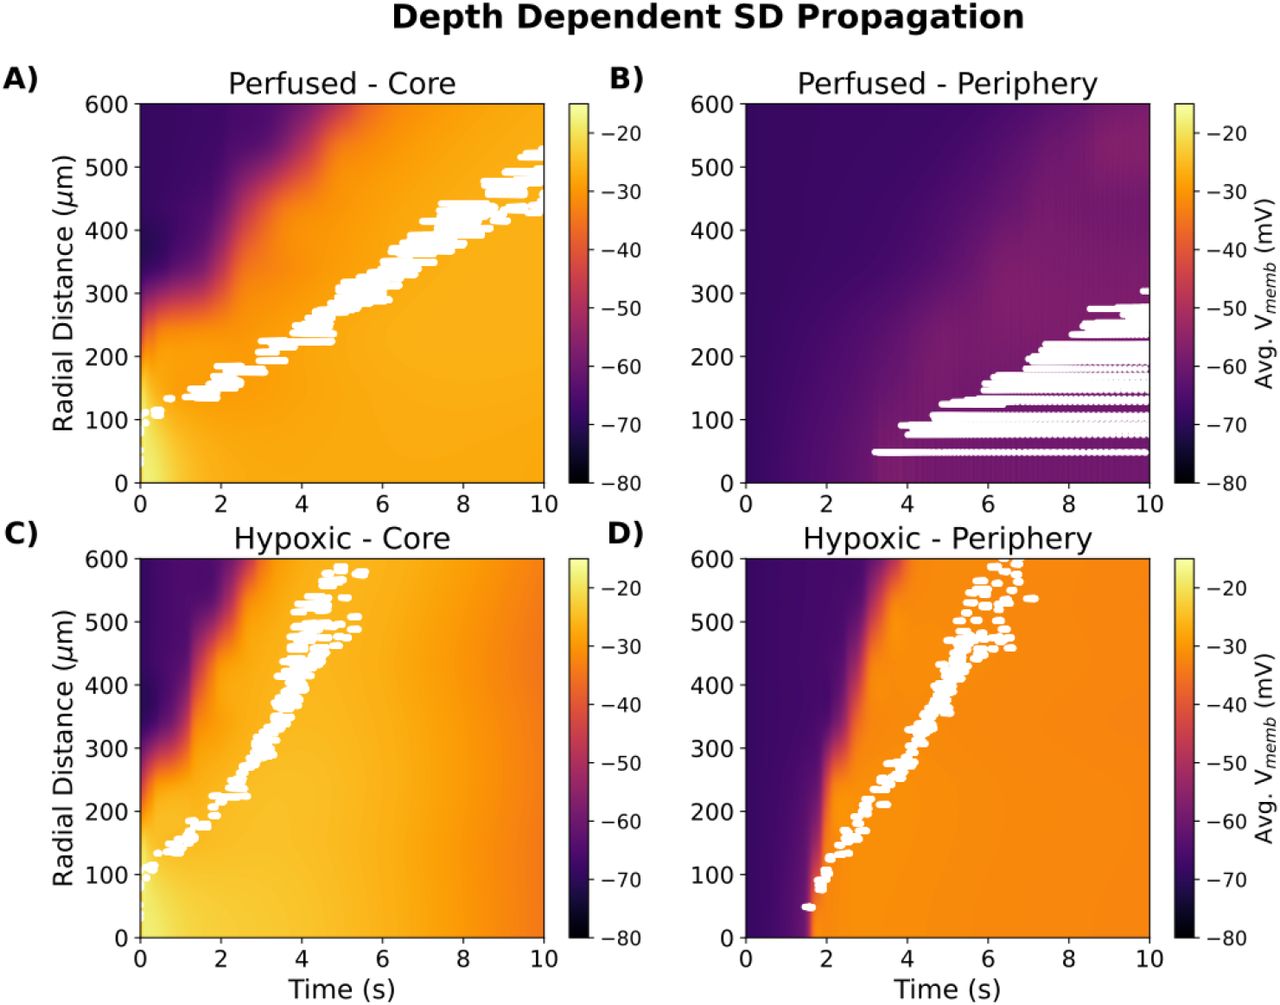
Average Vmemb (all cells) and spike rasters (white, 0.7% sampling) in 25μm×25μm voxels. A. perfused slice core, B. perfused slice periphery C. hypoxic slice core; D. hypoxic slice periphery.
Discussion
Our model reproduced a number of the properties of SD observed in brain slices (Fig. 2,4). Slice models which most resembled cortical gray matter (high cell density, high neuronal S:V) showed SD speeds and neuronal firing patterns comparable to in vitro optical and electrophysiological measurements [Aitken et al., 1998, Hrabe and Hrabetova, 2019, Devin Brisson et al., 2013, Lemaire et al., 2021]. The all-or-none nature of SD initiation, as well as the observed bolus [K+] threshold of ~20 mM, was also in agreement with experiments in brain slices [Andrew et al., 2017].
Our simulations suggest a pathological cycle whereby SD induces, and is also exacerbated by, hypoxia in slice. This mirrors findings in vivo where SD-associated metabolic demand for O2 can exceed supply, resulting in tissue hypoxia [Takano et al., 2007]. While K+ was slowly spreading outward across the slice, O2 spread inward, following the gradient caused by O2 depletion from overworked pumps (compare rapid fall-off of O2 in Fig. 4E to much slower fall-off of [K+]i in 4B). Depending on the distance to the bath and to the inciting bolus, intermediate locations in the slice will suffer various degrees of pump demand and partial pump failure. These spatiotemporal dynamics will be substantially altered by the effects of synaptic connectivity among cells, which remains to be explored.
By comparing the effects of changing O2 availability, total Cl− content, αECS, and λECS on SD in isolation, we determined that αECS influenced SD most strongly (Fig. 5C), accounting for most of the speed-up observed in hypoxic and propionate-treated slices. Our results support the hypothesis that the main mechanism in propionate’s priming for SD is through reducing αECS [Hrabe and Hrabetova, 2019], and suggest that the main mechanism for hypoxia speed-up is also reduced αECS.
Our results support Grafstein’s hypothesis that SD is primarily a reaction-diffusion process mediated by a regenerative K+ wave [Grafstein, 1956]. Grafstein’s hypothesis remains controversial [Strong, 2005, Herreras, 2005, Rogawski, 2008], but it is notable that even if synaptic or gap junction connectivity is necessary for SD, the speed of SD is maintained as if it were governed principally by diffusion, and the regenerative K+ source provided by the neurons in the path of the oncoming wave.
Model limitations
A mild irony of our study is that we are computer modeling an in vitro model of an in vivo animal model of human pathophysiology (model of a model of a model). There are necessarily distortions at each step. At the computer modeling level, the major limitations of this study are the limitations that are inherent in all computer modeling — we necessarily made choices as to what to include and what to leave out. In the current set of simulations, we left out: 1. all neural connectivity; 2. types of neurons, including distinction between inhibitory and excitatory neurons; 3. dendritic morphologies + additional membrane mechanisms; 4. glia, except as a generalized field; 5. volume occupying structures (instead using fractional volumes); 6. intracellular handling of ions and second messengers with effects on pumps and other mechanisms. These are largely correctable limitations that we will gradually begin to address in future versions of the model. Some, however, represent limitations in experimental knowledge which need to be addressed.
Additionally, we purposely designed the model to be generic rather than to reproduce the properties of any particular brain region and species. We feel this allows us to generalize more readily – e.g., comparing SD in brainstem vs cortex. Several interdependent tissue properties were treated independently with the benefit of allowing additional investigation by isolating parameters.
Experimentally Testable Predictions
Several of our predictions relate to the effects of manipulations on SD speed. These effects could be most easily assessed electrophysiologically by using a series of extracellular electrodes in slice to note the time of population burst passage and subsequent time of silence (the depression phase).
Slower SD in brainstem slice compared to cortical slice. Compared to cortex, brainstem has lower cell density, higher αECS, and low expression of ECS matrix molecules/perineural nets, implying low λECS [Ogawa et al., 1985, Hobohm et al., 1998, Syková and Nicholson, 2008], All of these factors contribute to slower propagation speeds in our model (Fig. 5C, 6) Our analysis of principal cell morphologies from brainstem also suggested an S:V lower than those of neocortical principal cells, another factor contributing to slowing.
Increased SD speed with cytotoxic edema in penumbra after stroke or traumatic brain injury (TBI). Cytotoxic edema will increase βnrn, producing speed-up, which will be enhanced in the hypoxic condition (Fig. 6B). We note that oxygen deprivation alone can be used to induce SD [Balestrino et al., 1988, Aitken et al., 1991, Müller and Somjen, 1998].
Hypoxia will increase SD speed under multiple conditions. We note that some of the fastest SD speeds (~9 mm/min) have been observed in patients after stroke [Woitzik et al., 2013].
Increasing αECS will attenuate SD propagation. This could be assessed using hypertonic saline to increase αECS [Kume-Kick et al., 2002]. Hypertonic saline is sometimes used in reducing intracranial pressure after TBI [Oddo et al., 2009, Mangat et al., 2020, Shi et al., 2020, Kamel et al., 2011], and might therefore also reduce SD in these patients.
Antiepileptic agents will reduce SD speed. We show here that dynamic changes in αECS due to SD itself speeds up the SD wave. Similar changes in αECS have been seen with ictal phenomena in slice [Colbourn et al., 2021], allowing us to hypothesize that this may be the linkage between SD and αECS, presumably mediated through excessive release of neurotransmitters whether classical, peptidergic, or NO.
SD velocity will correlate with neural density, dendritic complexity and total neuronal volume across regions Measurements of SD in various brain regions and across species can be assessed. Density is determined with counts in Nissl stain. Dendritic complexity increases S:V and can be assessed on traced, biocytin-filled cells with measures such as we performed here. Total neuronal volume can be assessed by measuring ascorbic acid in tissue [Rice and Russo-Menna, 1998]. These effects could also be evaluated in tissue culture or in organoids.
Increasing the diameter or concentration of the K+ bolus used to initiate SD beyond their thresholds will not change SD speed (Fig. 3).
Ease of SD initiation and SD propagation speed will increase with increasing slice thickness due to relatively hypoxic core (Fig. 7). SD will be difficult or impossible to initiate in very thin slices; however, expect additional damage due to slicing (see next item). Thick slices (1 mm) have been used as in vivo models of ischemia [Newman et al., 1988].
In thick slices (≥ 400 μm) SD speed will be greater near the slice center than near the surface. Extracellular measures looking for bursting and subsequent depression at different depths could be performed to confirm this prediction. However, one may want to avoid measurement directly at the slice surface where neurons will have suffered damage due to slicing and therefore may exhibit additional pathology that could alter SD propagation.
Future directions
Our model incorporated quantitative data and simpler models from numerous sources and at multiple spatial scales to constitute a unified framework for simulating SD in brain slices. We propose the use of this framework as community tool for researchers in the field to test hypotheses; guide the design of new experiments; and incorporate new physiological, transcriptomic, proteomic, or anatomical data into the framework. The open-source, branchable, versioned GitHub repository can provide a dynamical database for SD simulations or modeling brain slices in general.
Acknowledgements
This work was funded by NIH NIMH R01MH086638 and NSF Grant Internet2 E-CAS 1904444. We wish to thank Drs. Rena Orman, Mark Stewart, Richard Kollmar, and John Kubie (SUNY Downstate) for useful discussions on this topic.
Footnotes
Conflict of interest statement: The authors declare no competing financial interests.


