

Summary
The mouse is often the model of choice for genetic analysis of neurological disorders, but the introduction of disease mutations into a single inbred strain sometimes fails to yield phenotypes relevant to human disease. Interrogating genetically diverse panels of mice can identify better models of human sensitivity and resistance to candidate disease variants. We developed an in vitro methodology for modeling multiple stages of central nervous system development using a panel of genetically diverse mouse embryonic stem cell lines. Chemical knockdown of the neurodevelopmental gene Dyrk1a demonstrated profound strain differences in the cellular response to the ablation of DYRK1A activity throughout development in vitro. Responsive strains showed in vitro developmental defects consistent with observations in vivo on Dyrk1a knockout mice, and transcriptomic analysis of sensitive and resistant cell strain backgrounds successfully identified key molecular pathways in neural development known to be associated with Dyrk1a haploinsufficiency in vivo. Thus, we demonstrate that high throughput comparative phenotype analysis of differentiated cells from human and genetically diverse mouse pluripotent stem cells bearing disease mutations can provide a facile route to identification of optimal mouse strains for precision disease modeling in vivo.
Introduction
Experimental platforms based on human pluripotent stem cells (hPSC), including two-dimensional cultures of neurons, astrocytes, and oligodendrocytes, and three-dimensional organoid models of specific brain regions, are playing an increasing role in the study of the development of the central nervous system, and in unraveling the genetics of brain disorders (Fernando et al., 2020). However, most neurologic or psychiatric disorders are highly complex, involving the interaction of multiple systems inside and outside of the central nervous system (CNS). Ultimately, modeling of integrated phenomena such as complex circuit alterations, cognition and behavior requires studies at the whole organism level. The laboratory mouse has provided a versatile and practical model for the study of CNS disorders. The mouse has homologues of most human genes and is amenable to facile genetic manipulation, and well-established methodologies for phenotyping at the levels of electrophysiology, imaging, cognition and behavior are available in the species.
Most mouse models for heritable human disorders have been created in a few commonly used inbred strains. However, genetic background can have profound effects on the phenotype of a particular mouse model. Thus, creating a gene knockout or mutation model on a single genetic background may or may not yield a phenotype relevant to human disease. This impediment to disease modeling has long been apparent from studies of mouse knockouts on different genetic backgrounds (Chandler et al., 2013; Erickson, 1996), and can generally be related to the effects of modifier genes (Riordan and Nadeau, 2017). To a considerable degree, incorporating greater genetic diversity into disease modeling in the mouse can provide a more reliable reflection of human disease pathogenesis than studies with a few inbred strains. A number of recent reports have shown clearly how the use of genetically diverse strain backgrounds can enhance our ability to model human sensitivity and resilience to disease, as exemplified in studies of Alzheimer’s Disease, Type 2 diabetes, autism and gastric cancer (Keller et al., 2018; Molenhuis et al., 2018; Neuner et al., 2019; Onos et al., 2019; Sittig et al., 2016; Swanzey et al., 2020; Swanzey et al., 2021; Wang et al., 2019). However, the establishment, maintenance and use of mouse diversity panels requires significant infrastructure, animal husbandry and genetics resources, limiting their implementation for many investigators.
In recent years, mouse embryonic stem cell (mESC) lines from genetically diverse mouse strains have become available, and they have been used in vitro to study the genetic basis of the permissiveness of strains for mESC establishment, the regulation of the pluripotent state and early lineage specification, and the stability of genomic imprinting in vitro (Czechanski et al., 2014; Garbutt et al., 2018; Onos et al., 2019; Ortmann et al., 2020; Sittig et al., 2016; Skelly et al., 2020; Swanzey et al., 2020; Swanzey et al., 2021). Here we report a novel methodology for the application of genetically diverse mESC lines to in vitro disease modeling in the CNS, a precision neurogenetics approach that has the potential to make mouse genetic diversity more accessible to the research community, and to provide for facile selection of appropriate mouse genetic backgrounds for human disease modeling. We first established a set of robust neural differentiation protocols that enable production of key CNS cells of interest from genetically diverse inbred strains. These protocols are applicable across a panel of mESC representative of wide genetic diversity, encompass multiple stages of neural development, and provide for functional readouts. Using high content screening, RNA-seq, electrophysiology, and axonal regeneration paradigms, we provide a proof-of-concept study in the form of a chemogenomic analysis of the effects of inhibition of the neurodevelopmental gene Dyrk1a at multiple stages of neurogenesis and axonal repair. Dual-specificity tyrosine phosphorylation-regulated kinase 1A (Dyrk1a) was first discovered in Drosophila and the gene named “ minibrain” because mutations in the gene causes size reduction of the optic lobes and central brain hemispheres (Tejedor et al., 1995). Dyrk1a gene dosage affects many stages of neural development. In human, DYRK1A is located in the Down syndrome critical region and it has been associated with a range of conditions including Alzheimer’s Disease, Down syndrome, microcephaly, autism, and intellectual disability, (Arbones et al., 2019; Branca et al., 2017; Dang et al., 2018; Earl et al., 2017; Feki and Hibaoui, 2018; Fernandez-Martinez et al., 2015). Interestingly, patients harboring the same point mutation in the DYRK1A gene display different phenotypes ranging from severe autism to relatively minor neurological impairment (Earl et al., 2017), strongly suggesting that the genetic background modifies the penetrance of the mutation.
Using genetically diverse mESC, we demonstrate the impact of genetic background on the outcome of DYRK1A inhibition across multiple stages of neural development. With this approach, matching in vitro phenotypes in hPSC cellular disease models with mESC models exhibiting similar sensitivity or resilience to genetic variants enables rapid selection of mouse genetic backgrounds for in vivo modeling studies, and will provide a platform for prospective analysis of the power of in vitro mutant phenotyping to predict disease phenotype in vivo.
Results
A robust protocol for differentiation of genetically diverse mESC lines into neurons
Our overall objective was to develop in vitro methodology for the assessment of the effects of genetic variants on neural development and function across eight highly genetically diverse mESC representing the founders of the Collaborative Cross (CC founders, A/J (AJ), C57BL/6J (B6), 129S1/SvlmJ (129), NOD/LtJ (NOD), NZOHiLtJ (NZO), CAST/EiJ (CAST), PWD/PhJ (PWD), WSB/EiJ (WSB)). Therefore, we tested several well-established protocols to differentiate these cell lines into neurons (Bian et al., 2016; Bibel et al., 2004; Gaspard et al., 2009; Pollard et al., 2008; Ying and Smith, 2003), all developed using variants of 129 strain-derived mESC. When we tested these protocols on cell lines from inbred strains other than 129, the cells either died after a few days, or differentiated into unwanted cell lineages with an extremely low neuronal yield (Figure S1). For that reason, we developed a novel protocol capable of inducing neural differentiation in cell lines from genetically diverse strains (Figure 1A) using stem cell medium with Leukemia Inhibitory Factor (LIF) supplementation in the early phase of embryoid body formation and subsequent attachment to the substrate, followed by a pulse of retinoic acid and a bromodomain inhibitor. Cells from all strains acquired a neural phenotype in eight days (Figure 1B, upper panels) with the distinctive rosette morphology of neural progenitor cells (NPC) (Figure 1B, upper right panel). Thereafter, cells progressed towards excitatory cortical fate, but adjustments later in the protocol promoted differentiation into other neuronal cells such as GABAergic, dopaminergic, and motor neurons (Figure 1B, lower panels and Figure S2A-E). A slight modification to accommodate differences in developmental time allowed us to use the same protocol to differentiate hPSC as well (Figure S2F-H). Examination of expression of marker genes by QRT-PCR showed that pluripotency markers such as POU5F1 and NANOG decreased to undetectable levels at day eight, while the proportion of cells expressing the forebrain markers OTX2 and PAX6 increased rapidly under this protocol, along with the neuronal marker Beta-III tubulin (TUBB3). (B6-derived cells, Figure 1C). After seven days of neuronal maturation, whole cell patch clamp showed that neurons had spontaneous action potential trains (Figure 1D; human, Figure S2H). Evoked action potential showed adaptative responses as expected (Figure 1E). MEA recordings demonstrated rhythmic and synchronous bursts of action potentials, indicating that a mature neuronal network was established throughout the whole well (Figure 1F; mouse, Figure S2I, and human, Figure S2J). By growing the cells in suspension, this protocol could be used to create mouse cerebral organoids that are positive for neuronal and cortical markers such as TUBB3, VGLUT and REELIN (Figure 1G).

A) Diagram of the differentiation protocol to generate cortical neurons from mESCs; B) Representative images of WSB-derived cells stained for neural markers at day 2, 5 and 8 of differentiation (top panel). Lower panel from left to right shows images of cortical (Ctx), GABAergic (Gaba), dopaminergic (dopa) and motor neurons (MN); C) Quantitative PCR for different pluripotency- and neuronal-associated markers at day 0, 2, 5 and 8 of differentiation of B6 strain mESCs; D) Examples of spontaneous activity recorded by whole soma patch clamp on AJ and NOD-derived cortical neurons; E) Evoked activity recorded by whole soma patch clamp on B6-derived cortical neurons; F) WSB-derived cortical neurons show bursts of activity and synchrony on a MEA system; G) PWD-derived cerebral organoid showing neuronal and cortical markers.
Effects of DYRK1A inhibition on mESC maintenance and lineage specification vary across genetically diverse mouse strains
For a proof-of-concept study, we decided to use these genetically diverse mESC lines to examine how genetic background impacts on the effect of DYRK1A inhibition during neuronal development (Figure 2). Dyrk1a also regulates axonal growth and guidance, so we decided to assess an experimental model of axon regrowth as well. We used the well-characterized DYRK1A inhibitor ID-8; this inhibitor is highly selective against DYRK1A compared to other kinases (Bellmaine et al., 2017; Hasegawa et al., 2012; Miyabayashi et al., 2008; Monteiro et al., 2018).

Schematic outline of experiments to study outcome of chemical knockdown of DYRK1A during neural developmental and repair
It was previously shown that DYRK1A inhibition by ID-8 in mESC and hPSC helps to maintain the pluripotent state, and that either chemical inhibition or knockdown hampers specification from the pluripotent state to the neural lineage in hPSC (Bellmaine et al., 2017; Miyabayashi et al., 2008). In order to study pluripotency maintenance and lineage biases, we cultured the eight mESC lines in media supplemented with four combinations of factors: LIF+2i (LIF plus PD0325901 and CHIR99021, optimal maintenance of naïve state mESC, (Ying et al., 2008), LIF+ID-8, LIF, and ID-8. These cell lines were previously shown to vary in their response to LIF and in the stability of the undifferentiated state (Nichols et al., 2009; Skelly et al., 2020); some lines remain in the undifferentiated state and others express lineage markers as soon as LIF+2i optimal conditions are abandoned, especially those mESC lines from strains regarded to be recalcitrant to stem cell derivation (Czechanski et al., 2014).
Using HCS, we analyzed the expression of ten different pluripotency and lineage specific markers during four days of culture in the above conditions (Figure 3A, B and Figure S3). Only LIF+2i was able to maintain the expression of the pluripotency associated factors POU5F1, NANOG and SOX2 in all cell lines; nonetheless, PWD and NZO expressed these markers at low levels under all conditions. ID-8 was originally found to substitute for LIF in mESC maintenance on the 129 background (Miyabayashi et al., 2008). Nanog expression is a highly sensitive marker of the undifferentiated naïve state. Comparing cultures grown in LIF+2i with LIF+ID-8, we note that 129, AJ and B6 show the best maintenance of NANOG expression in ID8 alone (Figure 3B, bottom panel). We also examined the proportion of cells expressing markers of the three embryonic germ layers (Figure 3B, top two panels). Those cell lines that showed consistent expression of pluripotency markers in LIF+ID-8 also showed low expression of most germ layer lineage markers. Colony morphometry using HCS provides another indicator of cellular response to the culture environment. Loss of stem cell marker expression generally correlated with changes in colony morphology, as morphometry showed that cell colonies became less compact and circular in ID-8 alone, and LIF+ID-8 enhanced roundness in 129 only (Figure 3C). Comparing LIF vs. ID-8 alone, the two conditions maintain pluripotency associated markers to a similar degree, but in 129, B6 and CAST, mesodermal markers are expressed at higher levels (Figure 3B, D). In summary these results confirm previous studies in 129 mESC and hPSC indicating that DYRK1A inhibition can help maintain the undifferentiated state. AJ and B6 derived mESC also respond to ID-8 similarly to 129, but strains that are poorly maintained in LIF+2i are not rescued by DYRK1A inhibition.

A) Immunofluorescence images showing immunostaining for pluripotency markers in the eight different CC founder mESC cultured in four different culture conditions for four days; B) Heatmaps showing the percentage of cells expressing the markers in the mESCs as measured by HCS; C) Morphometry analysis of the mESCs colonies; D) Comparison of the effects of LIF vs ID-8 treatment on the overall proportion of cells expressing the analyzed markers in the eight different mESCs, determined by HCS. Red indicates decreased percentage of cells expressing the associated marker in ID-8 compared to LIF, green means higher expression. Cell lines and markers are arranged according to the overall degree of change (arrows). *, represents statistically significant differences against the control condition (LIF+2i) within the same cell line. #, represents statistically significant differences among cell lines treated with 2i+LIF and compared to the standard cell line 129. $, represents statistically significant differences among cell lines treated with 2i+ID8 and compared to the standard cell line 129. &, represents statistically significant differences among cell lines treated with LIF and compared to the standard cell line 129. %, represents statistically significant differences among cell lines treated with ID-8 and compared to the standard cell line 129. where a significant difference is indicated when p< 0.05. Means +/- SEM are shown. n = 4 biological replicates.
DYRK1A inhibition differentially blocks neural specification of mESC and neural progenitor proliferation in a strain-dependent fashion
Next, we used our differentiation system to study multiple stages in neural development, from neural lineage specification through to neurogenesis, neuronal differentiation, and maturation. For this, we differentiated the eight mESC lines into neural progenitor cells (NPC) using our newly developed protocol in the absence or presence of ID-8 and analyzed the cultures at the beginning and on days two, five, and eight via immunostaining and HCS (Figure 4A-B). As noted above, all pluripotency-associated markers were highly expressed at Day 0. After two days of differentiation, lineage markers for all three germ layers were detectable while pluripotency associated markers were reduced (Figure 4A, top panel, and Figure S4A). At day five of differentiation, pluripotency-associated markers, with the exception of POU5F1, were significantly reduced. By the endpoint of differentiation (day eight), cells had a fully developed neural morphology, with characteristic rosettes and neurites emerging from the cell clusters (Figure 4A, mid and bottom panels). All cell lines showed robust expression of neural lineage markers, with continued cell proliferation, and low expression of mesoderm and endoderm markers (Figure S4A).

A) Representative images of the B6 and WSB mESC lines differentiated into NPCs in the presence of the DYRK1A inhibitor ID-8 and analyzed at day 2, 5 and 8; B) Comparison between the proportion of cells expressing the indicated markers as measured by HCS in control and ID-8 treated cells after eight days of differentiation. Red indicates decreased percentage of cells expressing the associated marker in ID-8-treated cells compared to control whereas green means an increase. Cell lines and markers are arranged according to the overall degree of change (arrows) and n = 4 biological replicates; C) Venn diagram of DEG for each set of comparisons. Number in red represents downregulated genes, black indicates upregulated gene; D) RTNA for the top regulons associated with differences in ID-8 treated WSB- and B6-derived NPCs; E) Barcode plots showing two exemplary GOs differentially affected in WSB and B6 when treated with ID-8. Genes are ranked from left to right by increasing log-fold change represented by the vertical bars. The curve shows the relative local enrichment of the bars in each part of the plot; F) Isoform switch analysis showing the switch in the Ntrk2 when B6 is treated with ID8, upper plot shows the color-coded domains present on each exon (bars). Bar plots indicating total gene expression, isoform expression and relative isoform usage proportional to the total gene expression.
In the presence of ID-8, some cell lines showed altered patterns of neural differentiation. By Day 8, effects of the compound on neural specification were evident. CAST, B6 and 129 all showed decreased proportions of cells expressing neural markers, whereas WSB was least affected (Figure 4B). In particular B6 cultures treated with ID-8 showed a decreased proportion of cells expressing SOX1, OTX2, and TUBB3, and a sharp drop in the proportion of Ki67 positive cells.
Examination of the proliferation of neural progenitors from additional mESC clones of B6, 129 and WSB using KI67 and MCM2 immunostaining confirmed that the proliferation of B6 cells was inhibited by ID8, whereas the latter two strains were unaffected (Figure S4B). We previously observed an inhibition of neural specification in hPSC similar to that noted here (Bellmaine et al., 2017). We therefore examined the effect of heterozygous loss of DYRK1A on neural progenitor proliferation in the human induced pluripotent stem cel (hiPSC) line A04. The susceptibility of B6 neural progenitor cells to inhibition of proliferation by ID-8 was reflected in the reduced growth of DYRK1A+/- human iPSC neural progenitors relative to controls (Figure S4C-D). Thus, in terms of effects of DYRK1A inhibition on the maintenance of the undifferentiated state, interference with neural specification, and reduction of neural progenitor proliferation, the B6 mESC display the best face validity for modeling the response of human pluripotent stem cells to DYRK1a inhibition or haploinsufficiency.
By contrast, from the above screening results, it was apparent that during neural induction, WSB was largely unresponsive to ID-8. Bulk RNA-seq was performed on these two cell lines at Day 8 of differentiation to identify the differences in gene expression associated with the extreme phenotypic differences found between WSB and B6. This is evident from the numbers of differentially expressed genes (DEG); there were more than 700 DEG between B6 control and ID-8 treated cultures, but only 13 for control or treated WSB (Figure 4C). In control conditions, the expression profile of cells from both strains was substantially different, and this pattern was accentuated after treatment; from 189 DEG to more than 1400 (Figure 4C).
Regulatory transcriptional network analysis (RTNA) revealed Foxb1, Hoxa4, and Hoxd3 as the top regulons associated with the differences found between WSB and B6 in response to ID-8 treatment (Figure 4D). Foxb1 is a regulator of neural progenitor differentiation (Zhang et al., 2017), and is rapidly and transiently induced during cortical specification of hPSC (van de Leemput et al., 2014). The two Hox genes are associated with hindbrain patterning in the CNS (Alexander et al., 2009).
Gene ontology (GO) analysis indicated that either under control conditions or in the presence of ID-8, DEG associated with the response to LIF were highly overrepresented in B6 vs. WSB (Figure 4E, upper panel). The LIF signaling pathway is responsible not only for maintenance of mESC but also for maintenance of mouse neural stem cells in vitro and in vivo (Shimazaki et al., 2001). In the presence of ID-8, DEG associated with the GO term synaptic membrane were overrepresented in WSB relative to B6 (Figure 4E lower panel), consistent with progression of neural differentiation in the former but not the latter.
Using the RNA-seq data, we also analyzed gene isoform changes due to treatment and between B6 and WSB strains. Isoform usage can change considerably even when there is no overall change in gene expression, with functional consequences (Desai et al., 2014), and Dyrk1a is known to regulate the activity of a number of RNA splicing proteins (Alvarez et al., 2003; Ding et al., 2012; Shi et al., 2008; Toiber et al., 2010). Global analysis showed that adding ID-8 induced a loss of exons in B6 strain but not in WSB. We found 200 unique genes with alternative isoform usage when control B6 cells were compared to WSB cells; an increase of variant isoforms between the two strains was observed in the presence of ID-8. Of particular interest was the finding that Ntrk2 underwent a change in isoform expression in B6 NPC when treated with ID-8, whereas in WSB these isoforms remained unchanged (Figure 4F). Ntrk2 codes for a neurotrophic receptor that binds BDNF. We found that ID-8 treatment induces a switch from the canonical isoform to an isoform lacking the kinase domain. This isoform is unable to transduce signaling via tyrosine phosphorylation, and it is notable that BDNF signaling was implicated in the response to Dyrk1a haploinsufficiency in a proteomics study (Levy et al., 2021).
These results suggest that, in the B6 strain in which neurogenesis is affected, DYRK1A inhibition interferes with multiple pathways involved in neural specification, patterning and differentiation. RNA-seq confirmed the resilience of WSB against, and susceptibility of B6 to, DYRK1A inhibition at the neural induction stage. Subsequent analysis highlighted key pathways in neurogenesis downstream of DYRK1A inhibition.
Strain differences in the effect of DYRK1A inhibition on neuronal and glial differentiation in mESC-derived cerebral organoids
Neuronal differentiation and maturation stages were analyzed using two approaches, formation of cerebral organoids (CO) and electrophysiological monitoring using MEA. CO are a powerful tool to study neural development (Lancaster and Knoblich, 2014; Lancaster et al., 2013). We differentiated the mESC into CO and around day eleven, when neurogenesis begins, ID-8 was added to the media after which COs were left to grow and mature until day 21 when they were harvested, cleared, stained, and analyzed for differences in size, and glia/neuron composition (Figure 5A). ID-8 treated B6 and NOD CO had a higher cellularity compared to controls, whereas WSB had less (Figure 5B). (NOD control CO were extremely small, but NOD ID-8-treated organoids approached normal size). CO glial content in most strains was decreased except in B6, NZO and 129. In all cases, ID-8 treatment reduced the number of neurons in the organoids, except for CAST, WSB and NOD (NOD organoids showed a substantial increase in the number of neurons). The proportion of cellular volume occupied by TUBB3 in cells expressing this marker was decreased in all strains except for CAST and WSB. Overall, the results suggest that while differentiation into the neuronal and glial lineages, and neural maturation, is impaired in most strains, neuronal differentiation was relatively insensitive to ID-8 in CAST and WSB organoids. However, both of the latter strains showed a decrease in formation of GFAP-positive cells.

A) Representative images of mESC-derived COs in control or ID-8 treated conditions for AJ, B6 and WSB; B) Bar plots obtained from the CO images indicating the differences in cellular composition between control and ID-8 treated organoids. Analysis by HCS. Data normalized with respect to control (dotted line). * = p < 0.05 compared to the overall average. n = 3 biological replicates; C). Examples of 30 second recordings of all differentiated neurons (21 and 42 days in vitro) in the presence or absence of ID-8; D) Plots for firing rate, number of bursts, interburst interval, synchrony, burst duration, and spikes per burst. Because the neurons from different strains do not mature and survive equally, data form comparisons among the cell lines were taken at the timepoint where the highest frequency of firing (Hz) was recorded for each cell strain. Means +/- SEM are shown. n = 3 biological replicates.
DYRK1A inhibition delays functional maturation of neurons
To understand how DYRK1A inhibition modulates physiological maturation of neurons, we used MEA plates capable of recording 16 field potentials per well on a 48-well plate to assess electrophysiological activity. We seeded young neurons and let them mature for six weeks while analyzing electrical activity every week (Figure 5C). Addition of ID-8 began two days after the experiment was initiated and continued throughout. All cell lines were capable of generating action potentials, bursts of spikes, and creating networks; interestingly, not all cell lines mature at the same rate. CAST, B6 and 129 were the cell lines that matured the fastest, measured by Hz, bursting activity, and synchrony, while PWD took the longest (Figure 5C-D). We found that in most of the strains, addition of ID-8 was inhibitory to acquisition of all parameters of electrical activity. Neurons fired less; bursts of activity were less frequent and did not last as long as control. Complementarily, interburst interval, the relative silent time between two trains of activity, were longer for most cell lines. The network activity measured by synchrony index shows that most cell lines were not statistically affected except for AJ. Two special cases deserve some attention. First, 129 mature relatively fast and at day 21, 129 networks already displayed strong activity; by day 42, neural activity decreased to almost disappearance while most of the other cell lines were more active (Figure 5C). However, in the presence of ID-8, 129 remain active and organize in a network at day 42, indicating an overall delay with the compound. Second, NZO was the cell line that generated the most activity compared to the rest of the strains. In this strain, burst duration and spikes per burst were the only parameters affected by ID-8. Taken together, once again the functional maturation of neurons from B6 mESC was sensitive to ID-8, that of WSB mESC-derived cells were partially resistant to ID-8, and NZO derived neurons were the most resilient among all the strains. A decreased rate of functional network maturation is consistent with known effects of ID-8 on axonal growth and dendrite arborization.
We also performed RNA-seq on WSB and B6 neurons. Analysis at this stage showed a similar pattern to the NPC stage on the MDS plot which separates the neurons by strain and treatment; it also showed more distance between B6 subgroups than the WSB counterpart indicating B6 was more affected by DYRK1A inhibition (Figure S5A). After ID-8 treatment, there were 220 DEG between WSB and B6 (Figure S5B). GO analysis of DEG differentially affected by ID-8 in the two strains identified biological adhesion and transmembrane receptor signaling, with WSB showing a greater enrichment following ID-8 treatment (Figure S5C). Rxrg, Dmrtb1, and lrf7 were the top regulons associated with the differences in response to DYRK1A inhibition between WSB and B6 neurons (Figure S5D). Rxrg has been associated with neurodegeneration (Majer et al., 2019) and Irf7 is a key mediator of the innate and adaptive immune responses (Ning et al., 2011). We also found more alternative splicing events in B6 compared to WSB neurons when treated with ID-8 (Figure S5E). An exemplary gene that showed isoform changes was Slit2, which is associated with axonal guidance and cell migration. Slit2 exhibited isoform switches when treated with ID-8 in B6 neurons (Figure S5F) not observed in WSB counterparts.
mESC strain differences in recovery from axonal injury in vitro reflect genetics of recovery from brain injury in vivo
There are marked strain differences in the ability of different mouse strains to respond to injury to the CNS (Cortes and Pera, 2021). Abundant evidence confirms that Dyrk1a plays a role during neurite sprouting in normal development and that gene dosage alteration affects axonal growth and dendrite arborization (Dang et al., 2018), but it is not known whether these developmental roles of Dyrk1a might be recapitulated during axonal regeneration. As a further test of the predictive power of our in vitro system, we performed axotomy to analyze differences in axonal regrowth in neurons derived from mESC from CC founder strains.
We differentiated the mESC into neurons and cultured them into microfluidic chambers. (Figure 6A). On these devices, neurons were seeded on one chamber and axons could traverse microgrooves reaching into a second chamber whereas somas could not. After four days, axons grew through to the second chamber (Figure 6B). However, the number of axons growing through to the second chamber, and the length of the axons, indicated by the total area occupied by axons, varied amongst mESC strains (Figure 6C). At this point, axons were cut off and left to recover for four more days while treated or untreated with ID-8. In all cases, under control conditions, more axons grew across the device and had longer processes than before injury, except for B6 neurons (Figure 6B-D). CAST, NOD and NZO grew significantly more following injury compared to all other strains. When ID-8 was added, most of the lines showed less growth than controls. WSB, AJ, and PWD axons occupied the same area after regrowth in the presence of ID8 as the control did (Figure 6D). WSB axons experienced the longest growth pre- and post-injury (both control and ID-8 treated). Notably, the extent of axon growth prior to injury was not predictive of the extent of regrowth post injury (e.g. 129 versus NZO versus B6, Figure 6C).

A) Illustration of the microfluidic chamber used to isolate axons from somas. Image taken from chamber manufacturer webpage; B) representative images of B6, WSB and NZO neurons in microfluidic chambers prior to injury, post-injury in the absence of ID-8 and post-injury in the presence of ID-8; C) heatmap for the area occupied by axons in the chamber two (axonal side) before and after injury; D) Ratio of axonal growth compared to pre-injury in both control and treated neurons. Dunnet’s test was used for statistical analysis on three biological replicates; E) MDS plot showing the differences between cell lines over all three conditions; F) Bar plots showing differential response to axonal injury between WSB and B6 in the absence or presence of ID-8; G) RTNA showing the top three regulons associated with the differences between WSB and B6 when axons are injured; H) Enrichment analysis and comparison of isoform switches between the differences in axonal recovery between B6 and WSB treated or not treated with ID8; I) The isoform switch in the Ncoa4 gene; J) Axonal recovery experiment conducted on isolated primary cortical neurons from B6 and WSB postnatal day five mice. t-test for statistical analysis on three biological replicates.
Because of this divergent response to injury between B6 and WSB, we again undertook bulk RNA-seq analysis on these two cell lines to identify the underlying transcriptional differences. Interestingly, MDS analysis demonstrated vastly different responses between the two strains in the response to axotomy in the presence or absence of ID-8. As we saw from experiments in the maturation stage, ID-8 affected the transcriptome in both strains in control or axotomized cultures. However, when axons are severed, the B6 transcriptome showed limited change, irrespective of ID-8 treatment, whereas WSB transcriptome shifts markedly in response to axotomy in control and ID-8 treated cultures. The combination of ID-8 and axotomy displays an additive effect on the transcriptome in WSB, whereas in B6 this response is not observed, as axonal cut with or without ID-8 (“ no drug”) elicits the same effect (Figure 6E).
When axons were cut, the two cell lines (B6 and WSB) both expressed a core set of genes. These genes were MAP11, Ntsr1, Ccn5, Slc16a3 and, Smtnl2 reflecting GO associated with GO terms cellular response to hypoxia and neuron projection (Figure 6F). Top regulons for the differences found between the cell lines when injured were Ascl1, Creb5, and Olig2 (Figure 6G). These transcription factors are important for neuronal differentiation and myelination. Ascl1 has been associated with a superior regenerative capacity in dorsal root ganglion neurons in CAST versus B6 in vivo (Lisi et al., 2017).
After axons were cut and treated with ID-8, more genes were differentially expressed in WSB than in B6 (two-fold). Top common DEG genes in both cell lines were Padi2, Calcr, Itgb4, Ifitm1, Npy, Tnfrsf11b, C1ra and Pcolce; all of them are associated with axonal growth and guidance. In WSB-derived ID-8 treated neurons, gene sets associated with cell adhesion and central nervous system myelination were upregulated compared to the B6 counterpart (Figure 6H) and were confirmed by the number of hits per GO. This profile can explain a more robust axonal growth after axonal damage in WSB neurons. Finally, RTNA showed that two of the top three regulons associated with the differences in recovery after axonal growth, Olig2 and Ascl1, were similar to those identified in the axonal damage response in the absence of ID-8. These results suggest that Olig2, Creb5, and Ascl1 are part of the core regulatory network for a fast axonal growth after axonal damage when B6 and WSB are compared. Isoform switched analysis unveiled that Ncoa4 was not only downregulated but also switched in isoforms was found after axotomy (Figure 6I). Ncoas4 was recently associated with ferritinophagy and neurodegeneration (Quiles Del Rey and Mancias, 2019).
A comparison of axonal regrowth of primary cortical neurons from P5 newborn B6 or WSB mice confirmed that the differences in growth post-injury seen in mESC derived neurons reflected the regrowth capacity of neurons isolated from the postnatal brain (Figure 6K).
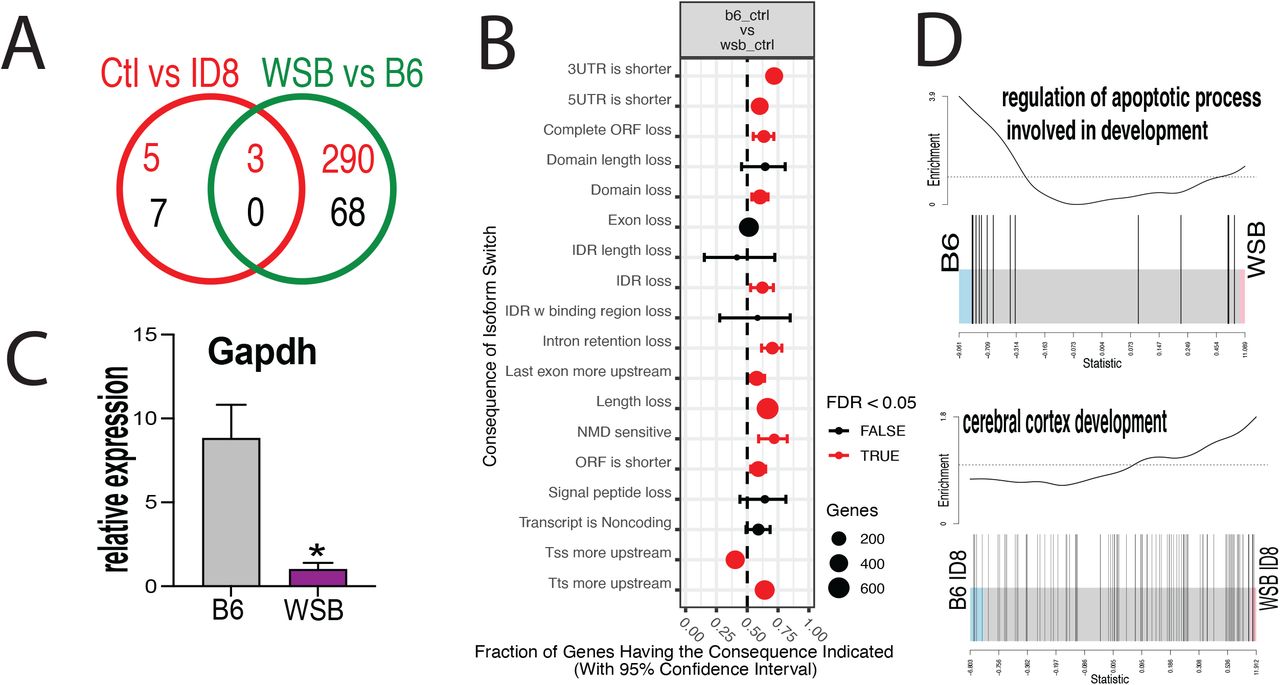
Using the RNA-seq data, we analyzed the effect of ID-8 treatment independently of the cell strain, and also compared across the two strains independently of the treatment, throughout all stages analyzed. Analyzing effects of ID-8 in a strain independent fashion, we found only 15 DEG genes, but the cross-strain comparison independent of treatment found 261 DEG (Figure 7A). Similar to the gene expression differences, differential use of transcript variants were found between strains, and our data indicated that in general, the consequences of isoform switches in WSB resulted in shorter transcripts (Figure 7B). It is worth pointing out that Gapdh, a housekeeping gene commonly used to normalize expression data, was differentially expressed between WSB and B6 regardless of treatment (Figure 7C). This disparity could be associated with differences in metabolic demands and energetic substrates. The latter correlates with differences we observed in other ontologies like mitochondrial respiratory chain complex II assembly and monocarboxylic acid metabolic process (data not shown). A gene set more enriched in B6 independently of treatment was the regulation of apoptotic process involved in development, whereas that a cerebral cortex development gene set was differentially affected by ID-8, B6 being more severely affected (Figure 7D).

A) Venn diagram showing the numbers of differentially expressed genes, strain-wise and treatment-wise; B) Relative expression of Gapdh in both strains; C) Consequences of switch analysis between the B6 and WSB strains; D) Bar code plots showing overall differences between the two strains in control and when treated with ID-8.
Discussion
To facilitate genetic analysis in vitro of neural development across a diverse range of mouse genetic backgrounds, we first developed a new protocol to differentiate pluripotent stem cells into neurons from genetically diverse mESC and hPSC. This is the first protocol that allows for robust neuronal differentiation between genetically diverse strains and across species. As in other neural differentiation protocols, the default differentiation program is toward cortical neurons; additional small modifications of the protocol can generate other types of neurons including GABAergic, dopaminergic, and motor neurons. Glial cells can be generated through organoid formation on this platform. Adjustment of timing to accommodate the interspecies developmental differences allowed us to use the same protocol in both mESC and hPSC, which provides more direct comparisons of mESC models to hPSC under identical conditions, eliminating a major confounding element in cross-species comparisons.
We demonstrated the applicability of this model in analyzing the effects of chemical knockdown of the activity of a key neurodevelopmental gene throughout neurogenesis and neural maturation and repair, and we were able to demonstrate how the knockdown phenotype varies dramatically depending on the genetic background. As proof of concept, we studied the effects of the inhibition of DYRK1A because it is a kinase that plays multiple roles during the entire ontogeny of neurons, with different effects on each stage of development, and because its haploinsufficiency leads to microcephaly and autism spectrum disorder. Genetic background is known to affect the phenotype of heterozygous loss of function of DYRK1A in human (Earl et al., 2017; Murray et al., 2017). Our approach allows the researcher to dissect each step of development in a fast and relatively inexpensive fashion on multiple genetic backgrounds compared to an in vivo study. It also permits the study of the early stages of differentiation that are difficult to analyze in the early embryo such as neural specification, or complex conditions in mature neurons such as axonal injury.
By using a selective DYRK1A inhibitor (ID-8) in our model, we were able to recapitulate the effects of Dyrk1a haploinsufficiency found in other models and studies. Our studies have revealed that at most stages of this study, from embryonic stem cell renewal to neural specification, neurogenesis, and neural maturation and repair, B6-derived cultures were responsive to DYRK1A inhibition while most other strains proved less sensitive. It is notable that C57BL/6J mice or hybrids thereof have been used successfully in a number of studies to model the effects of DYRK1A haploinsufficiency in human. Thus, on a C57BL/6J, 129S2/SvHsD mixed background, Dyrk1a -/- mice show developmental delay and reduced brain size with greatly reduced neuronal content, and die at mid-gestation. Heterozygotes on this background have fewer intermediate neural progenitors in the subventricular zone at E11.5-13.5 owing to proliferative defects (Najas et al., 2015). In the adult animal, cortical pyramidal neurons are smaller, and show less branching and fewer spines (Benavides-Piccione et al., 2005), and neural progenitor maintenance in the subventricular zone is impaired (Ferron et al., 2010). These same animals show decreased cognitive abilities (Arque et al., 2008). Dyrk1a-/+ mice on a pure C57BL/6J background also show reduced brain size and cognitive defects (Raveau et al., 2018). Conditional knockout of Dyrk1a in the cortex of C57BL/6J mice was lethal in homozygotes; homozygotes and heterozygotes showed microcephaly related to reduced proliferation of neural progenitors in the immediate postnatal period, and a decreased complexity and reduced branching of cortical neurons (Levy et al., 2021). All of these features are compatible with our observations on neural specification, NPC proliferation, and neuronal differentiation of B6 mESC in the presence of DYRK1A inhibition.
Our previous work showed that neural specification of human pluripotent stem cells was blocked in DYRK1A knockdown or in ID-8 treated cells (Bellmaine et al., 2017). Here, we showed that the proliferative capacity of neural progenitors derived from DYRK1A +/- hPSC was reduced relative to controls. We observed both phenotypes in mESC or mESC-derived neural progenitors from B6 mice. These findings as well as the data discussed above show that our in vitro results correctly identify the B6 mouse as a suitable model for the effects of DYRK1A haploinsufficiency in the human. By contrast, other strains were unresponsive to the developmental effects of DYRK1A inhibition. Although DYRK1A is subject to strong constraint in the human, and most heterozygotes show impairment of neural development, the severity of clinical phenotypes in individuals hemizygous for loss of the gene varies quite considerably (Earl et al., 2017; Murray et al., 2017). Further in vitro analysis of mESC derived from recombinant inbred strains representing sensitive and resistant genetic backgrounds could identify key modifier genes, and potentially target pathways for therapeutic intervention during the early life of affected individuals.
We also examined the effects of DYRK1A inhibition on axonal regrowth across the eight strains in our study. While repair and plasticity processes in the adult CNS often encompass some features of neurodevelopmental pathways, development and repair in the CNS are not identical processes (Li et al., 2010). Our observations showed that the extent of axonal regrowth after injury in neurons derived from mESC does not directly relate to the extent of growth before injury across the mESC lines examined, suggesting that indeed axon growth during development and repair are different even in relatively immature neurons. There were large differences in the ability of axons derived from mESC of different strains to regrow in this assay. Importantly, the robust regrowth of neurons derived from the CAST strain contrasts strikingly with the poor regrowth of neurons derived from B6 mESC. Our observation of poor axonal regrowth in primary cultures of cortical neurons from P5 B6 or WSB mice confirmed the results obtained on neurons derived from mESC. In a number of studies in vivo, B6 mice have been shown to display deficient axonal regeneration relative to 129 or CAST (Basso et al., 2006; Dimou et al., 2006; Kigerl et al., 2006; Ma et al., 2004; Omura et al., 2015; Tedeschi et al., 2017), deficiencies that have been attributed either to variation in the inherent capacity for axonal repair or differences in the extent and nature of inflammatory responses in the various strains.
Comparison of gene expression in B6 and WSB strains that were sensitive or relatively resistant to effects of DYRK1A inhibition across different developmental stages revealed the power of the mESC model to identify critical molecular pathways and networks that are altered by genetic deletion of Dyrk1A in vivo. At the stage of neurogenesis, analysis of DEG highlighted the LIF pathway, which is a major regulator of neural progenitor proliferation in vivo. RTNA found networks related to Foxb1, a gene critical in the regulation of neural progenitor proliferation, were differentially active in the two strains. Analysis of the expression of splice isoforms showed global changes in the presence of ID-8, in line with the known interactions of DYRK1A with splicing factors. The shift in isoform usage of the BDNF receptor Ntrk2 to a form encoding a protein lacking the kinase domain in the presence of ID-8 in B6 neural progenitors could explain the downregulation of the BDNF pathway activity observed in a proteomics and phosphoproteomics study of conditional knockout of Dyrk1a in the cortical neurons of C57BL/6J mice (Levy et al., 2021). Our studies of axonal repair identified the Ascl1 regulon as a major differential response to injury in both strains either with or without DYRK1A inhibition. In a model of peripheral neuron (dorsal root ganglion) repair, Lisi et al. (Lisi et al., 2017) noted a differential upregulation of Ascl1 in CAST (identified by these authors and by our study as a good regenerator compared to B6) relative to B6. These authors also used overexpression and knockdown studies to confirm a role for Ascl1 in axon regrowth. In summary, our in vitro studies comparing gene expression in strains sensitive and resistant to DYRK1A inhibition corroborate in vivo data on key molecular pathways involved in neuronal development and repair and their perturbations in Dyrk1a-deficient animals.
In our comparison of gene expression in both strains across all stages, the finding that Gapdh was the highest DEG was surprising, because it has been widely used as a reference housekeeping gene, with some studies supporting such use (Panina et al., 2018) and others reaching the opposite conclusion (Roy et al., 2020). GAPDH induces apoptosis when translocated into the nuclei of both neural and non-neural cells, and it shows dynamic changes in neurodegenerative diseases, cancer and hypoxia (Sawa et al., 1997; Tanaka et al., 2002). GAPDH acts a sensor of NO stress(Hara et al., 2006), and participates in dendrite development (Lee et al., 2016; Sawa et al., 1997; Tanaka et al., 2002). The strain differences we observed in Gapdh expression could have broader implications for disease modeling in B6 mice.
The approach we describe here could be generalized to address a range of issues in modeling the genetics of disease. We used a specific chemical inhibitor in this study to facilitate screening a panel of mESC at different developmental stages. However, screening approaches using shRNAi or sgRNA CRISPR methodologies are also applicable in this system. We readily applied high content screening and medium throughput microelectrode array methodologies in our work. The small panel of mESC used in this study incorporates wide genetic diversity, but we are also developing mESC or iPSC panels from Diversity Outbred mice and from recombinant inbred strains. These mESC genetic diversity panels have been used for quantitative trait loci analysis, and could be used for rapid mapping of modifiers that influence phenotypes of genetic variants implicated in neurodevelopmental disorders. Identification of modifier genes could yield new leads for drug discovery and early intervention in patients. We focused here on neural development, but this same approach could be applied to any lineage or tissue that can be generated from pluripotent stem cells. Facile comparison between phenotypes of human and mouse pluripotent stem cell models in vitro will aid in the identification of those mouse genotypes that confer sensitivity or resilience to disease variants, providing for more precise disease modeling in vivo and reducing the experimental use of animals. Finally, most disease modeling studies using hPSC have been retrospective, replicating the known effects of disease mutations to varying degrees in a culture dish. The use of mESC provides a means for prospective testing of the ability of in vitro screens to predict the effects of genetic variants in vivo. This will be an important adjunct to hPSC studies aimed at validating novel candidate disease variants emerging from genetic studies in humans.
Experimental Procedures
mESC culture and maintenance
mESC from the CC founders (Chesler et al., 2008) were used; however, PWD/PhJ was substituted for PWK/PhJ. Mouse stem cell media comprised Knockout DMEM, 15% Fetal calf serum, 2 mM Glutamax, non-essential amino-acids, 50 units/ml Penicillin, 50μg/ml Streptomycin, 50 μM beta-mercaptoethanol, and 1000 IU of Leukemia inhibitory factor. Cells were grown on gamma-irradiated mouse embryonic fibroblast feeders at 37°C and 5% CO2.
ID-8 (StemCell Technologies), a DYRK1A inhibitor, was used at different stages at 10 μM and replenished with every media change when needed.
Cortical neuron differentiation
Upon reaching 80% confluency, mESCs were trypsinized and seeded on a culture dish for an hour. After adherence of feeder cells to the dish, unattached cells were recovered and counted. 300,000 cells per well of a 6-well plate (ultra-low attachment) were seeded in mESC media plus 10 μM SB431542 and 1 μM Dorsomorphin. The next day, embryoid bodies and media were transferred to a 100 μg/mL Poly-Lysine (PLL)-, 1 μg/mL Laminin-, 5 μg/mL Fibronectin-coated 6-well tissue culture plate. Twenty-four hours later, media was removed and switched to NMM (Gaspard et al., 2009) (Neurobasal and DMEM/F12 1:1 vol/vol) plus SB431542, Dorsomorphin, 2 μM I-BET151 and 5 μM retinoic acid. One day later, media was removed, and fresh NMM plus SB431542 and Dorsomorphin were added. The aforementioned formulation of media was changed daily and the next day (for B6 and WSB) SB431542 and Dorsomorphin were withdrawn. The other strains were maintained on SB431542 and Dorsomorphin for two more days after which the inhibitors were withdrawn. Thereafter all cells were kept on basal media with daily media changes until day eight when cells were dissociated into small clumps with Tryple Express and expanded at a 1:2 split ratio on PLL-fibronectin and laminin-coated dishes. Cells were passed into NMM plus 20 ng/mL FGF2 and 20 ng/mL EGF for three days. Revitacell (Gibco) was added for the first 24 hours. At day eleven, cells were dissociated with Tryple Express to yield a pure population of NPC. Cells were frozen using Knockout Serum Replacer and 10% DMSO, or passed onto a newly coated plate for neuron maturation using NMM media (formulated with Neurobasal A in place of Neurobasal medium), 10 ng/mL GDNF, 10 ng/mL BDNF, replacing half the volume of medium every other day. Revitacell (Gibco) was added for the first 24 hours. 10 μM Forskolin was added for the first four days, and 5 μM 5-fluorodeoxyuridine was added from day four to ten or twelve.
Differentiation of GABAergic neurons
The first four days of differentiation were carried out as described in the cortical differentiation protocol above. On day five, SB431542 and Dorsomorphin were removed, and fresh media was added. On day six, a sonic hedgehog agonist (SAG, 10 μM) was added with every media change and withdrawn after three days of neuronal differentiation. The rest of the protocol was exactly the same as the cortical differentiation.
Differentiation of dopaminergic neurons
This procedure was the same as described for GABAergic neurons until day six. On this day, SAG and FGF8 (100 ng/ml) were added for two days, at which point conversion to NPC had occurred. Cells were passed as previously described, with the addition of Revitacell, FGF2, non-essential amino acids, FGF8, SAG, IWP2 (1 μM) and LY364947 (3 μM) during the expansion stage. After plating cells for maturation, Revitacell, 10 μM Forskolin, BDNF, GDNF, 50 μg/ml ascorbic acid, CHIR99021 (3μM) and LY364947 were added. Media was changed on the third day with the continued addition of BDNF and GDNF. The cortical neural protocol was followed after day four.
Differentiation of motor neurons
Differentiation was as described for cortical neurons until day seven. On day four, SAG and retinoic acid were added with every change media. On day seven, neurons emerged and cells were ready to be seeded as young MN. When passing the cells, Revitacell, Forskolin, BDNF, GDNF, SAG, and retinoic acid were added. After three days, all the small molecules were withdrawn and and BDNF and GDNF were retained. The cortical neural protocol was followed after day four.
Cerebral organoids
The protocol for organoid formation was based on the cortical differentiation protocol above. Briefly, 2000 cells were seeded per well of a round bottom, ultra-low attachment, 96-well plate in mESC basal media with LIF, SB431542, and Dorsomorphin. Forty-eight hours later, the spent media was removed and replaced with NMM+ SB431542, Dorsomorphin, I-BET151 and retinoic acid. The next day, this medium was removed and NMM with SB431542 and Dorsomorphin was added. Forty-eight hours later, half the volume of the culture medium was replaced. At day six and eight, half of the media was replaced with basal media (NMM). On day ten, organoids were split evenly and 24 organoids were placed into 6 cm ultra-low attachment dishes. On day 16, organoids are embedded in undiluted Matrigel (Corning, 356234) in the same medium and kept on a shaker at 16 rpm for at least 21 days.
Human induced pluripotent stem cells (hiPSC) culture and maintenance
KOLF2 hiPSC were used for differentiation studies and to generate heterozygous knock-out cells. CRISPR-Cas9 was used to produce frameshift mutants in Exon 2 of one allele of DYRK1A gene, generating Dyrk1a +/- mutants, as previously described (Andersson-Rolf et al., 2017). Cells were maintained on vitronectin-coated dishes in Stemflex media (Stem Cell Technologies).
Cells were differentiated into NPC according to the protocol described above.
hiPSC Neurosphere assay
After 15 days of neural differentiation, cells were used to seed 96-well ultra-low attachment plate at various concentration (1,2,4,8,16 and 32 thousand cells) for 96-hour culture in NPC medium. Media changes were performed every other day. Spheroids were imaged with Leica Dmi1 and their size calculated using ImageJ software. Spheroids were passed every 4 days using accutase for 30min at 37°C.
EdU labelling of human NPC
After 15 days of differentiation adherent cells were incubated for 2 hours with 5µM EdU. Then cells were harvested and fixed with 4% paraformaldehyde at room temperature for 15 minutes. EdU incorporation was detected according to the Clik-iT EdU Alexa Fluor 594 flow cytometry assay kit protocol. Cells not labelled with EdU were used as negative control.
Differentiation of hPSC into cortical neurons
hPSCs were grown using StemFlex medium on Synthemax II- or recombinant vitronectin-coated dishes and passed using ReleSR. The differentiation protocol was the same as the one used for mESC but with extended periods of time. For EB formation, Revitacell was added. IBET-1 and RA was added on day one for 24 hours and not on day two as in the mESC protocol. SB431542 and Dorsomorphin were maintained in the medium until day eleven when they were withdrawn. NPCs were passed on day 14. After three days of expansion, as with mESC, NPC were differentiated as in the mESC protocol.
Differentiation of hPSC into motor neurons
Cell were differentiated according to the hPSC to cortical neuron protocol with minor modifications. On day eight, retinoic acid and SAG were added, and cells were maintained in this medium until day 23. Every time cells were passed, 5 μg/ml each of Fibronectin and Laminin were supplemented in the media in addition to their usage in the plate coating; these were supplemented again twice per week to avoid cell detachment and until 10 days after withdrawal of mitogens.
Electrophysiological Recordings
50,000 NPC were seeded on a multi-electrode array (MEA) plate in media and left to mature as previously described. Recordings were obtained on day 7, 14, 21, 28, 35, and 42. Spontaneous activity was recorded on an Axion Maestro Pro at 37°C for 10 minutes using the AxiS navigator software. Recordings were analyzed using the built-in spike detector at 6 x STD.
Axonal Damage using mESC-derived neurons
NPC of each cell line were seeded on one of the two chambers of a microfluidic device (ENUVIO). Devices were pre-coated with PLL, fibronectin and laminin to make sure microgrooves were coated. Cells were left to mature for four days. Afterwards, in the contralateral chamber, axons were cut off by scratching the chamber and pipetting the media up and down several times. The axonal chamber was rinsed to removed debris and replenished with fresh media and fibronectin and laminin to enhance axonal attachment. Four days later, the axonal side was treated with Calcein AM, and images of the entire device were taken. The area covered by axons was analyzed using ImageJ.
Preparation of p5 NPC for axonal damage experiments
C57BL/6J (B6) and WSB/EiJ (WSB) postnatal day 5 animals were euthanized by decapitation in accordance to our IACUC protocol. The hippocampus/dentate gyrus was dissected, mechanically dissociated, and seeded on PLL and fibronectin and laminin-coated dishes in NMM media plus EGF and FGF (20 ug/ml each) and expanded through one passage prior to inducing neuronal differentiation for axonal experiments were carried on. Expanded NPC were differentiated in the same fashion as mESC-derived neurons.
Immunostaining
Cultures were washed with PBS and fixed with 4% paraformaldehyde 4% for 15 min and finally washed again with PBS three more times. Blocking and permeabilization were carried out using 5% BSA and 3% Triton-X for an hour at room temperature. Primary antibodies used were OTX2, Millipore AB9566-1 (1:1000); TUBB3, Biolegend 801202 (1:1000); Ki67, Santa Cruz SC-23900 (1:50); PAX6, Biolegend 862001 (1:1000); Brachyury, R &D systems AF2085 (1:200); Vglut, Abcam ab104898 (1:200); CHAT, Merck Millipore AB144P (1:200); Hb9, Thermo PA5-67195 (1:200); MCM2, Abcam ab95361 (1:500); DYRK1A, cell, signaling, (1:1000); ISL1, DSHB 40.3A4-S and 40.2D6-S both undiluted 1:1; SOX2, Millipore AB5603 (1:500); Eomes, Abcam ab23345 (1:1000); POU5F1, BD 611202 (1:500); GATA4, Santa Cruz SC-25310 (1:2000); NANOG, PeproTech 500-P236-50UG (1:500); SOX1, R & D AF3369-SP (1:500); AFP, Dako A0008 (1:500); GFAP, Dako Z0334 (1:1000); NeuroD1, Abcam ab60704 (1:2000); TH, Pel-Freez P41301 (1:1000); GAD 65/67, Millipore ABN904 (1:250); vgat, Synaptic systems 131011 (1:200); Reelin, Abcam ab78540 (1:200). Primary antibodies were incubated overnight, washed three times with PBS and secondary ALEXA antibodies (1:1000) against primary antibodies were incubated for two hours. DAPI was used for nuclear counterstaining. Cerebral organoids were cleared and stained according to Dekkers et al. using a home-made fructose-glycerol clearing method (Dekkers et al., 2019). Antibody was used at twice the concentrations used above.
High content microscopy
Perkin Elmer cell carrier ultra 96-well plates were used for high content microscopy. Imaging was carried out on the Operetta CSL (Perkin Elmer) microscope, and mage analysis was done using Harmony software. After clearing, Z-stack images of organoids were obtained, reconstructed and analyzed.
RT-PCR
Samples were collected and RNA was prepared using Qiagen RNAeasy plus mini kit (Qiagen). Reverse transcription was carried out using High-Capacity RNA-to-cDNA(tm) Kit (ThermoFisher). Real-time PCR was conducted using Quantstudio 7 Flex on a 2-step cycle run using Taqman Probes (Oct4, # Mm00658129; Nanog, # Mm02019550; Otx2, # Mm0046859_m1; Pax6, # Mm00443081_m1; Tubb3, # Mm00727586_s1; Scl17a7, # Mm00812886_m1; Gapdh, # Mm99999915_g1).
Bulk RNA-seq
Samples were collected and RNA was prepared using Qiagen RNA column system. mRNA libraries were made at 150 x2 with at least 30 000 reads per sample. Low-quality bases (Q < 30) from the 3’ end of reads were removed and reads with more than 30% low-quality bases (Q < 30) overall were filtered out. Trimmed reads were aligned to the reference genome using bowtie2 (Wei et al., 2018), generating a bam file which is used by rsem for quantification providing expression counts for genes and isoforms separately. Quality metrics were obtained at the fastq, bam level. This includes metrics such as total number of reads, total number of high-quality reads and alignment rate. The RNA-seq data was filtered and normalized. MDS plots were made using EdgeR (Robinson et al., 2010). Venn diagrams were made using systemPipeR (TW and Girke, 2016), and the Limma (Ritchie et al., 2015) package was used for barcode plots and testing for multiple gene sets. Gene ontology analysis and plotting was completed using TopGO (Alexa A, 2020) and GO.db (M, 2019). Transcriptional network analysis was done using RTN (Fletcher et al., 2013). Circos plots were made using circlize (Gu et al., 2014). Isoform switching was analyzed using IsoformSwitchAnalyzeR package (Vitting-Seerup and Sandelin, 2017), and other tools to import data, conduct normalization, isoform switch testing, prediction of open reading frames, premature termination decay, coding, domaings signal peptides, protein disorder and consequences (Almagro Armenteros et al., 2019; Finn et al., 2010; Huber et al., 2015; Meszaros et al., 2018; Vitting-Seerup et al., 2014; Vitting-Seerup and Sandelin, 2019; Wang et al., 2013).
Statistical Analyses
Anova two-way was conducted and Tukey’s test performed as a post hoc analysis. A t-test was conducted when comparison between control and treated was sought only. Computation and plots were done using Rstudio and GraphPad Prism.
Acknowledgments
This work was supported by the Jackson Laboratory. DEC was the recipient of a JAX Scholar Award. AE was a participant in the JAX Summer Student Program. We thank Dr. Catherine Kaczorowski for providing access to MEA equipment and for review of the manuscript, and Ms. Anne Czechanski for advice on mESC culture.


