

Abstract
The environment is an important component in the emergence and transmission of antimicrobial resistance (AMR). Despite that, current AMR monitoring initiatives lack comprehensive reference data for the vast majority of environments. To enable monitoring to detect deviations from the normal background resistance levels in the environment, it is necessary to establish the typical baseline of AMR in a variety of settings. In an attempt to establish this baseline level, we here performed a comprehensive literature survey across 2516 scientific papers, 150 of which contained relevant qPCR data on antibiotic resistance genes (ARGs) in environments associated with potential routes of AMR dissemination. The collected data include 1487 samples distributed across 30 different countries and 17 environmental types, in a time span from 2005 to 2018. More than 330 different genes were identified from the collected studies. Most surveyed environments contained a diverse set of ARGs, but generally at low abundances. We used linear mixed models and overrepresentation analysis to identify time trends and associations between ARGs and specific environments. Altogether these data represent a comprehensive overview of the occurrence and levels of ARGs in different environments, providing background data for risk assessment models within current and future AMR monitoring frameworks.
Introduction
According to the World Health Organization the increasing level of antibiotic resistance over the last decades is a considerable threat to global health1. Already, current estimates suggest that hundreds of thousands of deaths are caused by antibiotic resistant bacteria each year worldwide, and this number is expected to reach several millions annually within the next 30 years2.
Antibiotic resistance has been mainly investigated in clinical and agricultural settings. However, the role of the environment as a source and dissemination route of resistance has been widely recognized in recent years3–5. Antibiotic resistance is widespread in nature and not limited to human-associated activities as evidenced by antibiotic resistance genes (ARGs) found in glaciers, permafrost and isolated caves which have virtually never been visited by humans6–8. It is even likely that resistance may be maintained independent of human activities in e.g. soil systems due to the presence of antibiotic-producing microorganisms, including certain fungal taxa9. Due to the extraordinary biological diversity in nature, the external environment can serve as a source of novel ARGs not yet present in clinically relevant pathogens10. Furthermore, the environment constitutes a dissemination route for resistant bacteria between humans and animals11. However, it is not yet clear to what extent the resistant environmental bacteria and the presence of ARGs in the environment contribute to acquisition and spread of resistance in clinically relevant bacteria. To address these questions, it is essential to identify and quantify resistance in the environment. This in turn would allow pinpointing which environments possess the highest risks to human and domestic animal health and would subsequently enable us to devise measures to prevent – or at least delay – recruitment and dissemination of resistance factors from the environment.
Monitoring schemes for antibiotic resistance have been developed and put to use in clinical and agricultural settings, but systematic monitoring for antimicrobial resistance (AMR) in the environment is still lacking12. Existing monitoring systems largely rely on culturing of pathogens and bacterial indicator species of interest13, and these approaches may not be directly applicable to the monitoring of resistance in the environment. For example, the majority of environmental bacteria are not culturable using standard laboratory methods and the breakpoints for resistance are adapted for clinically relevant pathogens. Circumventing culturing drawbacks, quantitative real-time PCR (qPCR) allows detection and quantification of individual ARGs. However, a major hurdle for using qPCR for monitoring of AMR is the decision of which genes to select as targets in these qPCR assays. While large arrays that can measure the abundances of hundreds of ARGs in parallel exist14, they are still fairly expensive and may not yet be ready for implementation in routine monitoring15, and this would thus necessitate selection of a smaller number of highly relevant qPCR targets.
To address this problem, and to design efficient monitoring and surveillance strategies, there is a need for comprehensive background data on abundances and prevalence of ARGs occurring in both pristine and human-impacted environments. Establishing background levels of ARGs is a prerequisite for determining “safe levels” for ARGs naturally occurring in the environment and would also provide insights into to which extent an environment has been enriched with ARGs due to human activity. However, there is currently no, or very little, reference data available for the majority of environments and no agreed-upon set of genes to be used for environmental AMR monitoring.
The aim of this study was to perform a literature survey of studies containing qPCR data for ARGs in various environments and identify a set of genes and reference values for key environments for AMR transmission, which could be used for monitoring purposes. Through screening of more than 2500 scientific papers, we found that most surveyed environments contained a diverse set of ARGs, but generally at low abundances. However, it was clear that the existing data on ARG abundances is unevenly distributed across the world and that there is a general lack of data for most environments and geographical areas. The study highlights the need for knowledge of environmental background levels of AMR to understand spatiotemporal changes in ARG abundances that can be associated with increased risks for adverse human health effects.
Materials and Methods
Data collection
Literature collection was performed by mining the PubMed database in April-May 2020, November 2020 and October 2021. The searches were performed using three strings: ‘“antibiotic resistance genes” AND (monitoring OR surveillance) AND qPCR AND’, ‘“antibiotic resistance genes” AND “high throughput” AND’ and ‘“antibiotic resistance” AND (qPCR OR “quantitative PCR”) AND’ complemented by environmental type: “sewage OR wastewater”, “surface water”, sediment, soil, food, “drinking water”, “bathing water”, “swimming pools”, “bathing water”, water, airport, (“public transport” OR bus OR train OR airplane OR boat OR tram OR underground OR metro), (industrial OR pollution), abandoned, cleanroom, animal and “one health”. Environmental types were selected based on an assessment of potential transmission routes for antibiotic resistance4, 11. Paper suitability was initially assessed by screening the title, abstract, and methods section. Only papers using qPCR as a quantification method and containing extractable data were selected. Review papers were not included in this study.
For each paper the following information was extracted: first author, DOI, year, country, sampling location, treatment/type (including distance from a contamination source, season, type of fertilizer/antibiotic applied, stage of wastewater treatment process, source; e.g. for “water” it would be “potable”, “reclaimed”, “river” etc.), sample type, and abundance of antibiotic resistance genes (ARGs). For several studies missing information about the exact year of data collection, we extrapolated the sampling year based on the average time required from the data collection to the publication inferred from the other studies, corresponding to an estimate of two years. The ARG abundances were collected from text, tables and figures. Information from figures was extracted using WebPlotDigitizer v4.3 (https://automeris.io/WebPlotDigitizer). Abundances were reported as log10 ARG abundance per 16S rRNA. ARGs with abundance below detection limit were not included in the analysis.
Data analysis
Data were analyzed in RStudio v1.3.107316 with the R package ggplot2 v3.3.517 used to plot the graphs. To determine the abundance distributions for ARGs across environments, density plots of the ARG abundances were used, and the R summary function was used to find the quartiles for each ARG. To investigate if there were any changes in ARGs levels over time, we built a linear mixed model (LMM). LMM allows incorporation of not only fixed effects but also random effects to account for cluster-correlated data from distinct sources of variability18. The model was designed with ARG Abundance as a response variable and sampling Year as explanatory variable and included sampling Country as a covariate:
 Analyses were performed using lme4 v1.1-27.119 and lmerTest v3.1-320 packages.
To identify genes associated with particular environments, we used the R package indicspecies v1.7.9. This analysis uses relative frequency and abundance of species (in our case genes were treated as “species”) in defined groups, to identify those that are the most characteristic of each group21. Only genes found in more than 20 samples were included in this analysis. The function multipatt was run with 9999 permutations. The results were visualized as a network using Cytoscape (cytoscape.org).
To identify a set of suitable qPCR targets we investigated how well the data from collected genes could predict the abundance of the other genes in the data matrix by performing a correlation analysis. Only genes with more than 10 entries were included in the analysis. R package stats (version 3.6.2) cor function with “pairwise.complete.obs” was used to calculate Spearman correlations.
Results and Discussion
Current data on AMR in the environment is geographically biased
Mining of the PubMed database resulted in 2516 papers and revealed a bias in the existing literature towards already fairly well studied environments (Figure S1). Unsurprisingly, the majority of the identified papers matched environmental categories that have been already extensively studied as primary sources of antibiotics and/or antibiotic resistance to the environment. These include environments linked to wastewater treatment plants, hospitals and industrial facilities, as well as agriculture and livestock production. This also highlights the undersampled nature of the other environments. To bring an example, it is suggested that human mobility, in particular international travel, could contribute to dissemination of ARGs across the globe10, 22–24. Despite that, categories associated with travel activity, such as “public transport” and “airports”, are represented by just a handful of papers. Similarly, water associated with recreational activities is another poorly investigated environmental category, despite that accidental ingestion of water during, for example, swimming is considered to be a potential route for resistant environmental bacteria into the human gut25.
In total, we identified 150 studies (1487 samples) containing relevant information on levels of ARGs measured by qPCR. These studies covered 17 different types of environments with “water” and “effluent” being the most commonly investigated (covered by 46 and 33 studies, respectively). In contrast, “food” and “air” were mentioned in just five studies or less. The samples collected in these studies originated from 30 different countries (Figure 1A), with China being the most studied among them, both in terms of number of studies and samples. The distribution of studies highlights white spots on the map; in particular, there were no studies originating from South America and just a handful of studies from Africa. This is worrisome, as South America and Africa are among the regions with the highest rates of self-medication and supply of non-prescribed antibiotics in the world26, 27. In 2014, a WHO report outlined Africa’s lack of established AMR surveillance systems1 and a review from 2017 reported that more than a third of the countries on the continent did not have recent AMR data published in the public domain, and that only little of the reported data were from surveillance28. This scarcity of publicly available data on AMR is corroborated by the current literature survey. The majority of samples in the selected studies were collected between 2015-2018 with a gradual increase in the number of publications over the last years (Figure 1C).

Studies distributed by A) country, B) sampled environment, and C) year.
Environmental ARGs are diverse in almost all environments
We identified 331 different genes that were quantified in at least one of the collected studies. They belonged to several different ARG classes with β-lactamase and multi-drug resistance genes being the most diverse classes (54 and 46 unique ARGs, respectively) (Table S1). When ARG data were stratified by country (Figure 2), it was evident that overall the diversity of targeted and detected ARGs was fairly low (86% of the studies targeted less than 10 ARGs on average). Most of the studies used singleplex qPCR (119) and 29 used high throughput qPCR (HT-qPCR).

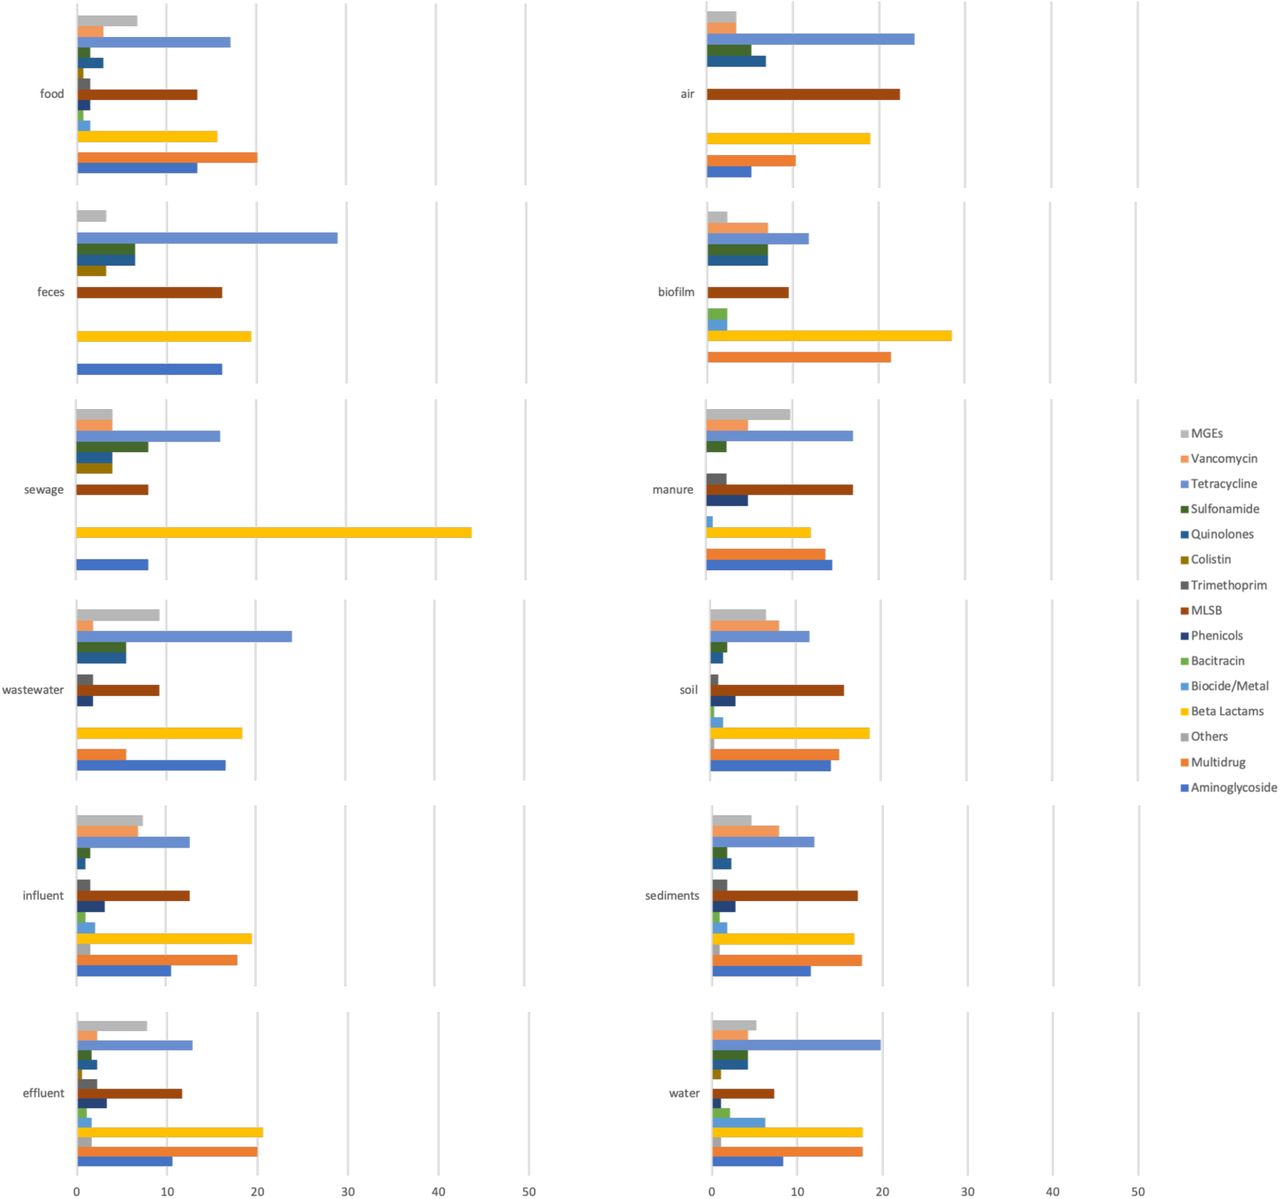
Most of the studied environments were characterized by a diverse set of investigated ARG classes (Figure S2), but despite that a limited but obvious bias was observed towards certain classes of ARGs. In particular, tetracycline and β-lactam resistance genes were among the most commonly used targets for qPCR studies. Interestingly, studies investigating sewage targeted mostly β-lactamases in comparison to the other classes. This may be due to these genes being perceived to be associated with a relatively higher risk to human health, which would justify intensive research on their removal in sewage treatment plants. A range of macrolide-lincosamide-streptogramin B (MLSB) resistance genes were looked for and reported from all the investigated environments. Multidrug resistance genes showed a similar pattern with the exception of being absent from “feces” and “sewage” environments, which is most likely due to a limited number of studies targeting these particular ARG classes rather than this being their actual distribution. Colistin resistance genes were reported only from five environments in studies published starting from 2018. This class is an interesting case, since colistin belongs to the family of polymyxins which used to be one of the last classes of antibiotics for which resistance was not plasmid-mediated. In 2015, the first plasmid-borne colistin resistance gene was described29, and since then it has been reported in many bacterial species and samples across the world, some predating the initial discovery30, 31, although it was not often targeted in the studies we analyzed. There were also several classes which were profiled consistently across all the environments, including sulfonamides (with the sul1 and sul2 genes reported from all the environments), vancomycin and aminoglycoside resistance genes.
Around one in a thousand environmental bacteria carry clinical ARGs
Most of the ARGs present in more than 20 studies were characterized by higher than average abundance (Figure 3) and were, unsurprisingly, widespread across the studied environments (Figure 4). Among the 20 most reported genes, tetracycline resistance genes were the predominant class of ARGs. Sulfonamide resistance genes sul1 and sul2 were the two most reported genes, with sul1 reported in 68% of studies and from all the environments. The intI1 gene was also reported from all the investigated environments and was characterized by the highest average abundance among all the genes in our data matrix. These genes are among the ones suggested as good monitoring targets by Berendonk et al.4. Genes encoding extended-spectrum β-lactamases, including blaCTX-M, blaTEM and blaSHV, were among the common targets in qPCR studies, which is not surprising since they are ARGs commonly encountered in clinically relevant pathogens. The plasmid-mediated fluoroquinolone resistance gene qnrS has been reported from aquatic environments and wildlife4, 32, 33. A study of the distribution of this gene in wildlife and water reservoirs suggested that it can be horizontally transferred even in the absence of a selective pressure from antibiotics34. The most commonly reported genes also included the erythromycin resistance genes ermB and ermF, and the aminoglycoside resistance genes strB and aadA1. Interestingly, there were several genes that were often highly abundant when detected, but which were not often reported, making them potentially suitable additional targets for AMR monitoring (vanA, tnpA4, tnpA5, sul3, qacEdelta, mexF, IS613, floR, ereA and aadA2).

ARGs reported in more than 20 studies are represented in orange, and ARGs reported less but which were generally highly abundant are shown in blue. The line represents an average abundance across all data points.
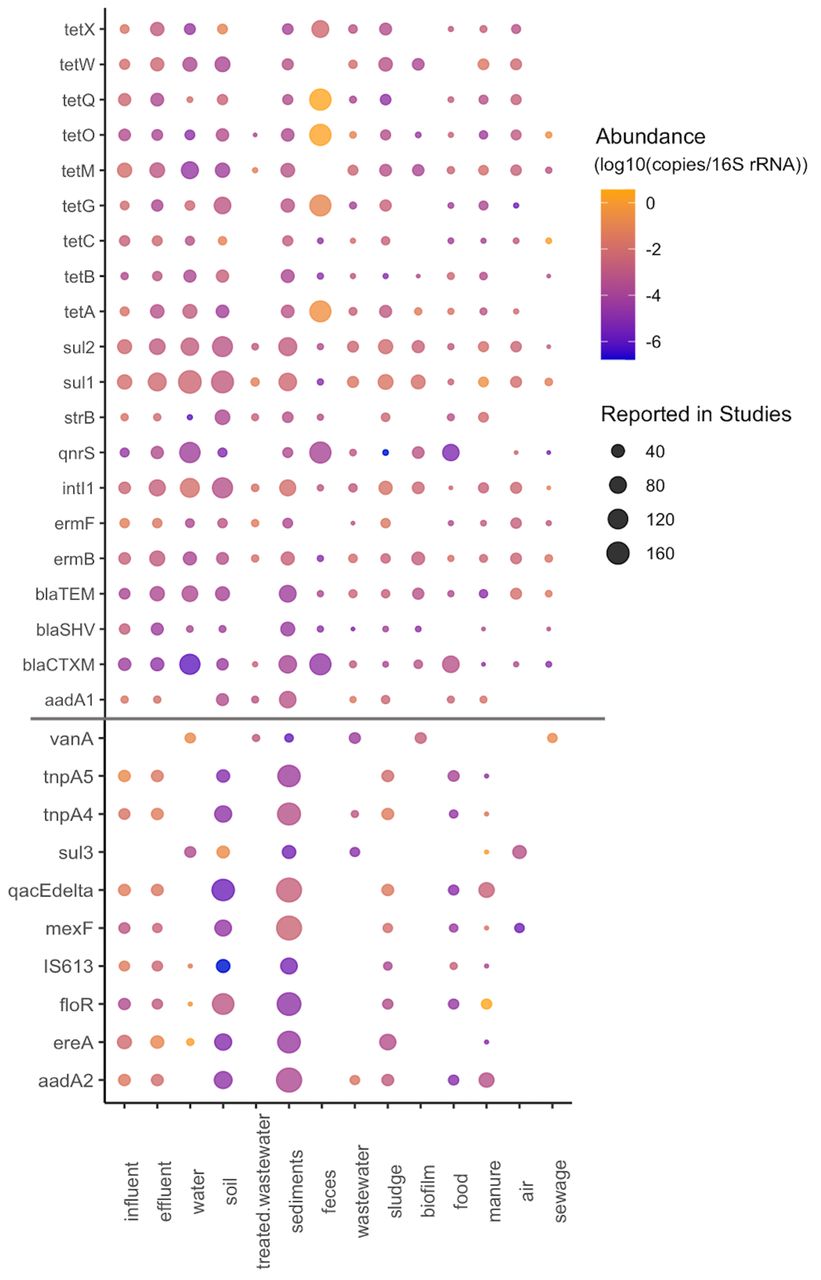
Above the line are ARGs reported in more than 20 studies and below are the ARGs reported less but highly abundant.
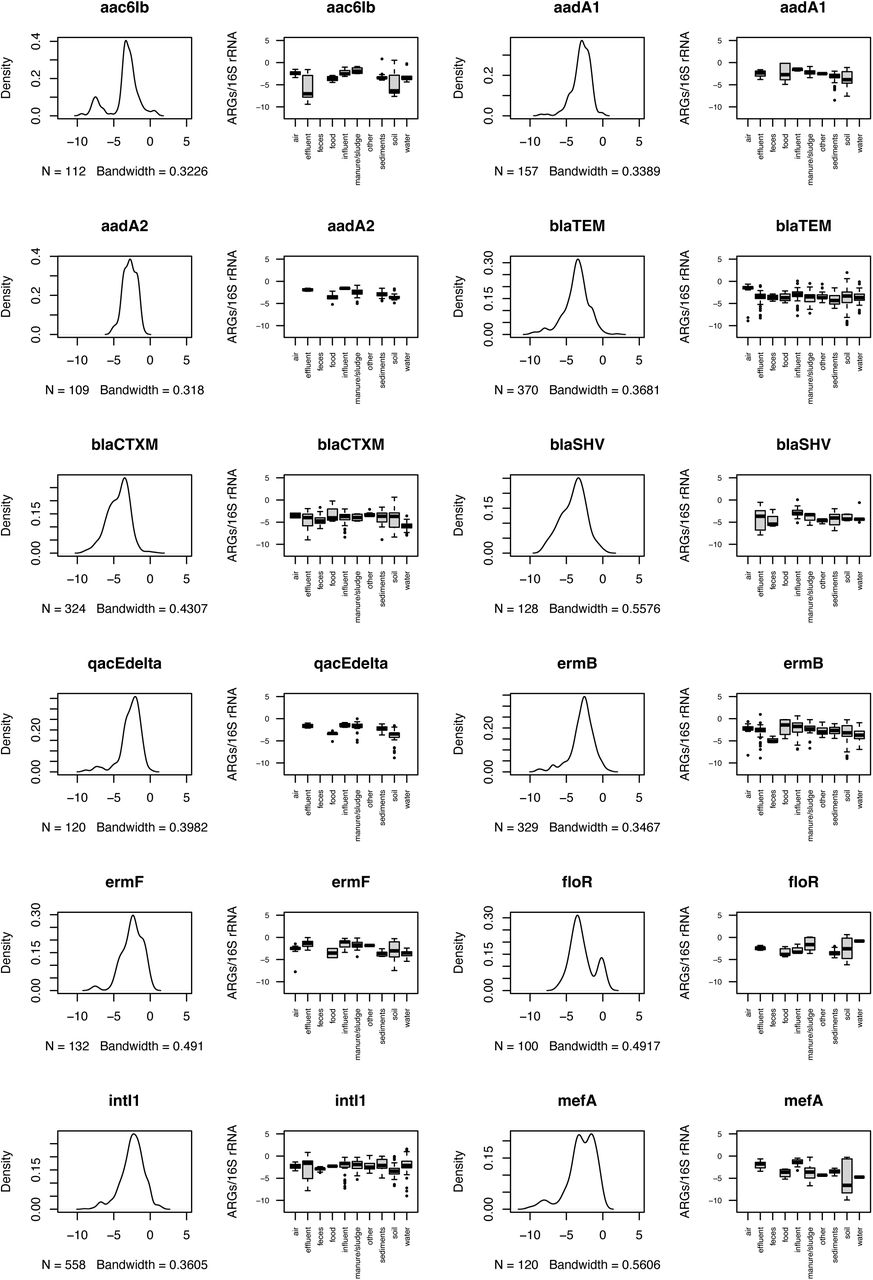
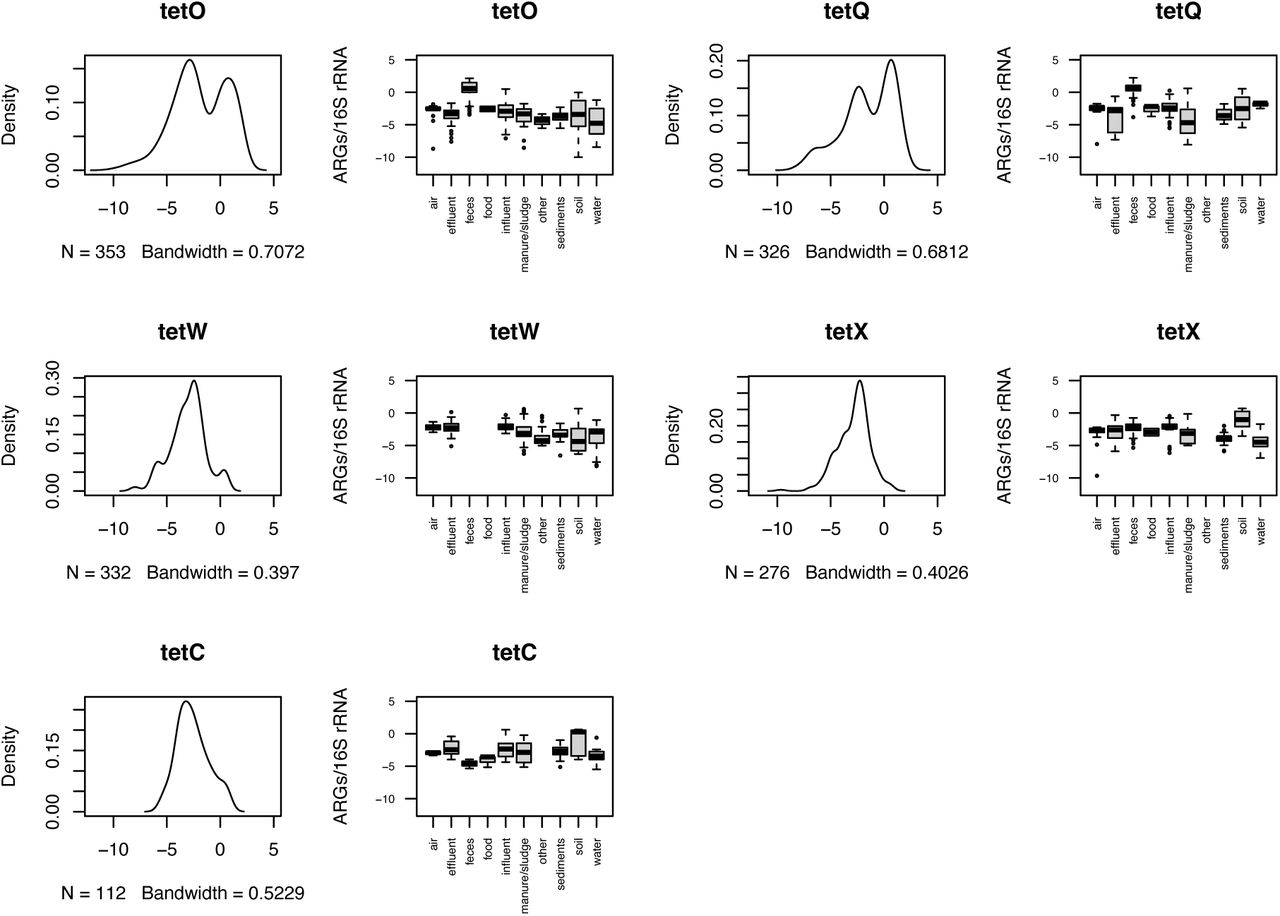
For each ARG with more than a single observation, we estimated its typical environmental abundance levels (Figure S3). We found that for most ARGs, the typically reported abundances fell in an interval from 10-5 to 10-3 copies per 16S rRNA, roughly corresponding to one ARG copy in a thousand bacteria (Table S2). That said, some ARGs, such as the mcr1 colistin resistance gene (mostly below 10-5 ARGs/16S), had lower typical abundances, and tetracycline resistance genes tetO and tetQ often occurred in abundances above 1 copy per 16S rRNA in fecal samples (Figure S3). Interestingly, overall environmental abundances of these two tet genes were in the typical 10-5 to 10-3 range, indicating that these genes may be good indicators of pollution with human fecal matter. They may even be more suitable than intI1, which has been proposed as a marker of human anthropogenic impact in the past35 but consistently appeared in 10-5 to 10-3 copies per 16S rRNA in most environments in our data (Figure S3).
Taken together, it seems normal to encounter most ARGs in abundances between 10-5 to 10-3 copies per 16S rRNA in a given environment, although we refer the reader to Figure S3 and Table S2 for specific values for individual ARGs. In general, we advise the use of 10 times the third quartile (3Q) values for a given ARG (Table S2) to determine the upper limit for what should be viewed as a deviation from normal background levels in the environment. This should be combined with studying the overall and environment-specific abundance distributions for the same gene (Figure S3). It is worth noting that this analysis does not consider whether the detected ARG abundances are the result of anthropogenic activities36, 37 or natural selection for ARGs in these environments9, 38.
It is unclear if ARG abundances have increased over time
To investigate if there were changes in ARG abundances over time, we used linear mixed models on the data for all of the ARGs in each of the environments, accounting for variability between countries (Figure S5). Due to the increased sensitivity of the qPCR methods and inclusion of a larger number of ARGs profiled in each study over time, we chose to use linear mixed models for the maximum values rather than all ARG values reported. Using this approach, we found positive trends for most of the environments (for cases where there was enough data to perform the estimates), except for in sediments, sludge, wastewater and treated wastewater where the trends were negative (Table S3). That said, the trends were significant only for soil (increase) and treated wastewater (decrease). Thus, the most prominent finding of this analysis might be that in most cases there was too little data to draw any conclusions on ARG abundance changes over time, highlighting the need for time series data to understand the long-term development of antibiotic resistance in the environment.
Most ARGs are not associated with specific environments
We performed an overrepresentation analysis showing which ARGs were associated with particular environments (Figure S6, Table S4). We found that a substantial number of ARGs were specifically associated with sludge, sewage, manure and soil, but not the other environments. However, comparably few ARGs were specifically associated with just a single environment. Some notable examples of such single-environment associations include mcr1 in feces, qnrD in wastewater, strA, strB, tnpA3 and aphA3 in manure, and aadA3 in sediments.
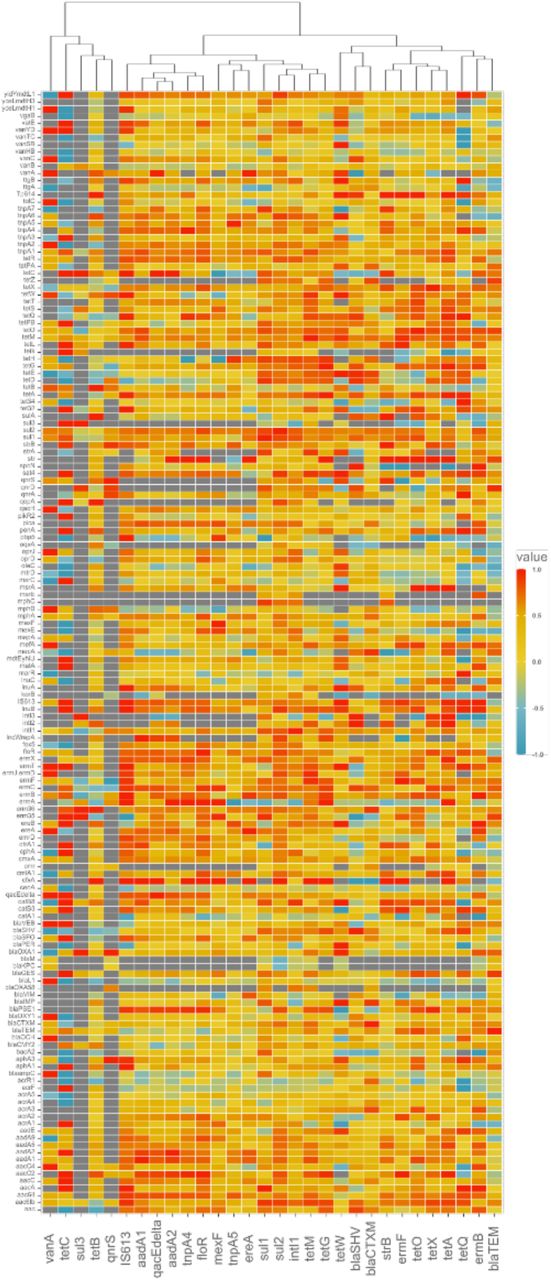
Abundance data for some ARGs provide redundant information
The set of most reported genes consists of potential candidates to be used as qPCR targets, since they were on average more abundant and were also found in most environments (Figures 3 and 4). To explore if they would be good predictors of overall ARG abundances, we performed a correlation analysis of the most reported genes and the rest of the genes in the data matrix (Figure S4). Interestingly, this analysis revealed a certain degree of redundancy in terms of what information can be gained from the proposed monitoring targets. ARGs proposed as monitoring targets that strongly correlate with each other convey similar information on ARG abundance and diversity and may therefore not be very useful to use in the same panel for ARG monitoring in the environment. Genes that are overall redundant are the tetO, tetX and tetA genes, strB and ermF, blaCTX-M and blaSHV, tetG and tetM, as well as intI1 and sul2 (Figure S4). If resources are constrained, it would seem wise not to use several genes in these smaller groups together in the same ARG panel for monitoring.
Priorities for environmental monitoring of AMR
It is well established that antibiotic resistance is an ancient phenomenon, and that the environment represents a rich reservoir of resistance factors which could be transferred to human pathogens under the right conditions9, 38–40. Therefore, environmental monitoring of antibiotic resistance is important in order to protect human and animal health. However, a systematic framework for monitoring in the environment is still lacking12, and defining what, where and how to monitor is crucial for such efforts to contribute relevant data4. There are several main objectives for monitoring of AMR in the environment, including i) assessment of risks for transmission of already resistant pathogens to humans via environmental routes, ii) analysis of general levels of resistance in the human population, and iii) monitoring the evolution of resistance in the environment to identify emerging resistance threats41.
Risk ranking of ARGs
There have been several attempts to create a system for ranking ARGs by risk to human health. Two common criteria used to estimate risks include known presence of an ARG in human pathogens and whether it is located on a mobile genetic element, such as a plasmid. For instance, Martinez et al.42 proposed a ranking system which assigns the highest rank to genes that have already been shown to be a clinical problem and the lowest rank to genes whose resistance function was inferred solely by homology. However, ARGs that are well-known and have been around for decades in clinical pathogens may be less of a concern than those that have recently emerged and that could potentially pose the next big threat, but are not yet widespread among pathogens10. Thus, ARGs which are not ubiquitous and not yet present in human pathogens must be carefully considered when assessing risks associated with environmental resistomes. A recent paper by Zhang et al.43 presented another approach based on microbial ecology, with the decisive ranking criteria being enrichment of the ARG by anthropogenic activities. ARGs enriched by anthropogenic activities and correlated with antibiotics contamination should, by this line of thinking, pose a higher risk than those that are not enriched43. This is, in theory, a sound approach; however, a major issue would be determining which ARGs that would be enriched by antibiotic exposure, as this is in most cases not known outside of ARGs commonly occurring in human pathogens. Another factor to consider in risk ranking could be the presence of an ARG in a variety of different environments44 or in different bacterial species, including potential human pathogens, which would suggest it has a high capacity for horizontal gene transfer and transmission45. From a human health risk perspective, it may be particularly relevant to target ARGs that confer resistance to last resort antibiotics, such as carbapenems, vancomycin or colistin4. Many of these genes are currently not abundant in environmental samples, which may present a challenge for environmental monitoring13. It has also been proposed to monitor the diversity of ARGs, as a high ARG diversity would be associated with a larger set of genes that could potentially be transferred to pathogens13, 46. Along the same lines, it is worth considering how well a certain ARG would predict the abundances of other ARGs in an environment, as it has been shown that some ARGs have better predictive power than others46.
Monitoring targets identified in the current study
We compared the list of genes identified in the present literature survey with proposed candidates for environmental monitoring from earlier studies (Table S5). Some of the identified ARGs are already common in routine clinical monitoring (e.g. https://www.oxfordbiosystems.com/AMR, https://www.opgen.com/acuitas/amr-gene-panel/), including clinically relevant β-lactamases such as blaCTX-M, blaTEM and blaSHV, the sulfonamide resistance gene sul1, the vancomycin resistance gene vanA, as well as ermB and tetM conferring resistance to macrolides and tetracyclines, respectively. These genes are already common both in the environment and among human pathogens, and therefore their usefulness in environmental monitoring is somewhat questionable. At the same time, they may function as a gauge of the total antibiotic resistance content in an environment, as some of them have been shown to be good predictors of the total resistome, particularly tetM and blaTEM46.
Considering the most common ARGs in our survey that are not yet included in routine clinical monitoring (Table 1) highlighted additional future monitoring targets, including the class 1 integrase intI1, which is already a widely used marker for anthropogenic AMR dissemination35. Despite that this gene is not a resistance gene itself, is often linked to ARGs and according to the existing literature it is widespread in the environment, found in both pathogenic and commensal bacteria, enriched by anthropogenic activities and correlates well with the abundances of other commonly occurring ARGs. This gene fulfills most of the criteria for being a suitable monitoring target, except perhaps that it is already so widespread (Figure 3; Figure S3) that it may not be able to sufficiently capture minor or long-term changes in the environment over time and space.
Similarly, the sulfonamide resistance gene sul2 has also been suggested as a monitoring target by Berendonk et al. (2015)4 and was among the most reported in our data and is widespread across all the environments. However, sul2 added little information compared to intI1 (Figure S4), so these two genes would be mostly redundant in AMR monitoring. In comparison, sul3 was not so often reported despite being rather abundant in the cases when it was looked for. According to previous studies, sul3 is typically less frequent and abundant than sul1 and sul247, 48. However, it has been shown to be associated with class 1 integrons and has been detected on a conjugative plasmid, suggesting its potential to be horizontally transferred and disseminated in the environment49. Interestingly, sul3 was first detected in an E. coli isolate from a pig, and it was later found in both healthy and diseased humans. Furthermore, it is enriched in polluted environments and is present in both commensal and pathogenic bacteria50. Overall, these three sul genes are good indicators of mobile antibiotic resistance, but may suffer from not being that predictive for total ARG abundance and diversity46, and their value for monitoring in addition to intI1 is somewhat doubtful.
The plasmid-mediated fluoroquinolone resistance gene qnrS was among the most reported genes in our study. It was found in all environments except manure and treated wastewater. As it is the only commonly reported fluoroquinolone ARG, it is an interesting target for monitoring. However, it has the drawback of generally not being able to induce clinically relevant levels of resistance without additional resistance mechanisms, which makes its clinical impact limited.
The list of most reported genes was dominated by tetracycline resistance genes. Among them, tetM was the third most often reported gene in the investigated studies, and has been previously proposed as a monitoring target and included in clinical screening4, 46. Tetracycline resistance genes are among the most powerful ARGs for predicting the diversity and abundance of other ARGs46 and therefore, despite their widespread distribution, these genes can still be useful in monitoring to extrapolate other parts of the resistome.
There were also several genes that were not often included in qPCR studies, but when they were, they often appeared in relatively high abundances. Such genes could be interesting additional monitoring targets in future AMR monitoring schemes. Among these genes was the vancomycin resistance gene vanA, a previously suggested indicator of antibiotic resistance contamination of clinical origin which is thought to be uncommon in the environment90. In our data, however, vanA has been about as abundant as other ARGs in the environment when it has been looked for. Another gene that seems to correlate with anthropogenic activities is ereA, a macrolide resistance gene which has previously been reported to be the most abundant in metal polluted soil103 and is enriched by long-term application of manure94. In contrast, the mexF gene has been reported from many different environments, including soil, sediments and water22 and is suggested to naturally occur in unaffected environments such as pristine Antarctic soils104, 105, indicating that it might be a useful target for identifying enrichment of environmental ARGs.
Specific uses of qPCR as a monitoring tool
In this study, we have exclusively focused on the use of qPCR as a tool for monitoring the abundance of ARGs in the environment. There are, however, other ways of measuring the levels of AMR, including selective culturing and metagenomic sequencing approaches. In this context, it is worth considering not only the appropriate targets for monitoring, but also which methods that give the most informative output in a cost-efficient manner. In general, the qPCR technique has several benefits, but also some drawbacks as a surveillance tool. An important advantage is that it is a highly sensitive method that can detect much lower levels of ARGs than is currently possible using shotgun metagenomic sequencing106. Furthermore, it can operate on very minute quantities of DNA, which makes it suitable also for low-biomass samples. In addition, as it operates on DNA, it will be able to detect ARGs in non-culturable bacteria and can function also on complex samples with many different species. On the other hand, qPCR does not provide any information about the genetic context of ARGs, such as whether they are chromosomal or mobile or if they are co-located with other ARGs. Similarly, it does not indicate which hosts carry a given ARG. Crucially, it is also restricted to a predetermined set of target ARGs (or other types of genes) which limits the reusability of the data. For example, when the mcr1 colistin resistance gene was discovered in 2015107, it very quickly was detected in archived metagenomic sequence data24, but such ‘retrospective monitoring’ would not be possible to perform using qPCR datasets. The limiting factor of predefined targets can be partially overcome by using qPCR arrays with hundreds of genes15, but this also comes with increased costs and may not be feasible for large-scale routine monitoring of environmental AMR. In addition, the technique would say close to nothing about emerging ARGs that may become the next generation resistance threats in human pathogens10, which makes qPCR-based monitoring practically useless as an early-warning system for emerging resistance, unless a panel of potential future ARGs is screened for. That said, qPCR clearly has its uses in monitoring for transmission of known high-risk ARGs via the environment, where it can provide relatively quick data on specific deviations from the normal background levels.
A more fundamental aspect of such deviations is whether an increase in the abundance of ARGs or mobile genetic elements in a particular environment or at a specific time point is a relevant indicator of a selective pressure for resistance. Importantly, an increase of ARG abundances without any context is more likely to be an indicator of human pollution36, but it cannot be ruled out that such a change could be due to a specific selection pressure from antibiotics108, by co-selection from other antibacterial compounds109, or simply from taxonomic shifts that are unrelated to antibiotic resistance. In the end, the suitability of qPCR for environmental AMR surveillance comes down to the purpose of monitoring and what type of actions one might want to take based on the monitoring results. If transmission of known high-risk ARGs is the sole purpose of monitoring, qPCR is an excellent method thanks to its sensitivity. However, if identification of emergent resistance threats is the goal, qPCR is unlikely to give useful guidance; instead, shotgun metagenomics or selective culturing followed with genetic profiling would provide more useful information.
Outcomes and recommendations
In this study, we performed a literature survey to explore the abundance and prevalence of ARGs in various environments as quantified by qPCR. We found that, overall, previous suggestions for ARGs to be included in environmental AMR monitoring4, 46 seem relevant. Particularly, inclusion of the intI1, sul1, blaTEM, blaCTX-M and qnrS genes in environmental monitoring seems essential, along with a selection of the tetracycline genes tetM (but not tetG), tetQ, tetW, tetC, and either of tetA or tetO. However, there are also genes that are not often looked for in qPCR surveys that perhaps should be, including sul3, vanA, tetH, aadA2, floR, ereA and mexF. These genes are abundant in some environments, but were not often included in qPCR studies of environmental AMR. We also provide environmental baseline levels for the ARGs studied through qPCR (Figure 5; Figure S3); for most ARGs the typical abundance falls in an interval from 10-5 to 10-3. It should be noted that this is the range of normal abundances of ARGs, and should not be considered a maximum acceptable limit of these ARGs in any given environment. Such maximum acceptable levels need to be determined taking risks to human health (and potentially the environment) into account5, 110, and would also need to consider transmission routes to humans11. The absence of clear trends of increases or decreases in ARG abundances over time indicates a need for more systematic time series data on ARG abundances in a variety of environments. Our results also highlight the scarcity of AMR data from parts of the world, particularly from Africa and South America, and underscores the need for a concerted effort to quantify typical background levels of AMR in the environment more broadly to enable efficient environmental AMR surveillance schemes akin to those that exist in clinical settings.
Supplementary Figures and Tables


The data points are the abundances of ARGs in samples from each country and the lines are fitted to the maximum abundance values.

Environments with less than 30 samples have been excluded from the figure.
A is the probability that a sample is in the target group (=environment) and B is the probability that you will find the gene in a sample that belongs to this specific environment. Stat is the Indicator value is maximum (i.e. 1) when all occurrences of a gene are found in a single environment and in all samples of this environment.
Genes in red are already included into clinical monitoring schemes.
Acknowledgments
JBP acknowledges funding from the Swedish Research Council (VR; grant 2019-00299) under the frame of JPI AMR (EMBARK; JPIAMR2019-109), the Centre for Antibiotic Resistance Research at the University of Gothenburg, the Sahlgrenska Academy at the University of Gothenburg, and the Swedish Cancer and Allergy fund (Cancer-och Allergifonden). TUB acknowledges funding of the JPI AMR – EMBARK project funded by the Bundesministerium für Bildung, und Forschung (BMBF) under grant number F01KI1909A. We would like to thank Emil Burman, Sebastian Wettersten and Tora Hulterström for constructive feedback on the manuscript.
References
- 1.↵
- 2.↵
- 3.↵
- 4.↵
- 5.↵
- 6.↵
- 7.
- 8.↵
- 9.↵
- 10.↵
- 11.↵
- 12.↵
- 13.↵
- 14.↵
- 15.↵
- 16.↵
- 17.↵
- 18.↵
- 19.↵
- 20.↵
- 21.↵
- 22.↵
- 23.
- 24.↵
- 25.↵
- 26.↵
- 27.↵
- 28.↵
- 29.↵
- 30.↵
- 31.↵
- 32.↵
- 33.↵
- 34.↵
- 35.↵
- 36.↵
- 37.↵
- 38.↵
- 39.
- 40.↵
- 41.↵
- 42.↵
- 43.↵
- 44.↵
- 45.↵
- 46.↵
- 47.↵
- 48.↵
- 49.↵
- 50.↵
- 51.
- 52.
- 53.
- 54.
- 55.
- 56.
- 57.
- 58.
- 59.
- 60.
- 61.
- 62.
- 63.
- 64.
- 65.
- 66.
- 67.
- 68.
- 69.
- 70.
- 71.
- 72.
- 73.
- 74.
- 75.
- 76.
- 77.
- 78.
- 79.
- 80.
- 81.
- 82.
- 83.
- 84.
- 85.
- 86.
- 87.
- 88.
- 89.
- 90.↵
- 91.
- 92.
- 93.
- 94.↵
- 95.
- 96.
- 97.
- 98.
- 99.
- 100.
- 101.
- 102.
- 103.↵
- 104.↵
- 105.↵
- 106.↵
- 107.↵
- 108.↵
- 109.↵
- 110.↵


