

Abstract
The estrous cycle is regulated by rhythmic endocrine interactions of the nervous and reproductive systems, which coordinate the hormonal and ovulatory functions of the ovary. Folliculogenesis and follicle progression require the orchestrated response of a variety of cell types to allow the maturation of the follicle and its sequela, ovulation, corpus luteum (CL) formation, and ovulatory wound repair. Little is known about the cell state dynamics of the ovary during the estrous cycle, and the paracrine factors that help coordinate this process. Herein we used single-cell RNA sequencing to evaluate the transcriptome of > 34,000 cells of the adult mouse ovary and describe the transcriptional changes that occur across the normal estrous cycle and other reproductive states to build a comprehensive dynamic atlas of murine ovarian cell types and states.
Introduction
The ovary is composed of a variety of cell types which govern the dynamic functions of the ovary as both an endocrine organ capable of producing hormones such as sex steroids, and a reproductive organ orchestrating follicular development, from a quiescent follicle until its ultimate ovulation. This process necessitates precise coordination of germ cells and several different somatic cell types, including granulosa cells, thecal cells, and stromal cells to support the growth of oocytes and their release, to produce the necessary hormonal cues, as well as coordinate the profound tissue remodeling to accommodate these dynamic developing structures. Furthermore, the state of each of these cells changes over the course of the estrous cycle in a coordinated fashion to regulate waves of follicle growth and maturation, to time ovulation precisely, and to provide hormonal support of potential pregnancy.
Single cell RNA sequencing has been used in a variety of tissues to obtain an in-depth understanding of gene expression and cellular diversity. In the ovary, this technique has allowed us and others to explore various physiologic processes during early ovarian development and ovarian aging (Zhao et al. 2020; Stévant et al. 2019; Wagner et al. 2020; Niu and Spradling 2020; Jevitt et al. 2020; Man et al. 2020; Meinsohn et al. 2021; Fan et al. 2019; Si Wang et al. 2020). For example, Fan et al. catalogued the transcriptomic changes that occur during follicular development and regression and mapped the cell types of the human ovary using surgical specimens (Fan et al. 2019). A primate model has been used to investigate changes in cell types and states that occur in the ovary with aging (Si Wang et al. 2020). Zhao et al. looked at the development of the follicle during early embryonic ovarian development to discern the relationship of oocytes to their support cells in formation of follicles (Zhao et al. 2020). We have used scRNAseq to identify inhibitory pathways regulated by AMH during the first wave of follicular growth in the murine ovary (Meinsohn et al. 2021). While all these studies have helped to establish a framework to understand the major cell types in the ovary, it is important to describe the dynamic nature of cell states across the estrous cycle at the single cell level.
To understand more fully the effect of cyclic endocrine, autocrine, and paracrine signals on ovarian cell states we performed high-throughput single cell RNA sequencing of ovaries from adult mice across a physiological spectrum of reproductive states. Ovaries were harvested from mice in the four phases of the normal estrous cycle: proestrus, estrus, metestrus, and diestrus. Additionally, ovaries were evaluated from mice that were lactating or non-lactating 10 days postpartum mice, and from randomly cycling adult mice. Herein, we describe the somatic cell types of the ovary and their cycling states using single-cell transcriptomics. Furthermore, we uncovered previously unrecognized complexity in the cellular subtypes and their cyclic expression states which allowed us to identify secreted factors that vary across the estrous cycle and therefore represent potential marker for staging.
Methods
Mice
Animal experiments were carried out in 6-8 weeks old C57BL/6 mice obtained from Charles River Laboratory, approved by the National Institute of Health and Harvard Medical School Institutional Animal Care and Use Committee, and performed in accordance with experimental protocols 2009N000033 and 2014N000275 approved by the Massachusetts General Hospital Institutional Animal Care and Use Committee.
For the analysis of transcriptional changes in ovaries of cycling mice, animals were housed in standard conditions (12/12 hours light/dark non-inverting cycle with food and water ad libitum) in groups of 5 with added bedding from a cage that previously housed an adult male mouse to encourage cycling. Estrous stage was determined by observation of the vaginal opening and by vaginal swabs done at the same time daily, as previously described (Kano et al. 2017). Each mouse was monitored for a minimum of 2 weeks to ensure its cyclicity. Four mice were sacrificed in each of the 4 phases of the estrous cycle and labeled as being from experimental batch “cycling”. An additional 8 mice were included in the analysis and labeled as being from experimental batch “lactating”. Four of these mice were lactating at day 10 postpartum and four were 10 days postpartum with pups removed at delivery. Four additional mice were not monitored for cycling and included to increase sample diversity.
Additional mice were monitored throughout the estrous cycle, to collect ovaries at each stage (groups of N=5 for proestrus, estrus, metestrus, diestrus) for gene validation. Pairs of dissected ovaries were used to extract mRNA for qPCR for one while the other was fixed in 4% paraformaldehyde for RNAish (RNAscope) or immunohistochemistry to validate gene expression.
Superovulation
To stimulate superovulation, mature female mice (6-9 weeks C57BL/6) were injected IP with 5 IU of pregnant mare serum gonadotropin (PMSG) (Calbiochem, San Diego, CA), followed 48 hours later by 5 IU of human chorionic gonadotropin (hCG; Millipore Sigma, St. Louis, MO). The mice were euthanized 8 hours after hCG treatment and ovaries harvested.
Staging of estrous cycle by vaginal cytology
As previously described (Byers et al. 2012; Kano et al. 2017), staging of mice was performed using a wet cotton swab, introduced into the vaginal orifice then smeared onto a glass slide which was air-dried, stained with Giemsa, and scored for cytology by two independent observers. Briefly, proestrus was determined if the smear showed a preponderance of nucleated epithelial cells as well as leukocytes. Estrous was marked by an abundance of cornified epithelial cells, while metestrous smears contained a mixture of cornified epithelial cells and leukocytes. Finally, diestrus was characterized by abundant leukocytes with low numbers of cornified epithelium or nucleated epithelial cells.
Generation of single cell suspension
Single cell suspension from mouse ovaries were obtained as previously described with uterine enzymatic dissociation (Saatcioglu et al. 2019). Briefly, ovaries were incubated for 30min at 34C in dissociation medium (82 mM Na2SO4, 30 mM K2SO4, 10 mM Glucose, 10 mM HEPES, and 5 mM MgCL2, pH 7.4) containing 15 mg of Protease XXIII (Worthington), 100 U Papain, with 5 mm L-Cysteine, 2.5 mM EDTA (Worthington) and 1333 U of DNase 1 (Worthington). The reaction was then stopped in cold medium, and samples were mechanically dissociated, filtrated, and spun down three times before being resuspended to a concentration of 150,000 cells/mL in 20% Optiprep (Sigma) for inDrop sorting.
Single-cell RNA sequencing (inDrops)
Fluidic sorting was performed using the inDrop platform at the Single Cell Core facility at Harvard Medical School as previously described (Klein et al., 2015, Macosko et al., 2015). We generated libraries of approximately 1500 cells per animal which were sequenced using the NextSeq500 (Illumina) platform. Transcripts were processed according to a previously published pipeline (Klein et al., 2015) used to build a custom transcriptome from the Ensemble GRCm38 genome and GRCm38.84 annotation using Bowtie 1.1.1. Unique molecular identifiers (UMIs) were used to reference sequence reads back to individual captured molecules, referred to as UMIFM counts. All steps of the pipeline were run using default parameters unless explicitly specified.
Single-cell RNAseq data analysis
Data processing
The initial Seurat object was created using thresholds to identify putative cells (unique cell barcodes) with the following parameters: 1000-20000 unique molecular identifiers, 500-5000 genes, and less than 15% mitochondrial genes. The final merged dataset contained ~70000 cells which were clustered based on expression of marker genes. These were further processed in several ways to exclude low-quality data and potential doublets. Markers for each level of cluster were identified using MAST in Seurat.
Volcano Plots
Highly differentially expressed genes between different estrous cycles were identified using the function FindMarkers in Seurat. Volcano plots were generated using ggplot2 package in R.
Pathway Enrichment Analysis
Differentially expressed genes with at least two-fold changes between contiguous estrous stages were used as input for Gene Ontology Enrichment Analysis by clusterProfiler. Enrichplot package was used for visualization. Biological process sub-ontology was chosen for this analysis.
Pseudotime analysis
Subsets of the granulosa cluster from preantral to corpus luteum (CL) stages and mesenchyme cluter were extracted and a CellDataSet object was constructed by Monocle (version 2.14.0) (Trapnell et al. 2014). The ordering genes were selected using differentially expressed markers between clusters, obtained by “FindAllMarkers” function in Seurat and imported into Monocle. The following steps of reducing data dimensionality and ordering cells along the trajectory were carried out using “reduceDimension” and “orderCells” functions, respectively. The root state was set based on the prior biological knowledge of developmental stages. Heatmap representing the transcriptomic progression of dynamic genes in the cell lineages of mesenchyme and granulosa clusters through the pseudotime was constructed including early cells common to both lineages are located in the center (Prebranch) of the map, with divergence to two different cell fates to the sides.
Principal component analysis (PCA)
PCA was used to identify common patterns of gene expression across stages of the cycle. For each Level0 cluster object, cycling cells were extracted and genes that were expressed in more than 5% of cells were identified. The expression of these genes in the cycling cells were scaled (set to mean zero, standard deviation 1) and averaged across each of the 4 cycle stages. PCA was run (prcomp) on the average scaled expression data.
Data availability
The scRNAseq count matrix dataset was deposited in OSF (Pepin 2022).
In situ hybridization and immunohistochemistry
In situ hybridizations were done using kits from ACDBio as per manufacturer’s protocol and previously described (Saatcioglu et al., 2019). Briefly, RNAish was performed with the RNAscope® 2.5 HD Reagent Kit (RED, ACD Bio, # 322350; Duplex, ACD Bio, # 322500). Following deparaffinization in xylene, dehydration, peroxidase blocking, and heat-induced epitope retrieval by the target retrieval and protease plus reagents (ACD bio, #322330), tissue sections were hybridized with probes for the target genes (see Table S1 for accession number, target region, and catalog number of each gene) in the HybEZ hybridization oven (ACD Bio) for 2 hours at 40°C. The slides were then processed for standard signal amplification steps, and chromogen development. Slides were counterstained in 50% hematoxylin (Dako, #S2302), air dried, and cover slipped with EcoMount. In addition to cycling and noncycling mice, superovulated mice were used in some circumstances to specify transcripts from follicles associated with LH surge response and from pre-ovulatory follicles at the estrous stage.
To combine RNAish staining with immunohistochemistry to identify smooth muscle actin protein, we first processed the tissue section for RNAscope as described above, including deparafinazation, antigen retrieval, hybridization and chromogen development. Sections were then blocked in 3% bovine serum albumin (BSA) in Tris-buffered solution (TBS) for 1 hr. Following 3 washes with TBS, the sections were incubated with a smooth muscle actin primary antibody (SMA) (1:300, Abcam) overnight at 4°C and developed with Dako EnVision + System horseradish peroxidase (HRP). Labeled Polymer Anti-Rabbit was used as the secondary antibody, and the HRP signal was detected using the DAKO detection system. Slides were then counterstained in hematoxylin and mounted as described above.
RT-qPCR
Mice were monitored through the estrous cycle and sacrificed at specific stage/time-points as described above. Ovaries were dissected and total RNA was extracted using the Qiagen RNA extraction kit (Qiagen, # 74106). A cDNA library was synthesized from 500 ng total RNA using SuperScript III First-Strand Synthesis System for RT-PCR (manufacturer’s instructions using random hexamers (Invitrogen, # 18080–051). The primers used for this study are described in Table S2. Expression levels were normalized to the Gapdh transcript using cycle threshold (Ct) values logarithmically transformed by the 2-ΔCt function.
ELISA
Blood was collected from mice by facial vein puncture, incubated at RT until spontaneously clotted, centrifuged at 8000rpm for 5min to collect the serum layer, and diluted 1/10 in each ELISA kit according to the manufacturing protocol; Mouse CNP/NPPC ELISA kit (ref: NBP2-75790); Mouse serine protease inactive 35 (PRSS35) ELISA kit (ref: MBS9717242); Mouse TINAGL1 / Lipocalin 7 ELISA kit (ref: LS-F49684); and Human/Mouse/Rat Activin A Quantikine ELISA Kit (ref: DAC00B).
Results
scRNA-seq of adult mouse ovaries across reproductive states
For single cell RNA sequencing we isolated the ovaries of 4 mice per group representing a range of physiological reproductive states of sexually mature females including cycling (proestrus, estrus, metestrus, diestrus), post-partum (day 10 post-partum non-lactating), lactating (day 10 postpartum lactating), and non-monitored mice to increase sample diversity. Following enzymatic digestion of those ovaries, we generated a single cell suspension and sorted by microfluidics with the inDROP methodology (Klein et al. 2015), targeting 1500 cells per animal, and resulting libraries were indexed, combined, and sequenced together (Fig 1A).

Single cell RNA sequencing of mouse cycling ovaries. A. Schematic of the pipeline applied to single cell sequencing experiment. B. T-SNE plot featuring the different cell clusters of the ovary. C. Heatmap presenting the top 10 markers of each cluster.
Following dimensionality reduction and clustering we identified multiple clusters which could be combined to represent the major cell categories of the ovary (Fig 1B). To assign cell type identity we used cluster-specific markers which were previously described in other studies or newly identified makers later validated by RNA in situ (Table S3). The major clusters were composed of granulosa (N=17627 cells) and mesenchymal cells composing the ovarian stroma (N=10825 cells). Many other minor cell types were identified including endothelial cells (N= 3501 cells), ovarian surface epithelial cells (N=1088 cells), immune cells (N=1649 cells), and oocytes (N=22 cells). The latter were poorly represented in the dataset possibly due to cell size exclusion limitations of the technique, thus they are likely limited to small oocytes of primordial follicles (Fig 1B). The heatmap of marker gene expression across the major categories of cell types and states is represented in Fig 1C.
Single cell sequencing reveals heterogeneity within granulosa and mesenchymal cell clusters
Mesenchyme
The mesenchymal cluster is the second largest identified in our analysis after the granulosa cell cluster. Based on prior studies (Fan et al. 2019; Si Wang et al. 2020a) we were able to further subcluster these mesenchymal cells into three groups of theca: theca 1 (17%), theca 2 (16%), and thecal smooth muscle cells (9%). Furthermore, we identified two stromal groups: stroma 1 (12%) and stroma 2 (31%), in addition to pericytes (6%), and dividing mesenchyme (8%) as seen in Fig 2A, with the top 20 expressed markers of each cluster described in Table S4.

Identification of the different cell types in the mesenchyme cluster A. T-SNE plot featuring the different cell subclusters belonging to the mesenchyme cluster. B. Heatmap presenting the top 5 markers of each cluster. C. Confirmation of each mesenchyme cluster with t-SNE-plots and RNA in situ hybridization
Distinct transcriptional signatures were identified in the mesenchymal subclusters (Fig 2B), from which we prioritized positive markers to validate based on highest fold-change expression, highest differential percent expression, and lowest P-value (Fig 2C).
Theca 1 cells could be defined by their expression of Small Cell Lung Carcinoma Cluster 4 Antigen (Cd24a) and Hedgehog Interacting Protein (Hhip); meanwhile, theca 2 cells were identified by their expression of Cytochrome P450 Family 17 Subfamily A Member 1 (Cyp17a1) suggesting they correspond to mature steroidogenic theca. Theca externa was confirmed to express Microfibril Associated Protein 5 (Mfap5) specifically by RNA in situ hybridization (Fig 2C). Furthermore, we observed co-localization of Mfap5 and Actin Alpha 2 (Acta2, also known as smooth muscle actin) in theca externa whereas Hhip was expressed in theca interna and immature theca (Fig S2A, B). Stroma 1 and stroma 2 compartments were validated by their expression of Ectonucleotide Pyrophosphatase/Phosphodiesterase 2 (Enpp2) and Potassium Two Pore Domain Channel Subfamily K Member 2 (Kcnk2), respectively, and overlapped in distribution in both cortical and medullary regions of the ovarian stroma (Fig 2C).

Co-localization of smooth muscle marker Acta2 with Hhip and Mfap5
Feature plots (A.) showing colocalization of Acta2 and Hhip in the smooth muscle cluster and expression of Mfap5 localized in the cluster theca 2, both confirmed by in situ hybridization/ IHC (B.)
Granulosa
To explore further the cellular heterogeneity of developing follicles, we investigated the granulosa cell compartment. Consistent with previous reports, we could distinguish granulosa cells of follicles based on their stage of development (Gallardo et al. 2007; Fan et al. 2019; Zhao et al. 2020). Granulosa cells could be subdivided into 8 main categories: pre-antral/cumulus (27%), antral/mural (25%), periovulatory (5%), atretic (17%), mitotic (16%), and three clusters of corpus luteum: CL1 (2%), CL2 (4%), and CL3 (4%) (Fig 3A). Table S5 lists the top twenty markers for each of these clusters. Distinctive gene expression programs were identified in the granulosa cell subclusters, as visualized in the heatmap (Fig 3B), from which we selected potential markers for validation.

Identification of the different cell types in granulosa cluster A. T-SNE plot featuring the different cell subclusters belonging to the granulosa cluster. B. Heatmap presenting the top 5 markers of each cluster. C. Confirmation of each granulosa cell cluster with RNA in situ hybridization
Early pre-antral granulosa cells, and those constituting the cumulus of antral follicles, could be defined by their shared expression of markers such as potassium channel tetramerization domain (Kctd14) (Fig 3C). In contrast, expression of Male-specific Transcription in the developing Reproductive Organs (MRO) was found specifically in mural granulosa cells of antral follicles (Fig 3C). Periovulatory follicles could be characterized by their specific expression of the RUNX1 family transcription factor 1 (Runx1) (Fig 3C). Furthermore, we identified three different clusters that we speculate represent cells/states of the corpus luteum, CL-1, CL-2, CL-3, which all expressed One Cut Homeobox 2 (Onecut2). Finally, two relatively abundant granulosa cell states could be identified based on marker expression, namely mitotic granulosa cells expressing topoisomerase 2a (Top2a), and putative atretic cells expressing markers consistent with follicular atresia including expression of the growth hormone receptor (Ghr) (Fig3 C).
Pseudotime analysis reveals differentiation lineages in mesenchyme and granulosa cell subtypes
To examine the relationship between subpopulations of granulosa and mesenchyme cells, we performed pseudotime trajectory analysis using the Monocle algorithm (Trapnell et al. 2014). In the mesenchyme we included the theca 1 & 2, stroma 1&2, and smooth muscle clusters (Fig4 A, B, C), but omitted the pericytes. For granulosa cells we included preantral/cumulus, antral/mural, periovulatory, and corpus luteum clusters CL1-3, (Fig 4 D, E, F), but omitted the mitotic and atretic clusters. In both cases, the analysis revealed 3 states and 1 branch point (Fig 4). In the mesenchyme subclusters, three “states” were identified as marking the segment of the trajectory tree in Monocle; the trajectory’s root was constituted primarily from cells from both stroma 1&2 clusters. At the branch point, stromal cells were ordered in one branch while both theca clusters and smooth muscle were ordered on other branches (Fig 4 A, B) suggesting these are distinct and non-overlapping differentiation programs that may be activated in either stroma 1 or stroma 2 and supporting the notion that theca 1 (immature) represents a precursor to theca 2 (steroidogenic) (Fig 4C). For the granulosa cell subclusters the trajectory’s root was constituted of preantral granulosa, and at the branching point, there we two cell fates: either cumulus and antral/mural granulosa ordered on one branch or the three different corpus luteum clusters (CL1-3) and the periovulatory cluster ordered on another branch (Fig 4 D,E). This branching pattern supports the notion that the cumulus state is a continuation of the early preantral granulosa program, while the distinct branching fate of periovulatory and CL2 represents a continuum of differentiation states corresponding to the LH-response in granulosa cells and induction of the luteinizing program (Fig 4F). Heatmaps were constructed to represent the transcriptomic progression of dynamic genes in the cell lineage of mesenchyme (Fig S4 A) and granulosa cells (Fig S4B) clusters through pseudotime.

Heatmap representing the transcriptomic progression of dynamic genes in the cell lineages of mesenchyme (A) and granulosa (B) clusters through the pseudotime. Early cells common to both lineages are located in the center (Prebranch) of the map, with divergence to two different cell fates to the sides.

Constructing single cell resolution trajectory of mesenchyme (A-C) and granulosa clusters (D-F). A-C) Pseudo-temporal trajectory colored by cell types (A) and the splitting of each group on the trajectory (B) of mesenchyme cluster, illustrated by a diagram of their developmental progression (C). D-F) Pseudo-temporal trajectory colored by cell types (D) and the splitting of each group on the trajectory (E) of granulosa cluster, illustrated by a diagram of their developmental progression (F).
Granulosa cells transcriptome varies most between proestrous and estrous stages
We then focused on the granulosa cell cluster to identify the cell states associated with the stage of the estrous cycle. When comparing the composition of granulosa cell subclusters by estrous stage, we found that some clusters were dominated by cells from either the proestrous and estrous ovaries, particularly the clusters corresponding to “antral/mural” and “periovulatory” clusters respectively (Fig 5A). A volcano plot analysis confirmed that the transition between these two stages was characterized by 22 significantly upregulated and 4 significantly downregulated markers (Fig 5B), which represent a bigger population of differentially regulated genes than those found at any other stage transition i.e., estrus to metestrus, metestrus to diestrus, and diestrus to proestrus (Fig S5A, B, C). Gene ontology analysis revealed that the most significantly differentially regulated pathways between the proestrous and estrous states were ovarian matrix remodeling related processes and steroidogenesis and hormones production (Fig 5C). Whole ovary qPCR validated these significant changes in expression at the proestrus to estrus transition in markers involved in steroidogenesis, such as, Cytochrome P450 Family 19 Subfamily A Member 1 (Cyp19a1, p=0.0029, proestrus to estrus), Steroidogenic Acute Regulatory Protein (Star, p=0.0187, proestrus to estrus) or Prosaposin (Psap, p=0.0026, proestrus to estrus), as well as matrix remodeling processes such as Regulator Of Cell Cycle (Rgcc, p=0.0441, proestrus to estrus), Glutamate-Ammonia Ligase (Glul) and Inhibitor Of DNA Binding 2 (Id2, p=0.0032, proestrus to metestrus) (Fig 5D), and immediate early genes, Fos Proto-Oncogene (Fos), Jun Proto-Oncogene (Jun, p=0.0022, proestrus to estrus), Jun Proto-Oncogene B (Junb, p=0.0069, proestrus to diestrus) and Early Growth Response 1 (Egr1, p=0.0504 estrus to diestrus), involved in wound repair following ovulation (Fig S5D).

Estrus to Proestrus transition shows more genes dysregulated that any other stages A. Volcano plot showing the genes differentially expressed between estrous and metestrous stages. B. Volcano plot showing the genes differentially expressed between metestrous and diestrous stages. C. Volcano plot showing the genes differentially expressed between diestrous and proestrous stages. D. T-SNE plot featuring the ovarian surface epithelium (OSE) cells depending on the stage of the estrous cycle. E. QPCR validation of ovarian surface epithelium expressed markers (n=5 per group, mean ± SEM, *P<0.05, **P<0.01, ****P<0.001).

Figure 4: Granulosa cell expressed genes vary in an estrous cycle dependent manner A. T-SNE plot featuring the different estrous cycle stages in granulosa cell cluster. B. Volcano plot showing the genes differentially expressed between proestrus and estrous stages. C. Left - Pathway analysis reveals enriched pathways of differentially expressed genes (DEG) between the different stages of the estrous cycle. The x-axis shows the gene ratio (the percentage of total DEGs in the given GO terms). “Count”, reflected by the dot size, represents the number of genes enriched in a GO term and dot color represents the adjusted p values. Right – Gene networks of selected pathways are shown. Node size represents the number of genes enriched in each pathway. Dot color, as shown in “fold change” color, indicates if the gene is upregulated or downregulated. GO, Gene ontology; BP, Biological Process. D. QPCR validation of matrix remodeling and steroidogenesis related markers (n=5 per group, mean ± SEM, *P<0.05, **P<0.01, ***P<0.005, ****P<0.001).
Identification and validation of secreted biomarkers varying throughout the estrous cycle
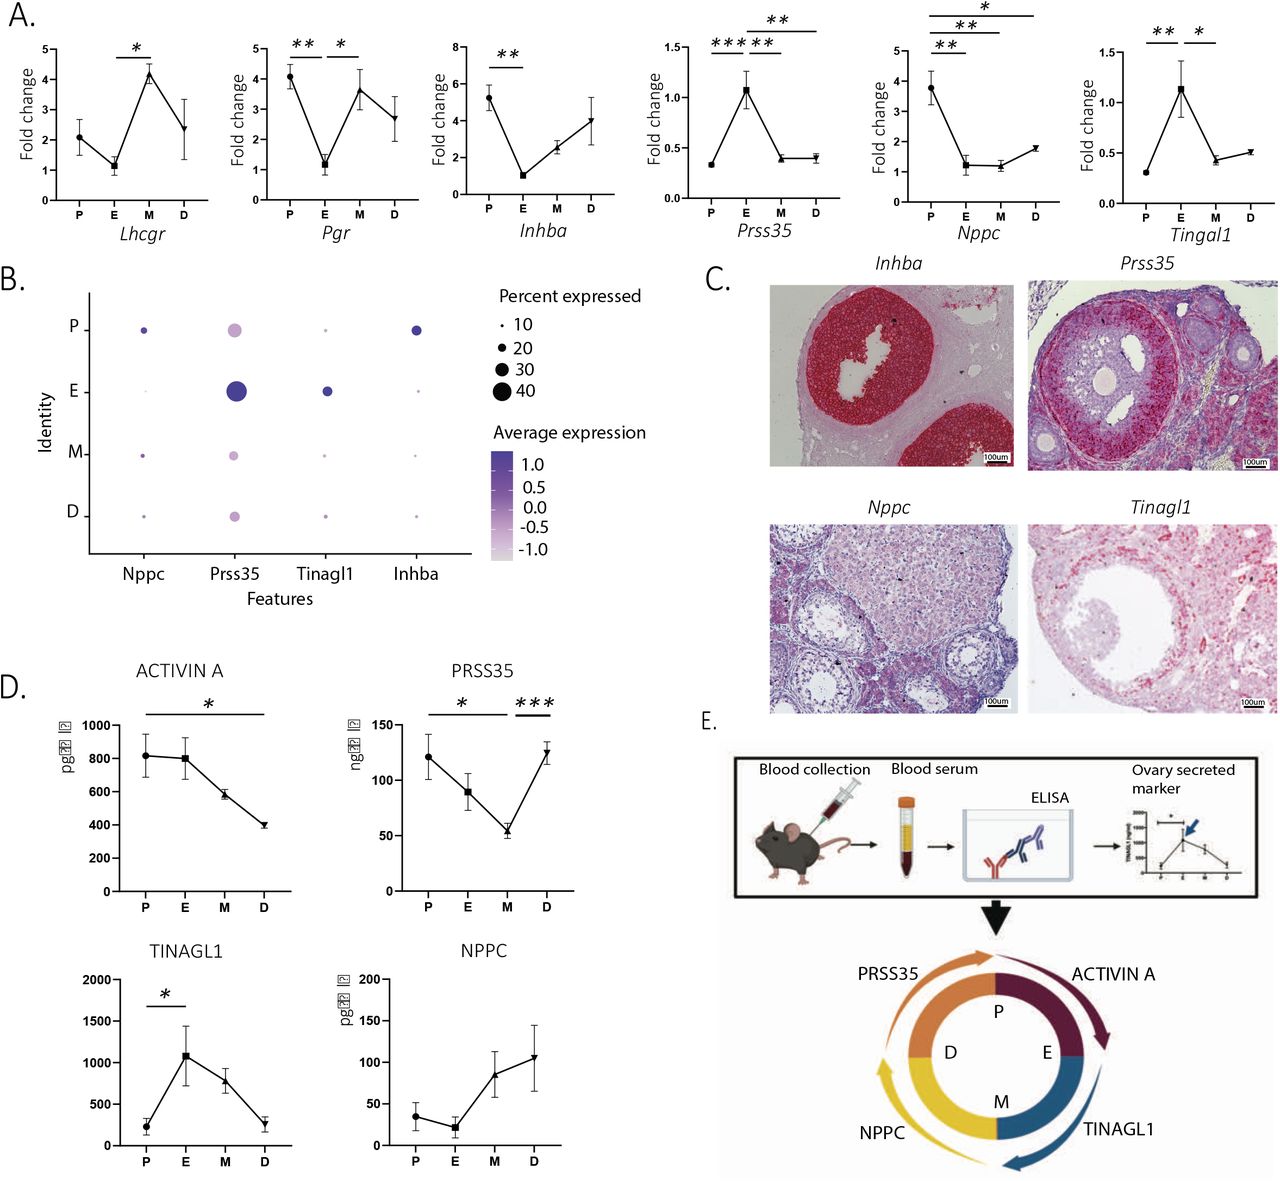
To identify new biomarkers varying as a function of the estrous cycle that could be used for staging in assisted reproduction and other applications in reproductive medicine, we focused on secreted factors that could be therefore readily detectable in the blood and expressed mostly in the granulosa cell or ovarian mesenchyme clusters to provide tissue specificity. We confirmed our ability to detect gene expression changes during the cycle using whole ovary qPCR analysis in a sperate set of staged mice (N=4 per group), with the well-described markers, Luteinizing Hormone/Choriogonadotropin Receptor (Lhcgr, p=0.0281 etrus to metestrus) and progesterone receptor (Pgr, p=0.0096, proestrus to estrus) (Fig 6A). Most prominently we identified within our scRNAseq dataset, natriuretic peptide C (Nppc) and Inhibin A (Inhba), as secreted markers that were significantly upregulated in the proestrous stage compared to the estrous stage in the scRNAseq dataset (Fig 6B), which we validated by qPCR (Nppc, p=0.0022 proestrus to estrus, Inhba, p= 0.0067, proestrus to estrus) (Fig 6A). Similarly, Tubulointerstitial Nephritis Antigen Like 1 (Tinagl1) and Serine Protease 35 (Prss35) were secreted markers significantly upregulated in estrous compared to their level of transcription in proestrus in the scRNAseq dataset (Fig 6B), and by qPCR (Tinagl1 p=0.0081 proestrus to estrus, Prss35 p=0.0008 proestrus to estrus) (Fig 6A). In situ RNA hybridization showed, as expected, that these markers were mostly expressed in mural granulosa cells of antral follicles, while Nppc was expressed in both mural and cumulus cells (Fig 6C). Finally, we sought to quantify the abundance of secreted PRSS35, NPPCC, TINAGL1 and ACTIVIN A proteins in the serum of staged mice by ELISA (Fig 6D). We found that ACTIVIN A concentration in serum was significantly increased between the diestrous and proestrous stages (p=0.0312) and peaked at the proestrous stage (Fig 6D), similar to the Inhba transcript which encodes for the ACTIVIN A beta subunit (Fig 6A), although unlike the mRNA the protein remained elevated during the estrous stage (Fig 6D). Circulating PRSS35 levels were lowest at the metestrous stage and were significantly increased during the transition to diestrus (p=0.0009) and remained significantly elevated until the proestrus (Fig 6D), which contrasts with the Prss35 transcript which was significantly induced at estrus (Fig 6A). The serum concentrations of TINAGL1 which was lowest at the diestrous and proestrous stages, was significantly increased during the transition between proestrus and metestrus, peaking in estrus (p=0.0142) (Fig 6D), which coincided with the transcriptional pattern observed by qPCR and scRNAseq (Fig 6A, 6B). We observed a trend for serum protein concentrations of NPPC to be lowest at the proestrous and estrous stages and increase during the metestrous and diestrous stages (Fig 6D), although the differences were not statistically significant (p=0.0889, estrus to metestrus). Importantly, these four markers could help identify the four different stages of the estrous cycle when measured in conjunction in the blood (Fig 6E).

Figure 5: New secreted markers estrous cycle dependent. A. qPCR showing significant up and downregulation of ovarian secreted markers depending on the stage of the estrous cycle (n=5 per group, mean ± SEM, *P<0.05, **P<0.01, ***P<0.005). B. Expression levels and percentages of ovary secreted markers in granulosa cells based on the different stages of the estrous cycle. C. In situ hybridization (RNAscope) of the same markers. D. Quantification of blood circulating proteins by ELISA (n=5 per group, mean ± SEM, *P<0.05, ***P<0.005). E. Summary of the ELISA results.
Discussion
Single cell RNA sequencing has been used to catalog the transcriptomes of a variety of tissues in several species, across different physiological states (Hwang, Lee, and Bang 2018). Herein, we used scRNAseq to catalog the cellular diversity and the changing cell states of the mouse ovary across the estrous cycle and other reproductive states. In particular, we described the diversity of cell types and cell states of the ovarian granulosa and mesenchymal cell subtypes, identified marker genes and cycling states for these cells, and evaluated secreted markers for assessment of cyclic stages which may have utility for assisted reproduction.
Given our focus on estrous cycle states, and the importance of granulosa cells in cyclic follicle maturation and hormone production, it is unsurprising that this cluster was the most variable in gene expression and contained the highest subclustering complexity. Some of this subclustering reflected transcriptomic changes associated with estrous cycling; indeed, while most of the granulosa subclusters contained similar amounts of cells from the proestrus, metestrus, and diestrus samples, others such as the “peri-ovulatory granulosa” cluster were dominant in one stage (in this case “estrus”). Genes enriched in this cluster had been previously reported to be involved in the ovulatory process and regulated by the LH surge, including markers of terminal differentiation and steroidogenesis such as Smarca1 (Lazzaro et al. 2006), Cyp11a1 (H. F. Irving-Rodgers et al. 2009) and Mt1 and Mt2 (Shujuan Wang et al. 2018). Other genes enriched in this subcluster such as Prss35 (Wahlberg et al. 2008) and Adamts1(Lussier et al. 2017; Sayasith, Lussier, and Sirois 2013) had been previously identified as involved in follicular rupture which is a process necessary for ovulation during estrus.
While the ovulatory antral follicle is unique to the estrous stage, most other follicle types can be found at all estrous cycle stages, albeit in varying numbers. Early pre-antral follicles numbers are relatively stable across the estrous cycle (Deb et al. 2013), given that they are largely unresponsive to gonadotropins (J. S. Richards 1980), in contrast antral follicle numbers and size are more variable (Deb et al. 2013). Some markers were unique to preantral follicles, as previously noted by others, including Col18a1 (Melo et al. 2017; Helen F. Irving-Rodgers et al. 2010; Diaz, Sugiura, and Eppig 2008) and Wnt4 (Hsieh et al. 2002). The antral granulosa subcluster could be identified by its expression of Inha as previously described (Chen et al. 2009; Wigglesworth et al. 2015). By comparing clustering of preantral and antral granulosa cells by single cell transcriptomics to the expression of these markers by RNAscope, we found interesting parallels between granulosa cells of preantral follicles and cumulus cells of antral follicles which shared many markers that were absent from mural granulosa cells. These differences between preantral and antral follicle mural granulosa cells were reflected in pseudotime trajectory analysis, suggesting that the preantral granulosa cell states are conserved in the cumulus cells of antral follicles while the mural granulosa cells of antral follicles are further differentiated and form a separate branch in the pseudotime trajectory. An example of shared marker expression between preantral and cumulus granulosa is Kctd14, a member of the Potassium Channel Tetramerisation Domain Containing family in granulosa cells expressed during the initial growth of early pre-antral follicles, which we had previously shown to be regulated by AMH (Meinsohn et al., 2021). RNAscope analysis of Kctd14 expression identified a group of cells present in preantral follicles directly adjacent to the oocyte that were destined to differentiate into cumulus cells of large antral follicles. To date the function of KCTD14 in the ovary remains unknown.
The cluster designated as corpus luteum could be divided into three subclusters (CL_1-3), which we speculate might represent different life stages of the developing corpus luteum. Supporting this interpretation, pseudotime analysis of granulosa cell trajectories found that the CL_2 cluster was closer to the periovularory granulosa cells, suggesting it may be composed of early differentiating luteal cells characterized by their transcriptional response to the LH surge. The gene expression signature of the CL_2 cluster confirms that these cells are involved in active steroid production, as evidenced by the high expression of Star (Kiriakidou et al., 1996), and Hsd17b7, (Stocco et al., 2007). The CL_3 cluster was comprised of luteal cells expressing markers such as the Nuclear Paraspeckle Assembly Transcript 1 (Neat1), which has been shown to be involved in the successful formation of the corpus luteum, as most of the Neat1 KO mice fail to establish corpora lutea leading to successful pregnancies due to low levels of progesterone (Nakagawa et al. 2014). The CL_1 cluster which the pseudotime profile places in proximity to CL_3, appears to share features of both CL_2 and CL_3. Future studies will be needed to further define these corpus luteum expression signatures and determine if they represent cell states corresponding to the natural progression of the CL from formation to regression (periovulatory>CL_2>CL_1>CL_3) or distinct luteal cell subtypes reflecting different cellular origins or distinct functions.
The final two granulosa subclusters can be identified as mitotic and atretic cells based on their expression of previously validated markers. Indeed, transcripts enriched in the latter are consistent with markers of atretic follicles including Caldesmon 1 (Cald1) (Hatzirodos et al. 2014), Phosphoinositide-3-Kinase Interacting Protein 1(Pik3ip1) (Piersanti et al. 2019), Thrombospondin 1 (Thbs1) (Thomas et al. 2008; Garside et al. 2010; Zhu et al. 2019), and SRY-Box Transcription Factor 4 (Sox4) (Terenina et al. 2017; Fan et al. 2019). While markers found in mitotic granulosa cells are universally characteristic of dividing cells (Table S5).
The mesenchymal cluster was also surprisingly complex and somewhat variable across the estrous cycle, reflecting its physiological and temporal function to accommodate the dynamic tissue remodeling associated with follicle growth, steroid hormone production, and ovulation. The ovarian stroma adjacent to the developing follicle is thought to differentiate into the theca, which is responsible for steroid hormone biosynthesis and therefore underlies the cyclic hormone production of the ovary (RYAN and PETRO 1966). Here we identified two theca clusters, designated as Theca 1 and 2. Theca 1, defined by markers such as Hhip (Hummitzsch et al. 2019; JoAnne S. Richards et al. 2018), Mesoderm Specific Transcript (Mest) (Fan et al. 2019), and Patched 1 (Ptch1) (JoAnne S. Richards et al. 2018; Fan, et al. 2019), was presumed to be immature theca. As the follicle matures and the antrum forms, this layer becomes vascularized and differentiates into theca interna, which is steroidogenic. This steroidogenic theca cluster (Theca 2), was readily identifiable through its expression of Hydroxy-Delta-5-Steroid Dehydrogenase, 3 Beta- and Steroid Delta-Isomerase 1 (Hsd3b1), Cyp17a1, Cyp11a1 (Fan, et al. 2019), Fdx1 (Fan et al. 2019) and Prolactin receptor (Prlr) (Grosdemouge et al. 2003). Theca externa, which plays a structural role in the follicle, is comprised of smooth muscle cells, and was identified by its expression of structural proteins such as Myosin Heavy Chain 11 (Myh11), Transgelin (Tagln), and Smooth Muscle Actin (Sma or Acta2) (Zhao et al. 2020). Interestingly Fan et al. (2019) also identified a smooth muscle cluster remarkable for its high expression of structural genes such as Collagen Type I Alpha 1 Chain (Col1a1), Collagen Type I Alpha 2 Chain (Col1a2), Collagen Type 6 Alpha 1 Chain (Col6a1) and Collagen Type 6 Alpha 2 Chain (Col6a2) (Fan et al. 2019). In our dataset these genes were expressed in the smooth muscle, theca 1, and both stromal 1&2 clusters (Fan et al. 2019). Another difference was their report of Aldehyde Dehydrogenase 1 Family Member A1 (Aldh1a1) expression in theca externa which we found primarily in the cluster theca 2 in our dataset. These differences could be attributable to clustering resolution and species variation.
The rest of the ovarian mesenchyme was subdivided into two stromal clusters, labelled stroma 1 and stroma 2. It is tempting to speculate that stroma 1 and 2 may represent two distinct populations of stromal cells which differ in abundance according to their position in the cortex or medulla or their proximity to follicles, but our RNAscope analysis could not conclusively distinguish any unique histology or spatial mapping. The genes enriched in these clusters were consistent with previous work, including extracellular matrix and cell adhesion (e.g. Decorin (Dcn), Lumican (Lum), Col1a1), transcriptional machinery (e.g. SRY-Box Transcription Factor 4 (Sox4), GATA Binding Protein 6 (Gata6)), and TGFB signaling (e.g. Latent Transforming Growth Factor Beta Binding Protein 4 (Ltbp4), HtrA Serine Peptidase 3 (Htra3)) markers (Kinnear et al. 2020).
The ovarian surface epithelium (OSE) is a simple mesothelial cell layer covering the ovarian stroma which is disrupted during ovulation and dynamically expands and contracts with cyclic ovarian changes (Hartanti et al. 2019; Xu et al. 2011). The OSE was represented by fewer than 3%of all cells (845 cells) in our dataset and could be identified based on well-established markers such as keratin (Krt) 7, 8 and 18 (Kenngott et al. 2014), Metallothioneins Mt1 (Iwata et al. 1999) and Mt2 (Iwata et al. 1999), Cysteine Rich Protein 1 (Crip1) (Gava et al. 2008), and Insulin Like Growth Factor Binding Protein 5 (Igfbp5) (H. Wang et al. 2006; Gava et al. 2008) which we validated herein. Despite their function in ovulatory wound repair, the OSE gene expression was not drastically altered between the different stages of the estrous cycle, perhaps due the small relative proportion of OSE participating in ovulation and subsequent wound repair and their relatively low representation in the dataset. Nevertheless, we found genes previously associated to wound healing such as Galectin 1 (Lgals1) (Lin et al. 2015), which were significantly upregulated in estrus when compared to proestrus and metestrus. Interestingly, the Lgals1 knockout mice have delayed cutaneous wound healing compared to their wild type counterparts (Hsieh et al. 2002). Similarly, the expression of the immediate-early genes Fos, Jun, Junb, and Egr1 was variable during the estrous cycle, following a common pattern of strong downregulation at estrous compared to the other stages. A potential explanation may be the role of this gene family in stromal ovulatory wound repair, which would be consistent with previous reports showing that mice with fibroblast overexpressing Egr1 exhibit exuberant tissue repair (Wu et al. 2009), while Jun, Fos and Fosb are in turn induced at different time points during corneal epithelial wound healing (Okada et al. 1996).
The other cell types such as endothelial, immune cells and oocytes were found in the dataset but given their relatively low representation, at 10%, 5% and 0.05% of all cells respectively, were not included in the analysis of cyclic states. Other methodologies that include specific enrichment of these cell types should be used to study their role in cyclic ovarian function.
Finally, to take advantage of this rich dataset, we sought to identify secreted markers which vary in abundance during the estrous cycle and could thus be used as biomarkers in assisted reproduction. We identified and prioritized four secreted biomarkers which varied significantly during different transitions of the estrous cycle, namely Inhba, Prss35, Nppc, and Tinagl1.
Activin A is a secreted protein homodimer translated from the Inhba transcript that is a crucial modulator of diverse ovarian functions including steroidogenesis and extracellular matrix remodeling, whose expression level depends highly on the stage of the estrous cycle (Chang and Leung 2018). RNAscope analysis confirmed that the transcript was mostly expressed by mural granulosa cells of antral follicles while qPCR quantification found it to be highest in proestrus and quickly and significantly downregulated in estrous. In contrast we found that the Activin A protein remained elevated in the blood in both proestrus and estrus, which is consistent with studies in other species such as ewes (O’Connell et al. 2016). We speculate that this pattern may reflect a delay between transcription and translation, a buildup of the Activin A protein in the circulation, and the incorporation of the Inhba product into other dimers such as Inhibin A (Gedeon and Bokes 2012).
The serine protease 35 transcript was expressed in the theca layers of preantral follicles and induced in granulosa cells of preovulatory follicles and all stages of the corpora lutea, peaking at the estrous stage according to qPCR, leading us to speculate that it may be involved tissue remodeling during ovulation and corpus luteum formation (Wahlberg et al. 2008). In contrast, the PRSS35 protein levels were highest in the diestrus and proestrus stages as determined by ELISA, suggesting perhaps there may be other extra-ovarian sources of PRSS35 that are also cyclic.
The natriuretic peptide precursor C (NPPC) protein is a peptide hormone encoded by the Npcc gene. Nppc has been reported to be expressed by mural granulosa cells while its receptor Npr2 is expressed by cumulus cells. The pair acts on developing follicles by increasing the production of intracellular cyclic guanosine monophosphate and maintains oocyte meiotic arrest while it matures; upon downregulation, the oocyte can escape meiotic arrest and ovulate (Celik et al. 2019). This mechanism makes Nppc an interesting marker to predict ovulation. Herein, qPCR analysis revealed that Nppc was highest in the ovary at proestrus, and was quickly and significantly downregulated at estrous, probably in response to the increased levels of LH which inhibits the Nppc/Npr2 system (Celik et al. 2015). In contrast there was a trend for the circulating NPCC peptide to be highest in metestrus and diestrus, albeit not in a statistically significant way.
Finally, we evaluated the level of transcription and protein expression of the matricellular factor Tinagl1. We found both the Tinagl1 transcript and the circulating TINAGL1 protein in the blood to be highest during estrous, thus coinciding with ovulation, with a pattern of expression consistent with mural granulosa cells of antral follicles. While its role in the ovary has not been extensively investigated, it was associated with a delayed decrease in the number of ovulated oocytes in aging Tinagl1 knock out mice due to delayed ovarian collagen deposition (Akaiwa, Fukui, and Matsumoto 2020), Tinagl1 is known to be expressed in the uterus in the decidual endometrium post implantation, and the Tinagl1 knockout mouse displays impaired fertility characterized by the incapacity to carry pregnancy to term and perinatal lethality (Takahashi et al. 2016). Recently, Tinagl1 was also shown to be involved in myofibroblast-mediated wound healing (Bergmeier et al. 2018).
These potential cyclic biomarkers provide a proof of concept that a deeper understanding of changes at the single cell transcriptomics may have useful applications in assisted reproduction. It will be of interest to follow up the findings of cyclic expression of ACTIVIN A, PRSS35, NPPC, and TINAGL1, particularly in combination as an index, for use in humans and other species for the purpose of assisted reproduction.
In summary, this study outlines dynamic mRNA expression in murine ovaries across the estrous cycle and other reproductive states and extends our understanding of the diversity of cell types in the adult ovary. We identified herein novel biomarkers of the estrous cycle that can be readily measured in the blood and may have utility, in combination, to predict staging for assisted reproduction. This rich dataset will provide a hypothesis-generating framework of cell states across the cycle with which to elucidate the complex cellular interactions that are required for ovarian homeostasis.
Acknowledgements
We thank LiHua Zhang, Caroline Coletti, and Sarah Mustafa Eisa for technical help. This study was supported by the National Institute for Child Health and Human Development to D.P. (1R01HD102014-01), the Huiying Fellowship (H.D.S.), Sudna Gar Fellowship (D.P.), Massachusetts General Hospital Executive Committee on Research (D.P. and P.K.D.), and royalties (P.K.D.) from the use of the MIS ELISA in infertility clinics.


