

Abstract
Hippocampal memory function is thought to be supported by distinct connectivity states, with strong extrahippocampal input benefitting encoding and weak extrahippocampal input benefitting retrieval. Previous research in rodents suggests that the hippocampal theta oscillation orchestrates the transition between these states, with opposite phase angles respectively predicting minimal and maximal extrahippocampal input. However, it is unclear whether this phase dependence exists in humans. We used network-targeted stimulation to investigate whether hippocampal receptivity to network input varies with theta phase in humans of both sexes. Intracranial local field potentials were recorded from individuals with epilepsy undergoing medically necessary stereotactic electroencephalographic recording. In each subject, biphasic bipolar direct electrical stimulation was delivered to lateral temporal sites with demonstrated connectivity to hippocampus. Stimulation evoked ipsilateral hippocampal potentials with distinct early and late negative components. Using evoked-component amplitude to measure functional connectivity, we assessed whether different phases of hippocampal theta reflected distinct connectivity states. Stimulation enhanced both early and late component amplitudes when delivered during the observed theta peak relative to trough. Analysis of estimated theta phase delays between stimulation locations and hippocampus suggested that hippocampal response amplitude was maximized when stimulation influenced hippocampal activity at approximately 90° before the trough of its theta rhythm. The pattern of theta phase dependence observed in hippocampus was not identified for amygdala and orbitofrontal cortex control locations. These findings demonstrate that theta phase reflects connectivity states of human hippocampal networks, confirming a putative mechanism by which oscillations modulate local hippocampal processing.
Introduction
Episodic memory encoding and retrieval are thought to involve distinct hippocampal functional connectivity states (Hasselmo & Stern, 2014). During memory formation, fragments of episodic information are bound into coherent memory traces by the hippocampus. This process is thought to benefit from increased input via connectivity of entorhinal cortex to CA1 (Hasselmo et al., 2002; Maass et al., 2014; Brankačk et al., 1993; Kamondi et al., 1998; Fernández et al., 1998) along with reduced recurrent hippocampal connectivity (Hasselmo et al, 2002). This connectivity pattern is thought to enhance the strength of incoming sensory signals while preventing interference from memory reactivation. Retrieval involves hippocampal-dependent reactivation (Waldhauser et al., 2016; Tanaka et al., 2014; Gelbard-Sagiv et al., 2008; Tayler et al., 2013; Eichenbaum, 2004), which is thought to benefit from the opposite functional connectivity pattern (Hasselmo et al., 2002; Duncan et al., 2014; Montgomery & Buzsaki, 2007). In rodents, hippocampal theta oscillations orchestrate the transition between these distinct connectivity states. Rodent hippocampal theta synchrony supports memory formation and retrieval (Markowska et al., 1995; Winson, 1978), with different theta phases thought to support opposing functional connectivity patterns. For instance, tetanic electrical stimulation of hippocampal CA1 results in long-term potentiation (LTP) when delivered at the stratum radiatum theta peak versus long-term depression (LTD) when delivered at the trough (Hölscher et al., 1997; Hyman et al., 2003), supporting a theta-phase dependence of encoding readiness. In addition, disrupting the theta cycle with inhibitory stimulation locked to local peak versus trough has been shown to differentially impact encoding and retrieval in rodents (Siegle & Wilson, 2014).
It is currently unclear whether human hippocampus shows the phase dependence of receptivity to external input that has been identified in rodent models. The goal of the present experiment was to test predictions of this theta phase-dependence model in humans. We recorded local field potentials from the hippocampus in patients undergoing intracranial electrophysiological recording via implanted depth electrodes as part of their clinical care. We applied direct electrical stimulation to hippocampal network sites in lateral-temporal cortex with putative projections to entorhinal cortex as well as to hippocampus (Insausti et al., 1987; Catani & Thiebaut de Schotten, 2008; Zhong & Rockland, 2003) and measured the hippocampal response to lateral-temporal stimulation using well-characterized early and late evoked-potential components (Matsumoto et al. 2004, Novitskaya et al. 2020).
We hypothesized that if hippocampal receptivity to network input varies with the theta oscillation, then the hippocampal response to stimulation would differ according to hippocampal theta phase at the time of stimulation delivery. We further hypothesized based on findings in rodents (Siegle & Wilson, 2014) that hippocampal receptivity to external stimulation would be maximal at local theta trough and minimal at local theta peak. To test selectivity, we analyzed theta phase dependence for control locations in the amygdala and orbitofrontal cortex. The amygdala exhibits dense structural and functional connectivity to the hippocampus (see Chrobak et al., 2000) yet has different primary inputs and therefore might demonstrate less theta phase dependence given stimulation of hippocampal afferents. The orbitofrontal cortex is anatomically and synaptically distant and therefore is likely resistant to the effects of volume conduction and local interactions.
Results
Participants and stimulation protocol
Data were collected from eight individuals with refractory epilepsy (two male; mean age ± SD: 37 ± 10 years; range 28-55 years; Table 1) undergoing invasive electrophysiological monitoring as part of their inpatient clinical care at the Northwestern Memorial Hospital Comprehensive Epilepsy Center. All participants had stereotactic EEG (sEEG) depth electrodes implanted in hippocampus, amygdala, lateral temporal cortex, and orbitofrontal cortex, in addition to other regions. All stimulation electrodes were localized to lateral temporal cortex and adjacent white matter (Fig. 1).

A) Locations of lateral temporal stimulation electrodes (top) and recording electrodes in hippocampus (HC, bottom) in one participant. B) Group-level electrode localization plotted on an MNI template (Holmes et al., 1998). Amygdala and hippocampus are highlighted in yellow. Electrodes are enlarged ∼500% for visualization purposes. Note: hippocampal electrodes did not align to the template brain hippocampus in one subject and are not shown in this image.
In seven participants, the experimental stimulation protocol consisted of trains of single pulses (see Materials and Methods) delivered at either 0.5 Hz (∼60 pulses per train) or approximately 1 Hz (with an interpulse interval range of 1-1.25 s, jittered pseudorandomly, ∼1200 pulses per train). These train types were alternated with approximately two minutes of rest between trains. In one participant, stimulation was delivered at 0.5 Hz only. The number of stimulation pulses delivered ranged from 241 to 2566 (Table 1). Stimulation did not elicit seizure or clinically significant afterdischarges in any participant.
Assessment of phase estimation approach
The method we used to estimate hippocampal theta phase at the time of stimulation involved truncating the hippocampal recordings shortly after each stimulation pulse (see Materials and methods). We assessed whether this approach yielded an accurate estimate of phase (i.e., one based on the ongoing oscillatory activity and without contamination by the evoked response or filter artifact) using “pseudotrials”, epochs made from data collected during a continuous, stimulation-free period with an added model stimulation pulse and EP. We estimated the phase of these pseudotrials at mock stimulation onset (i.e., t = 0) using the same approach as for stimulation trials. As pseudotrials were created from continuous, stimulation-free data, we were also able to calculate “ground-truth” phase values (i.e., obtained in the absence of stimulation artifact or EP and without truncating the recording). We then measured the trialwise differences between ground-truth and estimated phase angles (see Materials and Methods).
Across electrodes, the mean difference between ground-truth and estimated phase was -11.1° (mean distance ± SD: -11.1 ± 8.0°). This difference was highly concentrated (Rayleigh test: z(22) = 22.6, p < 0.001), indicating consistency of the phase angle estimate performance across electrodes (Fig. 2a). Although estimated phase angles were significantly more concentrated than ground-truth phase angles (two-tailed t-test on mean resultant vector lengths, t(22) = 6.3, p < 0.001, Cohen’s d = 1.9), the distribution of mean estimated phase angles was uniform (Hodges-Ajne test: m(22) = 6, p = 0.3). These findings demonstrate that the estimation approach introduced a very small and consistent phase angle bias.

Comparison of ground-truth and estimated phase angles from pseudotrials (stimulation-free resting data with added model stimulation artifact and EP). Validation was performed across all hippocampal channels included in the main EP analysis (n = 23). A) Mean phase angle and mean resultant length (MRL) of trialwise distance between ground-truth and estimated phases. Each line represents one hippocampal channel. B) Left: Mean stimulation-free validation trials binned according to ground-truth (top) and estimated (bottom) phase at mock stimulation onset. Line color indicates bin center (0°, 90°, 180°, 270°). Right: enlarged panels from -100 ms to 0 ms, showing similarity of theta phase at t=0 across ground-truth (top) and estimated (bottom) bins.
We also observed differences in the intertrial theta coherence across trials binned by ground-truth versus estimated phase (Fig. 2b). Because the phase estimation approach involves truncating the epoch at +50 ms following stimulation onset, signal after this point does not contribute to the phase estimate. Theta coherence therefore decreases asymmetrically about t = 0, with a more rapid drop-off after t = 0 than before it. In contrast, trials binned according to ground-truth phase show symmetrical declines in coherence before and after t = 0.
Hippocampal EP shows characteristic early and late negative components Hippocampal EP components were estimated to occur from 27-113 ms (early) and 114-208 ms (late) post-stimulation (Fig. 3). The observed component latencies were consistent with values reported by previous studies of human hippocampal response to direct electrical stimulation of polysynaptic afferents (e.g., Kubota et al., 2013; Novitskaya et al., 2020).
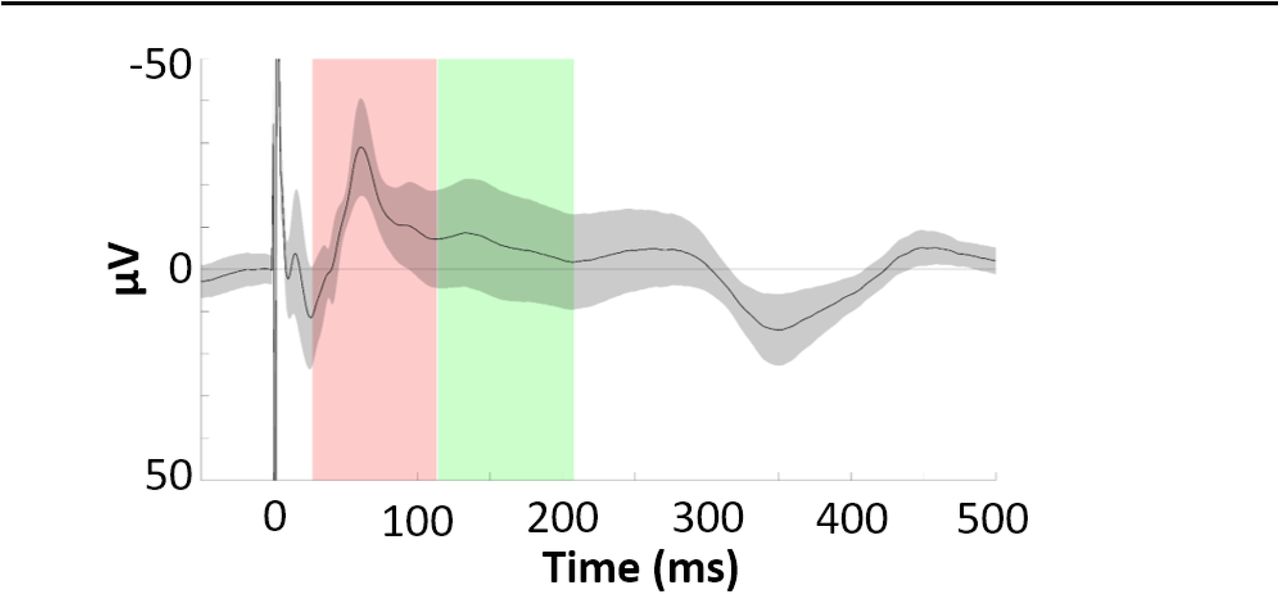
Phase-balanced hippocampal EP (i.e., with 0°, 90°, 180°, and 270° phase bins contributing equally to the average) elicited by lateral temporal stimulation. Error bars indicate ±1 SEM across electrodes. Identified early and late negative components are highlighted in red and green. Note: the Y axis shows negative values in the upwards direction to highlight the negative-going EP components of interest.
Hippocampal response to stimulation differs for peak versus trough
To test how specific phase angles were related to hippocampal responsiveness to stimulation, we analyzed trials according to theta phase at stimulation onset. We hypothesized that hippocampal response to stimulation would be maximal at the theta trough and minimal at the theta peak (Brankačk et al., 1993; Hasselmo et al., 2002). To address this, we estimated theta phase at stimulation onset for each trial (see Materials and Methods) and binned trials to 90° intervals, centered on peak, trough, rising and falling phase angles. By taking the means within the 0° and 180° bins, we obtained average peak and trough stimulation trials for each electrode (Fig. 4a).

Dashed lines indicate components with significant amplitude differences across peak and trough trials (* p<0.05). A) Mean hippocampal EPs elicited by stimulation at theta trough (purple, left) and peak (black, right), alongside phase-matched stimulation-free trials (red). Error bars indicate ±1 SEM across electrodes. Theta oscillation is visible around stimulation at t = 0. B) Isolated hippocampal evoked response (i.e., EP minus phase-matched stimulation-free trials) to peak and trough stimulation. The non-evoked oscillatory component is abolished.
The early and late hippocampal EP components showed significant amplitude differences for peak versus trough stimulation conditions (Fig. 5a. Paired t-test across hippocampal electrodes: tearly(22) = 2.7, pearly = 0.01, Cohen’s dearly = 0.2; tlate(22) = 2.6, plate = 0.02, Cohen’s dlate = 0.1). The direction of this effect was contrary to our hypothesis, with greater response amplitudes for peak versus trough-trials for both early and late components (mean peak - trough amplitude difference ± SD: diffearly = 4.8 ± 8.5 uV, difflate = 3.9 ± 7.2 uV).

Each dot represents one electrode. Dot color indicates participant. Values above 0 indicate higher-amplitude response following peak stimulation. Red line indicates the mean peak versus trough difference across electrodes. A) Difference between peak- and trough-evoked amplitudes in the early (left) and late (right) negative components in the raw, uncorrected EP. B) As A, but for the isolated hippocampal response (i.e., EP minus phase-matched stimulation-free trials).
One interpretive limitation was that phase at a given timepoint predicts future amplitude. When trials are sorted according to theta phase at stimulation, differences are expected in the post-stimulation signal simply owing to the ongoing theta oscillation. We therefore isolated the evoked response from this non-evoked oscillation in order to assess whether the evoked response itself varied according to stimulation phase.
We estimated the non-evoked oscillation using phase-matched stimulation-free trials (see Materials and Methods). We binned stimulation-free trials to 90° intervals using the same approach as for the stimulation trials. By taking the mean of stimulation-free trials within each bin, we estimated the non-evoked component of the peak and trough EPs for each electrode (red lines in Fig. 4a). As expected, the non-evoked component was an oscillation with asymmetrical coherence drop-off around stimulation onset (see Fig. 2b). Finally, to isolate the evoked response, we subtracted this non-evoked component from its corresponding EP. This abolished pre-stimulus amplitude differences between peak and trough trials across hippocampal electrodes, indicating good removal of the ongoing oscillatory component (Fig. 4b. Paired t-test on mean amplitudes -50 to 0 ms: t(22) = 0.051, p > 0.9).
Isolating the evoked response reduced the differences between peak and trough stimulation in the late component (Fig. 5b. Paired t-test: t(22) = 1.3, p = 0.2, Cohen’s d = 0.05). However, as was the case for the overall EP, peak stimulation yielded a significantly larger hippocampal response for the early component (Fig. 4b. Paired t-test: t(22) = 2.3, p = 0.03, Cohen’s d = 0.2; mean amplitude difference ± SD: diffearly = 6.3 ± 13 uV, difflate = 2.4 ± 9 uV).
To complement the analyses of component amplitudes, we also performed an exploratory analysis of peak versus trough amplitude differences across all timepoints of the peri-stimulus trial period. As in the analysis above, we compared amplitudes in stimulation and stimulation-free trials in order to hone in on the stimulation-evoked response controlling for expected amplitude differences due to phase in the absence of stimulation. As expected, both stimulation and stimulation-free trials exhibited strong peak versus trough differences before t = 0 (Fig. 6a, b). In the stimulation-free trials, the peak-trough difference drops off asymmetrically about t = 0 (Fig. 6b), likely related to the phase estimation method (which was used for both stimulation and stimulation-free trials and involved truncating each trial at +50ms; see Fig. 2b). Isolating the evoked response revealed that peak stimulation selectively enhanced signal negativity during, but not before or after, the identified EP components (Fig. 6c). Notably, there were no peak versus trough differences until after ∼30 ms, indicating that effects of phase on the subsequent amplitude of the EP components were not due to lingering differences in the ongoing oscillation irrespective of stimulation. These findings suggest that the effects of stimulation phase were temporally selective to the EP components.

The difference between peak and trough amplitude at each timepoint is colorized and plotted on top of the grand average hippocampal EP. Purple indicates greater negativity for peak stimulation trials, yellow indicates greater negativity for trough stimulation. Error bars indicate ±1 SEM of the peak – trough amplitude difference (a.u.). Timepoints where p < 0.05 (uncorrected, two-tailed) for non-zero amplitude difference between peak and trough are marked (*) for visualization. Component boundaries are marked with vertical lines (early: red, late: green). Plotted for: A) Raw EPs (i.e., stimulation trials). B) Stimulation-free trials only. C) Isolated evoked response (i.e., stimulation trials minus stimulation-free trials).
As these findings were contrary to our hypothesis that stimulation at trough would evoke the largest-magnitude response, we also analyzed the evoked response in the remaining phase bins (centered at rising and falling phase angles). The goal of this analysis was to assess whether peak and trough were the appropriate phase angles-of-interest, where stimulation elicited maximally different response amplitudes. Following correction for non-evoked oscillatory activity (as in Fig. 4b), we did not detect a difference in rising versus falling amplitude in either the early (paired t-test of component amplitudes: t(22) = 0.57, p = 0.6, Cohen’s d = 0.08) or late (t(22) = 0.79, p = 0.4, Cohen’s d = 0.04) components (Fig. 7).

Mean hippocampal EPs elicited by stimulation at theta falling (yellow) and rising (green) phase angles, before (top) and after (bottom) correction for non-evoked oscillatory activity.
Hippocampal EP amplitude varies continuously according to theta phase at stimulation onset
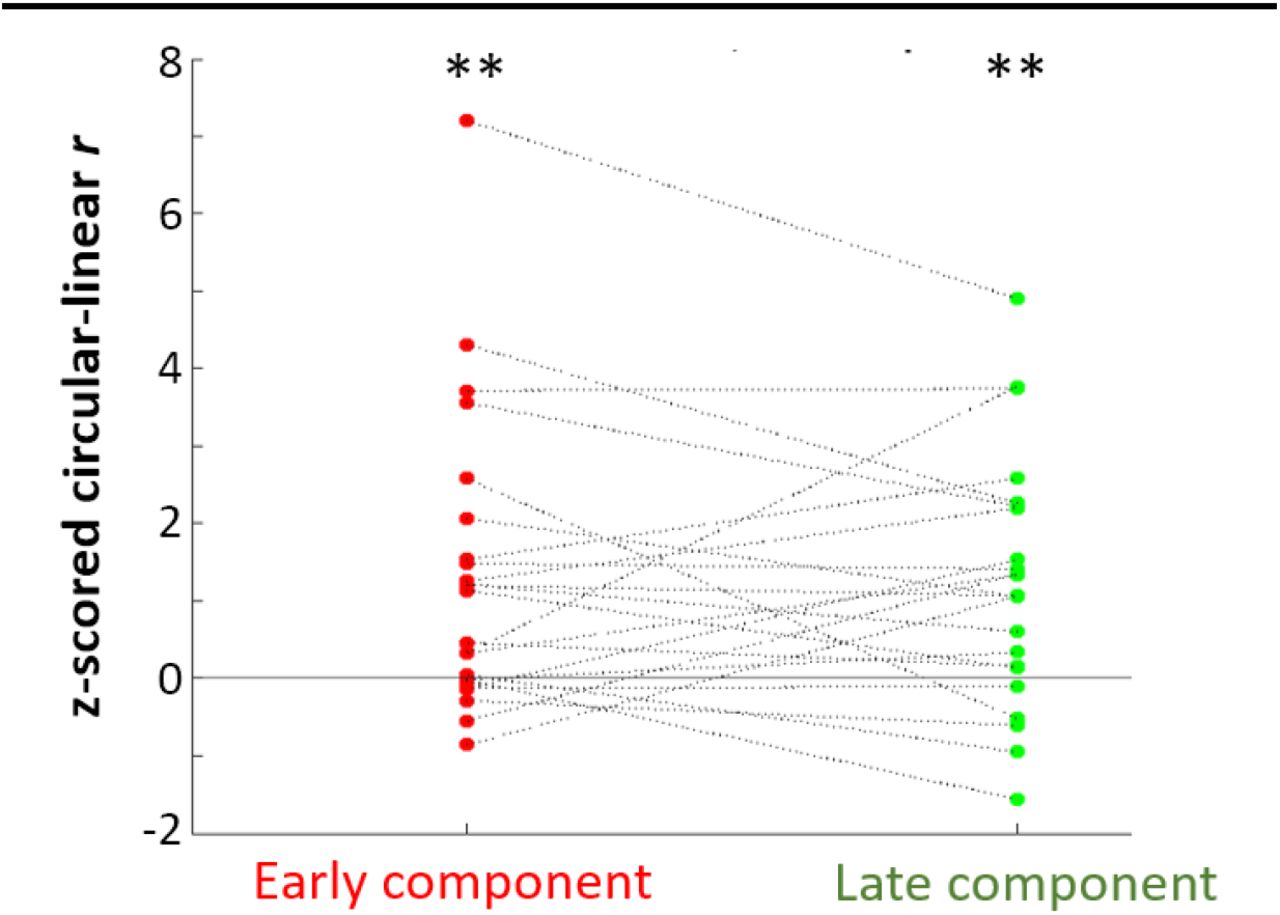
We performed circular-linear analyses to determine whether the magnitude of the hippocampal EP varied continuously with theta phase at stimulation onset. The goal of this analysis was to assess whether the observed peak vs. trough difference emerged due to continuous (i.e., sinusoidal) changes in hippocampal receptivity over the duration of the theta wave. For each electrode, we computed circular-linear correlation across trials between component amplitude and phase at stimulation onset, then performed permutation testing to assess whether the observed periodicity was above chance. Both early and late component amplitudes were significantly predicted by theta phase at stimulation onset (Fig. 8. Mean z-score ± SD: zearly = 1.3 ± 1.9, zlate 1.2 ± 1.6; t-test of z-scores versus 0: tearly(22) = 3.3, pearly = 0.003, Cohen’s dearly = 0.7; tlate(22) = 3.7, plate = 0.001, Cohen’s dlate = 0.8. Mean r ± SD: rearly = 0.080 ± 0.066, rlate = 0.076 ± 0.051). These findings suggest that raw EP component amplitude varied significantly with theta phase at t=0. This finding supports the hypothesis that hippocampal receptivity to network input varies continuously with theta phase

Z-scored theta phase/component amplitude circular-linear correlation r. Each line represents one electrode. Z-scores shown for early (left) and late (right) components. Horizontal line shows chance circularity. Both early and late components showed significant theta-circularity (** p < 0.01).
Estimating phase latency between the stimulation site and hippocampus
Our finding that response amplitude was enhanced specifically by stimulation during the hippocampal theta peak versus trough is counter to our hypotheses based on the rodent literature on direct hippocampal stimulation (Siegle & Wilson, 2014). However, we used lateral temporal cortex stimulation, and there is necessarily a conduction delay between the lateral temporal stimulation site and its receipt in hippocampus. As functionally connected regions are frequently phase-synchronized (see Fell & Axmacher, 2011), we hypothesized that this delay would translate to a consistent theta phase lag between the stimulation electrodes and the hippocampus. This would produce a consistent angle offset between hippocampal theta phase at the time of stimulation (i.e., at t = 0, the timepoint which we used to characterize trial phase in the previous analyses) and at the time of the relevant entorhinal-hippocampal transmission.
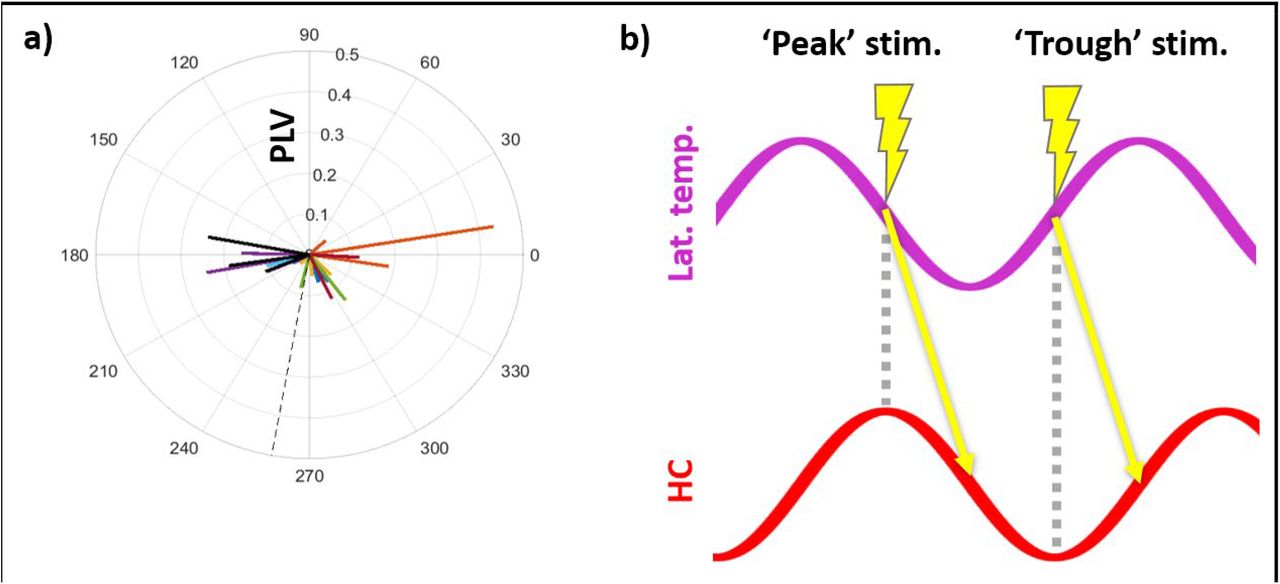
Indeed, permutation testing revealed significant phase locking between hippocampus and the stimulation site (Mean z-score ± SD: z = 1.5 ± 2.8; t-test of z-scores against 0: t(22) = 2.7, p = 0.01, Cohen’s d = 0.6. Mean PLV ± SD: 0.12 ± 0.09), indicating that individual hippocampal electrodes had consistent phase-lags to the stimulation site. Across electrodes, the distribution of mean phase offsets was non-uniform (Rayleigh test: z(22) = 4.0, p = 0.02) and centered at approximately 270° (Fig. 9a. Mean offset ± SD: 259.8 ± 61.9°). This suggests a ∼90° theta phase latency between lateral temporal and hippocampal activity, with lateral temporal theta leading. Consequently, stimulation delivered during the hippocampal peak may have been transmitted to hippocampus, on average, at the subsequent falling phase (Fig. 9b).

A) Distribution of theta phase offsets between lateral temporal cortex and hippocampus. Dashed line indicates circular-mean phase angle across electrodes. Each line represents one hippocampal electrode. Color indicates participant-of-origin for each electrode. Electrode line length indicates phase-locking value. B) Diagram showing expected hippocampal receipt of lateral temporal stimulation, given a ∼90° phase latency in hippocampal theta (bottom, red) relative to lateral temporal theta (top, purple). Arrows indicate polysynaptic transmission between the stimulation site and hippocampus. Stimulation locked to the hippocampal peak (‘peak’ stimulation trials, left) is transmitted to hippocampus at the subsequent falling phase, assuming oscillatory coupling between hippocampus and the stimulation site. Stimulation locked to the hippocampal trough (‘trough’ stimulation trials, right) is transmitted to hippocampus at the subsequent rising phase.
Qualitatively, phase offsets from within the same participant were highly concentrated, indicating low theta phase shift across hippocampal electrodes despite variable laminar depths and septotemporal placement within individual subjects. While previous studies have reported relatively small phase angle shifts across the human hippocampal long axis (Zhang & Jacobs, 2015) relative to the 180° pole-to-pole shift observed in rodents (Patel et al., 2012), this finding implies that the recorded oscillation was also resilient to changes in recording depth. This may be the result of recording from large interlaminar macroelectrodes (see Discussion).
Taken as a whole, these results suggest that hippocampal receptivity to afferent input may have been maximized at the falling phase of the observed oscillation. While opposed to our initial hypothesis that trough would confer maximal receptivity, this finding is in accordance with previous work in rodent models which noted falling-phase optimization of entorhinal receptivity, and similarly made use of laminar-indifferent recording (Siegle & Wilson, 2014).
Analysis of subject variance
As the previous analyses were performed across individual electrodes, we used linear mixed-effects modeling (LME) to determine whether response component amplitudes differed for peak versus trough stimulation across subjects. We constructed an LME model for each response component with a fixed effect of phase and random effects on slope and intercept of both subject and electrode nested within subject [i.e., response amplitude ∼ phase + (phase|subject/electrode)]. We then performed likelihood ratio tests to assess whether this model fit was improved by the inclusion of the fixed effect of phase. That is, after accounting for participant variance, we tested whether stimulation phase improved the prediction of response amplitude. Including the phase effect improved the model fit for both early and late components (one-sided likelihood ratio test for improvement: LRStatearly = 3.8, pearly = 0.03; LRStatlate = 3.3, plate = 0.03). We then repeated this process using amplitude values from the isolated evoked response (i.e., following correction for non-evoked oscillatory activity, as in Fig. 4a). The effect of phase was reduced in these models yet still reliable for the early component (LRStatearly = 3.1, pearly = 0.04; LRStatlate = 1.9, plate = 0.09), in accordance with the observed reduction in peak versus trough differences at the electrode level following correction for non-evoked oscillatory activity.
Control regions do not show periodicity in the early response to stimulation
To assess whether theta-dependence of EP amplitude was specific to hippocampus, we performed the same analyses on data from electrodes in amygdala (n = 9) and orbitofrontal cortex (n = 22). Data from control regions was acquired concurrently with the hippocampal data described above.
In both control regions, stimulation EPs had distinct early and late negative components (Fig. 10a, f). In amygdala, components were estimated to span 35-70 ms (early) and 94-256 ms (late). In OFC, components spanned 22-74 ms (early) and 74-490 ms (late). As in the analysis of hippocampus, we binned EP trials according to phase at stimulation onset and compared component amplitudes across peak and trough trials (Fig. 10b, i). The amygdala EP showed significant amplitude differences across peak and trough trials in the late component (paired t-test: tlate(8) = 4.1, plate = 0.003, Cohen’s dlate = 0.2), with greater amplitude for peak trials (Fig. 10d. Mean difference ± SD: 5.5 ± 4.0 uV). There was no significant amplitude difference in the early component (Fig. 10d. tearly(8) = 0.85, pearly = 0.4, Cohen’s dearly = 0.3). This effect persisted after we isolated the evoked response using phase-matched stimulation-free trials (tlate(8) = 3.6, plate = 0.007, Cohen’s dlate = 0.2; mean difference ± SD: 6.6 ± 5.5 uV). In contrast, we found no differences in peak versus trough trial amplitude in the orbitofrontal EP or isolated evoked response (Fig. 10i. EP: tearly(21) = 0.51, pearly = 0.6, Cohen’s dearly = 0.03; tlate(21) = 0.77, plate = 0.5, Cohen’s dlate = 0.1. Isolated response: tearly(21) = 1.6, pearly = 0.1, Cohen’s dlate = 0.06; tlate(21) = 0.52, plate = 0.6, Cohen’s dlate = 0.06).

Left column, amygdala; right column, OFC. A, F) Phase-balanced grand average EP. Error bars indicate ±1 SEM across electrodes. Early (red) and late (green) negative component boundaries are marked. B, G) Mean peak (black) and trough (purple) EPs. Error bars indicate ±1 SEM across electrodes. Phase-matched stimulation-free trials shown in red. Dashed lines indicate components with significant amplitude differences across peak and trough trials (* p<0.05). C, H) Isolated evoked response (i.e., EP minus mean stimulation-free trials) elicited by peak and trough stimulation. Dashed lines indicate components with significant amplitude differences across peak and trough trials (* p<0.05). D, I) Difference in early (left) and late (right) EP component amplitude induced by peak versus trough stimulation. Each dot is one electrode. Color indicates participant-of-origin. Red line shows mean peak - trough difference across electrodes. As D, but for the isolated hippocampal response (i.e., EP minus phase-matched stimulation-free).
Discussion
We investigated whether the human hippocampus varies in receptivity to external stimulation along with the local theta oscillation. Lateral temporal stimulation consistently evoked a hippocampal response with distinct early and late negative components. These component amplitudes were found to vary continuously with theta phase at stimulation onset, with stimulation at peak yielding maximal response amplitude and stimulation at trough yielding minimal response amplitude. This effect was most pronounced during the early negative component (27-113 ms after stimulation onset), where it persisted even after corrections for non-evoked oscillatory activity which emerged from the phase-sorting procedure. These findings suggest that human hippocampal connectivity to network afferents varies across the local theta oscillation.
While afferent stimulation evoked maximal hippocampal response at theta peak, this phase angle does not necessarily reflect the time of maximal entorhinal input due to stimulation. That is, our finding that stimulation evoked a greater hippocampal response at theta peak versus trough should be considered in light of possible delays between network stimulation and its downstream effect on hippocampus. In this study, we estimated hippocampal theta phase for each trial at the onset of lateral temporal stimulation, which allowed us to obtain phase values that were unbiased by the hippocampal evoked response. However, the relevant timepoint for entorhinal-hippocampal connectivity occurs later, when the stimulation is conveyed via entorhinal cortex to hippocampus. We found significantly delayed theta phase locking between hippocampus and the lateral temporal stimulation sites, indicating consistent transmission delay for each electrode pair (Fries, 2005). The distribution of phase offsets was significantly non-uniform and centered near -90° (with HC lagging), suggesting a transmission delay between the stimulation site and hippocampus corresponding on average to roughly 90° of the dominant network theta oscillation. In other words, in trials where stimulation was delivered with the hippocampal oscillation at peak, the relevant entorhinal transmission may have occurred, on average, at the subsequent falling phase of the theta oscillation.
Previous studies in rodent models have reported disparate phase angles relating maximal entorhinal-hippocampal transmission, likely due to differences across studies in the targeted hippocampal layer. Because the theta oscillation arises from interlaminar dipoles (Goutagny et al., 2009; Kamondi et al., 1998), its observed phase varies according to electrode depth. Studies in rodents have therefore reported maximal entorhinal input at both the recorded hippocampal trough (from fissural recording, as in Brankačk et al., 1993), peak (from pyramidal layer recording, as in Douchamps et al., 2013), and falling phase (from recording in variable layers; see Siegle & Wilson, 2014). As data in this study were collected opportunistically from participants undergoing clinically necessary invasive monitoring, hippocampal electrodes were implanted at variable laminar depths that could not be known due to the relative imprecision of CT/MRI. Nonetheless, we observed a consistent effect of phase angle on the recorded hippocampal response. The relatively small phase offset we observed between hippocampal sites from a given participant (i.e., Fig. 9) supports that the recorded oscillation was depth indifferent, perhaps owing to the large size and interlaminar placement of the macroelectrodes. Further studies would be necessary to determine a subfield and layer-specific phase angle conferring maximum entorhinal input to the human hippocampus.
In addition, the observed effect of peak versus trough is likely specific to the synaptic distance and conduction delay between the stimulation site and hippocampus. While stimulation electrodes were all located in lateral temporal cortex, their gyral locations varied according to clinical constraints. Accordingly, while LTC-HC phase offsets were non-uniform, there were pronounced differences in the offset angle between participants. It is possible that differences in transmission latencies contributed to the observed variance in peak-trough effects across participants. We hypothesize that stimulation targeting a different site in the hippocampal network would produce a similarly theta-periodic hippocampal response, albeit maximized at a different stimulation phase angle (i.e., not necessarily at the observed hippocampal theta peak).
One limitation is that this study was performed in individuals with refractory epilepsy. Temporal lobe epilepsy is associated with episodic memory impairments (Mayeux et al., 1980; Helmstaedter & Kockelmann, 2006) thought to be caused by structural abnormalities as well as interictal epileptiform activity in the hippocampus and hippocampal cortical network (Helmstaedter & Kockelmann, 2006; Gelinas et al., 2016). Nonetheless, iEEG recordings from individuals with temporal lobe epilepsy have previously been used to study mechanisms for hippocampal function (Lega et al., 2012; Long et al., 2014; Fell et al., 2011; Wixted et al., 2014). To enhance the study’s generalizability, we rejected trials with recorded epileptiform activity and ensured during data collection that the stimulation protocol did not elicit afterdischarges or spiking. Regardless, it is unclear whether epilepsy-related changes to hippocampal structure and network connectivity influenced our findings.
Further, phase dependence has also been demonstrated in non-epilepsy model organisms. Previous studies have reported phase-dependent responses to external stimulation across diverse neocortical areas. Direct electrical stimulation of sensory cortices has been found to differentially induce long-term potentiation or depression depending on local field potential phase (e.g., with beta- and gamma-dependence in rodent visual cortex [Wespetat et al., 2004] and beta-dependence in primate sensorimotor cortex [Zanos et al., 2018]). In humans, local oscillatory phase has been found to relate to the amplitude of the cortical response evoked by transcranial magnetic stimulation (Kundu et al., 2014). These findings support that oscillatory phase relates generally to local excitability. Thus, one part of our analysis strategy was to assess whether any observed phase dependence was specific to (or specifically enhanced in) hippocampus. We investigated the phase dependence of stimulation response in two control regions: amygdala and orbitofrontal cortex. Like hippocampus, both regions have anatomical (Shi & Cassell, 1998; Iwai et al., 1987; Morecraft et al., 1992) and functional (Roy et al., 2009; Du et al., 2020) connectivity with the lateral temporal stimulation site. But while amygdala is physically adjacent to hippocampus and densely connected with hippocampus and entorhinal cortex (Saunders et al., 1988; Pikkarainen et al., 1998; see Chrobak et al., 2000) – and might therefore be expected to show hippocampus-like phase dependence of input receptivity -- orbitofrontal cortex is more distant both in space and connectivity. Indeed, we observed significant theta phase dependence in the amygdala EP but no such effect in orbitofrontal cortex. As was the case in hippocampus, the amygdala showed greater response amplitude when stimulation was applied at theta peak relative to trough. Unlike hippocampus, this effect was present exclusively in the late component. We speculate that the late phase dependence may be driven by secondary transmission from hippocampus. The presence of early components in the amygdala and orbitofrontal EPs supports connectivity between these control regions and the lateral temporal stimulation site. However, we note that the stimulation site was chosen on the basis of its functional connectivity with hippocampus as measured via the stimulation-evoked potential, and not based on connectivity with these other brain areas. Performing network-targeted stimulation for each control region could provide stronger evidence for the effect’s selectivity to hippocampus.
This study used direct electrical stimulation as a proxy for endogenous network signaling. Follow-up studies are required to assess whether and how these changes in human hippocampal connectivity due to theta phase relate to memory processing. Nonetheless, by demonstrating phase dependence of input receptivity in the human hippocampus, this study suggests a homology with the phase dependence previously characterized in rodent models in relation to memory encoding and retrieval. These findings thus suggest evolutionary conservation of the oscillatory mechanism for gating hippocampal input that is important for supporting these memory processes.
Materials and Methods
Electrode localization
sEEG electrodes were localized using MRIcron (v1.0.20190902; Rorden & Brett, 2000) and the Statistical Parametric Mapping package (SPM12; Penny et al., 2011). Pre-implant T1-weighted structural MRI and post-implant computed tomography (CT) were acquired as part of clinical care. For each subject, we performed tissue-type segmentation on the MRI (with default SPM12 tissue probability maps and warping parameters; see Ashburner & Friston, 2005; Mechelli et al., 2005) then normalized the MRI to MNI space (ICBM Average Brain template MNI152; Mazziotta et al., 1995). We applied this same transformation to the CT, which had been co-registered to the MRI by normalized mutual information. We then localized electrodes within MNI space by visual inspection of the CT. The anatomical location of each electrode was confirmed by atlas-guided inspection of the MRI (Allen Human Brain Atlas; Ding et al., 2016). We were unable to obtain imaging data for one subject and therefore relied on the electrode localization provided by the clinical team (comprising surrounding tissue type and anatomical structure for each electrode).
sEEG recording and stimulation
sEEG depth electrodes (∼1-mm diameter, ∼2-mm contact length, 5-10-mm contact spacing; AD-Tech, Oak Creek, WI) were implanted prior to study participation according to clinical need. Recordings were acquired using a Neuralynx ATLAS system with a scalp electrode reference and ground. Data were recorded at a resolution of 0.15 μV (5000 μV input range) and a sampling rate of 20 kHz or 32 kHz. Digital bandpass filters (FIR) from 0.1 to 5000 Hz were applied at the time of recording. Data were re-referenced offline to the common average of ipsilateral depth electrodes (Zhang & Jacobs 2015, Van Der Meij et al., 2012) and downsampled to 1 kHz. Data were epoched about stimulation pulses and baseline corrected (epoch: -750 ms to 500 ms, baseline: -750 ms to -2 ms). To prune excessively noisy or artifactual data, epochs were excluded according to their signal range (excluded if > 800 μV) and kurtosis (excluded if > 2 SD over channelwise mean kurtosis). Channels were excluded from analyses if < 200 epochs remained following pruning.
Electrical stimuli were generated with a Grass Instruments S88 stimulator in conjunction with CCU1 constant current units and SIU5 stimulus isolators. Stimulation was delivered across two adjacent lateral temporal sEEG electrodes. The electrical stimulus comprised a constant-current, symmetric-biphasic square wave with 5 mA intensity and 0.6 ms total duration. Stimulation polarity was reversed across the two electrodes such that stimulation on the lateral electrode was anodic-leading and stimulation on the medial electrode was cathodic-leading. For simplicity we refer to each electrical stimulus as a “single pulse.”
Stimulation electrodes used for the experiment were selected during a preliminary stimulation session to identify electrodes with hippocampal functional connectivity (i.e., for which stimulation would evoke downstream hippocampal EPs) and for which stimulation would not be clinically problematic. Potential stimulation electrode pairs were identified in lateral temporal cortex and adjacent white matter based on well-characterized structural and functional connectivity of these regions with ipsilateral entorhinal cortex and hippocampus (Insausti et al., 1987; Catani & Thiebaut de Schotten, 2008; Zhong & Rockland, 2003). Of these, we excluded electrodes where stimulation provoked seizure or afterdischarges during clinical testing. To evaluate functional connectivity with hippocampus, trains of stimulation were delivered to each potential electrode pair (0.5 Hz; 30 pulses per pair). Mean evoked potentials (EPs) for each hippocampal electrode were visualized in real-time and manually inspected. The lateral temporal electrode pair for which stimulation elicited the largest mean EP for hippocampal electrodes was selected for the experimental protocol.
Participants remained in bed throughout the preliminary stimulation session and experimental session. They were not instructed to perform any task and were free to rest or otherwise occupy themselves. Study protocols were approved by the Northwestern University Institutional Review Board. All subjects provided written informed consent prior to participation.
Theta phase estimation
We estimated hippocampal theta (3 – 8 Hz) phase at the time of stimulation onset for each trial. This was done separately for each electrode because theta phase shifts across space in the hippocampus. In depth penetrations of rodent CA1, theta phase is stable through the strata oriens and pyramidale then undergoes a gradual phase shift, resulting in a 180° phase difference at the fissure compared to dorsal layers (Brankačk et al., 1993; Bragin et al., 1995). Rodent hippocampal theta phase has been found to fully reverse between the longitudinal poles (Patel et al., 2012) (i.e., the ‘traveling wave’ model (Patel et al., 2012; Lubenov & Sjapas, 2009). Monotonic phase shift across the long axis has also been demonstrated to occur within individual CA subfields (Lubenov & Sjapas, 2009). In local field potentials (LFPs) recorded along the human hippocampus via implanted depth electrodes, theta phase has been found to shift monotonically across the hippocampal long axis (Zhang & Jacobs, 2015). Studies of hippocampal theta in rodent models often estimate phase at the stratum lacunosum-moleculare of CA1, near the hippocampal fissure. Besides the benefit of fissural theta’s especially high amplitude (Brankačk et al., 1993), this approach provides a unitary measure of hippocampal theta phase. In humans, it is not feasible to control for these spatial phase shifts by recording uniformly at any specific site in hippocampus. This is because electrodes are placed according to clinical need, and their locations vary across subjects in both laminar depth and location on the long axis.
LFPs recorded from human depth electrodes generally reflect a sum of phase-asynchronous laminar inputs (West & Gunderson, 1990) weighted by distance from the contributing layer to the electrode. As the phase shift is stable across layers and septotemporal distance (Lubenov & Sjapas, 2009), phase at a given electrode has a consistent offset to other hippocampal sites (Zhang & Jacobs, 2015). Thus, to account for this offset, we estimated phase independently for each electrode. First, trial epochs were truncated at +50 ms (i.e., 50 ms following stimulation onset) to avoid contamination of the phase estimate by the stimulation EP. After applying a zero-phase bandpass-filter (3-8 Hz 2nd-order Butterworth IIR), we estimated phase angle at the time of stimulation onset using the Hilbert transform.
We assessed the accuracy of this approach using stimulation-free pseudotrials. For each hippocampal electrode, we first performed zero-phase bandpass filtering (3-8 Hz, 2nd-order Butterworth IIR) across a continuous stimulation-free period (from the same recording as used in the main analysis). We then applied the Hilbert transform to obtain ground-truth phase angles for each timepoint. We created stimulation-free trials by pseudorandomly selecting trial-length epochs during this stimulation-free period. We observed the ground-truth phase values at the timepoints corresponding to each trial’s mock stimulation onset. Epochs from the first and last 5s of the recording sessions were excluded to reduce filter edge artifact contamination.
Next, we created an ostensibly phase-balanced model of stimulation for each channel by binning stimulation trials at 90° intervals (centered at 0°, 90°, 180°, and 270°) and computing the grand average across bins. We added this model stimulation to each stimulation-free trial, yielding pseudotrials. We estimated pseudotrial phase angle at t=0 using the approach described for stimulation trials and compared the estimates to the ground truth phase angles.
Quantification of hippocampal EPs
As a measure of the hippocampal response to stimulation, we quantified the trialwise amplitudes of early and late components in the stimulation EP. We first estimated component timecourses for each electrode. To avoid phase-dependent differences in component shape or timecourse from biasing this estimate (i.e., in the case of non-uniform stimulation phase distributions), we computed a phase-balanced EP for each electrode by binning stimulation trials according to theta phase at stimulation onset (at 90° intervals, centered at 0°, 90°, 180°, and 270°) and computing the mean across bins. We then observed the grand average phase-balanced trial across electrodes. We quantified component timecourses by searching for the first two negative minima following stimulation artifact (on a search window of +20 ms to +500 ms after stimulation; see e.g., Kubota et al., 2013) on the grand average trial across electrodes. Component edges were estimated as the nearest inflection points within 150 ms of the local maximum. For each trial, we computed the average signal amplitude across each component timecourse. This method was selected rather than peak estimation (as in e.g. Matsumoto et al. 2004) in order to produce a more noise-indifferent estimate for single trials.
Circular-linear analysis of theta phase and hippocampal response amplitude
We performed circular-linear analyses to determine whether the hippocampal response varied continuously with theta phase at stimulation onset. For each electrode, we found the circular-linear correlation coefficient between phase at stimulation onset and component amplitude (Berens, 2009). We z-scored these values via permutation testing (n = 500), wherein each electrode’s trial phase values and component amplitudes were repeatedly randomly paired. The circular-linear correlations were evaluated using a one-sample t-test comparing the electrode z-scores against zero.
Comparison of hippocampal EPs following stimulation at theta peak versus trough
To test how specific phase angles were related to hippocampal responsiveness to stimulation, we analyzed trials according to theta phase at stimulation onset. We hypothesized that hippocampal response to stimulation would be maximal at the theta trough and minimal at the theta peak (Brankačk et al., 1993; Hasselmo et al., 2002). To address this, we estimated local broadband theta phase at stimulation onset for each trial and binned trials to 90° intervals, centered on peak, trough, rising and falling phase angles. By taking the means within the 0° and 180° bins, we obtained average peak and trough stimulation trials for each electrode. We then compared component amplitudes across peak and trough trials using a paired t-test.
Comparison of stimulation trials to phase-matched stimulation-free trials
Direct comparison of component amplitudes according to phase at stimulation onset is complicated because oscillatory phase necessarily predicts future amplitude, regardless of any phase-dependent differences in the effects of stimulation on EPs. We therefore used stimulation-free trials to account for the ongoing theta oscillation. Stimulation-free trials were captured for each electrode at 100-ms intervals across stimulation-free periods at the beginning and end of the recordings. Stimulation-free trials were recorded and preprocessed using the same approach as stimulation trials (for trial pruning by kurtosis, kurtosis scores were compared only to other stimulation-free trials from the same channel). Phase was estimated for each trial at t = 0 using the same methods as for stimulation trials (i.e., truncating at +50 ms after stimulation onset, filtering, and applying the Hilbert transform). In order to more closely match the non-evoked activity present in the stimulation trials, we randomly resampled stimulation-free trials using the phase angle distributions of the stimulation trials as sampling weights.
Timepoint analysis of EP amplitude following stimulation at theta peak versus trough
As a follow-up to our analysis of peak versus trough effects on component amplitudes, we investigated whether phase dependence was temporally restricted to components. For each electrode, we computed the difference between average peak and trough trials at each timepoint. To assess the contribution of the non-evoked signal to over time, we repeated this procedure on stimulation-free trials. To measure phase dependence related to the evoked signal, we compared peak-trough amplitude differences across stimulation and stimulation-free trials.
Oscillatory synchronization between the stimulation site and hippocampus
Although we estimated hippocampal theta phase angle at the time of stimulation onset to avoid bias from the evoked response, this timepoint is not the most relevant to hippocampal receptivity to external input. As stimulation was applied to lateral temporal network afferents and conveyed via polysynaptic signaling, there was likely some latency between stimulation onset and the relevant transmission to hippocampus (i.e., the timepoint when entorhinal input receptivity would be relevant).
Oscillatory synchronization (i.e., phase coupling) is a known mechanism that supports interregional communication (see Fries, 2005; Fell & Axmacher, 2011). We therefore estimated this latency by observing theta phase locking and phase offset between the stimulation site and hippocampus. First, we estimated 3 – 8 Hz theta phase angle for each electrode across a continuous, stimulation-free period in the recording. For each timepoint, we then obtained the angular distance between each hippocampal electrode and its corresponding lateral temporal electrode that was used for stimulation. We thereby computed the phase-locking value (PLV; mean resultant vector length of lateral temporal-hippocampal angular distance on the unit circle) and mean phase offset (the circular mean of lateral temporal-hippocampal angular distances) for each hippocampal electrode.
We applied the Rayleigh test to the mean phase offsets to assess whether the phase lag distribution was uniform. We used permutation testing to determine whether the observed phase locking was greater than expected by chance. To achieve this, we broke the continuous hippocampal and lateral temporal phase estimates into 500-ms epochs. We then obtained the mean PLV across all epochs. To z-score these PLVs, we used permutation testing (n = 500), wherein hippocampal and lateral temporal epochs were repeatedly randomly paired. We performed a one-sample t-test comparing z-scores against zero to assess phase locking.
Acknowledgements
We thank the participants and their families for generously volunteering their time to enable this research. We thank Ania Holubecki and the staff of the Northwestern Memorial Hospital Epilepsy Monitoring Unit for coordinating data collection. We thank Dr. Christina Zelano, Dr. Matt Oh, and Dr. John Disterhoft for their helpful comments and feedback. This work was supported by the National Institutes of Health through the National Institute of Neurological Disorders and Stroke (R01NS113804) and the National Institute of Mental Health (F31MH125577). The content is solely the responsibility of the authors and does not necessarily represent the official view of the National Institutes of Health.
Footnotes
Conflict of interest statement: The authors declare no competing financial interests.


