

Abstract
FOXP3+ regulatory T cells (Tregs) are key for immune homeostasis. Tregs are a heterogenous population, however mechanisms regulating their transition from naïve to effector Tregs (eTregs) are poorly understood. Here, we reveal a novel role for nuclear receptor corepressor 1 (NCOR1) in effector Tregs (eTregs). NCOR1 represses an effector signature in naïve Tregs and NCOR1-deficiency increases the fraction of eTregs at steady-state accompanied with an upregulation of cholesterol biosynthesis pathways. Mechanistically, NCOR1-deficiency in murine and human Tregs results in enhanced expression of MYC, an essential driver of eTreg differentiation, resulting in enrichment of MYC target genes. Disruption of the interaction of liver X receptors (LXRs), crucial regulators of cholesterol biosynthesis, with NCOR1 by an LXR agonist leads to increased MYC expression in in vitro generated WT Tregs. Functionally, NCOR1 deficiency in Tregs compromises their ability to protect mice from severe weight loss and intestinal inflammation in adoptive CD4+ T cell transfer colitis. Our data uncover that an LXR-NCOR1 axis regulates eTreg differentiation, and that NCOR1 restrains MYC expression and eTreg differentiation and positively controls effector functions of Tregs.
Introduction
Regulatory T cells (Tregs) that express the transcription factor Forkhead box protein P3 (FOXP3) play a crucial role in mediating immune tolerance to self-antigens, regulating the interaction between the host and its commensal flora and are essential for tissue repair 1. Deficiency or aberrant function of Tregs triggers autoimmunity and inflammation 2, 3. Therefore, the development of these cells as well as their effector functions have to be tightly regulated 4, 5, 6. The transcription factor FOXP3 is required for the generation, identity, and suppressive function of Tregs, and loss of FOXP3 leads to fatal systemic autoimmunity in mice and humans 7, 8. Upon stimulation, naïve Tregs (also known as resting Tregs) undergo differentiation into effector Tregs (eTreg) (also known as activated Tregs or effector memory Tregs) thereby acquiring distinct phenotypes and effector molecules 9, 10, 11. eTregs exhibit enhanced suppressive function compared to naïve Tregs and maintain immune tolerance and homeostasis 12. The conversion of naïve Tregs into eTregs is accompanied by metabolic reprogramming including increased use of aerobic glycolysis instead of oxidative phosphorylation. This cellular change is necessary for eTreg function and for the supply of biosynthetic material needed for proliferation and expansion of these cells 13. However, the transcriptional pathways controlling eTreg generation are still poorly understood.
The nuclear receptor co-repressor 1 (NCOR1) is a transcriptional regulator bridging chromatin modifying enzymes with transcription factors 14. We and others have recently identified NCOR1 as an important regulator of T cell development as T cell specific deletion of NCOR1 resulted in impaired survival of positively selected NCOR1-null TCRβhiCD69+/− thymocytes. Furthermore, NCOR1-deficiency affected T cell development leading to reduced numbers of peripheral T cells including Tregs 15, 16. Leng and colleagues also identified a role for NCOR1 in repressing the pro-apoptotic factor BIM in signaled double-positive thymocytes, thereby hindering thymocyte survival during positive selection 15. These data indicate that NCOR1 is essential during T cell development and for the generation of the peripheral T cell pool. Furthermore, NCOR1 regulates transcriptional programs and effector functions in activated Th1 and Th17 cells 17. However, whether NCOR1 controls the function of Tregs has not been investigated so far.
To study the role of NCOR1 in Tregs we employed conditional gene targeting approaches. We crossed Ncor1f/f mice with Cd4-Cre mice to delete NCOR1 in all peripheral T cells (Ncor1f/fCd4-Cre, designated as NCOR1-cKO throughout the text) or with Foxp3-YFP-Cre mice to delete selectively in Tregs (Ncor1f/fFoxp3-YFP-Cre; designated as NCOR1-cKOFoxp3) and analyzed Treg generation, Treg transcriptomes and Treg function in vitro as well as in vivo in adoptive transfer colitis. Moreover, we assessed NCOR1 function in human Tregs using CRISPR-Cas9 mediated deletion approaches. With these experimental strategies we identify NCOR1 as key regulatory molecule in controlling the differentiation and function of eTregs in mouse and human.
Results
Increased frequencies of effector Tregs in NCOR1-cKO mice
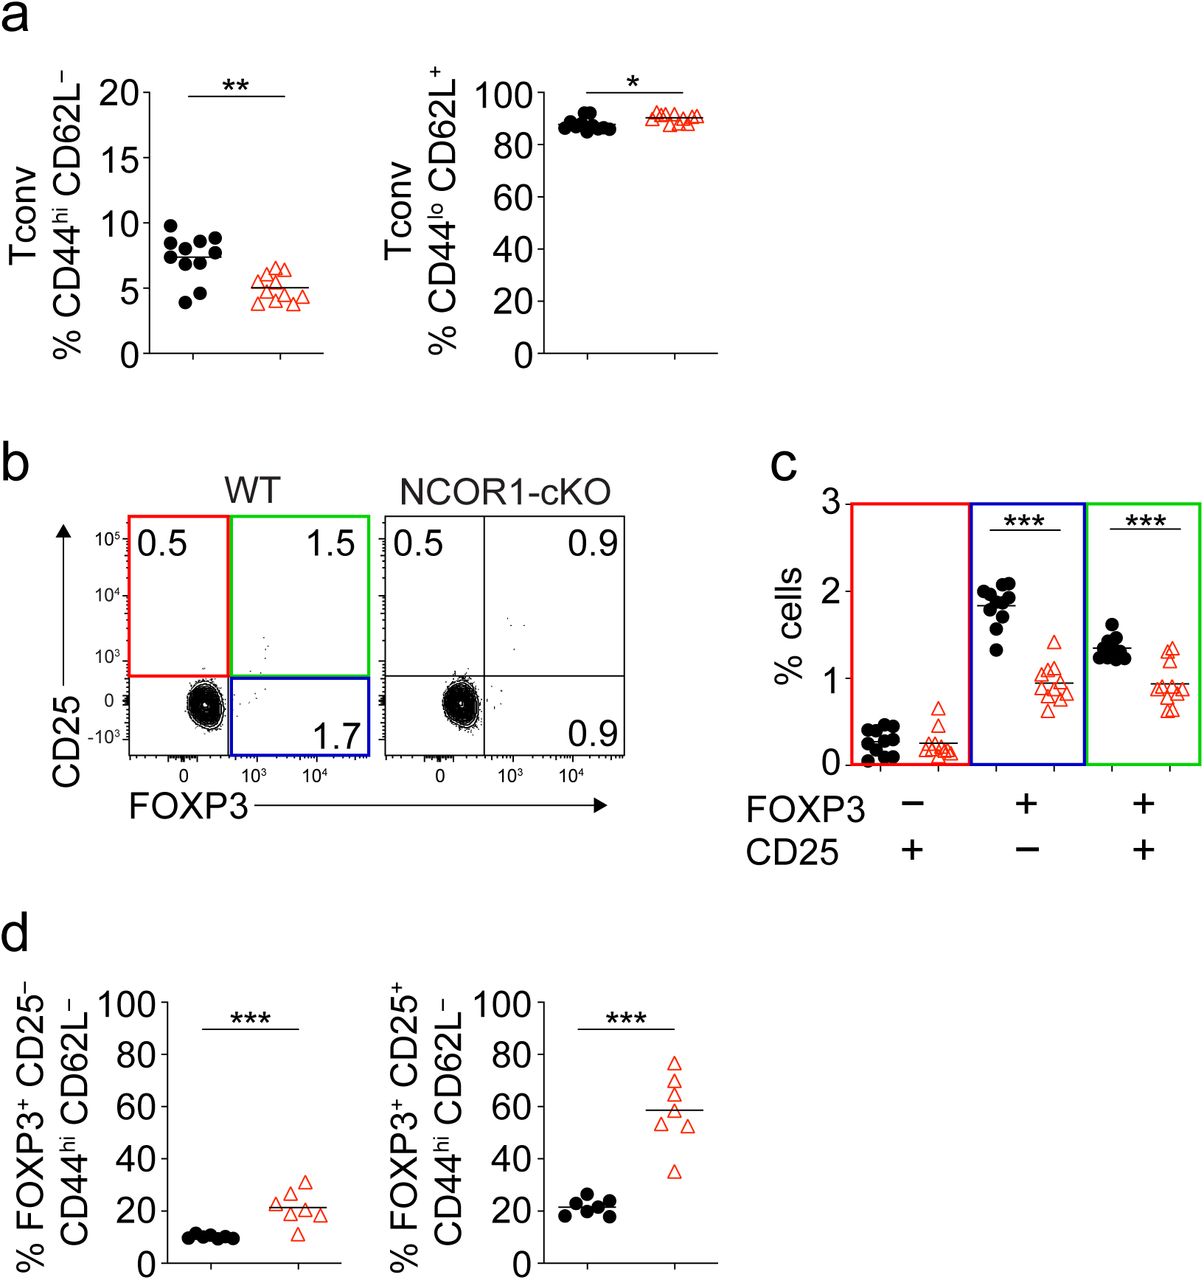
NCOR1 is an essential factor regulating the survival of developing thymocytes and as a consequence deletion of NCOR1 in T cells results in a drop in peripheral T cell numbers, including Tregs 16, 17 Furthermore, NCOR1 is orchestrating transcriptional landscapes and effector functions of Th1 and Th17 cells 16, 17. To investigate whether NCOR1 activity is also important for regulatory T cell subset differentiation and function, we characterized Tregs in Ncor1f/f, Cd4-Cre mice (designated as NCOR1-cKO). Similar to conventional T cells, Tregs can be subdivided based on CD44 and CD62L expression into naïve (CD44loCD62L+) and activated/effector (CD4hiCD62L−) populations 10. We observed an increase in the fraction of CD44hiCD62L− effector Tregs (eTregs) and a corresponding decrease of CD44loCD62L+ naïve Tregs in the spleen (Fig. 1a and 1b), LN and mLN (Supplementary Fig. 1a and 1b) in the absence of NCOR1. The relative increase in eTregs in NCOR1-cKO mice also correlated with an elevated expression of KLRG1 and CD69, two markers characteristic for activated/effector Tregs 18, 19, 20, 21, while the fraction of CD25+ cells within the FOXP3+ Treg population was decreased. Moreover, we detected higher percentages of ICOS-expressing Tregs in NCOR1-cKO mice, and NCOR1-deficient Tregs expressed elevated levels of GITR in LN and mLN Tregs (Supplementary Fig. 1c and 1d). However, total numbers of naïve and effector Tregs were reduced in NCOR1-cKO mice (Fig. 1c). This is due to the overall reduction of Tregs, caused by the drop in CD4+ T cells as well as the relative reduction of Tregs within the CD4+ T cell population in NCOR1-cKO mice, as previously reported 16, 17. Of note, there was no increase in CD44hiCD62L− effector subsets within the conventional CD4+ T cell population, in fact effector subsets were slightly reduced (Supplementary Fig. 2a). These data indicate that the deletion of NCOR1 changes the ratio of naïve and effector Tregs at steady state.

(a) Flow cytometry analysis of splenocytes isolated from WT and NCOR1-cKO mice showing CD44 and CD62L expression in CD4+FOXP3+ cells at steady-state. (b) Diagram showing percentage of CD44hiCD62L− and CD44loCD62+ cells of all mice analyzed as described in (a). (c) Diagrams show total cell numbers of CD44hiCD62L− and CD44loCD62+ cells of all mice analyzed as described in (a). (d) Experimental immunization strategy: mice were s.c. injected with NP-KLH and draining LNs were analyzed six days later. (e) Flow cytometry analysis of cells isolated from draining LN of NP-KLH-immunized WT and NCOR1-cKO mice showing the expression of PD-1, CXCR5 and FOXP3 on CD4+CD44hi cells. (f) Diagram showing percentage of Tfh cells (CD4+CD44hiPD1+CXCR5+) and Tfr cells (CD4+CD44hiPD1+CXCR5+FOXP3+) of all mice analyzed as shown in (d,e). (g) Diagrams show total cell numbers of Tfh cells (CD4+CD44hiPD1+CXCR5+) and Tfr cells (CD4+CD44hiPD1+CXCR5+FOXP3+) of all mice analyzed as shown in (d,e). (a,e) Numbers indicate the percentages of cells in the respective quadrants or gates. (a-c) Cells were pre-gated on CD4 and FOXP3. (b,c,f,g) Each symbol indicates one mouse. Horizontal bars indicate the mean. *P < 0.05, **P < 0.01, and ***P < 0.001 (unpaired 2-tailed Student’s t test). Data are representative (a,e) or show the summary (b,c,f,g) of at least 11 (b) or 12 (e) mice that were analyzed in at least 3 independent experiments.
Next, we analyzed whether the increase in effector subsets is already observed during Treg differentiation in the thymus. Thymic Tregs develop from CD4SP CD25+ progenitor cells which start to express FOXP3 22, 23, although FOXP3 can also be induced in CD4SP cells before CD25 expression 24. In the NCOR1-cKO CD4SP population both CD25+FOXP3+ and CD25−FOXP3+ subsets were reduced in comparison to WT CD4SP cells (Supplementary Fig. 2b and 2c), indicating that the relative reduction of Tregs within the CD4+ T cell population in NCOR1-cKO mice is in part due to a differentiation defect in the thymus. There was an increase in CD44hiCD62L− cells within both the CD25− and CD25+ fraction of the FOXP3+ CD4SP population in NCOR1-cKO mice (Supplementary Fig. 2d). These data indicate that NCOR1 controls the relative abundance of naïve and effector Treg subsets already during the generation of Tregs in the thymus.
T follicular regulatory T (Tfr) cells represent a subset of peripheral eTregs that are induced during an immune response. Tfr cells are defined as CXCR5+PD1+CD44hi CD4+ T cells that express FOXP3 25, 26, 27. To test whether the generation of Tfr cells is enhanced in vivo during an immune response in the absence of NCOR1, WT and NCOR1-cKO mice were immunized s.c. with NP-KLH (nitrophenole keyhole limpet hemocyanin) mixed with Alum. T cell subsets were analyzed in the draining LNs (dLNs) after 6 days (Fig. 1d). Upon immunization, similar percentages of CXCR5+PD1+CD44hi T follicular helper (Tfh) cells were induced within the CD4+ T cell population in WT and NCOR1-cKO mice (Fig. 1e and 1f). In contrast, the fraction of Tfr cells was increased in NCOR1-cKO mice (Fig. 1d and 1f), which is consistent with our observation that eTregs were increased within the total Treg population at steady state. Of note, total numbers of CXCR5+PD1+CD44hi Tfh cells were slightly reduced while the total number of Tfr cells were similar between WT and NCOR1-cKO mice (Fig. 1g). Together, these data suggests that NCOR1 restrains the generation of activated/effector Tregs at steady state and upon immunization.
Treg-intrinsic functions for NCOR1 in regulating the ratio of naïve to effector Tregs
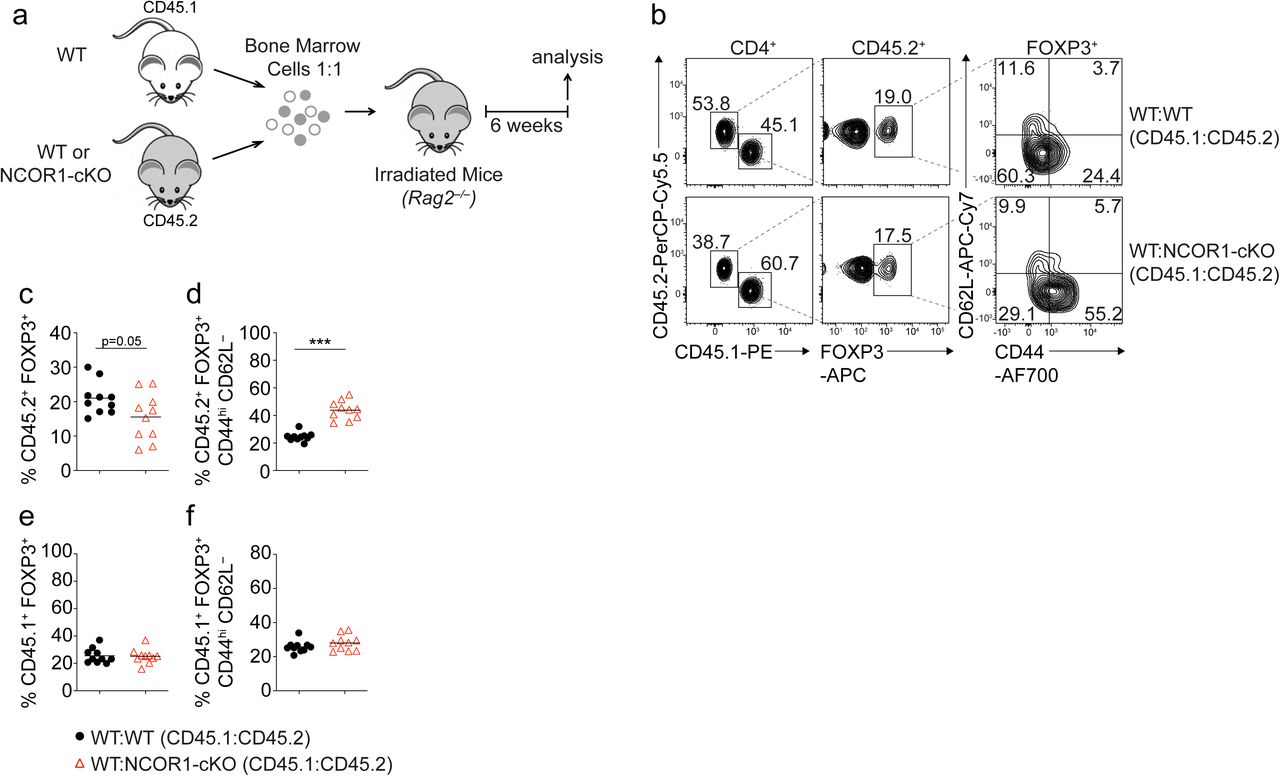
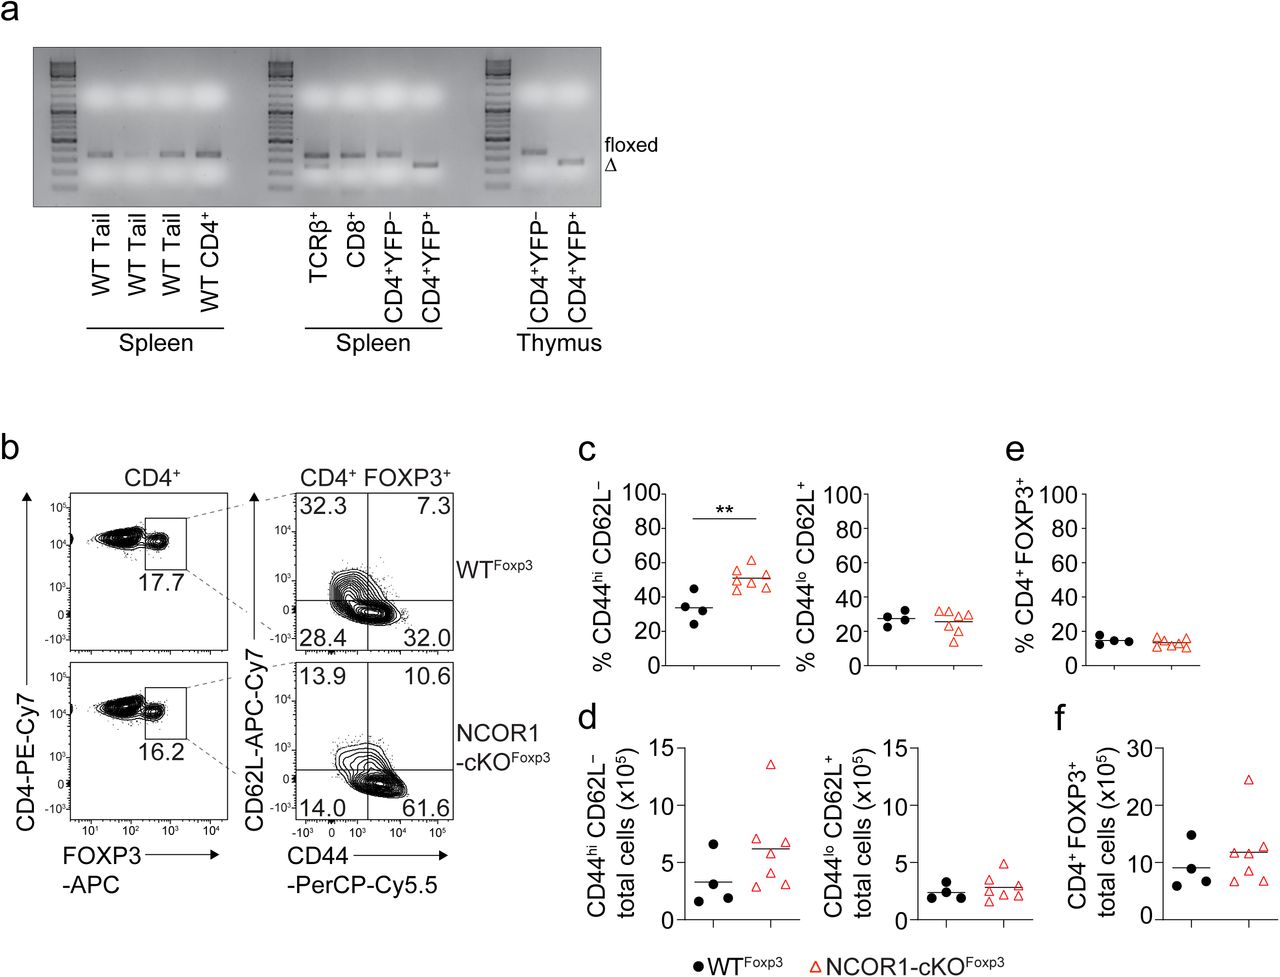
To test whether the increase of eTregs is due to a Treg-intrinsic requirement for NCOR1, we generated mixed bone marrow chimeric mice. For this experiment, we transferred a 1:1 mix of either WT (CD45.1+) and NCOR1f/f (WT; CD45.2+) or WT (CD45.1+) and NCOR1-cKO (NCOR1-cKO; CD45.2+) bone marrow cells into irradiated Rag2−/– mice and analyzed recipient mice 6 weeks after reconstitution (Fig. 2a). In mixed BM chimeric mice, we detected reduced percentages of Tregs within the CD4+CD45.2+ cell population in the spleen (Fig. 2b and 2c) of NCOR1-cKO CD45.2+ cells compared to WT CD45.2+ cells. Within the CD45.2+ FOXP3+ Treg population, the CD44hiCD62L− eTreg subset was increased in the absence of NCOR1 compared to the WT CD45.2+ Treg population (Fig. 2b and 2d). In contrast, there were similar percentages of CD44hiCD62L− cells in FOXP3+CD45.1+ CD4+ T cells in WT:WT and WT:NCOR1-cKO BM chimeric mice (Fig. 2e and 2f). To further exclude the possibility of Treg-extrinsic effects upon Ncor1 deletion in Cd4-Cre mice, we took advantage of the Treg-specific Foxp3-YFP-Cre deleter strain 28 to delete Ncor1 (Ncor1f/f Foxp3-YFP-Cre mice, designated as NCOR1-cKOFoxp3). Indeed, we observed a Treg-specific deletion of the Ncor1 alleles in Ncor1f/f YFP+ (i.e. FOXP3+) cells isolated from NCOR1-cKOFoxp3 mice (Supplementary Fig. 3a), although we cannot formally exclude a stochastic activation of Foxp3-Cre in non-Tregs in some mice as previously reported for other targeted gene loci 29. In line with the results from NCOR1-cKO mice, Treg-specific deletion of Ncor1 resulted in a relative increase in splenic CD44hiCD62L− eTregs compared to WTFoxp3 (Ncor1+/+ Foxp3-YFP-Cre) mice (Supplementary Fig. 3b and 3c), while the total cell numbers of CD44hiCD62L− eTregs were slightly but not significantly increased (Supplementary Fig. 3d). In contrast to Ncor1 deletion in Cd4-Cre mice, deletion of Ncor1 in Foxp3-Cre mice did not alter the frequencies or total numbers of CD4+FOXP3+ cells (Supplementary Fig. 3e and 3f). Together, these data indicate that the increase of eTreg subsets in NCOR1-cKO mice is Treg-intrinsic. Moreover, these data show that NCOR1 controls the generation of naïve and effector Treg subsets in already lineage-established FOXP3+ Tregs.

(a) Experimental strategy for generating bone marrow chimeric mice. (b) Flow cytometry analysis showing the distribution of CD45.1+ and CD45.2+ cells as well as the expression of FOXP3, CD44 and CD62L in recipient mice injected with either WT:WT or WT:NCOR1-cKO BM mixtures. (c-f) Summary of all experiments as described in (a,b) showing the percentages of FOXP3+ cells (c,e) and CD44hiCD62L− and CD44loCD62L+ expressing cells (d,f) within the (c,d) CD45.2+ population and the (e,f) CD45.1+ population isolated from the spleen of recipient Rag2−/– mice injected with either WT:WT or WT:NCOR1-cKO BM cell mixtures. (b) Numbers indicate the percentages of cells in the respective quadrants or gates. (c-f) Cells were pre-gated on CD4. Each symbol indicates one mouse. Horizontal bars indicate the mean. *P < 0.05, **P < 0.01, and ***P < 0.001 (unpaired 2-tailed Student’s t test). Data are representative (b) or show a summary (c-f) of 10 mice that were analyzed in 2 independent experiments.
NCOR1 represses an effector Treg gene signature in naïve Tregs
As described above, NCOR1 deletion resulted in an altered naïve to effector Treg subset distribution. To reveal the underlying NCOR1-dependent transcriptional changes, we performed low-input RNA sequencing (RNA-seq) 30. Due to the low breeding efficiency of NCOR1-cKOFoxp3 mice in our mouse facility and the very low number of mice obtained, all RNA-seq experiments were performed using the Cd4-Cre deleter strain. To isolate regulatory T cells without the requirement for intracellular FOXP3 detection, we crossed WT and NCOR1-cKO mice to the DEREG Foxp3-eGFP reporter strain, in which GFP expression is driven by Foxp3 regulatory elements 31. To exclude differences in transcriptomes due to the different naïve and effector Treg ratio in WT and NCOR1-cKO, we sorted naïve (CD44loCD62L+) and effector (CD44hiCD62L−) Treg subsets and sequenced them separately (Fig. 3a). We detected a total of 2744 genes being differentially expressed (FDR ≤ 0.05) in NCOR1-deficient naive Tregs compared to naïve WT Tregs, with 1103 genes up- and 1641 genes downregulated in the absence of NCOR1 (Fig. 3b and 3c). RNA-seq of effector Treg subsets revealed that 1325 genes were differentially expressed (FDR ≤ 0.05) between NCOR1-deficient and WT eTregs. Of these genes, 704 were upregulated and 621 were downregulated in the absence of NCOR1.

(a) Strategy for RNA-sequencing: cells from spleen and LNs were isolated and FOXP3+CD44hiCD62L− and FOXP3+CD44loCD62L+ cells were FACS-sorted and sequenced using the Illumina HiSeq 3000 platform. (b) Volcano plots depict a comparison of global gene expression profiles between naïve (CD44loCD62L+) WT and NCOR1-cKO Tregs (left plot) and effector (CD44hiCD62L−) WT and NCOR1-cKO Tregs (right plot). On the x-axis log2-fold change is plotted (FDR ≤ 0.05) while the y-axis indicates p-values (-log10). 1641 genes were downregulated and 1103 genes were upregulated in naïve NCOR1-cKO Tregs. 621 and 704 genes were down- and upregulated, respectively, in effector NCOR1-cKO Tregs. (c) Venn diagrams showing a comparison of up- and downregulated genes in naïve versus effector NCOR1-cKO Tregs compared to the corresponding WT Treg subsets. (d) Gene set enrichment analysis (GSEA) plots of an “effector Treg gene set” (containing a list of 100 genes) in naïve NCOR1-cKO Tregs compared to naïve WT Tregs. (e) Gene set enrichment analysis (GSEA) plots of a “naïve Treg gene set” (containing a list of 100 genes) in effector NCOR1-cKO Tregs compared to effector WT Tregs. (d,e) Barcodes indicate the location of the members of the gene set in the ranked list of all genes. NES, normalized enrichment score in WT Tregs compared to NCOR1-cKO Tregs. A list of the “naïve Treg gene set” and the “effector Treg gene set” is provided in Supplementary Table 1.
Since eTregs are increased in NCOR1-cKO mice, we next addressed the question whether NCOR1 deficiency in naïve Tregs results in the induction of transcriptional signatures characteristic for effector Treg subsets. For this we defined an “effector Treg gene set” based on our RNA-seq data that contained the top 100 genes upregulated (based on FC differences, FDR ≤ 0.05) in effector WT Tregs compared to naïve WT Tregs (see Supplementary Table 1 for the list of genes). Using this pre-defined gene set, Gene Set Enrichment Analysis (GSEA) 32 revealed an enrichment of this “effector Treg gene set” in naïve NCOR1-cKO Tregs compared to naïve WT Tregs (Fig. 3d and Supplementary Fig. 4a). This indicates that Ncor1 deletion leads to an upregulation of an effector gene signature already in naïve NCOR1-cKO Tregs (defined on the basis of CD44 and CD62L expression). Moreover, GSEA revealed an enrichment of a “naïve Treg gene set“ (i.e. the top 100 genes upregulated in WT naïve Tregs compared to WT eTregs) in effector NCOR1-cKO Tregs (Fig. 3e and Supplementary Fig. 4b). Taken together, NCOR1-cKO Tregs with a classical CD44loCD62L+ naive Treg phenotype display transcriptional features associated with effector Tregs that are not detected in naïve WT Tregs.
Increased Myc expression in NCOR1-deficient Tregs
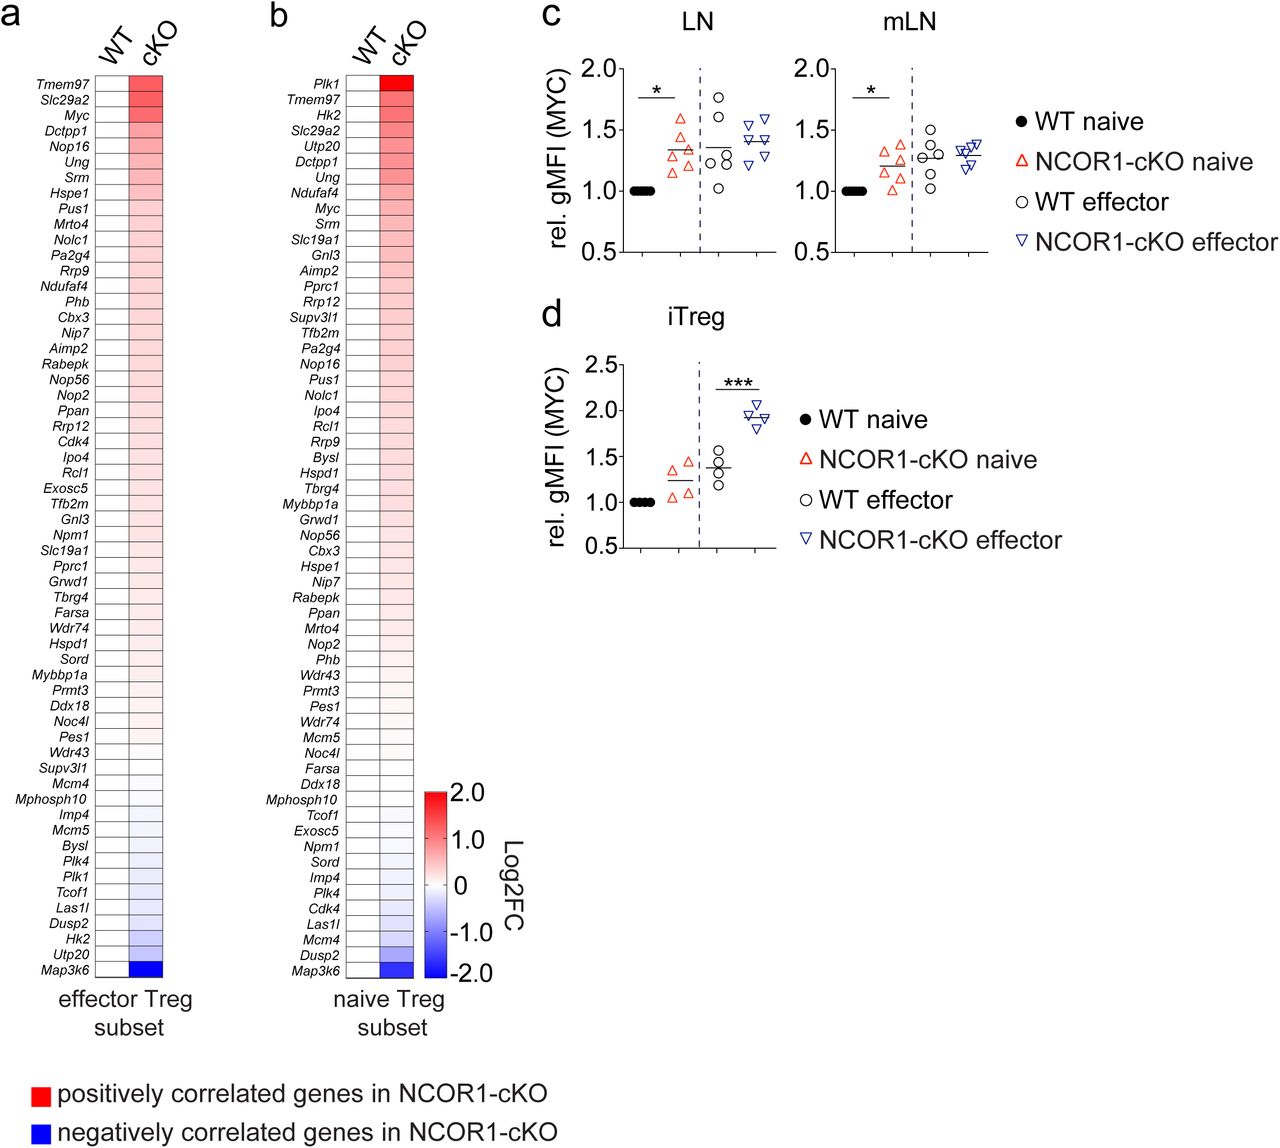
To identify pathways and hallmark gene sets that are altered in the absence of NCOR1, additional GSEA using the Molecular Signatures Database (MSigDB) was performed. This resulted in the identification of several gene sets that were either enriched or underrepresented in the absence of NCOR1 (a list of all identified hallmark gene sets from this analysis can be found in Supplementary Table 2 and 3). Among the altered gene sets we identified a positive correlation of “MYC target genes v.2” gene sets in NCOR1-cKO eTregs compared to their WT counterparts (Fig. 4a) and these gene sets appeared to be also enriched in the naïve Treg subset although it did not reach statistical significance (Fig. 4b). The transcription factor MYC plays a key role in the transitions to an eTreg state as well as in metabolic programming of eTregs 33, 34. Therefore, we examined the expression of this gene set consisting of 54 genes in more detail. We detected a strong upregulation of a substantial number of MYC targets genes (as well as a downregulation of few target genes) in naïve and effector Tregs isolated from NCOR1-cKO compared to WT Tregs (Supplementary Fig. 5a and 5b). Myc was expressed at higher levels in naïve WT Tregs in comparison to effector WT Tregs (Fig. 4c), and Myc expression was upregulated both in naïve and in effector NCOR1-cKO Tregs compared to the corresponding WT subsets (Fig. 4c). The upregulation of Myc mRNA also resulted in increased MYC protein levels in naïve NCOR1-cKO Tregs isolated from the spleen (Fig. 4d and 4e), LNs and mLNs (Supplementary Fig. 5c). Moreover, MYC protein levels were also enhanced in splenic eTregs (Fig. 4d and 4e) but not in NCOR1-cKO eTregs isolated from LNs and mLNs (Supplementary Fig. 5c). Furthermore, we observed an upregulation of MYC protein in in vitro generated NCOR1-deficient iTregs (Supplementary Fig. 5d). Together, these data indicate that NCOR1 negatively regulates the expression of Myc in Tregs.

(a) Gene set enrichment analysis (GSEA) plots of “MYC target genes v. 2” (containing 54 genes) in effector NCOR1-cKO Tregs compared to effector WT Tregs. (b) Gene set enrichment analysis (GSEA) plots of “MYC target genes v. 2” in naive NCOR1-cKO Tregs compared to naive WT Tregs. (a,b) Barcodes indicate the location of the members of the gene set in the ranked list of all genes. NES, normalized enrichment score in WT Tregs compared to NCOR1-cKO Tregs. A list of all “MYC target genes v. 2” is provided in Supplementary Figure 5. (c) Summary showing Myc gene expression levels (values shown as fragments per kilobase of transcript per million mapped reads; FPKM) in naïve and effector WT and NCOR1-cKO Tregs as determined by RNA-seq. (d) Histograms showing MYC expression as determined by flow cytometry in splenic naïve and effector WT and NCOR1-cKO Tregs. (e) Summary of (d) showing MYC expression in splenic naïve and effector WT and NCOR1-cKO Tregs. Summary graph depicts MYC expression levels as geometric mean fluorescence intensity (rel. gMFI). For each experiment, naïve WT levels were set as 1 and relative gMFI of MYC is shown. (c,e) Each symbol indicates one mouse. Horizontal bars indicate the mean. *P < 0.05, **P < 0.01, and ***P < 0.001 (ordinary 1-way ANOVA analysis followed by Tukey’s multiple-comparisons test; for simplicity, significant differences are shown only between WT and NCOR1-cKO Tregs). Data are representative (d) or show a summary (c,e) of 6 mice that were analyzed in 2 independent experiments.
An LXRβ agonist induces MYC expression in iTregs
To further assess transcriptional changes in the absence of NCOR1, a pathway analysis was performed 35. This indicated a strong upregulation of pathways and genes associated with cholesterol biosynthesis in naïve and effector NCOR1-cKO Treg subsets (Supplementary Fig. 6a and 6b, Supplementary Table 4 and 5), similar to observations previously made in conventional naïve NCOR1-cKO CD4+ T cells 17. The upregulation of cholesterol pathway genes in NCOR1-deficient Tregs did not lead to accumulation of membrane cholesterol as revealed by comparable Filipin III staining intensities between NCOR1-cKO CD4+CD25+ Tregs and WT Tregs (Supplementary Fig. 6c). However, the ATP-binding cassette transporters Abca1 and Abcg1, important regulators of cholesterol efflux 36, were upregulated in naïve (Abca1) and effector (Abca1, Abcg1) NCOR1-cKO Tregs (Supplementary Fig. 6d). Together, these data indicate that, despite an elevated cholesterol biosynthesis pathway in NCOR1-cKO Tregs, there is no accumulation of membrane-inserted cholesterol, likely due to enhanced cholesterol export caused by increased expression of Abca1 and Abcg1.
The liver X receptor (LXR) is a nuclear receptor which acts as cholesterol sensor and crucial regulator of cholesterol biosynthesis 37. Two isoforms of LXR, namely LXRα (encoded by the Nr1h3 gene) and LXRβ (encoded by Nr1h2) are known 38, 39. Naïve and effector WT Tregs displayed high expression of Nr1h2 but virtually no expression of Nr1h3 and this isoform-specific expression pattern was maintained in NCOR1-cKO Tregs compared to WT Tregs (Fig. 5a). In the absence of LXR ligands, NCOR1 interacts with LXR and inhibits the expression of LXR target genes 40, 41. Upon agonist binding NCOR1 dissociates from LXR, leading to the activation of LXR and the expression of its target genes 42. We hypothesized that agonist-induced disruption of the LXRβ-NCOR1 interaction in Tregs would result in enhanced MYC expression. To test this hypothesis, we differentiated naïve WT CD4+ T cells into Tregs in vitro (iTregs) in the presence of the LXR agonist GW3965 43. Indeed, GW3965 treatment resulted in an upregulation of MYC expression in iTregs already at low concentrations (Fig. 5b and 5c), similar to MYC upregulation as observed in NCOR1-cKO Tregs. In addition, the fraction of CD44hi cells was slightly increased, while no change in the fraction of CD62L+ Tregs was detected (Supplementary Fig. 6e). GW3965 treatment did also not alter the percentage of FOXP3+ cells and only mildly affected cell viability and proliferation at low concentrations (up to 4µM) (Supplementary Fig. 6e). These data suggest a link between LXRβ-NCOR1 signaling and MYC expression and hence the transition from naïve to effector Tregs.

(a) Summary showing the expression levels (values shown as fragments per kilobase of transcript per million mapped reads; FPKM) of Nr1h3 (LXRα) and Nr1h2 (LXRβ) in naïve and effector WT and NCOR1-cKO Tregs as determined by RNA-seq. (b) Flow cytometry analysis showing the expression of MYC in CD4+FOXP3+ iTregs that have been generated in the presence of 8µM GW3965 compared to mock-treated (DMSO) iTregs. Cells were pregated on total viable (c) Diagram shows the summary of MYC expression in CD4+FOXP3+ iTregs that have been generated in the presence of various concentrations of GW3965 compared to mock-treated (DMSO) iTregs. (a,c) Each symbol indicates one sample. Horizontal bars indicate the mean. *P < 0.05, **P < 0.01, and ***P < 0.001. ((a) ordinary 1-way ANOVA analysis followed by Tukey’s multiple-comparisons or (c) unpaired 2-tailed Student’s t tests comparing respective GW3965-treated sample with mock (DMSO)-treated control). Data are representative (b) or show a summary (c) of at least 8 independent samples that were analyzed in at least 3 independent experiments.
NCOR1 is essential for Treg-mediated protection against intestinal inflammation
To assess whether the increase in the fraction of eTregs results in enhanced Treg function in vivo, we employed an adoptive CD4+ T cell transfer colitis model, in which CD4+ T cell-mediated disease in recipient Rag2-deficient mice is accompanied by several pathological changes including body weight reduction, infiltration of immune cells and loss of colonic crypt structure. Co-transfer of Tregs suppresses T cell-mediated autoimmune diseases and prevents immune pathology 44. Therefore, naive WT CD4+ T cells (Tconv) (CD45.1+) were transferred into Rag2−/– mice together with Tregs that were isolated from either WT, DEREG or NCOR1-cKO, DEREG mice (CD45.2+) (Fig. 6a) and recipient mice were monitored over a period of 8 weeks. Mice that co-received NCOR1-cKO Tregs lost significantly more weight compared to mice co-receiving WT Tregs, and the weight loss upon transfer of NCOR1-deficient Tregs was similar to mice that received naïve CD4+ T cells only (Fig. 6b). Although colon length was not significantly different in any of the groups analyzed (Fig. 6c), the increased weight loss of mice co-transferred with NCOR1-cKO Tregs also correlated with a more severe colonic inflammation compared to mice co-transferred with WT Tregs, indicated by a disruption of crypt structures and enhanced T cell infiltration (Fig. 6d).

(a) Experimental protocol for adoptive transfer colitis. Control groups received CD4+ Tconv cells only (as indicated) or no cells at all (not shown). (b) Weight scores in percentages of initial body weight during the course of colitis in Rag2−/− recipient mice are shown. Data show the summary of at least 8 mice (except control groups with 6 mice) of 3 independent experiments. *P < 0.05, **P < 0.01, and ***P < 0.001 (2-way ANOVA analysis followed by Tukey’s multiple-comparisons test). For simplicity, significant differences are shown only between WT and NCOR1-cKO Tregs. Of note, uninjected control mice gained significantly more weight compared to all groups starting from week 5. (c) Summary showing lengths of colons isolated from Rag2−/− recipient mice. (d) Colon swiss rolls were processed for H&E staining. The pictures in the bottom represent a 5x magnification of the black rectangle framed section in the top pictures. Magnification: 40x and 200x. Scale bar = 100µm. One representative picture is shown per condition.
To understand the cellular basis of why NCOR1-deficient Tregs failed to protect against colitis, we characterize lymphocyte subsets in recipient Rag2−/– mice including small intestinal intraepithelial lymphocytes (SI-IEL), lamina propria cells (SI-LP) as well as lymphocytes from spleen and mesenteric LNs (mLNs). There was a tendency (although not statistically significant) that relative frequencies of NCOR1-deficient FOXP3+ Tregs were reduced within the SI-IEL and SI-LP cell population, although total Treg numbers were comparable in mice receiving WT or NCOR1-cKO Tregs (Fig. 7a and 7b). However, NCOR1-cKO Tregs were significantly reduced in spleen and mLNs of recipient mice compared to WT Tregs (Fig. 7b). We also detected no differences in the frequencies or numbers of effector Tconv cells (CD45.1+) (Fig. 7c), or in the percentages of IL-17A+, IFNγ+ and IL-17A+IFNγ+ expressing CD4+ T cells in recipient mice that either received WT or NCOR1-deficient Tregs (Supplementary Fig. 7a and 7b). Together, these data suggest that the failure of NCOR1-deficient Tregs to protect recipient mice from CD4+ T cell adoptive transfer colitis might be caused by a functional impairment of intestinal NCOR1-deficient Tregs following transfer. This indicates that NCOR1 is required for Treg function in vivo. However, our data do not rule out that the reduction in NCOR1-cKO Tregs residing in the spleen and mLNs additionally contributes to disease development.

(a) Flow cytometry analysis of SI-LP cells isolated from WT and NCOR1-cKO mice showing percentage of viable CD4+, CD45.2+FOXP3− and CD45.1−FOXP3+ cells. (b) Diagrams depicting the summary of the percentages (upper panel) and numbers (lower panel) of CD45.2+FOXP3+ cells isolated from SI-IEL, SI-LP, spleen and mLNs of recipient Rag2−/– mice injected with WT CD45.1+CD4+ T cells together with either WT or NCOR1-cKO Tregs. (c) Diagrams showing summary of the percentage (upper panel) and numbers (lower panel) of CD4+CD45.1+ cells isolated from SI-IEL, SI-LP, spleen and mLNs of Rag2−/– mice injected with either WT Tregs, NCOR1-cKO Tregs or injected with CD4+ Tconv cells only. (a) Numbers indicate the percentages of cells in the respective gate. (b,c) Each symbol indicates one mouse. Horizontal bars indicate the mean. *P < 0.05, **P < 0.01, and ***P < 0.001 ((b) unpaired 2-tailed Student’s t test or (c) ordinary 1-way ANOVA analysis followed by Tukey’s multiple-comparisons test). Data are representative (a) or show a summary (b,c) of at least 8 mice (except control groups with 6 mice) that were analyzed in 3 independent experiments.
NCOR1 controls MYC expression in human CD4+ T cells under Treg-inducing conditions
To determine whether NCOR1 also controls MYC expression and eTreg differentiation in human Tregs, we deleted NCOR1 in human CD4+ T cells cultured in Treg-inducing conditions using CRISPR-Cas9 mediated knockout approaches. Loss of NCOR1 led to an increase in the fraction of human CD4+ T cells that expressed high-levels of MYC (Fig. 8a and 8b). Among the population of MYChi human CD4+ T cells, there was an increase in the percentage of FOXP3-expressing cells in the absence of NCOR1 when compared to CD4+ T cells treated with non-targeting (NT)-sgRNAs (Fig. 8a and 8b). However, in contrast to murine Tregs, MYC protein levels in FOXP3+ cells were similar between NCOR1-deficient and WT CD4+ T cells. To test whether loss of NCOR1 changes the distribution of naïve and effector populations also in human T cells, we analyzed the expression of CD45RA and CD45RO to distinguish naïve (CD45RA+CD45RO−) from effector/memory (CD45RA−CD45RO+) T cells 45, 46. There was a slight reduction of NCOR1-deficient human CD4+ T cells cultured in Treg-inducing condition with a CD45RA+CD45RO− naïve expression phenotype (Fig. 8c and 8d), although no change was detected in the frequency of CD45RA−CD45RO+ effector Tregs after NCOR1 deletion. Moreover, CD27, a marker whose downregulation is associated with an effector phenotype in CD4+ T cells 47, was downregulated in NCOR1 knockout human CD4+ T cells (Fig. 8c and 8d).

(a) Flow cytometry analysis showing FOXP3 and MYC expression in human CD4+ T cells cultured under iTreg conditions after CRISPR-Cas9 mediated deletion of NCOR1 (NCOR1-sgRNA) or in non-targeting control samples (NT-sgRNA). (b) Diagrams show the summary of the experiments as described in (a). gMFI of MYC within MYChi cells is shown. (c) Flow cytometry analysis showing CD45RA, CD45RO and CD27 expression in human iTregs after CRISPR-Cas9 mediated deletion as described in (a). (d) Diagrams show the summary of the experiments described in (c). (a,c,) Cells were pregated on total viable cell population. (b,d) Each symbol indicates one sample. Horizontal bars indicate the mean. *P < 0.05, **P < 0.01, and ***P < 0.001; unpaired 2-tailed Student’s t test (b,d). Data are representative (a,c) or show the summary (b,d) of samples from 4 individual healthy donors which were analyzed in one experiment.
Together these data indicate a cross-species conservation of NCOR1 function in the control of MYC expression levels as well as the generation of effector Tregs in mouse and human CD4+ T cells. Furthermore, the data indicate that deletion of NCOR1 in human CD4+ T cells promotes the generation of FOXP3+ T cells.
Discussion
In this study we demonstrate that NCOR1 is a key regulator of Treg subset homeostasis and moreover, we identified NCOR1 as an important mediator of effector Treg differentiation at steady-state as well as during an immune response, as indicated by an increase in Tfr cells localized in the germinal centers 26, 48. NCOR1 functioned in a Treg-intrinsic manner, revealing a novel role for NCOR1 in the regulatory T cell lineage. Furthermore, Treg-specific deletion of Ncor1 using the Foxp3-Cre deleter strain showed that NCOR1 controls Treg subset homeostasis after Treg lineage induction has been initiated. This rules out that changes in effector Treg differentiation are due to developmental alterations during positive/negative selection of double-positive thymocytes as well as the reduced survival of single-positive cells in NCOR1-cKO mice, as previously described 15, 16. Of note, in contrast to Ncor1f/f Cd4-Cre mice 16, there was no overall decrease in the percentage of the FOXP3+ T cell population in NCOR1-cKOFoxp3 mice compared to WTFoxp3 mice at steady state. This suggests that Treg survival is not dependent on NCOR1 once Treg lineage differentiation has been initiated, at least at steady-state.
Our study also identified NCOR1 as a key regulator of Treg transcriptomes. Although NCOR1 is part of transcriptional repressor complexes 40 and thus one would have expected more genes up-than downregulated, a similar number of genes was up- and downregulated in NCOR1-cKO eTreg subsets compared to WT eTregs. In naïve Tregs, the number of upregulated genes was even lower than the number of downregulated genes. Overall, this is reminiscent of our previous observations made in naïve CD4+ T cells as well as in Th1 and Th17 cells 17. These data indicate that in T cells NCOR1 is also associated with transcriptional activation. Our transcriptome data revealed increased expression of Myc upon loss of NCOR1, which also resulted in elevated expression levels of MYC protein. Consequently, GSEA analysis showed an enrichment of MYC target genes, both in naïve and effector NCOR1-deficient Treg subsets. MYC is an essential driver for the differentiation of eTregs but is dispensable for the maintenance of the eTreg pool 33. We therefore speculate that higher expression of MYC in naïve NCOR1-deficient Tregs results in an increased fraction of eTregs. Our GSEA data support this hypothesis and the observed upregulation of an “effector Treg gene set” in naïve Tregs indicates a “priming” of naïve NCOR1-deficient Tregs towards the acquisition of an effector phenotype. Interestingly, a “naive Treg gene set” was enriched in NCOR1-deficient eTregs. Thus, NCOR1-cKO Tregs that upregulated CD44 (CD44hi) and downregulated CD62L (CD62L−) and hence are classified as eTregs still have transcriptional features of naïve Tregs in comparison to WT eTregs. This also suggests that some NCOR1-deficient Tregs, despite upregulating certain effector markers, might not represent fully functional eTregs.
Effector Treg subsets have a higher suppressive activity and are crucial for maintaining immune homeostasis in peripheral tissues 12. Therefore, one might have predicted that the increase in eTregs results in an enhanced suppressive function of the NCOR1-deficient Treg population. Interestingly, in an adoptive CD4+ T cell transfer colitis model 44, co-transferred NCOR1-cKO Tregs failed to protect recipient mice from weight loss and intestinal tissue damage in comparison to co-transferred WT Tregs. There was an overall decrease of NCOR1-deficient Tregs in recipient mice, although the extent and whether the difference was statistically significant varied among various lymphoid tissues. We detected a strong decrease of NCOR1-cKO Tregs in mLNs after transfer colitis. Since it is known that Tregs home to mLNs early after transfer and proliferate there until colon inflammation is resolved 49 one might speculate that the failure to prevent colitis is caused by the reduction in Treg numbers in gut-draining LNs. However, intestinal Treg numbers were not changed within the SI-IEL population and SI-LP cells, suggesting that the disease was aggravated due to an impaired suppressive function of Tregs in the absence of NCOR1. This is further supported by our RNA-Seq analysis, since NCOR1-deficient effector Tregs still display certain transcriptional signatures of naïve Tregs. This observation suggests functional impairment of NCOR1-deficient Tregs and indicates that NCOR1 controls the suppressive activity of Tregs.
LXRα and LXRβ are key transcription factors of the nuclear receptor family controlling the expression of genes required for cholesterol and lipid metabolism. In the absence of activating ligands, LXR target genes are repressed due to their interaction with NCOR1 and associated repressor complexes that contain chromatin modifying molecules such as HDAC3 37, 40, 41. LXRβ regulates T cell proliferation and function and is crucial for maintaining cholesterol homeostasis in T cells 50. Several pathways associated with cholesterol biosynthesis were upregulated in NCOR1-deficient Tregs pointing to an activation of LXR-mediated transcriptional circuits and hence to the induction of (some) LXR target genes. T cells express LXRβ but not LXRα 50 and this isoform-specific expression pattern was maintained in NCOR1-deficient Treg cells. Furthermore, treatment of WT iTregs with the LXR agonist GW3965 phenocopied the increased expression of MYC as observed in NCOR1-cKO Tregs and in human CD4+ T cells with an NCOR1 knockdown. Based on these data we propose that the LXRβ-NCOR1-axis controls expression levels of MYC and the differentiation of effector Tregs. Disruption of the LXRβ-NCOR1 complex, either by deletion of Ncor1 or by agonist treatment, enhances eTreg differentiation. Of note, LXRβ-deficient Tregs, in a bone marrow chimeric setting, exhibit decreased expression of CD44 and increased expression of CD62L 51. However, this decrease in eTregs (based on CD44 and CD62L expression) might be an indirect effect, since LXRβ also controls fitness and functionality of activated Tregs 51. Further studies are warranted to determine how LXRβ and NCOR1 containing complexes control MYC expression in Tregs.
In summary, NCOR1 restrains eTreg differentiation while positively regulating Treg function. Thus, our study uncovers a dual role of NCOR1 in the Treg lineage.
Materials and Methods
Animal models
Animal experiments were evaluated by the ethics committees of the Medical University of Vienna and approved by the Austrian Federal Ministry for Education, Science and Research (GZ:BMBWF-66.009/0039-V/3b/2019, GZ:BMBWF-66.009/0326-V/3b/2019). Animals were maintained in research facilities of the Department for Biomedical Research at the Medical University of Vienna. Animal husbandry and experiments were performed under national laws in agreement with guidelines of the Federation of European Laboratory Animal Science Associations (FELASA), which correspond to Animal Research: Reporting of in vivo Experiments from the National Center for the Replacement, Refinement and Reduction of Animals in Research (ARRIVE) guidelines. Ncor1f/f mice were kindly provided by Johan Auwerx. Cd4-Cre mice were kindly provided by Chris Wilson. Foxp3-Cre mice were kindly provided by Alexander Rudensky. Dereg mice were kindly provided by Tim Sparwasser. CD45.1+ and Rag2−/− mice were kindly provided by Jochen Hühn. Analyzed mice were 8–12 weeks of age and of mixed sex, except Foxp3-Cre mice of which only males were analyzed.
Genotyping of mice
The PCR for the Ncor1 deletion (floxed band: 346bp. delta band: 246bp) was carried out for 5 min at 96°C, followed by 39 cycles of 30 s at 94°C, 30 s at 56°C, and 1 min at 72°C. The PCR for the Cd4-Cre transgene (300bp) was carried out for 5 min at 96°C, followed by 39 cycles of 30 s at 94°C, 30 s at 56°C, and 1 min at 72°C. The PCR for the DEREG (GFP) transgene (450 bp) was carried out for 1 min at 96°C, followed by 35 cycles of 1 min at 94°C, 1 min at 60°C, and 1 min at 72°C. The PCR for the Foxp3-Cre transgene (346 bp) was carried out for 1 min at 94°C, followed by 34 cycles of 30 s at 94°C, 30 s at 60°C, and 45 s at 72°C. Primer: Ncor1 deletion forward: 5’-TTGGCCTTGGAGTAAATGCTGTGAG -3’. Ncor1 deletion reverse: 5’-GGAAACTACCTACCTGAATCCATGG-3’. Cd4-Cre forward: 5’-TCTCTGTGGCTGGCAGTTTCTCCA-3’. TCAAGGCCAGACTAGGCTGCCTAT-3’. Cd4-Cre DEREG reverse: 5’-forward: GCGAGGGCGATGCCACCTACGGCA-3’. GGGTGTTCTGCTGGTAGTGGTCGG-3’. DEREG Foxp3-Cre reverse: forward: 5’-5’-AGGATGTGAGGGACTACCTCCTGTA-3’. TCCTTCACTCTGATTCTGGCAATTT-3’. Foxp3-Cre reverse: 5’-
Purification of CD4+ T Cells
Cells from spleen, axillary, brachial, and inguinal lymph nodes were isolated, pooled and single cell suspensions were made using a 70μm cell strainer (Corning) in a 6-well plate (Sarstedt) containing PBS (Sigma) with 2% fetal bovine serum (FCS) (Biowest). Red blood cells were removed using BD Pharm Lyse (BD Biosciences). Cells were resuspended in PBS/FCS containing a mastermix of biotinylated antibodies (Gr-1, B220, NK1.1, CD11b, CD11c, CD8α, TER-119, CD44 and CD25). CD4+ T cells were enriched by negative depletion using magnetic streptavidin beads (MagniSort SAV Negative Selection beads; Invitrogen) according to the manufacturer’s instructions. Biotinylated antibodies against Ly-6G/Ly-6C (clone: RB6-8C5), CD45R/B220 (clone: RA3-6B2), NK1.1 (clone: PK136), CD11c (clone: N418), CD11b (clone: MEL1/70), CD8α (clone: 53–6.7), TER-119 (clone: TER-119), CD44 (clone: IM7) and CD25 (clone: PC61) were purchased from Biolegend. For some experiments cells were further FACS-sorted into naïve CD4+ T cells (CD25−CD44loCD62L+) on a SH800 (SONY).
Flow Cytometric analysis
Ex vivo isolated T cells and in vitro-cultured T cells were incubated with Fc-block (1:250; BD Biosciences) followed by surface staining. Dead cells were excluded using Fixable Viability Dye eFluor 506 or 780 (Thermo Fisher Scientific) according to the manufacturer’s protocol. For intracellular transcription factor and cytokine stainings, cells were fixed and permeabilized using the Foxp3 Staining Buffer Set (Thermo Fisher Scientific) according to the manufacturer’s protocol and stained with the appropriate antibodies. Cells were measured with a BD FACS Fortessa (BD Biosciences) and analyzed using FlowJo v10.2 software (TreeStar).
Flow cytometry antibodies
The following anti-mouse antibodies were used for flow cytometry: CD19 (clone: 6D5, Biolegend), CD25 (clone: PC61, BD Biosciences), CD4 (clone: RM4-5, Biolegend), CD44 (clone: IM7, Biolegend), CD45.1 (clone: A20, Biolegend), CD45.2 (clone: 104, Biolegend), CD62L (clone: MEL-14, Biolegend), CD69 (clone: H1.2F3, Thermo Fisher Scientific), CD8 (clone: 53-6.7, BD Biosciences), CXCR5 (clone: L138D7, Biolegend), FOXP3 (clone: FJK-16s, Thermo Fisher Scientific), GITR (clone: REA980, Miltenyi Biotec), ICOS (clone: 7E.17G9, Thermo Fisher Scientific), IFNγ (clone: XMG1.2, Biolegend), IL-17A (clone: TC11-18H10.1, Biolegend), KLRG1 (clone: 2F1, Biolegend), MYC (clone: Y69, Abcam), PD1 (clone: 29F.1A12, Biolegend), TCRβ (clone: H57-597, Thermo Fisher Scientific).
The following anti-human antibodies were used for flow cytometry: CD45RA (clone: HI100, Biolegend), CD45RO (clone: UCHL1, Biolegend), CD25 (clone: BC96, Biolegend), CD27 (clone: O323, Biolegend). FOXP3 (clone: PCH101, eBioscience), MYC (clone: Y69, Abcam).
Adoptive Transfer Colitis
4 x 10⁵ FACS-sorted naive (CD25-CD44loCD62L+) CD4+ T cells from CD45.1+ congenic mice were injected i.p. into Rag2−/– mice together with either 1 x 10⁵ CD45.2+ FACS-sorted WT,DEREG or NCOR1-cKO,DEREG Tregs or injected with 4 x 10⁵ FACS-sorted CD4+ Tconv cells only. Control Rag2−/− mice did not receive any cells. Weight of the mice was monitored over a course of 8 weeks and mice were subsequently sacrificed for organ analysis. T cells were isolated from spleen and mLNs as described above, stained with appropriate antibodies and subjected to flow cytometric analysis. For SI-LP and SI-IEL isolation, small intestines (SIs) were isolated and stool and mucus were removed. The tissue was transferred into petri dishes, cut into small pieces and washed 3 times by addition of 40ml wash solution (1 X HBSS, HEPES-bicarbonate (pH 7.2) and 2% FBS) and vortexing for 15 seconds. The samples were filtered through 100 μm cell strainers and subsequently incubated in 20 ml EDTA solution (10% FBS, 1 X HBSS, 15 mM HEPES, 1 mM EDTA, pH 7.2) at 37°C whilst shaking at 200rpm. Subsequently, remaining tissue was digested in 30ml Collagenase solution (RPMI 1640 supplemented with 1mM MgCl2, 1mM CaCl2, 5% FBS, and 100 units/ml collagenase D (Gibco, Thermo Fisher Scientific) for 1 hour, followed by a Percoll (Sigma) gradient centrifugation at 2000rpm for 30 minutes at room temperature. Cells from the gradient were collected, washed and resuspended in PBS supplemented with 2% FCS. Cells were further stained with Fixable Viability Dye eFluor 506 (Thermo Fisher Scientific) and appropriate antibodies and subjected to flow cytometric analysis. For intracellular cytokine detection cells were stimulated with 25 ng/ml PMA and 750 ng/ml ionomycin (both Sigma-Aldrich) in the presence of GolgiStop (BD Biociences). For histological analysis, swiss rolls 52 were prepared from colons of diseased mice as described before 53.
Histology Microscopy
Fixed tissue samples were preceded with a tissue processor (Thermo Fisher Scientific). For hematoxylin and eosin (H&E) stainings, histologic evaluation was performed on 5μm thick sections and stained with hematoxylin and eosin. High power field images (i.e. 400x magnification) were collected from each colon tissue. At least 4 loci were examined from each slide to ensure unbiased analysis.
Generation of Bone Marrow Chimeric mice
Mixed bone marrow chimeric mice were generated as previously described 54. After six weeks, reconstituted mice were sacrificed and organs were collected as described above. Cells were further stained with Fixable Viability Dye eFluor 506 (Thermo Fisher Scientific) and appropriate antibodies and subjected to flow cytometric analysis.
Immunization studies
WT and NCOR1-cKO mice were injected via the footpad with 10µg NP-KLH (Keyhole Limpet Hemocyanin) (Biosearch Technologies) together with 10µl Imject™ Alum Adjuvant (Thermo Fisher Scientific). 6 days later, the popliteal (draining) lymph node was isolated and single cell suspension was prepared as described above. Cells were further stained with Fixable Viability Dye eFluor 506 (Thermo Fisher Scientific) and appropriate antibodies and subjected to flow cytometric analysis.
Low input RNA Sequencing of ex vivo isolated Tregs
CD4+ T cells were isolated from spleen and lymph nodes as described above and between 5 x 10⁴ and 5 x 10⁵ CD4+eGFP+CD44hiCD62L− (eTreg) and CD4+eGFP+CD44loCD62L+ (naïve Treg) cells from either WT,DEREG or NCOR1-cKO,DEREG mice were FACS purified. Total RNA was prepared from cell lysates using the RNeasy Mini Kit (Qiagen) and RNase-Free DNase Set (Qiagen) according to manufacturer’s protocol. Three biological replicates were generated for each genotype and Treg subset. Each biological replicate was prepared with pooled cells isolated from three individual mice. RNA and library concentrations were determined using Qbit 2.0 Fluorometric Quantitation (Life Technologies). RNA and library integrities were determined using Experion Automated Electrophoresis System (Bio-Rad). Library preparation and RNA Sequencing were performed by the Biomedical Sequencing facility at CeMM (Research Center for Molecular Medicine Vienna, Austria) using low-input Smart-seq2 30. The libraries were sequenced using the Illumina HiSeq 3000 platform and the 50-bp single-read configuration.
Bioinformatic analysis of RNA Sequencing data
Raw sequencing data were processed with Illumina2 bam-tools 1.17 to generate sample-specific, unaligned BAM files. Sequence reads were mapped onto the mouse genome assembly build mm10 (a flavor of GRCm38) using TopHat 2.0.13 55. Gene expression values (reads per kilobase exon per million mapped reads) were calculated with Cufflinks 2.2.1 56. Volcano plots were generated using GraphPad Prism. Downstream pathway analysis was performed using the gene set enrichment analysis (GSEA) tools provided by the Broad Institute 32 or ingenuity pathway analysis (IPA) (QIAGEN Inc.) 35.
iTreg differentiation culture
Enriched naïve CD4+ T cells were isolated from WT,DEREG and NCOR1-cKO,DEREG mice (8-12 weeks) as described above and cultured in a 48-well plate (500.000 cells/well) (Sarstedt) in T cell medium supplemented with 2ng/ml TGFβ (R&D) and 100 U/ml rhIL-2 (PeproTech) in the presence of plate bound anti-CD3ε (1 μg/mL) (BD Biosciences) and anti-CD28 (3 μg/mL) (BD Biosciences). After 72h, cells were harvested and stained with Fixable Viability Dye eFluor 506 (Thermo Fisher Scientific) and appropriate antibodies and subjected to flow cytometric analysis.
Pharmacological activation of liver X receptor (LXR) using GW3965
iTreg cultures were performed as described and simultaneously treated with different concentrations of GW3965 (Sigma) diluted in DMSO (Sigma), as indicted. After 72h, cells were harvested and stained with Fixable Viability Dye eFluor 506 (Thermo Fisher Scientific) and appropriate antibodies and subjected to flow cytometric analysis.
Filipin III staining
Ex vivo isolated splenocytes were stained with anti-CD4 and anti-CD25 antibodies for 30 minutes in PBS supplemented with 2% FCS. After washing, cells were fixed with 2% formaldehyde in PBS for 1 hour at room temperature. After fixation, cells were washed three times and formaldehyde carryover was quenched using 1.5mg/ ml Glycine in PBS for 10 minutes at room temperature. After washing, cells were stained with Filipin III solution (50µg/ml) (Sigma) in PBS and incubated for 2 hours at room temperature. After staining, cells were washed three times and subjected to flow cytometric analysis.
CRISPR-Cas9 mediated deletion of NCOR1
All functional assays were performed in IMDM (Gibco, Thermo Fisher Scientific) supplemented with 10% of fetal calf serum (Gibco) and 10 μg/mL of gentamycin (Gibco). Peripheral blood draws were performed from healthy human volunteers in accordance with the Ethics Committee of the Medical University of Vienna (EC number EK 1150/2015). Mononuclear cells were isolated by standard Ficoll-Paque centrifugation. Naive human CD4+ T cells were isolated using the EasySep Human Naïve CD4 TCell Iso Kit II (Stem Cell Technologies) according to the manufacturers’ instructions. Purity of isolated cells was assessed by flow cytometry and found >95% for all specimen. Subsequently, CRISPR-Cas9 knockout of human NCOR1 was performed as described before 57. In detail, 1µL of a mixture of three NCOR1 specific crRNAs (Alt-R® CRISPR-Cas9 crRNA; total concentration 320µM; sequences: GGAATCGAAGCGACCACGTC TGG, TAACCAGCCATCAGATACCA AGG, CG GTGTTTCTGCTCCACAGG AGG; underlined is PAM sequence) were mixed with 1µL tracr RNA (320µM; all Integrated DNA Technologies, Newark, NJ, USA) and hybridized for 10 min at room temperature. The crRNA-tracr RNA duplex was subsequently complexed with 0.7µL recombinant Cas9 (Alt-R® S.p. Cas9 Nuclease V; 10µg/µL; IDT) for 30min at 37°C. Similarly, a control RNP complex was assembled using a non-targeting crRNA (Alt-R® CRISPR-Cas9 Negative Control crRNA #1; IDT). For electroporation, 1 x 10^6 purified naive T-cells were resuspended in 15µL buffer P3 + 5µL Supplement 1 (P3 Primary Cell 4D-NucleofectorTM X Kit S; Lonza) and mixed with 2.7µL RNP in the 16-well strips provided in the kit. Cells were electroporated on a 4D nucleofector (4D-Nucleofector Core Unit, 4D-Nucleofector X Unit; Lonza) using the pulse code EH100. Immediately afterwards, 80µl pre-warmed fresh medium was added to the cells. After a one hour resting period cells were transferred to 24-well plates and incubated for three days in medium containing 10U/mL recombinant human IL-2 (Peprotech) to allow establishment of the knockout. CRISPR-Cas9 knockout efficiency was determined by Sanger sequencing of the target sites of the three gRNAs and analyzed using the Synthego inference of CRISPR edits analysis tool (ICE v2 CRISPR Analysis Tool; Synthego, Menlo Park, CA). The knockout score defining frameshift insertions/deletions was found to be >65% for at least two of the three loci in all samples tested.
For polarization of induced regulatory T-cells (iTreg), cells were preincubated for 1 hour with 100 U/mL IL-2 (Peprotech) + 100 nM all trans retinoic acid (atRA, Sigma Aldrich) + 5 ng/mL TGF-b (PeproTech), stimulated with anti-CD3/anti-CD28 coated dynabeads (beads : cell ratio 1 : 2) and cultured for 7 days as described previously 58. After polarization, in vitro cultured cells were washed and resuspended in PBS supplemented with 2% FCS. Cells were further stained with appropriate antibodies and subjected to flow cytometric analysis. Intracellular staining for transcription factors was performed using the Foxp3 Staining Buffer Set (Thermo Fisher Scientific) according to the manufacturer’s protocol.
Statistical analysis
No statistical methods were used to predetermine the sample size. All statistical analyses were performed using Prism 8 Software (GraphPad Inc). As indicated in each figure legend, p-values were calculated using either unpaired two-tailed t-test, one-way or two-way ANOVA. No data were excluded and no specific randomization of animals or blinding of investigators was applied. The data shown indicate the mean.
Data availability
All data generated or analysed during the study are included in the manuscript. RNA Sequencing files have been submitted to the Gene Omnibus (GEO) database under the number GSE185984.
Author Contributions
V.S. helped with study design, performed the majority of the experiments, analyzed and interpreted the data, and co-wrote the manuscript. R.R, C.Z., T.P., P.H., D.H., M.A., L.M., D.W., A.H., B.A. and N.B. assisted with additional experiments. K.S. and T.F. performed CRISPR-Cas9 mediated deletion of NCOR1. M.S. and T.K. helped with preparation of RNA sequencing data and analysis. S.K., M.T., A.B. and C.B. provided critical input for the manuscript. W.E. designed and funded the project, interpreted the data, supervised the project, and co-wrote the manuscript. All authors reviewed the manuscript.
Supplementary Figures and Tables

(a) Diagrams showing summary of the percentage of CD44hiCD62L− and CD44loCD62L+ cells isolated from pLNs of WT and NCOR1-cKO mice. (b) Diagrams showing summary of the percentage of CD44hiCD62L− and CD44loCD62L+ cells isolated from mLNs of WT and NCOR1-cKO mice. (a,b) Cells were pregated on CD4. (c) Histograms displaying expression of CD25, CD103, KLRG1, ICOS, CD69 and GITR in WT and NCOR1-cKO Tregs isolated from spleen, pLNs and mLNs. (d) Diagrams showing the summary of all analysis performed as shown in (c). For GITR gMFI levels, WT expression levels were set as 1 and relative gMFI on NCOR1-cKO Tregs was calculated. (a,b,d) Each symbol indicates one mouse. Horizontal bars indicate the mean. *P < 0.05, **P < 0.01, and ***P < 0.001 (unpaired 2-tailed Student’s t test). Data are representative (c) or show a summary (a) (b) (d) of at least 6 mice analysed in at least 2 independent experiments

(a) Diagrams showing summary of the percentages of CD44hiCD62L− and CD44loCD62L+ Tconv (CD4+FOXP3−) cells isolated from the spleen of WT and NCOR1-cKO mice. (b) Flow cytometry analysis showing FOXP3 and CD25 expression of thymocytes isolated from WT and NCOR1-cKO mice. (c) Diagram showing percentage of FOXP3−CD25+, FOXP3+CD25− and FOXP3+CD25+ thymocytes of all mice analyzed as described in (b). (d) Diagrams showing summary of thymic FOXP3+CD25−CD44hiCD62L− and FOXP3+CD25+CD44hiCD62L− cells isolated from WT and NCOR1-cKO mice. (b-d) Thymocytes were pregated on CD4+.

(a) Representative agarose gel picture showing Ncor1 deletion PCR in WT tail samples and FACS-sorted WT CD4+ splenocytes (left panel), TCRß+, CD8+, CD4+YFP− and CD4+YFP+ cells isolated from the spleen of NCOR1-cKOFoxp3 mice (middle panel) and CD4+YFP− and CD4+YFP+ cells isolated from the thymus (right panel) of NCOR1-cKOFoxp3 mice. Two mice were pooled for sorting. Size floxed band: 346bp. Size Δ band: 246bp. (b) Flow cytometry analysis showing FOXP3, CD44 and CD62L expression on splenic CD4+ T cells isolated from WTFoxp3 and NCOR1-cKOFoxp3 mice. (c) Diagrams show summary of the percentage of splenic CD44hiCD62L− and CD44loCD62L+ cells isolated from WTFoxp3 and NCOR1-cKOFoxp3 mice. (d) Diagrams show summary of total cell numbers of splenic CD44hiCD62L− and CD44loCD62L+ cells isolated from WTFoxp3 and NCOR1-cKOFoxp3 mice. (e) Diagrams show summary of the percentage of splenic CD4+FOXP3+ cells isolated from WTFoxp3 and NCOR1-cKOFoxp3 mice. (f) Diagrams show summary of total cell numbers of splenic CD4+FOXP3+ cells isolated from WTFoxp3 and NCOR1-cKOFoxp3 mice.

(a) Heatmap of gene expression values of an “effector Treg” gene set in naïve NCOR1-cKO Tregs compared to naïve WT Tregs. (b) Heatmap of gene expression values of a “naïve Treg” gene set in effector NCOR1-cKO Tregs compared to effector WT Tregs. (a,b) Log2FC of NCOR1-cKO Tregs compared to WT Tregs is shown. WT levels were set as 1 for each gene. A list of the “naïve Treg” gene set and the “effector Treg” gene set is provided in Supplementary Table 1.

(a,b) Heatmap of gene expression values of “MYC target genes v. 2” in (a) effector and (b) naïve NCOR1-cKO Tregs compared to WT Tregs. (c) Summary showing MYC protein expression (rel. gMFI) expression in naïve and effector WT and NCOR1-cKO Tregs isolated from pLNs and mLNs. (d) Summary showing MYC expression (rel. gMFI) in naïve and effector WT and NCOR1-cKO iTregs. For gMFI calculations, naïve WT levels were set as 1 and relative gMFI of MYC is shown. (c,d) Each symbol indicates one mouse. Horizontal bars indicate the mean. *P < 0.05, **P < 0.01, and ***P < 0.001 (ordinary 1-way ANOVA analysis followed by Tukey’s multiple-comparisons test; for simplicity, significant difference is shown only between WT and NCOR1-cKO Tregs). Data are summary of at least 4 mice that were analyzed in at least 2 independent experiments.

(a) Diagram showing top 5 pathways which are up- or downregulated in naïve (left) and effector (right) NCOR1-cKO Tregs, as revealed by Ingenuity Pathway Analysis (QIAGEN Inc.). The lower x-axis indicates the p-value. The upper x-axis indicates percentage of genes dysregulated in this particular pathway. The number next to the bar indicates the number of genes in this pathway. A list of all pathways identified by Ingenuity Pathway Analysis is provided in Supplementary Table 4 and 5. (b) Summary showing the expression levels (values showing as fragments per kilobase of transcript per million mapped reads; FPKM) of genes controlling cholesterol biosynthesis in naïve and effector WT and NCOR1-cKO Tregs as determined by RNA-seq. (c) Summary showing Filipin III staining (rel. gMFI) in WT and NCOR1-cKO Tregs pregated on cells expressing CD4 and CD25. For gMFI calculation, WT levels were set as 1 and relative gMFI of Filipin III is shown. (d) Summary showing FPKM values of Abca1 and Abcg1 in naïve and effector WT and NCOR1-cKO WT Tregs as determined by RNA-seq. (e) Summary of experiments performed as described in Fig. 5b, showing percentage of FOXP3+CD44hi cells, FOXP3+CD62L− cells, FOXP3+ cells and viable cells. The right diagram indicates the percentage of FOXP3+ cells which underwent ≥ 1 cell division that have been treated with GW3965 or DMSO (as mock control). (b) Each bar represents 3 mice per group. (c,d,e) Each symbol indicates one mouse (c,d) or one sample (e). (b-d) Horizontal bars indicate the mean. *P < 0.05, **P < 0.01, and ***P < 0.001 (b,d) ordinary 1-way ANOVA analysis followed by Tukey’s multiple-comparisons test; for simplicity, significant differences are shown only between WT and NCOR1-cKO Tregs. (c) unpaired 2-tailed Student’s t test. (e) unpaired 2-tailed Student’s t tests comparing respective GW3965-treated sample with mock (DMSO)-treated control. (c) Data show a summary of at least 6 mice that were analyzed in 2 independent experiments. (d) Data show a summary of at least 8 independent samples that were analyzed in at least 3 independent experiments (except analysis of proliferating cells which shows 3 independent samples from one experiment).

(a) Flow cytometry analysis showing IFNγ and IL17A expression in CD45.1+ Tconv cells isolated from SI-IEL, SI-LP, spleen and mLNs. (b) Summary of all experiments as described in (a). (a,b) Cells were pregated on CD4. (a) Numbers indicate the percentages of cells in the respective quadrants. (b) Each symbol indicates one mouse. Horizontal bars indicate the mean. *P < 0.05, **P < 0.01, and ***P < 0.001 (ordinary 1-way ANOVA analysis followed by Tukey’s multiple-comparisons test). Data are representative (a) or show the summary (b) of at least 6 mice (except CD4+ Tconv only controls with at least 4 mice) that were analyzed in 3 independent experiments.

(a) Gating strategy for identification of effector (CD44hiCD62L−) and naïve (CD44loCD62L+) Treg cells: After exclusion of debris (FSC-A/ SSC-A), doublets (FSC-H/ FSC-W) and dead cells (using Viability Dye eFluor 506 or 780), cells were distinguished via their expression of CD19 (BV605) and TCRβ (BV711), CD4 (PE-Cy7) and CD8 (AF700) and FOXP3 (APC). Cells were further gated based on their expression of CD44 (PerCP-Cy5.5) and CD62L (APC-Cy7). (b) Gating strategies for identification of Tfh (CXCR5+PD1+CD44hi) and Tfr (CXCR5+PD1+CD44hiFOXP3+) cells: Debris, doublets and dead cells were excluded as described in (a). Cells were distinguished via their expression of CD19 (BV605) and TCRβ (BV711), CD4 (PE-Cy7) and CD8 (AF700), CD44 (PerCP-Cy5.5), CXCR5 (BV421) and PD-1 (BV786) and FOXP3 (APC). (c) Gating strategy for MYC+ cells: effector and naïve Tregs or total-Tregs were gated as described in (a). Cells were further analysed via their expression of MYC (AF647) (gMFI). (d) Gating strategy for transfer colitis experiment: After exclusion of debris (FSC-A/ SSC-A) and doublets (FSC-H/ FSC-W) cells were distinguished via their expression of CD4 (PE-Cy7) and their viability using the Viability Dye eFluor 506. Cells were further gated based on their expression of CD45.1 (PE/ Dazzle) and FOXP3 (APC). (d) Gating strategy for CRISPR-Cas9 mediated deletion experiments: After exclusion of debris (FSC-A/ SSC-A) and doublets (FSC-H/FSC-W) cells were distinguished via their expression of FOXP3 (eFluor 450) and MYC (AF647) or via their expression of the markers CD45RA (PE), CD45RO (APC-Cy7) and CD27 (AmCyan).


Figure Legends for Source data
Figure Supplement 3 – Source data 1. Raw, uncropped agarose gel picture showing Ncor1 deletion PCR indicating Ncor1 deletion
Representative agarose gel picture showing Ncor1 deletion PCR results in WT tail samples and FACS-sorted WT CD4+ splenocytes (left panel), TCRß+, CD8+, CD4+YFP− and CD4+YFP+ cells isolated from the spleen of NCOR1-cKOFoxp3 mice (middle panel) and CD4+YFP− and CD4+YFP+ cells isolated from the thymus (right panel) of NCOR1-cKOFoxp3 mice. Two mice were pooled for sorting. Size floxed band: 346bp. Size Δ band: 246bp.
Figure Supplement 3 – Source data 2. Raw, uncropped agarose gel picture showing Ncor1 deletion PCR indicating Ncor1 deletion
Representative agarose gel picture showing Ncor1 deletion PCR results in WT tail samples and FACS-sorted WT CD4+ splenocytes (left panel), TCRß+, CD8+, CD4+YFP− and CD4+YFP+ cells isolated from the spleen of NCOR1-cKOFoxp3 mice (middle panel) and CD4+YFP− and CD4+YFP+ cells isolated from the thymus (right panel) of NCOR1-cKOFoxp3 mice. Two mice were pooled for sorting. Size floxed band: 346bp. Size Δ band: 246bp. The black rectangle framed section in the blot shows the cropped area of the final figure in Supplementary Fig. 3. Band sizes are indicated on the left side of the picture. Floxed/ delta bands are indicated on the right side of the picture. The samples are indicated in the lower part of the picture.
Acknowledgements
We thank Johan Auwerx for providing floxed-Ncor1 mutant mice. W.E., C.B., and N.B. were supported by the Austrian Science Fund (FWF) Special Research Program F70. W.E. was supported by FWF projects P19930, P23641, P26193, P29790; and by the FWF and Medical University of Vienna doctoral programs (DK W1212) “Inflammation and Immunity” and (DOC 32 doc.fund) “TissueHome”. V.S. was supported by the FWF and Medical University of Vienna doctoral programs (DK W1212) “Inflammation and Immunity”. P.H. was supported by a DOC fellowship of the Austrian Academy of Sciences. D.H. received a L’Oréal Austria Fellowship supported by the Austrian Commission for UNESCO in cooperation with the Austrian Academy of Sciences. M.T. was supported by the FWF and Medical University of Vienna doctoral programs (DK W1212) “Inflammation and Immunity”. A.B. was supported by the FWF and Medical University of Vienna doctoral programs (DK W1212) “Inflammation and Immunity”. K.S. was supported by the FWF project P34728. N.B. was supported by the FWF project P30885. S.K. received support via the FWF Special Research Programs F54 and F61.
References


