

Abstract
Over evolutionary time, bacteria face changing environments, which may require different sets of genes for survival. As they adapt to a specific constant environment, some genes are modified and lost, which can increase fitness while also modulating the effects of further gene losses. However, whether evolutionary specialization leads to systematic changes in robustness to gene loss is largely unexplored. Here, we compare the effects of insertion mutations in Escherichia coli between ancestral and 12 independently derived strains after 50,000 generations of growth in a simple, uniform environment. We find that epistasis between insertion mutations and genetic background is common, but the overall distribution of fitness effects is largely unchanged. In particular, we see systematic changes in gene essentiality, with more genes becoming essential over evolution than vice versa. The resulting changes often occurred in parallel across the independently evolving populations. A few of the changes in gene essentiality are associated with large structural variations, but most are not. Taken together, our results demonstrate that gene essentiality is a dynamic, evolvable property, and they suggest that changes in gene essentiality are a result of natural selection in this long-term evolution experiment, rather than a mere byproduct of structural changes.
Main Text
Over the course of adaptive evolution, natural selection drives mutations that provide a fitness advantage to higher frequency and even fixation. As a consequence, various genes are modified, gained, and lost (1, 2). However, those genes that are essential for an organism’s survival and reproduction are typically less prone to modification, and they cannot be lost without some compensatory change elsewhere in the genome (3, 4). Identifying the genes that are essential in a specific environment is important for understanding and predicting evolution (5), engineering genomes for minimal size and other applications (6), and discovering potential targets for antimicrobial therapeutics (7, 8).
The set of essential genes depends not only on the environment, it can also differ greatly between species and even strains of the same species (9, 10). About a third of the essential genes in E. coli are non-essential in B. subtilis, and vice versa (11), and ~17% of the genes essential in S. cerevisiae are non-essential in S. pombe (12). As organisms adapt to a specific environment, new mutations can modulate the effects of subsequent mutations through genetic interactions (13–15); thus, mutations that would previously have been beneficial or neutral can be detrimental, and essential genes may become non-essential (or vice versa). Thus, differences in evolutionary history can lead to diverging patterns of gene essentiality.
Population genetics theory predicts that selection can favor increased robustness to mutations in general and gene loss in particular, especially at high mutation rates (16–18). As a consequence, fewer genes may become essential as fitness increases. Conversely, experiments with yeast strains suggest that mutations tend to be more detrimental, not less, on fitter backgrounds (19). That result implies that new mutations will typically become more harmful as adaptation proceeds, potentially increasing gene essentiality.
Despite analyses of the distribution of fitness effects (DFE) and gene essentiality for a variety of organisms and environments, the rate and extent of evolutionary change in these properties are not well understood, even over short timescales and in simple, constant environments. In viruses, robustness to mutations and environmental perturbations has been reported both to increase and decrease during evolution (20, 21), while in evolving yeast populations robustness has either declined or been unchanged depending on the experimental environment (22). It is unclear whether these different outcomes reflect differences in the environments during the evolution experiments or the types of mutations assayed, or whether there are idiosyncratic differences among the study systems that reflect their different histories and genomic properties.
To better understand how the robustness to mutations—including the DFE and especially gene essentiality—changes during adaptation to a simple, constant environment, we turned to the Long-Term Evolution Experiment (LTEE). Twelve populations of E. coli have been serially propagated in a glucose-limited minimal medium for 75,000 generations, with samples frozen every 500 generations (23). The mean fitness of the populations has continued to increase over time (24, 25), and six populations have evolved substantially elevated mutation rates (26, 27). This evolved hypermutability allows us to test the impact of mutation rate on changes in robustness predicted by population genetics theory, while having multiple independently evolving populations allows us to address whether changes in robustness are random or have evolved in parallel across replicate populations.
Results
In principle, a genome’s robustness to mutations might be measured in many different ways. In this study, we analyze the single-step mutational neighborhood of a genome, specifically the set of genotypes generated by exactly one transposon-mediated insertion mutation (16, 28–30). We quantify robustness in two respects: the overall distribution of fitness effects (DFE) of the insertion mutations and the number of essential genes. A decline in an evolved genome’s robustness relative to its ancestor would be indicated by a negative shift in the mean of the DFE (i.e., the average mutation is more deleterious), an increase in the number of essential genes, or both.
Simultaneous parallel fitness measurements of thousands of insertion mutants
To measure how robustness changes during evolution, we used a suicide-plasmid delivery system to construct high-coverage transposon libraries in the LTEE ancestors (REL606 and REL607) and a clone isolated from each population (Ara+1 to Ara+6 and Ara–1 to Ara–6) at 50,000 generations. The mariner-derived transposon inserts into TA dinucleotides, providing over 200,000 possible insertion sites in the E. coli chromosome. We propagated the mutant libraries at 37C in Davis minimal media with 25 mg/L glucose (DM25) for four days, diluting the cultures 1:100 in fresh medium each day. These conditions are the same as those used in the LTEE, and the bacteria have log2(100) ≈ 6.64 generations per day. The cost or benefit of each mutation determines the expected rate at which it grows relative to the rest of the population, such that the change in the abundance of each mutation can be used to infer its fitness effect.
To accurately quantify mutant abundance, and therefore the fitness effects of mutations, we developed UMI-TnSeq, a technique for attaching unique molecular identifiers (UMIs) to individual molecules in transposon insertion sequencing libraries. By sequencing across transposon-genome junctions, we measured the abundance of mutations. We then estimated the fitness effect of disrupting each gene by averaging the fitness effects over all the TA insertion sites in that gene (Figure 1). The resulting fitness estimates are highly reproducible between technical replicates, and they are consistent with independent estimates obtained by pairwise competitions between engineered deletion mutants and their unmutated parents (Supplementary Figure 1, Supplementary Table 1). UMI-TnSeq distinguishes between PCR replicates and biological replicates, and it thus removes this source of bias from fitness estimation.

Estimates of fitness effects of UMI-TnSeq insertion mutations are reproducible and consistent with fitness effects of deletions. A) Correlation between technical replicates in evolved Ara+1 clone (left) and distribution of measurement errors (right). B) The fitness effects estimated by disrupting genes using TnSeq in the LTEE ancestor and by pairwise competitions between the unmutated ancestor and clean deletion mutations are consistent. Each point represents one independent measurement.

Schematic representation of mutagenesis and fitness assay pipeline. The Long-Term Evolution Experiment is an ongoing experiment in which 12 populations of E. coli evolve in and adapt to a glucose-limited minimal medium (23). Here, we created transposon libraries in the LTEE ancestors and clones from each population sampled at 50,000 generations. We conjugated the strains with E. coli MFDλpir-pSC189, which carries a mariner transposon with a kanR resistance gene, and we selected transconjugants on medium containing kanamycin. We then propagated the resulting insertion libraries for four days in the same minimal medium as used in the LTEE, and we quantified the abundance of mutants over time using sequence data. We measured the fitness effects of insertions in each gene in the genome based on changes in the relative abundance of the mutants. These measurements were highly reproducible and consistent with fitness effects based on pairwise competitions (Supplementary Figure 1). The abundance trajectories shown here are illustrative examples, not real data. Figure created with biorender.com.
No systematic changes in the distribution of fitness effects
We compared the overall distribution of fitness effects in the mutant populations derived from the two LTEE ancestors and 12 evolved clones. The DFEs of all 14 populations were similar, except for Ara–2, which has a substantially lower fitness mode, and Ara+4, which has a much broader distribution (Figure 2A). We excluded these populations from further analysis, as explained in the legend to Supplementary Figure 2. Consistent with previous results (31–33), we found that most mutations are nearly neutral (within a few percent of neutrality), but with a somewhat heavier tail of deleterious mutations than beneficial mutations. Moreover, the aggregate DFEs for the ancestors and evolved lines were nearly identical, but with slightly more beneficial mutations in the ancestors (Figure 2B, note the logarithmic scaling). This subtle difference and its evolutionary significance are examined in depth in the companion study by Couce et al. (34).

Evolved strains from populations Ara–2 and Ara+4 were excluded from further analyses because of aberrant properties. A) Plot of all mutant trajectories in the LTEE Ancestor and Ara–2. B) Fitness estimates are biased in Ara–2 because of the highly negative correction factors based on the pseudogenes (left panel). As a consequence, the DFE for Ara–2 barely extends below −0.25 (right panel). C) The correlation between technical replicates is much worse for Ara+4, and the typical measurement error much larger (2.3%), than seen for other strains (ranges from 0.7 to 1.2%).

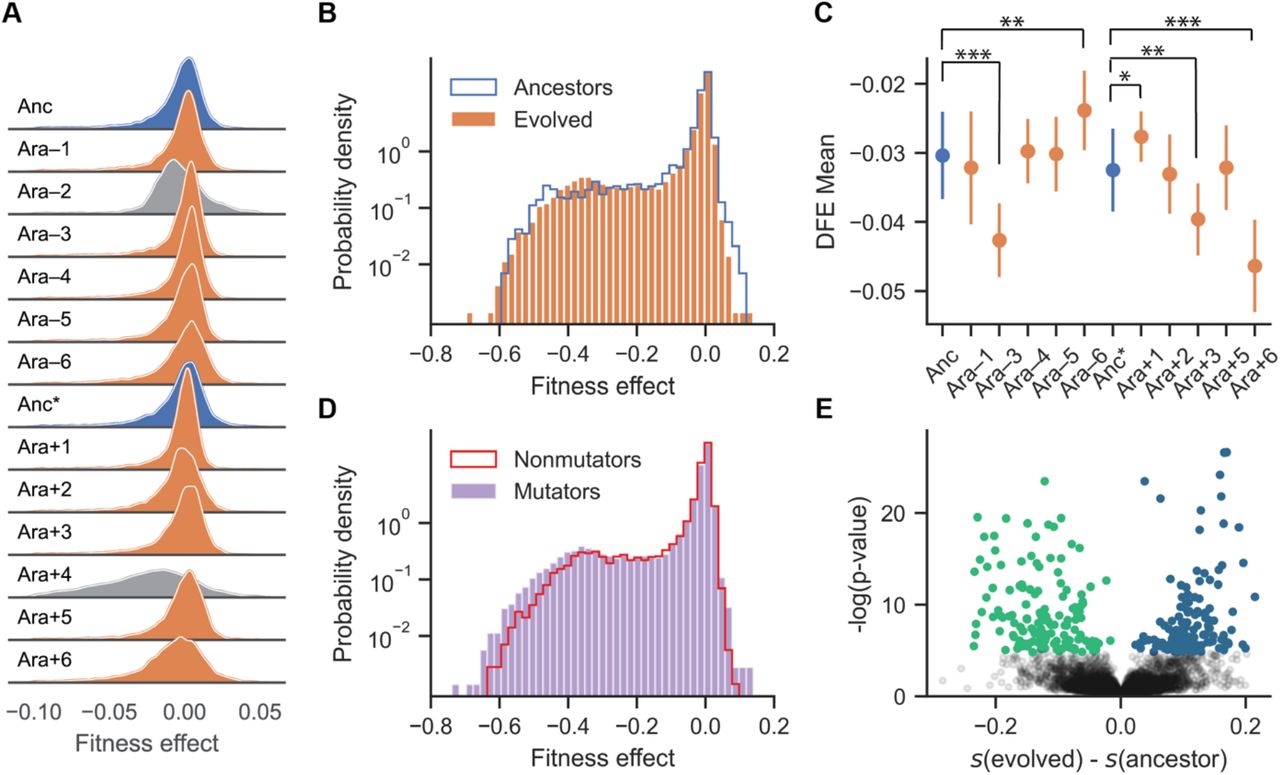
The overall distribution of fitness effects is largely unchanged after 50,000 generations, despite frequent epistasis between new mutations and the evolved genetic backgrounds. A) Ridgeplot of the distribution of fitness effects (DFE) in the LTEE ancestors (Anc: REL606, Anc*: REL607) (blue), which differ by a neutral marker, and 50,000-generation clones sampled from each replicate population (orange). Ara–1, Ara–2, Ara–3, Ara–4, Ara+3, and Ara+6 evolved ~100-fold increases in their point-mutation rates. We excluded two strains (Ara–2 and Ara+4, DFEs marked in gray) from further analyses (see text; Supplementary Figure 2). The histograms were smoothed using kernel density estimation and are shown with a linear y-axis. DFEs are only shown for fitness effects ranging from –0.1 to 0.05, as the density outside these regions is very low. B) Comparison of the aggregated DFEs of the ancestral and evolved strains. Here the histograms are plotted with a logarithmic y-axis to show more clearly the deleterious and beneficial tails of the distributions. C) Means of the DFEs: error bars indicate the 95% confidence interval in the estimate of means given the associated measurement noise in the bulk fitness assays. Statistically significant differences between the evolved lines and ancestors after Bonferroni correction for multiple tests are indicated (Z-test, ***p < 0.001, ** 0.001 <p < 0.005, * 0.005 <p < 0.05). D) Comparison of the aggregated DFEs of the mutator and non-mutator evolved strains. E) Volcano plot of the estimated difference in fitness effects in a given gene between the ancestor and evolved clones (x-axis) and the Bonferroni corrected p-value (y-axis, shown on a logarithmic scale) that the difference can be explained by measurement error. Points in green indicate genes that are more deleterious in an evolved population, and points in blue indicate genes that are more deleterious in the ancestor.
While the means and the variances of the DFEs differed significantly between the ancestor and several evolved lines (Figure 2C and Supplementary Figure 3), there was no systematic trend in how they changed during evolution (t-test, means: p = 0.37, variances: p = 0.56). During the LTEE, six lines (Ara–1, Ara–3, Ara–4, Ara+3, and Ara+6, along with Ara–2 that was excluded) evolved roughly 100-fold increases in their point-mutation rates (1, 26, 27). The DFEs of the mutator lines have slightly lower mean (t-test, p = 0.048) and higher variance (t-test, p = 0.031) compared to those that retained the low ancestral mutation rate (Figure 2D, Supplementary Figure 4). At the level of individual genes, we observed frequent epistasis between insertion mutations and the genetic background in which they occurred. As a result, the fitness effects of many mutations differ between the ancestral and evolved backgrounds, with some mutations becoming more deleterious and others less deleterious (Figure 2E). Thus, epistatic interactions with the genetic background can change the effects of individual mutations. However, robustness, measured as the overall DFE, did not systematically shift during the 50,000 generations of adaptation.
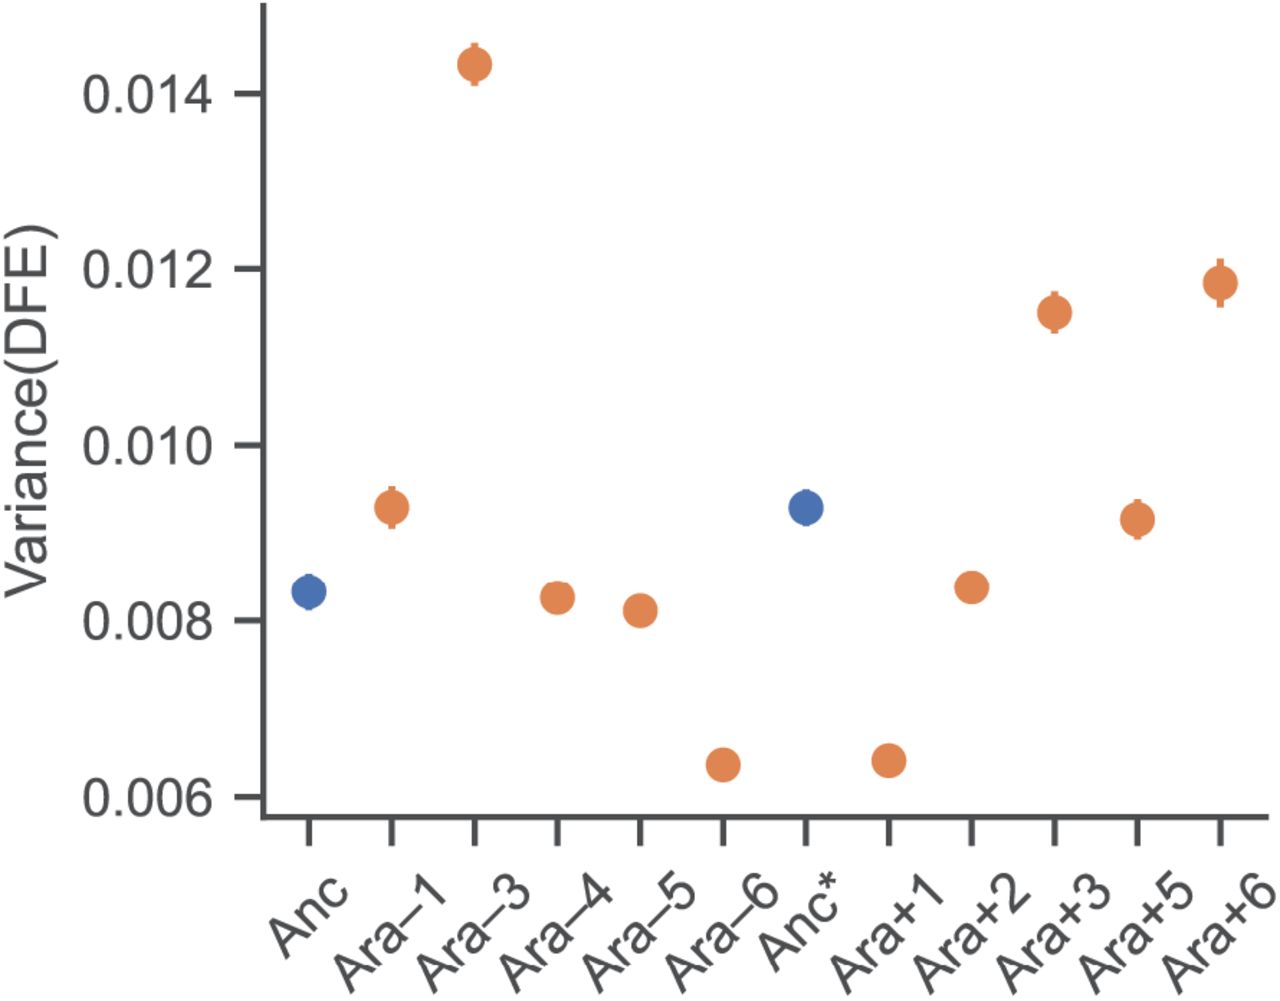
Comparison of variances of the DFEs between ancestors and evolved populations. Anc: REL606, Anc*: REL607. Note that the uncertainty in the estimate of the variance is very small, hence the error bars are usually not visible (see Methods for detailed explanation). All evolved populations except Ara–4, Ara–5 and Ara+5 have significantly different variances when compared to their ancestors (Z-test, p < 0.05, after Bonferroni correction for multiple tests).

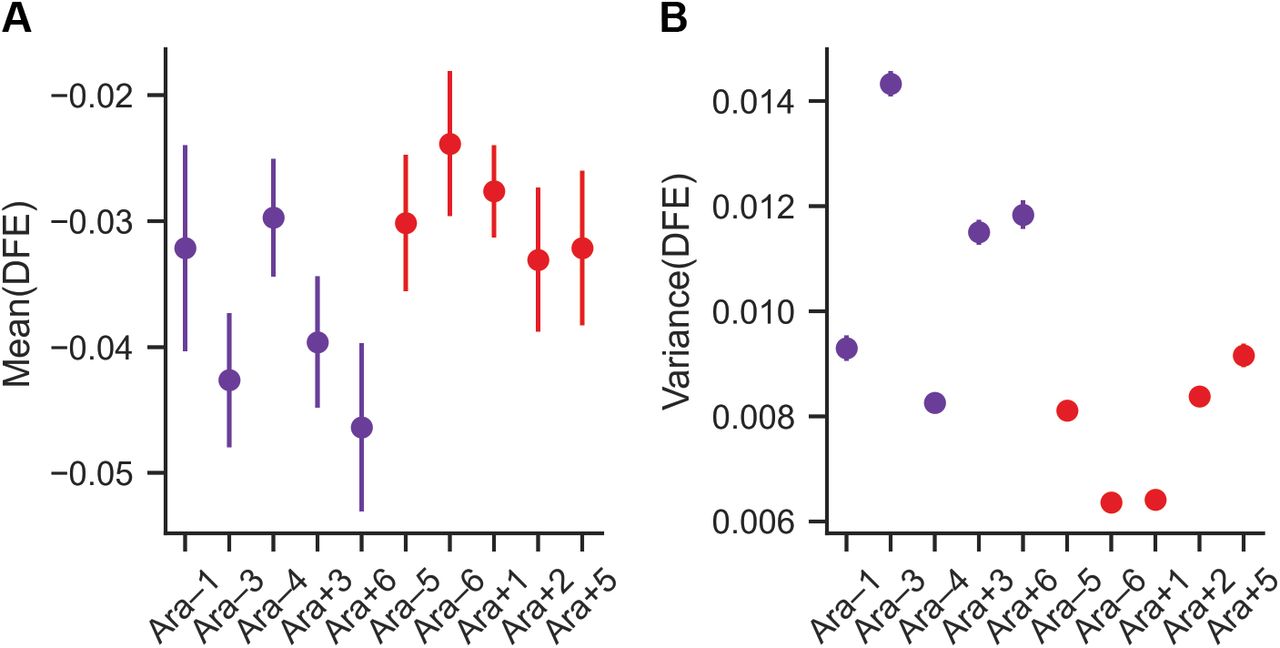
Clones from populations that evolved increased mutation rates (mutators) are slightly less robust to mutations than those that retained the ancestral mutation rate. A, B) Small, but significant, differences in the means and variances of the DFEs of the mutators and non-mutators (t-test, p = 0.048 and p = 0.031, respectively). These are the same data as shown in Fig. 2C and Fig. S3, but ordered and colored as mutator (purple) and nonmutators (red).
Extensive and parallel changes in gene essentiality
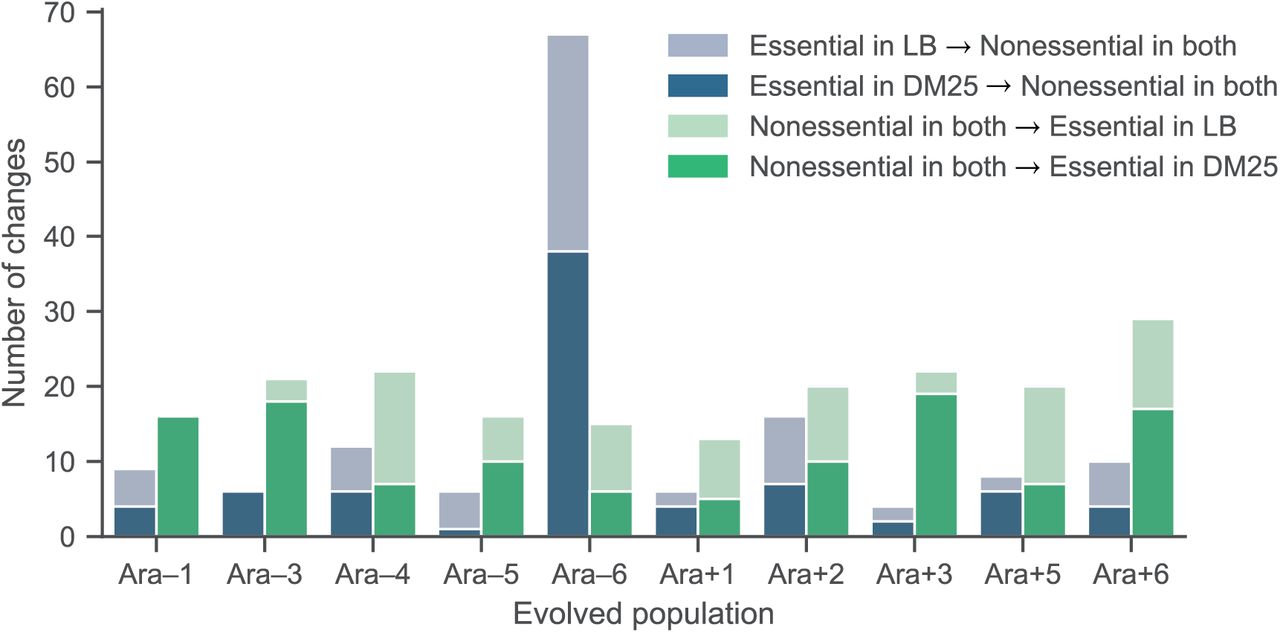
We asked next whether epistatic interactions between the introduced insertion mutations and genetic backgrounds led to changes in gene essentiality. We assessed gene essentiality in two different environments: LB, the medium in which the transposon libraries were constructed; and DM25, the medium in which the LTEE populations evolved. In DM25, we define genes with fitness changes < −0.3 to be essential (see Supplementary Figure 5 for supporting data). We found genes that went from nonessential to essential and vice versa in all the LTEE lines (Figure 3A, Supplementary Table 2A, 2B). Strikingly, there were many more genes that became nonessential in Ara–6 than in the other evolved lines. We confirmed differential gene essentiality in DM25 using clean gene deletion mutants in the ancestor REL606 and Ara–1 (Supplementary Figure 6, Supplementary Table 1). Across the set of LTEE populations, we observed a significant tendency for nonessential genes to become essential relative to the reverse change (p = 0.0056, Mann-Whitney U test). This suggests that robustness to gene loss, measured in terms of gene essentiality, decreases during the LTEE. While this shift appears to contradict the finding that the DFE does not systematically change, the number of genes with altered essentiality is about two orders of magnitude smaller than the number of genes comprising the DFE (>3,000 genes). Hence, the bias in gene essentiality changes has no appreciable effect on the overall statistical properties of the DFE.

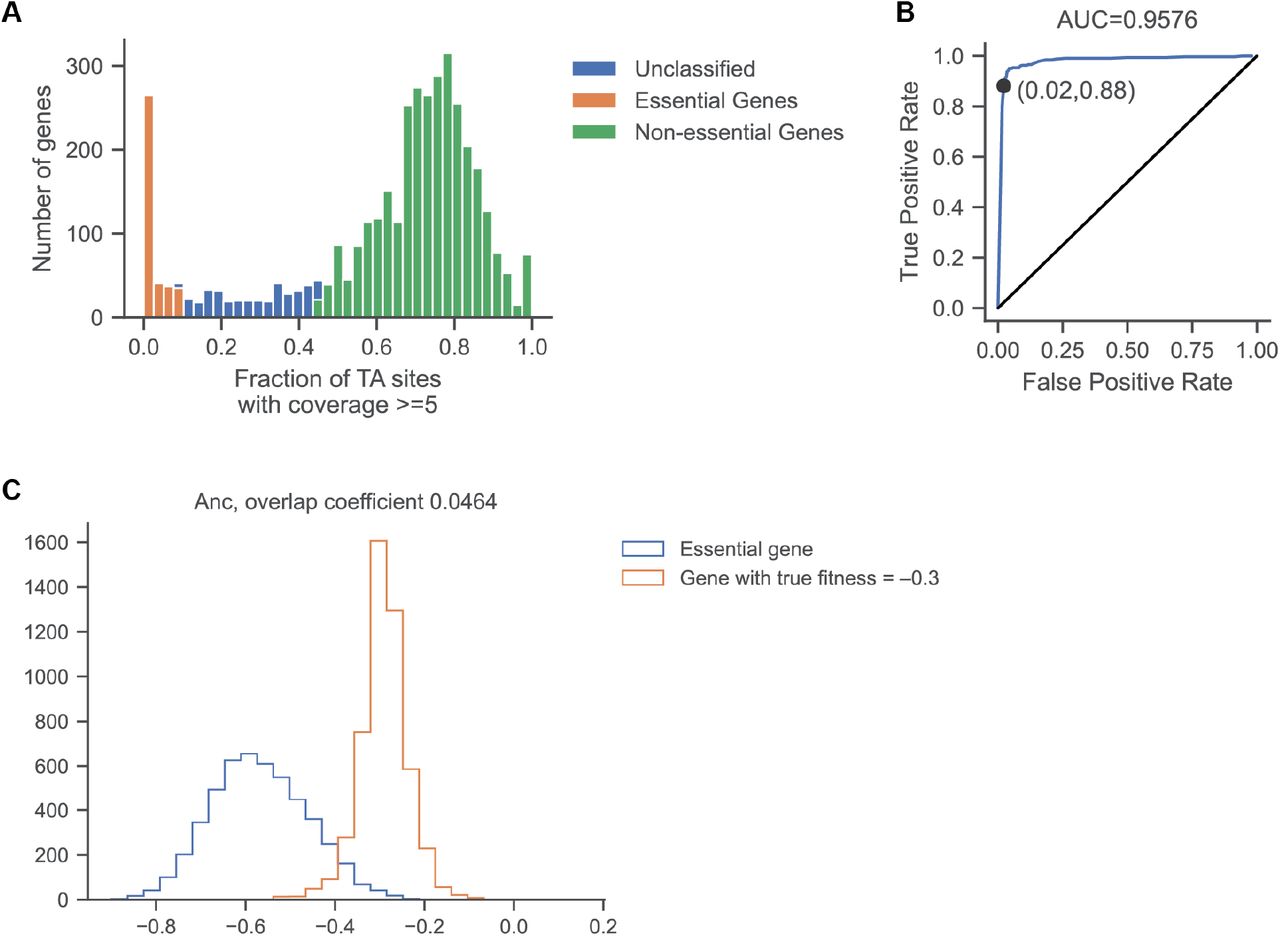
Defining gene essentiality in LB and DM25. A) LB: We fit a gamma distribution to the fraction of sites with coverage ≥ 5 and calculated corrected p-values that account for the false discovery rate. Genes with that fraction < 0.1 are considered essential and genes with fraction > 0.45 are considered nonessential. B) Classification of gene essentiality is reliable when compared to data from Goodall et al. (55). C) DM25: We simulated the fitness estimates for an essential gene and for genes with true fitness effects ranging from −0.45 to −0.2, and we found the most deleterious effect, s, where the overlap coefficient is less than 0.05. See Methods: Data Analysis: Fitness and Essentiality for detailed description of these simulations.

Verification of differential gene essentiality for two genes (gdhA and sspA) in the ancestor and evolved clone from population Ara–1, obtained by generating clean gene deletion mutants in both genetic backgrounds. For both genes, the prediction of differential essentiality from TnSeq is consistent with the head-to-head competition assays. For gdhA on the Ara–1 background, both methods classify the gene as essential. The difference between the methods can be exaggerated, especially for essential genes, because the measurement errors for both methods are very large as a consequence of the rapid disappearance of unfit mutants and their extremely low absolute counts. Note that the threshold for essentiality from the TnSeq data is −0.3.

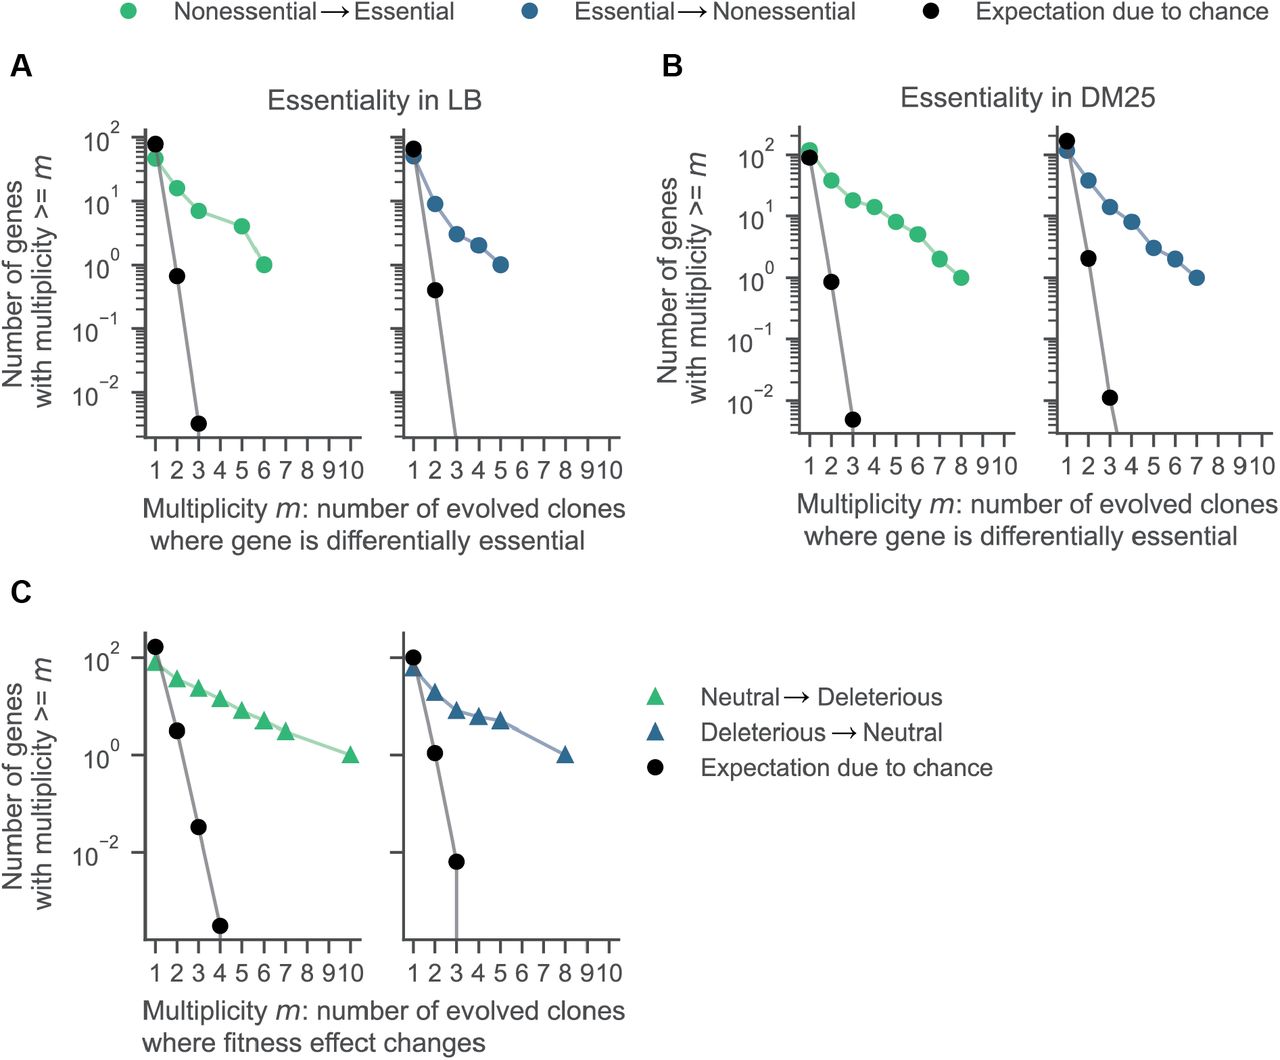
Extensive and parallel changes in gene essentiality over evolution. A) Number of genes that are differentially essential between the ancestor and each evolved strain. B) Parallel changes in gene essentiality. We estimated the expected number of parallel changes from chance alone by shuffling the gene essentiality and fitness profiles 10,000 times and counting how often the same genes had altered essentially in at least m populations. C, D) Clustered heatmaps showing fitness effects (scale at right) of genes that evolved to become essential or nonessential in at least one 50,000-generation strain. Genes that were deleted during evolution are shown in white. Genes with mutations conferring fitness effects below –0.3 (the threshold for essentiality) were set to –0.3 for the clustering and visualization.
Gene essentiality has previously been associated with highly expressed genes (4, 35, 36). We therefore examined whether changes in gene essentiality were associated with altered expression levels. We used a recently published RNA-Seq dataset for the LTEE clones at 50,000 generations (37). Consistent with previous findings, essential genes have higher expression levels on average than non-essential genes (Supplementary Figure 7A). However, for genes that became essential or non-essential during the LTEE, we find no significant differences in the normalized expression levels in the ancestor and evolved strains (Supplementary Figure 7B). This result suggests that changes in essentiality are not invariably related to altered levels of gene expression.

Changes in gene essentiality in DM25 are not related to changes in expression levels. A) Nonessential genes tend to have lower expression levels. The pattern shown here for Ara–1 occurs in all LTEE clones (see Jupyter Notebook final_analysis_plotting.ipynb section on expression levels comparison). B) Changes in gene essentiality do not reflect systematic differences in expression levels between the ancestor and evolved strains. Here, we identify all genes with altered essentiality in any evolved strain. We then compared the expression level of the gene in the ancestor and the evolved strain with altered essentiality for all these genes. The baseline expression levels are generally higher in the evolved strains. When comparing strains, we normalized the expression levels of each gene by the total number of reads that mapped to the strain.
To understand the processes leading to changes in essentiality, we examined whether the same genes tended to change their essentiality across the independently evolving replicate populations. We first examined this possibility through hierarchical clustering of the fitness effects of genes that had changed essentiality in at least one lineage (Figure 3C, D). While many changes were specific to individual lineages (particularly for transitions from essential to nonessential), many others showed parallel evolution of gene essentiality across multiple lineages.
To assess whether the observed parallelism was greater than expected by chance, we compared the two complementary cumulative distributions of differentially essential genes in multiple lineages against a null distribution, which we generated by shuffling the gene-essentiality profiles of each population 10,000 times. Both the essential-to-nonessential and nonessential-to-essential transitions occurred in parallel much more than expected by chance (Figure 3B). This signature of parallelism persisted when we partitioned essentiality changes by environment (Supplementary Figure 8, 9A, B) and by their fitness effects (Supplementary Figure 9C). These results show that the observed parallelism in altered gene essentiality is insensitive to the arbitrary thresholds used to define essentiality.
Changes in gene essentiality, partitioned by two different media.

Parallel changes in gene essentiality in A) LB and B) DM25 media. C) Changes in fitness effects in DM25 from roughly neutral (s > −0.05) to highly deleterious (s < −0.2) occur in parallel, showing that the choice of thresholds does not influence the observation of parallelism. We estimated the expected number of parallel changes from chance alone by shuffling the gene essentiality and fitness profiles 10,000 times and counting how often the same genes had altered essentially in at least m populations.
Role of structural variation and selection in gene essentiality changes
Parallel changes in gene essentiality might reflect selective pressures acting on essentiality per se. Alternatively, they might evolve as by-products of other mutations, including gene deletions or duplications, which may reflect different selective pressures. For example, previous analyses of the LTEE populations have shown that parallel deletions of the rbs operon are beneficial (38), while a duplication event gave rise to the new ability to consume citrate that evolved in one population (39). More generally, chromosomal rearrangements are fairly common in the LTEE populations, with substantially more large deletions than large duplications (40). Gene duplications can give rise to genetic robustness because they provide functional redundancy (41).
Because we observed more genes becoming essential than vice versa, we examined whether changes in essentiality might be associated with the presence or absence of homologous genes. To that end, we performed whole-genome sequencing of the ancestors and all evolved strains at 50,000 generations with high coverage (>60X) and identified all large deletions in the evolved genomes. We focused on genes with a single homolog in the ancestor; there are 195 homologous gene pairs in the ancestor with >40% identity using mmseqs2 (Supplementary Table 3) (42). Of these 390 genes, each evolved strain lost at least 11 and as many as 48 over time.
We then asked if any of the genes that became essential in the evolved strains could be explained by the loss of functional redundancy created by these gene deletions. Most of the evolved strains (all except clones from Ara+5 and Ara+6) have deletions in the manB-cpsG region, which spans the rfb operon. In these strains, insertions in rffG and rffH, which are homologs of rfbA and rfbB, were highly deleterious. Notice that these insertion mutants in strains without homologs largely disappeared in the bulk competitions in a single day, whereas the same insertion mutants with the homologs present actually increased in frequency (Figure 4A). These results are consistent with a previous finding that the absence of both genes leads to envelope stress owing to accumulation of a toxic intermediate, the ECA Lipid II (43). In further agreement, we found that deletions of wecA, a gene upstream of ECA II biosynthesis, were tolerated in all strains, indicating that gene is nonessential (Supplementary Table 4). In another example of gene essentially dependence on functional redundancy, a highly expressed copy of kdsB became essential owing to either loss or very low expression of a duplicate copy (Supplementary Figure 10, Supplementary Note 1, Supplementary Table 5). However, such examples were uncommon. In the other 77 of 80 genes that became essential in at least one evolved strain in either environment, we found no evidence that gene essentiality was caused by loss of homologous genes.

Fitness effect of disrupting kdsB_1 gene is correlated with expression (in transcripts per million, TPM) of kdsB_2 (Pearson r = 0.884, p = 0.0083 excluding outlier Ara–4 strain, where no fitness effect was calculated owing to rapid loss from bulk competition assay; Pearson r = 0.714, p = 0.0083 with Ara–4 set to maximum deleterious effect of −ln(100)/log2(100) ≅ −0.693).

Examples of altered essentiality associated with structural variation. A) Loss of homologs makes rffG and rffH essential. In strains with rfbA and rfbB present (ancestors, Ara+5, Ara+6), insertion mutations in rffG and rffH are neutral or even slightly beneficial, and they persist over the 4-day bulk fitness assay (~26 generations). In the 8 evolved strains with deletions of the manB-cpsG region (all except Ara+5 and Ara+6), insertion mutations in rffG and rffH are rapidly outcompeted. Note the logarithmic scale for the abundance; <1 read per TA insertion site in the sequencing data is at level of measurement noise. B) In the 50,000-generation clone from population Ara–6, the distribution along the chromosome of the genes that became essential during evolution (top subpanel) maps closely to normalized whole-genome sequencing coverage (bottom subpanel); the inset expands the smaller of two multi-gene duplications. C) Numbers of essential → nonessential changes in the 10 evolved strains. Gray and blue colors represent the numbers that are attributable to gene duplications and those that are not, respectively. Evolved clones with detectable duplications are outlined by a box. D) Parallel changes in gene essentiality, after excluding those changes that are attributable to the loss or gain of homologs. We estimated the expected number of parallel changes from chance alone by shuffling the gene essentiality and fitness profiles 10,000 times and counting how often the same genes had altered essentially in at least m populations.
In a similar vein, we asked whether some genes became nonessential as a consequence of evolved duplications. We first focused on the Ara–6 strain because it had an exceptionally high number of genes that had become nonessential by 50,000 generations (Figure 4C). When we examined the normalized coverage of this strain’s genome, we found a large duplication that encompasses ~300 genes and a smaller duplication spanning ~25 genes (Figure 4B). Thirty-eight of the 67 genes that evolved to become nonessential in this strain were in the duplicated regions. Three other strains (Ara–3, Ara+2, and Ara+5) had duplicated regions, but only Ara+2 had genes that became nonessential owing to the evolved redundancy (Figure 4C). Moreover, many genes became nonessential in these and other populations without such duplications. Overall, 94 of 139 instances of genes evolving to become nonessential (53 of 98 genes, and all parallel cases in which genes became essential) were not linked to gene duplications.
We also probed whether the parallel changes in gene essentiality were explained by the effects of gene loss and duplications. We repeated the parallelism analysis, but now excluding all genes involved in ECA biosynthesis, all genes that became nonessential owing to duplications, and all genes that became essential owing to deletions of homologous genes. Even after accounting for these dependencies, we still observed significant parallelism across the independent lineages in genes becoming both essential and nonessential (Figure 4D). These parallel changes in gene essentiality presumably reflect differences in physiological processes that became either more or less important for organismal fitness in the LTEE environment.
To identify such processes, we looked for functional similarities of genes becoming differentially essential in at least two populations, and which were not associated with structural changes, using gene ontology (GO) analysis (44, 45). Thirty-five genes became essential, and 19 became nonessential, in at least two populations (Supplementary Tables 6A, 6B). Genes that became nonessential were enriched for phosphate ion transport and recombination repair GO terms, whereas genes that became essential were enriched for cytokinesis terms (Supplementary Tables 7A, 7B). However, these terms account for only 5/35 and 8/19 genes that evolved in parallel to become essential and nonessential, respectively. Thus, there are probably broad changes in physiology, not restricted to a few specific pathways, that are not captured by this GO analysis.
In summary, many changes in gene essentiality evolved in parallel during the LTEE. Most of these parallel changes are not byproducts of structural changes in genome content, nor are they restricted to a few particular pathways, but rather they are a widespread feature of evolution in the LTEE.
Discussion
Biological systems, from proteins and genetic networks to organismal physiology and fitness, are often remarkably robust to mutations, but how robustness evolves is not well understood (16, 30, 46, 47). Here, we show that overall robustness to mutations, which we measured as the average fitness effect of an insertion mutation, did not change systematically during 50,000 generations of bacterial evolution, despite significant changes in the fitness effects of mutations in many genes. Our results thus differ from the recent finding of a strong global tradeoff between fitness and robustness in a panel of yeast strains (19). This difference might reflect the smaller number of mutations, and hence fewer potential epistatic interactions, that accumulated in the strictly clonal LTEE lines compared to the more abundant allelic variation generated by recombining widely divergent strains in the yeast study (19, 48).
We also found that mutational robustness became somewhat lower in strains from the LTEE populations that evolved hypermutability, as evidenced by higher variances and lower means in the DFEs. This result contradicts the theoretical prediction that elevated mutation rates should favor the evolution of increased mutational robustness (16). However, it is important to note that we analyzed the fitness effects of insertion mutations only, and other types of mutations (e.g., point mutations) might show different patterns of robustness. Moreover, while the 50,000-generation span of our study is long for an experiment, mutational robustness might evolve over the longer timescales available in nature. Also, several of the hypermutable lineages either reverted to the low ancestral mutation rate or evolved compensatory changes that reduced their mutation rates somewhat (26, 27), thus reducing the potential benefit of increased robustness. In any case, we found that more genes became essential than nonessential during the LTEE. This asymmetry lends support to the “increasing costs” model of epistasis, in which mutations tend to be more deleterious, on average, when they occur in more fit genetic backgrounds (48).
A key finding of our study is that the set of essential genes changed often during the LTEE, with many nonessential genes becoming essential and many essential genes becoming nonessential. Moreover, we observed many parallel changes in gene essentiality across multiple independently evolving populations, analogous to the parallel fixation of adaptive mutations (26, 27, 49), With a few interesting exceptions, these parallel changes in essentiality were not a mere byproduct of the loss or gain of functionally redundant homologs. Instead, this parallelism implies that these changes in gene essentiality during the LTEE were favored by natural selection. This selection may have acted directly on gene essentiality or, more likely in our view, the changes in essentiality might have emerged from selection to refine the complex network of interactions present in any cell and thereby adapt that network to the specific LTEE environment (50, 51).
Our results add to the growing body of evidence that gene essentiality is not a static property of a species, but instead it is evolvable (5, 52). Although it is known that gene essentiality varies across diverse bacterial and yeast species that have typically diverged over millions of years, we have now demonstrated that gene essentiality can change much faster, over just a few tens of thousands of generations. Recent work by Rousset et al. (9) suggests that horizontal gene transfer (HGT) has played a major role in driving changes in gene essentiality in bacteria. By contrast, the ancestral E. coli strain used in the LTEE lacks plasmids, functioning prophages, and natural transformation (53). Thus, our results show that gene essentiality can evolve rapidly even without HGT.
The ability to predict and even control the evolutionary process requires a deep understanding of fitness landscapes and how they change during evolution. Our study shows that, while the overall distribution of fitness effects remains largely unchanged, individual mutations can become more or less deleterious owing to epistatic interactions with the evolving genetic background. As a consequence, evolutionary paths that were not accessible to the ancestor become available, while others become inaccessible. Moreover, some of the newly accessible evolutionary paths differ among the LTEE’s replicate populations, further contributing to the unpredictability of outcomes (54). Taken together, our results demonstrate the dynamic nature of gene essentiality, and show that while the macroscopic features of the fitness landscape may remain largely unchanged, access to some evolutionary trajectories changes consistently over time.
Contributions
A.L. and M.B. designed the project; A.L., S.V.O. conducted the experiments, A.L. generated the sequencing data; A.L., S.V.O. and M.B. designed and troubleshot the experiments; A.L. designed and conducted the bioinformatics analyses; A.L., C.H. and M.B. designed statistical analyses; A.L. analyzed the data; R.E.L. directs the LTEE and provided strains; R.E.L. and M.B. supervised the project; A.L., S.V.O., C.H., R.E.L., and M.B. wrote the paper.
Competing interests
The authors declare no competing financial interests.
Data Availability
Raw sequencing reads have been deposited in the NCBI BioProject database under accession number PRJNA814281. Processed data are deposited on Zenodo (https://doi.org/10.5281/zenodo.6547536), and source code for sequencing pipeline, downstream analyses, and figure generation are available at GitHub (https://github.com/baymlab/2022_Limdi-TnSeq-LTEE).
Primary accessions
BioProject
PRJNA814281
Supplementary Note: Expression Levels and kdsB Gene Essentiality
The gene kdsB is essential in E. coli K12. However, there are two copies of kdsB in the LTEE ancestor (Anc, REL606), and both copies have high expression levels (37), making each copy dispensable. In three evolved populations (Ara–3, Ara+1, Ara+2), one copy of kdsB (indicated as kdsB_2 in Supplementary Table 5) is lost, making the other copy (kdsB_1) essential. In strains with two copies of kdsB, whether kdsB_1 is essential or not depends on the expression levels of kdsB_2. The fitness effect of kdsB_1 insertion mutation is correlated with the expression level of kdsB_2 (Supplementary Figure 10); in strains with high expression levels of kdsB_2, the fitness effect of kdsB_1 disruption is less deleterious, and vice versa. This example shows that merely the presence of a duplicate gene or homolog is not sufficient to make a gene dispensable; the homolog also needs to be expressed at high enough levels.
List Of Tables
Supplementary Table 1: Direct competition fitness assay counts
Supplementary Table 2A: List of all nonessential-to-essential genes
Supplementary Table 2B: List of all essential-to-nonessential genes
Supplementary Table 3: Homologous gene pairs in ANC
Supplementary Table 4: wecA insertion mutant fitness effects
Supplementary Table 5: kdsB essentiality and expression levels
Supplementary Table 6A: List of nonessential-to-essential genes in at least two populations
Supplementary Table 6B: List of essential-to-nonessential genes in at least two populations
Supplementary Table 7A: Gene ontology output for nonessential-to-essential genes
Supplementary Table 7B: Gene ontology output for essential-to-nonessential genes
Methods
Strains, Plasmids and Growth Conditions
We used the LTEE ancestors (E. coli strains REL606 and REL607, called ANC and ANC*, respectively, in our paper) and evolved clones (listed below) sampled from all 12 populations at 50,000 generations. For all experiments except the fitness assays, we grew the strains at 37°C in LB broth or on LB agar plates.
We generated the donor strain for transposon library construction by transforming E. coli MFDpir with pSC189, a mobilizable plasmid that carries the mariner transposon but lacks the machinery necessary for replication outside the MFDpir host. We grew the donor strains in LB + 300 μM DAP (diaminopimelic acid) and 50 mg/L kanamycin. We produced a fresh batch of donor strains each week, to ensure that the transposon had not been mobilized or disrupted essential genes in the donor background. Single gene deletions were constructed by recombineering, as previously described (56). We used the pSIM5-tet plasmid carrying a heat-inducible lambda red recombinase and a tetracycline-resistance gene (57). The kanamycin-resistance cassette used for recombineering was amplified from the pKD4 plasmid (56).
Transposon Library Construction
We used a suicide-plasmid delivery system to construct the transposon libraries (58). We conjugated dense overnight cultures of the E. coli MFDpir-pSC189 donor and recipient (one of the LTEE strains) on a 0.2-μm filter and incubated for 1 h. We resuspended the conjugation mixture and plated 1-2 mL on large LB agar plates supplemented with kanamycin (either 50 mg/L or 100 mg/L, depending on selection efficiency). After overnight growth at 30°C, we scraped cells from the plates, mixed the resulting mutant library with glycerol, and stored it at –80°C. We plated dilutions of the transposon libraries and verified that they carried kanamycin resistance by patching ~50 colonies on LB and LB + kanamycin plates. We only retained those libraries where >90% colonies were kanamycin resistant.
Fitness Assays
We performed bulk fitness assays in DM25 (Davis Minimal medium with 25 mg/L glucose) held in glass tubes and incubated at 37°C with 220 rpm orbital shaking. We used glass tubes, instead of the small Erlenmeyer flasks used in the LTEE, in order to run many simultaneous fitness assays. Previous work has found no systematic difference in fitness estimates obtained between glass tubes and flasks.
Each fitness assay comprised five 10-mL cultures propagated in parallel. This replication increased the bottleneck population size by a factor of five, without introducing any density-dependent effect in our measurements. For each assay, we inoculated 50 mL of DM25 with ~5 × 10⁵ cells/mL (comparable to the number of cells transferred during the LTEE), and we then split the volume among five glass tubes. After incubating for 24 h at 37°C with shaking, we pooled the five tubes. For four days (~26.5 generations in total) we diluted 500 μL of each bulk competition into 50 mL fresh DM25 (1:100 daily dilution, as in the LTEE) and split the volume among five cultures, as before. We spun down the remaining cells, and we stored the pellet frozen for later DNA extraction and analyses.
Recombineering and Pairwise Fitness Assays
We grew overnight cultures of the strains for recombineering (containing the pSIM5-tet plasmid) in LB at 30°C, and we diluted them 100-fold in 50 mL of low-salt LB. When the cultures were in mid-exponential phase (OD ~0.4), we transferred them to a water bath at 42°C to induce the recombinase for 15 min. We then chilled the cultures on ice, and we prepared competent cells from the induced cultures by washing and pelleting cells multiple times in 10% glycerol. We then transformed the competent cells with 200-500 ng of the recombineering insert, which had 40 bp identical to the flanking regions of the gene we sought to delete as well as the kanamycin-resistance cassette. The recombineering protocol worked successfully for the LTEE ancestor (REL606), but we were unable to make deletion mutations in the evolved strains except the 50,000-generation clone from population Ara–1 (REL11330), for which we saw a reduced efficiency. We found that the limiting factor for most evolved strains was transformation of the recombineering plasmid into the cell using electroporation.
For pairwise competitions, we grew overnight cultures of the unmutated parent and the deletion mutant in LB. We mixed them 1:1 volumetrically and inoculated the mix in 10 mL of DM25 with ~5 × 10⁵ cells/mL. We spread dilutions from the competition mixture on LB and LB + Kanamycin plates at the start of the competition and after one day in DM25. The counts on the LB + Kanamycin plates correspond to the number of mutant cells, while the counts on the LB plates correspond to the total number of cells including both the parents and mutants. We estimated the fitness effect of the deletion mutation as the rate of change in the ratio of the mutants to the parents, as follows:

DNA Extraction, UMI-TnSeq Library Preparation, and Sequencing
We used the Invitrogen PureLink gDNA extraction kit to extract DNA from ~2 × 10⁹ cells from each transposon library. We measured DNA concentrations using the Invitrogen Quant-it Kit and normalized them to 20 ng/μL. We ran 10 μL tagmentation reactions with 5 μL Illumina TDE1 buffer, 2.5 μL TDE1 enzyme, and 2.5 μL normalized DNA at 55°C for 10 min. We used the entire volume of the reaction as the template for PCR1, a low-amplification cycle PCR where we added unique molecular identifiers using custom primers (see Supplementary Information for primer sequences). We cleaned the product of PCR1 with 1.2X serapure beads, which we eluted in 15 μL dH20. We used the eluant as template for PCR2, where we selectively amplified fragments containing the transposon sequence. We cleaned the product of PCR2 with 1.2X serapure beads, which we eluted in 25 μL dH20. We quantified the concentration of DNA of the amplified transposon libraries using the Invitrogen Quant-it Kit, and we diluted and pooled all samples to 4 nM. We verified the concentration of the pooled library using the Kapa Biosystems Illumina qPCR kit. We also prepared whole-genome sequencing libraries for all the strains using the tagmentation based-approach from Baym et al. (59). Additional details on the UMI-TnSeq library preparation are included in the Supplementary Information. We sequenced the transposon and wholegenome libraries on two lanes of an Illumina NovaSeq S2 at the Bauer Core Facility, Harvard University.
Data Analysis: Fitness and Essentiality
We obtained demultiplexed reads from the sequencing core. We filtered reads using a custom Python script, retaining only those reads that contained a sequence matching the end of the mariner transposon, and we stored the 10-bp unique molecular identifier (UMI) sequence separately. We used bowtie2 to map the filtered reads to the reference genome of the LTEE ancestor, E. coli strain REL606. We extracted coordinates of all the uniquely mapped reads; these coordinates correspond to the TA sites in the reference genome. For every TA insertion site, we identified corresponding UMIs and mapping coordinates, and we used this combination to count the number of distinct biological replicates for each TA site. We consolidated all of the data from the bulk fitness assay into a master file for each transposon library; that dataset includes the counts for every insertion site at each timepoint in the fitness assay.
For the downstream analyses, we normalized each insertion by the total sample size. For each insertion mutation with at least 5X coverage at the start of the assay, we estimated its fitness as the slope of linear fit to its ln(frequency) over time (in number of generations, log2(100) ≅ 6.7 per day). Note that this metric differs from the ratio of Malthusian growth rates (as used in many other LTEE analyses) by a factor of ln 2 (60). For those mutants that disappeared, either due to chance or the mutant being deleterious, we added a pseudocount of 1. For each gene, we then averaged over all the insertion sites using an inverse-variance weighting approach, excluding the first 10% and last 25% of the gene’s length.
We estimated the error in the fitness measurement of a gene as the weighted standard error of the mean of the fitness estimates for all the K interior TA sites within the gene:

The weights were defined as follows:
 where n0 and n1 are the number of reads at timepoints 0 and 1, respectively, and N is the number of TA sites. Maximum weights were set with n0 and n1 both equal to 100. We define the error in the fitness estimate of a gene as the inverse-variance weighted standard error of the mean:

The fitness effect of each gene is adjusted by a correction factor equal to the average fitness effect of insertions that disrupt pseudogenes. This adjustment is done to ensure that our fitness estimates are not influenced by changes in the mean population fitness during the bulk fitness assay. The mean of the DFE is:
 where N and M are the numbers of genes and pseudogenes, respectively. We define the uncertainty in the estimate of the mean of the DFE as:

Similarly, the uncertainty in the variance is defined as:

Note that the uncertainty in the variance is much smaller, because it depends only on the uncertainty in measurements of genes. The pseudogene correction factor simply shifts the fitness effects for all genes, and it has no effect on their dispersion. The uncertainty in variance scales as ~1/N, where the number of genes with fitness estimates, N, is ~3000-3500, depending on the strain. As a result of large N, even small differences in variance can be statistically significant. Conversely, the uncertainty in the mean depends on measurement uncertainty in both genes and pseudogenes, and it scales approximately as 1/N + 1/M, where the number of pseudogenes is ~100.
We restricted our analysis to those protein-coding genes with at least 5 interior TA sites; we further required that a gene had at least two trajectories meeting thresholds in both technical replicates, and that at least 20% of the gene’s TA sites were used in the fitness estimation. We chose these thresholds to ensure that we had sufficient data for every gene included in our analyses of changes in essentiality, and to exclude outlier sites in essential genes from contributing to our fitness estimates. We recognize that excluding 10% and 25%, respectively, of the 5’ and 3’ ends of a gene is an imperfect solution, but it serves to greatly reduce the impact of outliers. We also excluded all genes with annotations linked to transposons or mobile genetic elements, because they might move between sites in the genome. When comparing fitness estimates between two strains, we often found that fitness effects were calculated in one strain but not the other owing to the necessarily arbitrary thresholds. To get around this problem, we calculated fitness effects in such cases using relaxed thresholds (i.e., at least one trajectory meeting thresholds in both replicates, instead of two as used previously).
Even with relaxed thresholds, there were many cases of genes that were nonessential in one strain but did not have an estimated fitness in the other strain. To determine whether these cases arose because insertion sites were missing due to chance, or whether the gene was differentially essential in LB, we used the following approach:
- Identify all genes that are nonessential in DM25 in strain 1, and not calculated in strain 2.
- For every such gene, calculate the number of TA sites at time point 0 with coverage > 5X in both strain 1 (n1) and strain 2 (n2).
- Calculate the probability of observing n2 or fewer sites, assuming that the expected number of sites is n1.
- Adjust those p-values using the Benjamini-Hochberg False Discovery Rate (FDR).
- Define those genes for which this FDR-adjusted probability is < 0.05 as differentially essential in LB.
This approach ensures that we were conservative in calling genes differentially essential, particularly in those genes with fewer than 10 insertion sites.
To classify a gene as differentially essential between ancestral and evolved strains in DM25, we required mutations in that gene to have a fitness effect > −0.1 in one strain and < −0.3 in the other. The inclusion of the −0.1 threshold was to ensure that the difference in fitness effects between strains is sufficiently large that it cannot be attributed to measurement noise. The choice of the −0.3 threshold is based on numerical simulations of fitness effects for genes that are essential for growth in DM25, which we used to identify the most deleterious fitness effect such that the overlap in the distributions for an essential gene and a deleterious gene is < 0.05 (Supplementary Figure 4). The simulation was performed as follows:
- Fit a distribution to the number of reads per TA site from experimental data from the ANC strain at initial timepoint t0 (restrict to sites with at least 10 reads). We fit both normal and gamma distributions to the log-transformed number of reads per TA site. Both work well, but we report results using the gamma distribution fit.
- Draw an initial abundance from the fit to experimental data, which is the number of reads at t0 and called N0.
- Estimate the expected number of reads at t1 as follows:
- E[N1] = N0/100*exp((1 - s)6.64)) = N0*exp(−6.64s) if the gene is not essential. The value 6.64 equals the number of generations (doublings) of population growth per day, which offsets the 100-fold daily dilution.
- E[N1] = N0/100, if the gene is essential, such that the mutant does not grow at all. The division by 100 reflects the daily 100-fold dilution without growth.
- Draw from a Poisson distribution with mean E[N1], which we call N1.
- Estimate the simulated fitness effect as:
- s = ln((N1 + 1)/N0 + 1))/6.64.
- Repeat the simulation 5,000 times.
For the parameters that we used in our analysis, we did not find any genes that are differentially essential between the two marked variants of the LTEE ancestors (strains REL606 and REL607, which we call Anc and Anc*, respectively) that have repeatedly been shown to have equal fitness.
Data Analysis: Structural Variation
The average depth of coverage of the whole-genome sequencing data was > 60X. We used breseq (61) to identify regions of the genome that had been deleted in the evolved strains during the LTEE. We identified deletions > 1 kb using the missing-coverage evidence from the breseq output files. To identify duplicated regions, we used the samtools depth command (62) to get depth of coverage at every site in the genome, using the ancestral REL606 genome as the reference. To account for variability in coverage across the genome, we calculated the normalized coverage for each evolved strain relative to REL606. We obtained the coordinates for duplicated genes by visualizing the normalized coverage and identifying those regions where the coverage was consistently about 1.5X or higher than the background level. We set the cutoff at >1.5X coverage over background as large duplications have a tendency to be lost at a low rate during expansion of a clone to get enough DNA for sequencing.
For identifying homologs of genes, we used MMseqs2 (with parameters: --min-seq-id 0.4) with a 40% identity threshold for homologs (Steinegger and Söding 2017). We restricted our analysis to groups of homologs with only two members in the LTEE ancestor. For each evolved clone, we asked whether one member of the homologous pair had been lost during evolution and, if so, we evaluated whether the other member had become essential.
Acknowledgments
We thank Milo Johnson, Michael Desai, Andrew Murray, Thomas Bernhardt, Alejandro Couce, Olivier Tenaillon, and Célia Souque for valuable feedback and discussion; Thao Truong, Joel Sher, and Thomas Bernhardt for sharing E. coli MFDpir and donor plasmid pSC189, and for assistance with generating transposon libraries; Tanush Jagdish for help with the LTEE strains and culture conditions; and Karel Brinda and Natalia Quinones-Olvera for assistance with the bioinformatics analyses. A.L. acknowledges support from the Molecules, Cells, and Organisms Graduate Program, Harvard University. R.E.L. acknowledges support from the US National Science Foundation (DEB-1951307) and the John Hannah endowment at Michigan State University. M.B. acknowledges support from the NIGMS of the National Institutes of Health (R35GM133700), the David and Lucile Packard Foundation, the Pew Charitable Trusts, and the Alfred P. Sloan Foundation. Sequencing was performed at the Bauer Core Facility at Harvard University, and computational work used the O2 cluster supported by the Research Computing Group at Harvard Medical School.


