

Abstract
Protein tyrosine phosphatases (PTPs) are promising drug targets for treating a wide range of diseases such as diabetes, cancer, and neurological disorders, but their conserved active sites have complicated the design of selective therapeutics. This study examines the inhibition of PTP1B by amorphadiene (AD), an unusually selective terpenoid inhibitor. Molecular dynamics (MD) simulations in this study suggest that AD can sample two neighboring sites on the allosterically influential C-terminus of the catalytic domain. Binding to these sites requires a disordered α7 helix, which stabilizes the PTP1B-AD complex and may contribute to the selectivity of AD for PTP1B over TCPTP, its closest homologue. The binding mode of AD differs from that of a previously reported allosteric inhibitor; notably, biophysical measurements and MD simulations indicate that the two molecules can bind simultaneously. Upon binding, both inhibitors destabilize the α7 helix and disrupt hydrogen bonds that facilitate closure of the catalytically essential WPD loop. These findings suggest that AD is a promising scaffold for building allosteric inhibitors of PTP1B and illustrate, more broadly, how unfunctionalized terpenoids can engage in specific interactions with protein surfaces.
Introduction
Protein tyrosine phosphatases (PTPs) are an influential class of regulatory enzymes that have long eluded drug design; they are often referred to as “undruggable”.1,2 These enzymes regu-late cellular growth, motility, and oncogenic transformation, and contribute to a broad set of complex physiological processes (e.g., memory, inflammation, metabolism, and autoimmunity).3–10 Classical PTPs catalyze the hydrolytic dephosphorylation of tyrosine residues with four active site loops: (i) the P-loop (C(X)5R(S/T)), which has an arginine that facilitates substrate binding and transition state stabilization and a cysteine that engages in nucleophilic attack of the phosphate ester, (ii) the WPD loop (10-12 residues), which includes the general acid catalyst required for hydrolysis, (iii) the Q-loop, which has a glutamine that helps position a water for nucleophilic attack of the phosphocysteine intermediate, and (iv) the substrate binding loop, which selects for phosphorylated tyrosine residues. 11 The conserved active site of PTPs has hindered the design of selective therapeutics.
The catalytic domains of PTPs include allosteric networks that communicate between the active site and less conserved regions.12,13 Protein tyrosine phosphatase 1B (PTP1B) provides an illustrative example.14–16 Over the years, a myriad of biophysical analyses of this enzyme have yielded two particularly important findings: (i) the open-and-close motion of its WPD loop controls the rate of catalysis, and (ii) this motion is regulated by a network of hydrogen bonds (H-bonds) that extends to the C-terminal α7 helix on the catalytic domain.12,17–22 Interactions between the α3, α6, and α7 helices—referred to in this paper as the helical triad—affect the intermediate timescale dynamics of WPD loop motion. At conformational extremes, an ordered α7 helix stabilizes a closed WPD loop, and a disordered helix stabilizes an open WPD loop. The removal of the α7 helix reduces catalytic activity by 40-60%.23,24
Allosteric inhibitors that bind to poorly conserved sites on PTP1B are promising starting points for building selective therapeutics. An early screen identified benzobromarone derivatives that bind outside of the active site.25 These inhibitors displace the α7 helix, restrict rotation of the α3 helix, and prevent the formation of H-bonds that stabilize a closed WPD loop.24 Unfortunately, these molecules were not translated into approved drugs. Advanced biophysical methods (nuclear magnetic resonance (NMR) analyses and multi-temperature crystallography) have uncovered other allosterically influential regions—most notably, the disordered C-terminus that extends from the catalytic domain to the endoplasmic reticulum, and the “197 site”, which sits between the α3 helix and a β-sheet.26,27 The design of inhibitors that bind to these regions, however, remains challenging. To date, no inhibitors of PTP1B have entered phase III clinical trials. 7,28–34
Motivated by the paucity of well-characterized allosteric inhibitors of PTPs, we used an engineered microbial system to search for terpenoids that inhibit PTP1B.35 We reasoned that nonpolar terpenoids, if inhibitory, would bind outside of the positively charged active site. Indeed, kinetic analyses and X-ray crystallography showed that amorphadiene (AD) can inhibit PTP1B by binding to a hydrophobic declivity formed by a reorganization of its α7 helix. AD is surprisingly potent (IC50 = 50 µM) and selective, as it is a 5-to 6-fold more potent inhibitor of PTP1B than TC-PTP, which shares 69% sequence identity,36 particularly given its small size. It also appears to engage in loose, conformationally flexible binding, a behavior evidenced experimentally by ill-defined regions of electron density around its crystallographic binding site.
This study combines molecular dynamics (MD) simulations, detailed kinetic measurements, and binding studies to study the mechanism by which AD inhibits PTP1B. It focuses on three important questions: (i) How does AD interact with the α7 helix to form a stable complex? (ii) How does the PTP1B-AD complex disrupt enzyme activity? (iii) How do mechanisms of inhibition differ between AD and previously characterized benzobromarone derivatives? Answers to these questions could reveal new varieties of allosterically influential interactions with PTP1B and inform the design of new inhibitors.
Materials and Methods
Materials
We used chemically competent NEB Turbo E. coli cells for cloning and BL2(DE3) E. coli cells to express PTP1B (New England Biolabs). We purchased 3-(3,5-Dibromo-4-hydroxy-benzoyl)-2-ethyl-benzofuran-6-sulfon-icacid-(4-(thiazol-2-ylsulfamyl)-phenyl)-amide (BBR) and 2-[(Carboxy-carbonyl)amino]-4,5,6,7-tetrahydrothieno[2,3-c]pyridine-3-carboxylic acid hydrochloride (TCS 401) from Cayman Chemical (Ann Arbor, Michigan) and Er-tiprotafib from MedKoo Biosciences. We purchased HEPES Buffer (1 M 4-(2-hydroxyethyl)- 1-piperazineethanesulfonic acid, pH 7.3) from Fisher, biochemical reagents (e.g., DNA polymerase) from New England Biolabs, and DNA primers from Integrated DNA Technologies. We isolated AD from microbial cell cultures as described previously.35
Cloning and Molecular Biology
We constructed mutants of PTP1B with Gibson assembly. We designed all primers to have 60°C annealing temperatures and full complementary to facilitate plasmid assembly. We introduced point mutations near the middle of each primer to ensure proper annealing. We ligated all DNA segments at 50° C for one hour, and confirmed the presence of targeted mutations using Sanger Sequencing (QuintaraBio). Table S2 lists all primers.
Protein Expression and Purification
We overexpressed mutant and wild-type forms of PTP1B (residues 1-321) on pET16b plasmids, where the PTP1B gene was fused to a C-terminal 6x polyhistidine tag. Briefly, we transformed E. coli BL21(DE3) cells with each pET16b vector and grew the transformed cells in 1-L cultures to an OD600 of 0.5-0.8 (37° C, 225 RPM), induced them with 500 µM IPTG, and grew them at 22°C for 18 hours. We lysed the cells with lysis buffer (20 mM Tris HCl, 50 mM NaCl, 1% Triton X-100, pH 7.5) and purified PTP1B with nickel affinity and anion exchange chromatography (HisTrap HP and HiPrep Q HP, respectively; GE Healthcare). We used 10,000 MW cutoff spin columns for each buffer exchange (Satorius). We stored the final protein in HEPES buffer (50 mM, pH 7.5, 0.5 mM TCEP) in 20% glycerol at 80° C.
Analysis of Binding Affinity
We examined the binding of BBR and AD to PTP1B by measuring binding-induced changes in the tryptophan fluorescence. In brief, we measured fluorescence (280ex/370em) of 5 µM PTP1B in the presence of 0-1200 µM of BBR and 0 or 100 µM AD (50 mM HEPES, 8% DMSO, pH=7.3), and we normalized fluorescence data as follows: θ = (Wmax −Wmeas)/(Wmax −Wmin), where θ is the change in fluorescence, Wmax is the tryptophan fluorescence in the absence of ligand, Wmin is the tryptophan fluorescence at the highest concentration of ligand, and Wmeas is the measured tryptophan fluorescence. We subtracted the baseline fluorescence of 100 µM AD in assay buffer from all measurements in which AD was present. To estimate dissociation constants, we fit our binding data to a single-site model: θ = L/(L + Kd), where θ is the fraction of protein bound to ligand, and L is the concentration of free ligand. For each ligand concentration, we estimated three values of θ from independent experiments and estimated error as the standard error of the mean. We calculated 95% confidence intervals for Kd by using Matlab’s nlparci() function (Table S3).
Differential Scanning Fluorimetry (DSF)
We used DSF to examine the influence of several inhibitors (AD, BBR, Ertiprotafib, and TCS401) on the melting temperature of PTP1B. We dissolved each inhibitor in 100% DMSO at 50X the desired concentration (0–300 µM) and pre-incubated 1 µL of this solution with 49 µL of protein solution [(2 µM PTP1B, 50 mM HEPES (pH 7.3), 5X SYPRO Orange dye (Life Technologies, Eugene, OR)] for at least ten minutes; here, we ensured that the maximum inhibitor concentration reached at least 3× the IC50. We used a StepOnePlus RT-PCR instrument (Life Technologies, Eugene, OR) to perform a melting curve analysis with detection settings for the Rox reporter (580ex/621em nm) and the following temperature regime: hold at 25° C (2 min), ramp to 95°C at 1° C/min, and hold at 95° C (2 min). We exported final temperature, normalized fluorescence, and first-derivative data for the melt region (Figure S11), and estimated melting temperatures (Tm) by calculating the local minima of the negative first-derivative data (Figure 1C).37

(A) An X-ray crystal structure of PTP1B bound to AD (PDB entry 6W30) with the binding sites for BBR and TCS401 overlaid for reference. We aligned structures of PTP1B-AD, PTP1B-BBR, and PTP1B-TCS401 complex (PDB entries 6W30, 1T4J, and 5K9W) using the “align” function from PyMol. AD and BBR bind to the allosteric site, which includes residues from the α3, α6, and α7 helices; TCS401 binds to the active site, which is flanked by the WPD and P-loops. (B) Binding isotherms for BBR measured in the presence and absence of AD suggest that both molecules can bind to PTP1B simultaneously. Error bars denote standard error for n = 3 independently determined values of θ. For the Kd, values in parentheses denote 95% confident intervals. (C) Melting temperatures determined with differential scanning fluorimetry indicate that BBR and Ertiprotafib destabilize PTP1B, while AD and TCS401 do not. Error bars denote standard deviation for n = 3 technical replicates.
Molecular Dynamics (MD) Simulations
We prepared PTP1B for MD simulations by starting with three X-ray crystal structures: (i) apo PTP1B with an ordered α7 helix and a closed WPD loop (PDB code: 1SUG),38 (ii) PTP1B in complex with BBR (PDB code: IT4J),25 and (iii) PTP1B in complex with AD (PDB code: 6W30).35 Both protein-ligand complexes had an open WPD loop and a disordered α7 helix, which prevented resolution with X-ray crystallography. For each structure, we removed crystallized waters, glycerol, and Mg2+, adjusted the protonation state using the H++ web-server, added Na+ ions to neutralize the net charge, and hydrated the protein with a TIP3P water box, maintaining a minimum distance of 10 Å between the protein and the periodic boundary.
We carried out MD simulations with GROMACS 2020.4.39 In all simulations, we modeled PTP1B with the AMBER ff99sb-ildn force field and parameterized AD and BBR with the Open Force Field v.1.3.0 “Parsley”).40 Ligand parameterization scripts can be found at https://github.com/shirtsgroup/PTP1B/tree/main/ligand_parameter. We carried out an energy minimization to 100 kJ/mol/nm, and equilibrated the protein in the NVT ensemble at 300 K for 100 ps, followed by equilibration to the NPT ensemble at 300 K and 1 atm for 100 ps. All simulations used the velocity rescaling thermostat 41 and Berdensen barostat. Further configuration details for the simulations appear at https://github.com/shirtsgroup/PTP1B/tree/main/data/mdp. We ran all MD simulations for 300 ns (unrestrained NPT) and visualized MD trajectories with Visual Molecular Dynamics (VMD). 42
X-ray crystal structures of PTP1B bound to BBR or AD lack the α7 helix, which becomes partially disordered when PTP1B binds to these inhibitors. This conformational disorder prevents resolution with X-ray crystallography. Mutational analyses suggest that the disordered α7 helix mediates interactions between both inhibitors and PTP1B.24 Accordingly, for a subset of simulations, we reconstructed the α7 helix (i.e., residues 287– 299) using Modeller 10.1 and a reference structure with the helix intact (PDB 1SUG). We reconstructed missing residues using homology modelling to fit the structure of the known sequence of C-terminal residues (residues 280-299; code can be found at https://github.com/shirtsgroup/PTP1B/tree/main/build_a7. We also generated an ensemble of disordered helical conformations using restrained heating and allosteric ligand binding. We applied positional restrains (1000 kJ/mol/nm2 on all atoms) to all protein residues outside of the α7 helix (residues 1–280), heated the system gradually from 400 K to 500 K over 300 ns, and selected three disordered conformations from the final 50 ns of simulations, where the helix was completely disordered (i.e., the Defined Secondary Structure Prediction (DSSP) algorithm labeled 0% of residues α helical). We supplemented these disordered conformations with a fourth, which we selected from the final 25 ns of our simulation of the PTP1B-BBR complex initialized with an ordered α7 helix.
We initialized simulations of apo and AD-bound PTP1B with the WPD loop in open (derived from 6W30; WPDopen) and closed (derived from 1SUG; WPDclosed) conformations and with the α7 helix ordered, disordered, and absent (Table S5). The WPDclosed conformation allowed us to determine the conformational changes caused by ligand binding; however, the timescales of these simulations were potentially insufficient for PTP1B to reach a stable equilibrium. The WPDopen conformation, in turn, reduced the conformational changes required for the ligand-bound structure to equilibrate and achieved stable equilibrium on the timescale of the simulations. For BBR, we ran the same simulations used for AD, excluding those lacking the α7 helix. Previous studies have elucidated the importance of this helix in BBR binding, so we included only α7-containing structures in our analysis of the PTP1B-BBR complex.
Analysis of MD Trajectories
Before completing analysis on our MD trajectories in detail, we carried out two important processing steps: (i) removal of correlated trajectory frames (ii) removal of unequilibrated trajectory frames. Correlated trajectory frames were removed with ruptures 1.1.6.43 Ruptures is a change point detection software that allows for segmentation of non-stationary signals like trajectory RMSD values based on change points. We determined change points using the binary segmentation method with a threshold on the residual norm. Unequilibrated trajectory frames were removed based on the root-mean-square deviation (RMSD) of backbone atoms, relative to the starting structure for the production simulation. We defined the equilibration point as the point at which the RMSD fluctuations plateau and the mean of 100 ps simulation blocks does not vary by more than Å consistently for a minimum of 1 ns.
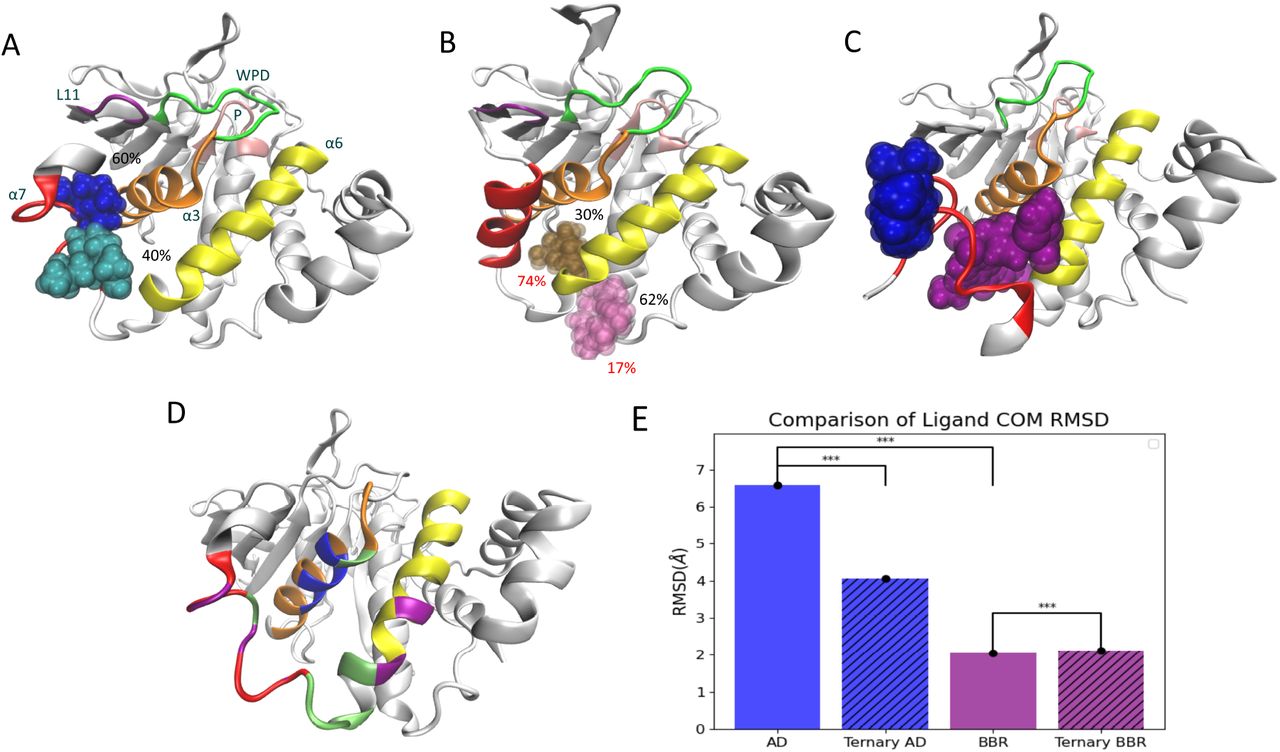
Our MD trajectories suggested that AD can bind to several different sites on PTP1B. We classified these binding sites as follows (also pictured in Figure 2A–B):

AD is capable of occupying a diverse set of binding conformations. (A) In MD simulations initialized with a disordered α7 helix, AD samples two adjacent sites with equal frequency: the crystallographic site (loc1; blue) and a neighboring site (loc2; turquoise). The percent occupancy of both sites is shown. (B) When the α7 helix begins with an ordered conformation, AD moves to two new sites: loc3 (pink) and loc4 (brown). (C) In MD simulations initialized with AD and BBR at their crystallographic binding sites, AD moves to the outside of the α7 helix and remains at this location for the duration of the 1 µs trajectory. In A–C, the protein and ligand represent centroid structures from the corresponding MD trajectories. (D) During MD trajectories, AD (bound to loc1 and loc2) and BBR interact with the same core set of residues (green) and several residues specific to AD (blue) or BBR (purple). (E) A comparison of RMSDs for the centers of mass (COM) of AD and BBR in different complexes. AD exhibits significantly higher fluctuations than BBR in complex with PTP1B, a result of frequent oscillations by AD between adjacent binding locations. In the ternary complex, AD exhibits significantly reduced COM motion, as it no longer oscillates between binding locations. BBR experiences a 3% increase in COM RMSD in the ternary complex; this change is statistically significant but very small, relative to differences in the COM RMSDs of BBR and AD, or AD in the presence and absence of BBR.
At loc1, the crystallographic binding location, AD engages in simultaneous interactions with the α3 and α7 helices without interacting with the α4 and α5 helices or the N-terminal region of the α6 helix (residues 264–270);
At loc2, AD interacts with the α6 and α7 helices without interacting with the α4 or α5 helices and engages in no more than one interaction with the α3 helix;
At loc3, AD interacts with the α3, α4, and α6 helices without interacting with the α5 or α7 helices;
At loc4, AD interacts with the α4 and α6 helices without interacting with the α3 or α7 helices.
We considered the ligand to be unbound when it had no interactions with the α3–α7 helices. In the above, we define interactions as a distance of 5 Å between heavy atoms in the ligand and protein residues, a relatively generous distance.
The WPD loop of PTP1B can adopt an open or closed conformation. We classified its position by the distance between the α-carbons of D181 and C215 (i.e., the catalytic acid and the nucleophile, respectively),19,44,45 as measured using using the gmx_dist function of GROMACS. Crystal structures with the WPD loop in closed and open states had D181–C215 distances of 8 and 15 Å, respectively, so we used a distance of 10 Å to differentiate between states: WPDclosed (< 10 Å) and WPDopen (> 10 Å). As confirmation, all MD trajectories showed a bimodal distribution with a minimum at approximately 10 Å (Figure S5D).
We examined the helicity of the α7 helix in our MD trajectories by using the DSSP algorithm implemented in MDTraj 1.9.4.46 This algorithm characterizes the secondary structure of each residue based on the ϕ and ψ torsional angles. Importantly, DSSP can differentiate between different types of helices: α helix, 310 helix, and π helix. This analysis allowed us to characterize the order, or lack thereof, of the α7 helix. In this paper, “α helicity” is specific to residues with an α helix conformation while “helicity” alone generalizes to include all aforementioned helix types.
To further classify the structure of PTP1B throughout the simulations, we evaluated the RMSD of the backbone atoms and the root-mean-square-fluctuation (RMSF) of select protein regions, relative to a centroid structure. We defined the centroid structure by clustering each trajectory on the backbone atoms of the equilibrated trajectory using gmx_cluster. For each trajectory, we evaluated the RMSD of the backbone atoms relative to both (i) the centroid structure for the trajectory and (ii) the centroid structure for the trajectory of the apo protein initialized with the WPD loop in the closed conformation (with an ordered α7 helix). The second analysis allowed us to search for structural changes in the WPD loop caused by inhibitor binding.
We also clustered the simulations with ligands bound on the ligand heavy atoms. We concatenated all trajectories with the ligand bound in the crystallographic binding pose prior to clustering. The centroid of the most populated cluster as the ligand centroid. We computed the RMSD for the ligand center of mass (COM) relative to these ligand centroid structures. We determined the COM coordinates using the MDTraj compute_center_of_mass and computed the RMSD using the following equation:
 . We used bootstrapping random sub-sampling techniques to determine the mean and standard error of the ligand COM RMSD value.
The catalytic domain of PTP1B has seven α-helices that play an important role in allosteric communication. We quantified inter-helical interactions and helix-ligand interactions as those with a residue-residue or residue-ligand distance of less than 5 Å. We defined inter-helical interactions disrupted by ligand binding as those that occur significantly less (p < 0.05) in the ligand bound vs corresponding apo conformation. We calculated the p-value using Welch’s T-test for the fraction of the simulation time that the interaction was present for the ligand bound (AD or BBR) compared to apo trajectories.
We isolated allosterically influential H-bonds with several steps. (i) We used the Baker-Hubbard model implemented within MDTraj to identify H-bonds. This model uses a proton donor-acceptor distance of 2.5 Å and a donor-acceptor angle of less than 120° to classify H-bonds. (ii) We removed H-bonds formed in a majority of all trajectories, regardless of WPD loop conformation or the presence of an allosteric inhibitor, and calculated the percent of the trajectory in which each of the remaining H-bonds appeared. (iii) For each H-bond, we sorted this percent into four groups: Apo WPDopen, Apo WPDclosed, AD bound, and BBR bound. (iv) We identified bonds that showed a statistically significant (p < 0.05) difference between the groups. (v) Using our statistical threshold, we selected bonds that appeared more in either apo WPDopen or apo WPDclosed to define H-bonding networks in each of these conformations. Notably, no H-bonds appeared significantly more frequently with ligands bound than in the apo WPDopen. In assembling the final H-bonding networks, we omitted two H-bonds that showed a statistically significant difference between the two conformations because the magnitude of these differences was particularly small, relative to other H-bonds selected for the network, and the bonds showed no connection to either the active site or allosteric site.
Analysis of Influential Mutations
We used our MD trajectories to build a list of mutations likely to modify interactions between PTP1B and each allosteric inhibitor. To begin, we selected a subset of residues that (i) showed more interactions with AD than BBR, or vice versa, or that (ii) previous studies suggested would influence binding, and we generated a list of mutations that would change the size and/or polarity of their side chains. Our initial list included F196A, L192A, L192F, L192N, L195A, L195F, L195N, F280Y, S286A, E276F, K279M, and V287T. We generated these mutations using Modeller and carried out MD simulations using the protocol discussed above. We chose a subset of mutations—F196A, L192F, L195F, E276F, V287T, and F280Y—to examine in experimental studies. Selection criteria were those that affected the binding of AD and BBR, that appeared to change the binding location, that created inhibitor-mediated disruption of inter-helical interactions, or appeared to affect the stability of the protein-ligand complex.
For each of the mutations the relative binding free energy was approximated using alchemical transformations via MD simulations. The hybrid topology for each mutation was generated using the PMX web-server and the hybrid residues were parameterized with the PMX hybrid force field.47 GROMACS free energy simulations were run utilizing Hamiltonian replica exchange with all parameters available at https://github.com/shirtsgroup/PTP1B/tree/main/data/mdp. The alchemical states were optimized with a single mutation (F196A) in order to maximize overlap between adjacent states, minimize error, and converge estimates from various estimators (Figure S3). These λ states were then utilized for all other mutations. Analysis of the simulations was completed using Alchemlyb with the TI, MBAR, and BAR estimators. For the final binding free energy estimate, the difference between the change in free energy for PTP1B in solvent and PTP1B-AD complex in solvent was computed and the errors of each estimate were added together (Table S6). The error reported for the relative free energy estimates is the analytical error estimated from the sub-sampled 50 ns trajectories at 18 λ states.48
Enzyme Kinetics
We characterized PTP1B activity on p-nitrophenyl phosphate (pNPP) by monitoring the formation of p-nitrophenol (absorbance at 405 nm) in 10-second intervals for 5 min (SpectraMax iD3 plate reader). The composition of each reaction was as follows: PTP (0.05 µM), pNPP (10 mM), BBR (0, 9.6, or 14.4 µM), AD (0, 77, or 115.5 µM), and (50 mM HEPES, 10% DMSO, 50 µg/ml BSA, pH 7.3). The enzyme and inhibitor were incubated together for 5 min before adding the substrate. For each inhibitor, we used previously reported IC50s13,35 to identify the concentrations of each inhibitor that inhibit the wild-type enzyme to a similar extent for both inhibitors (Figure S12). We report kinetic measurements in Table S4.
For each mutant, we evaluated the fractional change in inhibition (F) by using Eq. 1, where Vo−mut and Vo−wt are the uninhibited initial rates of the mutant and wild-type enzyme,
 respectively, and Vo−mut(I) and Vo−wt(I) are the inhibited initial rates. We report values of Vo−wt, Vo−wt(I), Vo−mut, Vo−mut(I), and F in Table S4, and we plot values of F in Figure 3B and Figure 4.

Mutations in the helical triad tend to disrupt inhibition by AD and BBR. (A) An X-ray crystal structure of PTP1B bound to AD (PTPB entry 6W30) with several other binding sites overlaid: (i) the crystallographic binding site for BBR and (ii) two sites sampled by AD in MD simulations (loc 1 and loc2) carried out with a disordered α7 helix. To position the alternative sites, we aligned the PTP1B-AD complex (PDB entry 6W30) with the PTP1B-BBR complex (pdb entry 1T4J) and centroid structures from MD simulations (PyMol function “align”). Labels denote residues selected for site-directed mutagenesis with colors by helix. (B) The fractional change in inhibition (F) caused by mutations at the sites highlighted in A. Most mutations decreased the inhibitory effects of AD and BBR. Error bars denote propagated standard error for n=4 independent measurements.

Mutational effects arise from delocalized structural changes in PTP1B. The influence of mutations on AD-mediated inhibition is weakly correlated with their effect on enzyme activity (measured Vo, the initial rate of pNPP hydrolysis in the absence of inhibitor) but not binding affinity (ΔΔG, the difference in free energy of binding between mutants, as calculated from relative free energy simulations (using MBAR for analysis) or the mean percent α helicity of the α7 helix. Shaded regions correspond to the wild-type activity of PTP1B (top), ±0.1 kcal/mol (middle), and the percent α helicity of the wild-type enzyme with WPDopen (bottom). Error bars denote standard error for (top) n > 4 independent measurements and (middle and bottom) 50 ns simulations at 18 alchemical states. See Materials and Methods for a detailed description of our calculation of standard error for alchemical free energy calculations.
Estimation of Sequence Identity
We estimated the percent sequence identity between protein segments by using structure and sequence information. We aligned structural elements of the two proteins used the VMD multi-sequence alignment tool, and we verified the resulting alignment by comparing it to a previous alignment by Singh et al.36 Briefly, to compare the catalytic domains of PTP1B and TCPTP, we aligned residues 1–298 from PTP1B and 1–296 from TCPTP. To compare just the α7 helices we aligned residues 284–299 from PTP1B and 282–297 from TCPTP.
Results and Discussion
AD and BBR Bind to Distinct Sites on PTP1B
X-ray crystal structures of PTP1B bound to AD and BBR, a well-characterized benzobromarone derivative,25 indicate that these inhibitors bind to non-overlapping regions of the allosteric site (Figure 1A). We assessed their ability to bind simultaneously by measuring the binding affinity of BBR for PTP1B in the presence and absence of AD (Figure 1B). As expected, the binding affinity of BBR did not diminish—and, in fact, increased slightly—in the presence of AD. This mild synergy suggests that AD and BBR bind to different sites and bring about similar, or otherwise noncompeting, conformational changes in PTP1B. We utilized MD simulations to further probe the dynamic binding behavior of both AD and BBR.
AD is an unusual inhibitor because it is a hydrocarbon that lacks polar anchoring groups, such as H-bond donors or acceptors, yet still exhibits selective binding. We speculated that AD might destabilize PTP1B by acting as a non-polar denaturant—that is, by reducing the free energetic cost of exposing buried residues in water.49 A recent study of Ertiprotafib, a PTP1B inhibitor that entered clinical trials, found that this compound reduced the melting temperature of PTP1B and induced aggregation, an effect consistent with protein denaturation.50 We used differential scanning fluorimetry (DSF) to compare the impact of four inhibitors on the stability of PTP1B: AD, BBR, Ertiprotafib (a positive control), and TCS401 (a competitive inhibitor; Figure 1C). To our surprise, BBR and Ertiprotafib reduced the melting temperature in a concentration-dependent manner (ΔTm > 5° C), while AD and TCS401 had no effect (ΔTm < 1° C, a threshold consistent with prior work51). This data suggests that AD does not inhibit PTP1B through nonspecific destabilization.
AD Samples Two Neighboring Sites in PTP1B
We used MD simulations to study the mechanism by which AD forms a stable complex with PTP1B. To begin, we initialized PTP1B with a disordered α7 helix and positioned AD at the crystallographic binding site (loc1). Initially, we used four versions of the disordered α7 helix, but only the two less flexible conformations (i.e., the two conformations for which residues in the α7 exhibited lower RMSFs) allowed AD to remain bound (Figure S1A). This finding suggests that a partially—but not fully—disordered α7 helix is required for AD to bind. The importance of the α7 helix is consistent with the selectivity of AD for PTP1B over TCPTP. The α7 helices of these two proteins have similar sequences (i.e., 66% sequence identity compared to 69% for the full catalytic domain) but dissimilar allosteric influences.36,52 Their structural rearrangement would not necessarily have the same effect on catalytic activity. We used only the two conformations of α7 that retained AD in the allosteric binding site to model the disordered helix for the remainder of our study.
Over the course of our MD simulations, AD sampled two neighboring sites—loc1 and loc2—with similar occupancies, 60% of the equilibrated trajectory in loc1 and 40% in loc2, as shown in Figure 2A. Movement of the ligand between the two sites did not correlate with conformational changes in the protein. Accordingly, AD may transition between sites too quickly to elicit such changes, as the mean transition time was ∼ 50 ns, or the two sites may not be sufficiently distinct to cause distinct structural rearrangements. When we repeated our simulations with an ordered α7 helix, or with the α7 helix completely removed, AD sampled two alternative sites, loc3 and loc4, the latter of which had a higher occupancy (Figure 2B; Figure S1). These alternative sites sit outside of the helical triad and do not produce the same structural changes in PTP1B. The importance of a flexible α7 helix in facilitating the binding of AD to its crystallographic site (loc1) and a close neighboring site (loc2) is consistent with previous kinetic measurements, which show that the removal of α7 reduces the potency of AD.35
To identify unique characteristics of the PTP1B-AD interaction, we used MD simulations to study the binding of BBR, an alternative allosteric inhibitor. We initialized PTP1B with both an ordered and disordered α7 helix, as prior kinetic experiments indicate that the presence of the α7 helix enhances inhibition by BBR.24 In a subset of trajectories carried out with the ordered α7 helix, BBR bound with an elongated conformation that differed from its crystallographic pose (Figure S4). This strange binding behavior, which coincided with a closed WPD loop, occurred only in simulations in which the α7 helix differed from its crystal conformation, or in those that failed to retain BBR in complex with PTP1B. We focused the remainder of our analysis on trajectories with conformations of the α7 helix that allowed BBR to remain bound with its crystallographic pose. Both BBR and AD exhibited prominent interactions with the α3–α7 helices, including π-stacking with F280, but BBR engaged more substantially with the α7 helix while AD interacted more with the α3 helix (Figure 2D; Figure S6). This finding suggests that BBR may be more sensitive to the conformation of the α7 helix than AD. Unlike AD, BBR does not oscillate between different binding locations, a behavior evidenced by the significantly higher RMSD for the center of mass (COM) of AD compared to BBR (Figure 2E).
AD Moves to Accommodate BBR in a Ternary Complex
Intrigued by the ability of AD to bind to multiple sites, we examined its behavior in the presence of BBR. Using MD simulations, we initialized PTP1B with a disordered α7 helix and positioned AD and BBR at their non-overlapping crystallographic binding sites. To our surprise, BBR displaced AD, which moved quickly (∼500 ps) to a patch formed by residues 290–295 on the outside of the α7 helix, opposite to the BBR binding site. AD stayed at this position, which is located ∼8.5 Å from its initial binding site, for the duration of the 1 µs simulation (trajectory centroid shown in Figure 2C). Intriguingly, in the ternary complex, the region of the α7 helix in contact with AD exhibited reduced fluctuations, while the rest of the helix became more flexible (relative to the PTP1B-AD or PTP1B-BBR complexes; Figure S1B). Additionally, AD exhibited decreased flexibility in the ternary complex compared to the PTP1B-AD complex, a change in mobility consistent with stabilization of AD by BBR binding (Figure 2E). The ability of AD and BBR to bind simultaneously and synergistically to PTP1B is consistent with our binding data (Figure 1B).
Mutations in the Helical Triad Disrupt AD-mediated Inhibition by Eliciting Delocalized Structural Changes in the Protein
We probed the mechanism by which AD inhibits PTP1B by introducing mutations likely to interfere with ligand binding or allosteric inhibition. We identified residues in the helical triad that modify the binding pose of AD or BBR or that disrupt helical interactions in MD simulations, used site-directed mutagenesis to change the size or chemical functionality of these residues, and measured the fractional change in inhibition caused by each mutation with in vitro kinetic measurements (Figure 3B). All but one mutation (F280Y) reduced inhibition by AD and BBR and, in general, mutational effects were more pronounced for BBR than for AD. The reduced sensitivity of AD is consistent with its ability to adopt multiple bound conformations. Mutations that reduced inhibition by AD also appeared to increase the activity of PTP1B (Figure 4); however, the two effects were not strongly correlated (e.g., consider E276F and V287T). The origin of specific mutational effects was difficult to rationalize from their locations in the helical triad. Molecular modeling allowed us to examine the influence of mutations on binding affinity.
We used relative free energy simulations to estimate the difference in binding free energy between mutants and WT PTP1B. Our calculations suggest that changes in the free energy of binding are not directly correlated with the fractional change in inhibition (Figure 4). Given the current limitations on the accuracy of the relative free energy protocol, which provides a maximum resolution of ∼1 kcal/mol,53 a direct comparison between binding affinities is challenging to make; however, our analysis suggest that none of these mutations causes a statistically significant increase or decrease in binding affinity.
Mutations could disrupt inhibition by AD and BBR by altering the conformation of the α7 helix, which mediates interactions between PTP1B and both inhibitors. We used MD simulations to explore this effect. Interestingly, most mutations reduced the α helicity of α7, but this structural perturbation was not correlated with changes in inhibition (Figure 4). Overall, the molecular modeling studies, when paired with kinetic measurements, suggest that mutations disrupt AD-mediated inhibition through delocalized structural changes that affect catalysis at the active site, rather than binding to the allosteric site.
We probed the structural basis of mutational effects further by examining catalytically influential regions of PTP1B. Mutations L192F, L195F, E276F, and V287T caused residues 186–191, which connect the WPD loop to the α3 helix, to shift their orientations toward those adopted in the WPDclosed state (Figure S13A,C). This conformational change may contribute to the enhanced catalytic activity of these mutants, though F196A, which also enhanced activity, did not show this effect. F196A did rearrange the α4 helix to a distinct conformation that may elicit subtle difference in the motion of the connected P-loop (Figure S13E), though previous NMR analyses suggest that the motion of this loop is negligible and has little influence on catalysis. Additionally, conformational differences between F196A and other mutants in MD simulations were not statistically significant.54 Mutations L192F, L195F, and E276F caused the α6 helix to rearrange, which could disrupt communication between inhibitors and the active site; however, this rearrangement is not consistent across mutations (Figure S13B,D). Intriguingly, all mutations stabilize the catalytic C215, with the mean MRSD of this residue decreasing relative to the wild-type enzyme, and reorient the L1 loop (residues 27–35; Figure S13F–G), a common influence that seems to belie their distinct effects on inhibition. Generally, our analysis of mutations suggests that they cause structural perturbations in a broad set of regions involved in allosteric communication between the WPD loop and the α7 helix.
AD and BBR Destabilize the α7 Helix and Disrupt WPD Loop Motions
We sought to determine how AD modulates PTP1B activity by using MD simulations to trace allosteric communication between its binding site and the active site. We began by mapping the H-bonds that link ordering of the α7 helix to closure of the WPD loop (Figure 5B; Figure S7). These bonds connect (i) the WPD, L11, and P loops, (ii) a small loop that spans the β6 and β7 strands, and (iii) the α6 and α7 helices (Figure 5A). These regions match those identified in prior work, but differ in the specific H-bonds that connect the regions20,24,55(Figure S8). This inconsistency suggests that allosteric communication within PTP1B may include some redundancy, with multiple different H-bonds enabling allosteric communication between the same neighboring regions. In our simulations, the H-bonding network stabilizes the WPD loop in a closed conformation, and disordering of the α7 helix makes its constituent H-bonds less likely to form (Figure 5A–B; Figure S7).
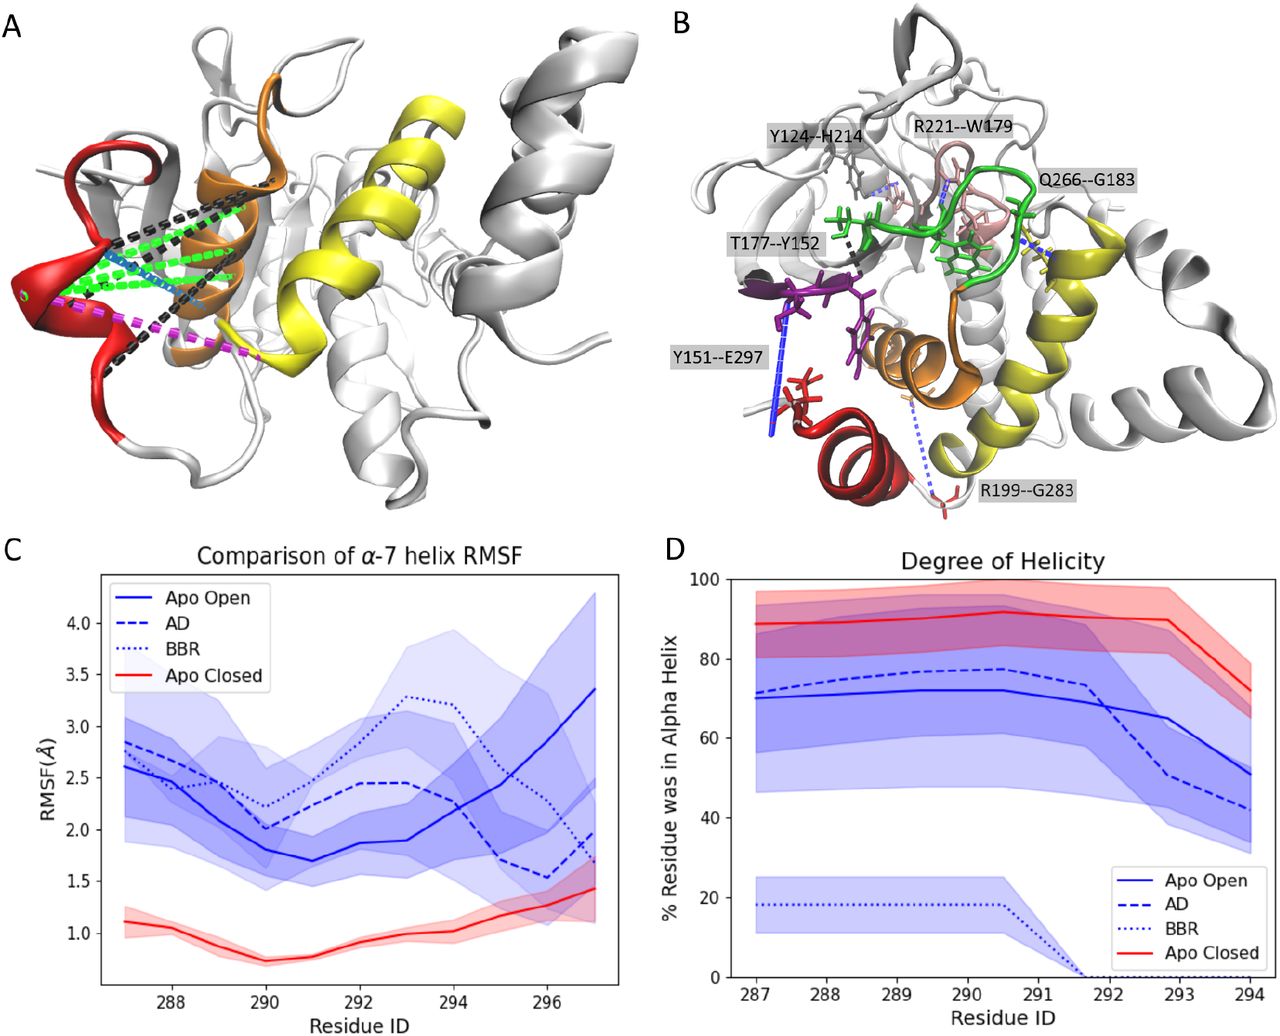
Ligand binding disrupts inter-helical interactions. (A) Upon binding, AD and BBR disrupt H-bonding interactions between the α3, α6, and α7 helices. Highlights: (black) interactions disrupted in the WPDopen conformation that are also disrupted when AD and BBR bind to the protein, (green) interactions disrupted by both ligands but not WPDopen, (purple) interactions disrupted by BBR alone, and (blue) interactions disrupted by AD alone (Figure S10). Most of the interactions disrupted by AD, BBR, and WPDopen are located between the α3 and α7 helices. This overlap suggests that that the disruption of these interactions is crucial for allosteric inhibition. (B) Disruption of the interactions depicted in A destabilizes the α7 helix and prevents the formation of H-bonds required for closure of the WPD loop. Highlights: (blue) bonds that form when the WPD loop closes but that fail to form when PTP1B is bound to BBR or AD. (C–D) Upon binding, AD and BBR (C) increase the flexibility of the α7 helix and (D) decrease its α helicity to levels that resemble the WPDopen conformation. Destabilization of the α7 helix is faster with BBR than with AD (Fig. S2). In C–D, all MD trajectories start with the same ordered α7 helix conformation.
We evaluated the influence of AD and BBR on the stability of the α7 helix by initializing MD simulations with an ordered helix. Both inhibitors enhanced the flexibility of the α7 helix and accelerated its disordering, relative to the apo structure (Figure 5C–D). Intriguingly, AD exhibited this effect while bound to its alternative sites (loc3 and loc4) and may shift back to loc1 and loc2 when the helix becomes sufficiently disordered (a shift that likely takes too long for our 300 ns simulations). Prior work has linked disordering of the α7 helix to opening of the WPD loop; if this loop cannot close, the enzyme remains inactive.
Our simulations suggest that AD prevents reordering of the α7 helix and WPD loop closure by disrupting interactions between the α3 and α7 helices (Figure 5A; Figure S9). In the absence of an allosteric inhibitor, the WPDopen conformation of PTP1B lacks interactions between the α3 and α7 helices that form when the WPD loop is closed. Upon binding, AD or BBR disrupt additional interactions between these two helices (Figure S9A). BBR also disrupts α6–α7 interactions, but AD does not (Figure S9C). This non-overlapping effect between the two inhibitors suggests that disruption of the α6–α7 interaction is not required for allosteric communication with the active site. The interactions disrupted between the α3 and α7 helices, by contrast, are conserved between the two inhibitors, an indication that this disruptive effect is centrally important to allosteric inhibition.
Conclusions
Unfunctionalized terpenoids are a surprising source of selective inhibitors because their nonpolar structures seem well suited to engage in nonspecific interactions with nonpolar regions on protein surfaces.56 In this study, we used a variety of biophysical methods to study the inhibition of PTP1B by AD, a surprisingly potent and selective terpenoid inhibitor. MD simulations suggest that AD samples two adjacent sites near the C-terminus of the catalytic domain, both of which require a disordered α7 helix. When the helix is fully ordered, AD binds to two alternative sites and destabilizes the α7 helix. When the α7 helix is too flexible or absent, AD does not stay stably bound. The importance of the α7 helix in stabilizing the PTP1B-AD complex may explain the selectivity of AD for PTP1B over TCPTP, a close homologue with a distinct α7 helix. The flexible binding of AD suggests an interesting tradeoff between potency and selectivity; a terpenoid that is less sensitive to the conformation of the α7 and surrounding regions might bind more tightly by permitting a broader ensemble of bound states, but would likely be less selective for PTP1B over TCPTP, as it might begin to access helical conformations on both proteins that disrupt activity. MD simulations and biophysical measurements indicate that AD and BBR exhibit distinct binding mechanisms; notably, AD does not destabilize PTP1B, and the two molecules can bind simultaneously. Compounds designed from a combination of these two inhibitors might exhibit improved potency.
The inhibitory mechanisms of AD and BBR are similar but not identical. MD simulations of apo PTP1B show a network of H-bonds that links ordering of the α7 helix to closure of the WPD loop. The sections of PTP1B connected by this network match those uncovered in prior work, but the H-bonds involved are slightly different, an indication that allosteric communication within PTP1B may have some redundancy. Upon binding, both AD and BBR destabilize the α7 helix and prevent closure of the WPD loop. Interestingly, AD primarily disrupts interactions between the α3 and α7 helices, while BBR disrupts both the α3–α7 and α6–α7 interfaces. The shared disruptive effect on the α3 and α7 helices suggests that the interface formed by these two helices is centrally important to allosteric inhibition. Our findings also indicate that mutations in this triad can weaken the effects of inhibitors, likely through delocalized structural changes. These mutations, some of which can enhance PTP1B activity, could enable resistance to therapeutics that rely on allosteric inhibition.
Terpenoids are the largest class of natural products, but many—if not, most—are decidedly non-druglike, breaking Lipinski’s rule of five. 57 As a result, they tend to be overlooked in early stages of drug discovery such as high-throughput screens of compound libraries.58 This analysis provides evidence that unfunctionalized terpenoids can engage in specific interactions, which can reveal new binding sites or binding modes, such as the conformationally flexible binding of AD, or elucidate novel mechanisms of allosteric modulation. These interactions could inform the design of new varieties of potent and selective enzyme inhibitors.
Supporting Information
Supplementary figures detailing analyses of alternative conformations of the α7 helix, relative free energy calculations, binding-induced changes in WPD loop conformation, interactions between AD and BBR and the helical triad, allosteric communication within PTP1B, differential scanning fluorometry, and AD-and BBR-mediated inhibition of PTP1B; tables describing the binding conformations of AD in MD simulations, primers used for site-directed mutagenesis, initialization criteria used for MD simulations, binding measurements, and kinetic measurements.
Author Contributions
A.J.F, J.M.F. and M.R.S conceptualized the project. A.J.F. and M.R.S. designed the computational methodology, and E.T.L, L.K., A.S., and J.M.F. designed the experimental methodology. A.J.F. performed and analyzed all molecular simulations experiments. A.J.F. wrote the original draft. J.M.F. and M.R.S. edited and reviewed the manuscript. E.T.L carried out site-saturation mutagenesis, protein purification, and inhibition measurements. L.K. performed differential scanning fluorimetry experiments. A.S. completed binding studies. J.M.F. and M.R. supervised the project and obtained the resources.
Notes
J.M.F. is a founder of Think Bioscience, Inc., which develops small-molecule therapeutics and employs J.M.F., A.S., and L.K. M.R.S. is an Open Science Fellow at and consultant for Roivant Sciences.
Acknowledgements
This work was supported by funds provided by the University of Colorado Boulder (A.J.F and M.S.), the National Institute of General Medical Sciences of the National Institutes of Health (E.T.L., R35GM143089), the National Science Foundation (A.S. and J.M.F., CBET 1750244), and Think Bioscience (L.K.). This work utilized computational resources from the University of Colorado Boulder Research Computing Group, which is supported by the National Science Foundation (awards ACI-1532235 and ACI-1532236), the University of Colorado Boulder, and Colorado State University. This work also used the Extreme Science and Engineering Discovery Environment (XSEDE), which is supported by National Science Foundation grant number ACI-1548562. Specifically, it used the Bridges-2 system, which is supported by NSF ACI-1928147 at the Pittsburgh Supercomputing Center (PSC).
Abbreviations
- PTP1B
- protein tyrosine phosphatase 1B
- TCPTP
- T-cell protein tyrosine phosphatase
- MD
- molecular dynamics
- AD
- amorphadiene
- BBR
- 3-(3,5-Dibromo-4-hydroxy-benzoyl)-2-ethyl-benzofuran-6-sulfonicacid-(4-(thiazol-2-ylsulfamyl)-phenyl)-amide
- TCS401
- 2-[(Carboxycarbonyl)amino]-4,5,6,7-tetrahydro-thieno[2,3-c]pyridine-3-carboxylic acid hydrochlo-ride
- DSSP
- Defined Secondary Structure Prediction
References
- (1).↵
- (2).↵
- (3).↵
- (4).
- (5).
- (6).
- (7).↵
- (8).
- (9).
- (10).↵
- (11).↵
- (12).↵
- (13).↵
- (14).↵
- (15).
- (16).↵
- (17).↵
- (18).
- (19).↵
- (20).↵
- (21).
- (22).↵
- (23).↵
- (24).↵
- (25).↵
- (26).↵
- (27).↵
- (28).↵
- (29).
- (30).
- (31).
- (32).
- (33).
- (34).↵
- (35).↵
- (36).↵
- (37).↵
- (38).↵
- (39).↵
- (40).↵
- (41).↵
- (42).↵
- (43).↵
- (44).↵
- (45).↵
- (46).↵
- (47).↵
- (48).↵
- (49).↵
- (50).↵
- (51).↵
- (52).↵
- (53).↵
- (54).↵
- (55).↵
- (56).↵
- (57).↵
- (58).↵


