

Abstract
The fine control of synaptic function requires robust trans-synaptic molecular interactions. However, it remains poorly understood how the landscape of trans-synaptic bridges dynamically remodels to reflect functional states of the synapse. Here we developed novel optical tools to visualize in firing synapses the molecular behavior of a particular secreted trans-synaptic protein, LGI1, and its presynaptic receptor, ADAM23, and discovered that neuronal activity acutely rearranges the abundance of these proteins at the synaptic cleft. Surprisingly, LGI1 in synapses was not secreted, as described elsewhere, but exo- and endocytosed through its interaction with ADAM23. Activity-driven translocation of LGI1 facilitated the formation of trans-synaptic connections proportionally to the history of activity of the synapse, modulating excitatory transmission correlatively to synaptic firing rates. Thus, our findings reveal that LGI1 abundance at the synaptic cleft can be acutely remodeled and serves as critical point of activity-dependent control of synaptic function.
Highlights
- Neuronal activity translocates LGI1 and ADAM23 to the presynaptic surface
- LGI1 and ADAM23 are not located in synaptic vesicles
- Stable cleft localization of LGI1 depends on the history of synaptic activity
- LGI1 abundance at the synaptic cleft controls glutamate release
Introduction
Physiological function of the mammalian brain relies on the orchestrated activity of excitatory and inhibitory synapses in neural circuits to encode the complexity of information driving cognition and behavior. Neurotransmission requires not only that individual pre- and post-synaptic sites work properly, but also that they are accurately connected in space through well-defined trans-synaptic interactions (Contractor et al., 2002; Fossati and Charrier, 2021; Fossati et al., 2019; Fukata et al., 2006; Gorlewicz and Kaczmarek, 2018; Takahashi et al., 2012; Uemura et al., 2010; Woo et al., 2009). The fine control of the trans-synaptic molecular architecture is essential to maintain and dynamically modulate synaptic efficiency (Tang et al., 2016), and it is now well established that distortions of trans-synaptic signaling cause synaptic dysfunction in several neuropsychiatric disorders, including epilepsy (Gorlewicz and Kaczmarek, 2018). However, understanding how the complex molecular profile of a well-functioning synaptic connection is established, maintained and dynamically adjusted over time, and how altering these processes results in diseased brain states remains an unsolved research challenge.
The function of a particular trans-synaptic complex, formed between Leucin-rich, glioma inactivated 1 (LGI1) and its receptors ADAM22 and ADAM23, is essential to sustain circuit function in vivo, as lack of LGI1 function causes epilepsies of both genetic and autoimmune aetiology. Genetic mutations in LGI1 cause Autosomal Dominant Lateral Temporal lobe Epilepsy (ADLTE) (Kalachikov et al., 2002) and autoantibodies against LGI1 cause a form of limbic encephalitis (LE) associated with cognitive decline and seizures (Fels et al., 2021; Kornau et al., 2020; Lai et al., 2010; Ohkawa et al., 2013). Interestingly, ablating expression of LGI1 only in excitatory neurons causes epilepsy in mice, while selectively removing it from inhibitory neurons does not (Boillot et al., 2014), suggesting an important presynaptic role for LGI1 in the regulation of excitatory transmission in the brain. At the excitatory synaptic cleft, LGI1 acts as the molecular connector between presynaptic ADAM23 and postsynaptic ADAM22 receptors, linking structurally and functionally pre- and postsynaptic sites (Fels et al., 2021; Yamagata et al., 2018). At the presynaptic level, LGI1-ADAM23 has been proposed to facilitate the function of the potassium channel Kv1.1, modulating the shape of the presynaptic action potential to curb activity-driven Ca2+ entry and reduce glutamate release (Extrémet et al., 2021; Petit-Pedrol et al., 2018; Seagar et al., 2017). Congruently, loss of LGI1 globally leads to increased glutamate release (Boillot et al., 2016; Lugarà et al., 2020), which adequately provides a hypothesis on how LGI1 dysfunction could cause epilepsy. However, at the postsynaptic site LGI1-ADAM22 interacts with PSD-95 to enhance AMPA and NMDA receptor function (Fukata et al., 2010, 2021a; Yokoi et al., 2021). In contrast to the increase in presynaptic function, loss of LGI1 decreases postsynaptic processing of neurotransmission, which has led to propose that LGI1 controls postsynaptic glutamate receptor function exclusively in inhibitory neurons (Fukata et al., 2021b). In this alternative model, LGI1 dysfunction decreases excitatory activation of inhibition to cause epilepsy.
While several studies using in vivo models have made clear that loss of LGI1 causes increased brain excitation and epilepsy (Baulac et al., 2012; Boillot et al., 2014; Fukata et al., 2010; Ramberger et al., 2020; Yokoi et al., 2021), controversy remains on how LGI1 localization and function can control the physiology of excitatory function, in part due to the lack of powerful tools to study the molecular behavior of LGI1 in single synapses. To tackle this, we developed a novel optical tool, LGI1-pHluorin, which allows monitoring for the first time LGI1 surface localization and trafficking in live firing synapses. Using this tool, we found that neuronal activity drives LGI1 translocation at presynaptic terminals, leading to an increased accumulation of LGI1 at the synaptic cleft of firing synapses. Increasing synaptic surface LGI1 levels narrows the presynaptic action potential waveform (AP), which in turn reduces AP-driven Ca2+ entry and glutamate release in a synapse-specific manner, suggesting that activity-driven molecular rearrangement of LGI1 trans-synaptic bridges modulates excitatory transmission correlatively to synaptic firing rates. These experiments reveal a critical role for neuronal activity in shaping the molecular architecture of trans-synaptic connections, framing future investigations into the molecular control of neurotransmission and brain excitability by LGI1 and other trans-synaptic molecules.
Results
Neuronal activity drives LGI1 translocation to the synaptic surface
Early studies identified LGI1 as a secreted protein by expressing it in heterologous cell lines and measuring its constitutive secretion into the culture media, showing for the first time that several pathological mutations inhibited LGI1 secretion in this system (Senechal et al., 2005; Sirerol-Piquer et al., 2006). However, despite this semi-quantitative assay has become today the standard procedure on analyzing how novel mutations impair LGI1 secretion (de Bellescize et al., 2009; di Bonaventura et al., 2011; Chabrol et al., 2007; Dazzo et al., 2016; Yokoi et al., 2014), it does not recapitulate optimally the physiological subcellular context where LGI1 functions in the brain. Alternatively, expression of His-Flag tagged LGI1 has been used to visualize LGI1 at the surface of fixed neurons (Fukata et al., 2010), but this method lacks the spatiotemporal resolution to visualize the molecular behavior of LGI1 at the synaptic cleft in living neurons. To circumvent these limitations and explore with higher precision how the presence of LGI1 at the synaptic cleft is regulated, we developed a novel optical tool that allows selective visualization of surface-localized LGI1 molecules in live synapses. We fused pHluorin, a pH-sensitive variant of GFP, to the c-terminal end of LGI1. The fluorescence of pHluorin is quenched by acidic pH, which is typically found in the lumen of intracellular compartments such as synaptic vesicles, dense-core vesicles, secretory granules or presynaptic endosomes. However, when pHluorin is exposed to the extracellular neutral pH, it becomes ∼100 times more fluorescent (Sankaranarayanan et al., 2000) (Figure 1A). We expressed LGI1-pH in primary excitatory hippocampal neurons that were co-cultured with astrocytes, a system that optimizes the optical access to single synapses and allows to robustly quantify dynamic changes in fluorescence in individual nerve terminals (Ashrafi et al., 2020; Ganguly et al., 2021; de Juan-Sanz et al., 2017). Co-expression of LGI1-pH together with the presynaptic marker synapsin-mRuby confirmed the expected preferential localization of LGI1-pH at the synaptic surface of live neurons, showing ∼3 times more relative synapse-by-axon signal at rest than a construct that simply expresses pHluorin in the entire surface of the neuron (Figure S1A-B).
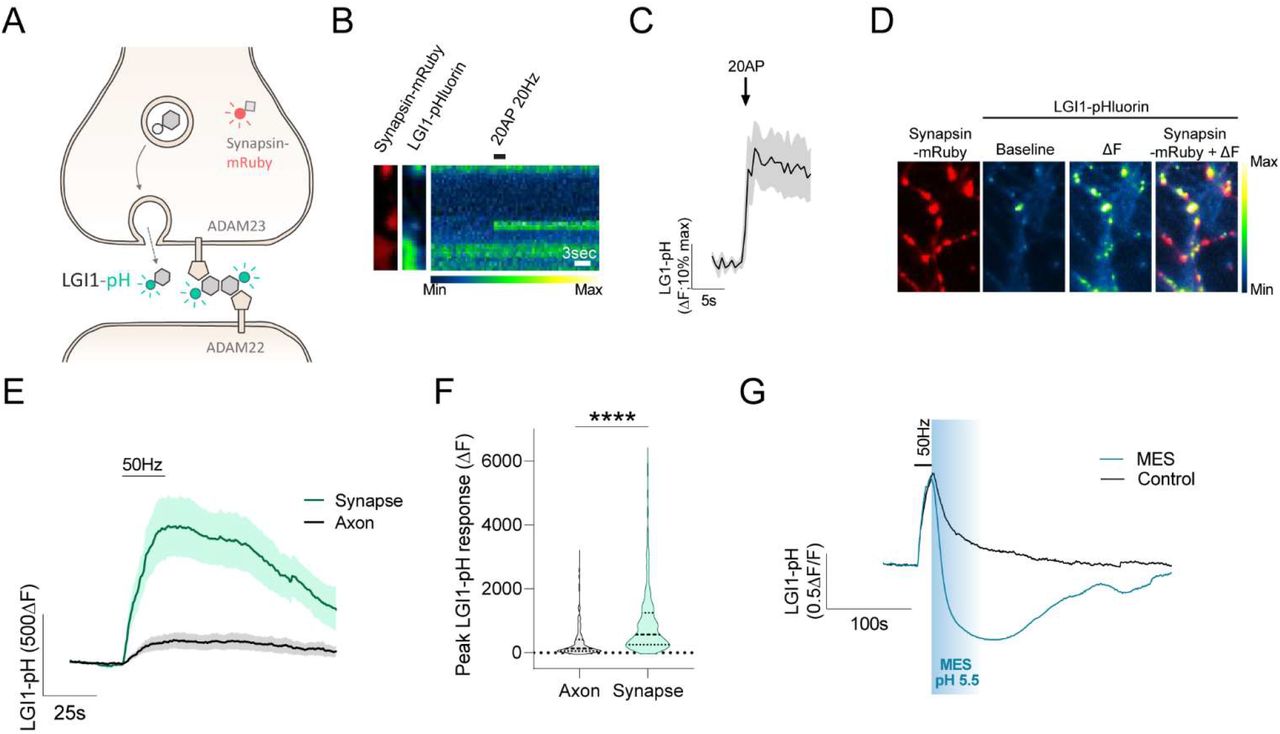
(A) Diagram showing LGI1-pHluorin (LGI1-pH), which is not fluorescent when located intracellularly (shown in grey) but becomes fluorescent when exposed at the surface (shown in green). Synapsin-mRuby is a presynaptic marker. (B) LGI1-pH signals in presynaptic boutons identified by synapsin-mRuby (left, colored in red) at rest (middle image) and during a 20AP 20Hz stimulus (displayed as a kymograph, right; pseudocolor scale shows low to high intensity). Scale bar, 3s. (C) LGI1-pHluorin response to 20AP 20Hz stimulus shown as average trace (n=8 boutons, error bars are SEM). (D) Example traces of LGI1-pH response to 50Hz electrical stimulation during 20s in control or in the presence of pH 5.5 MES solution. (E) LGI1-pH response during 1000AP 50Hz electrical stimulation (ΔF) colocalizes with presynaptic bouton marker synapsin-mRuby; pseudocolor scale shows low to high intensity. (F) Average traces of LGI1-pH responses to 1000AP 50Hz stimulation in synaptic boutons versus axonal regions of the same neurons (n=5). Bars are SEM. (G) Quantification of peak LGI1-pH response showin in (F) from axonal (n=302) versus bouton regions (n=448). Mean ± SEM ΔF change is 346.2 ± 28.81 (a.u.) for axon and 937.8 ± 47.90 (a.u.) for synapses. Mann-Whitney test; ****p<0.0001.
We next quantified what fraction of LGI1 is present at the synaptic surface or inside presynaptic intracellular compartments by quenching the surface population using a non-permeable acidic solution and subsequently revealing the total amount of LGI1-pH using ammonium chloride (NH4Cl) (See STAR methods) (Sankaranarayanan et al., 2000). Surprisingly, our estimates showed that ∼70% of synaptic LGI1 was located in presynaptic intracellular compartments (Figure S1C), an unexpectedly high fraction for a surface-localized neuronal protein (van Oostrum et al., 2020). We hypothesized that such large internal pool ideally facilitates regulating the abundance of LGI1 at the synaptic surface on demand, permitting the translocation of a significant amount of LGI1 molecules during certain functional states, such as neuronal activity. To test this hypothesis, we electrically stimulated LGI1-pH-expressing neurons to mimic physiological firing paradigms of hippocampal place neurons in vivo, such as firing at 20Hz for 1 second (Grieves et al., 2016), and found translocation of LGI1 to the presynaptic neuronal surface in isolated boutons of the synaptic arborization (Figure 1B, C). We next verified that such presynaptic increase in LGI1-pH signal arose from surface accumulation. To facilitate LGI1 translocation in the majority of boutons, neurons were stimulated at 50Hz during 20 seconds and we subsequently confirmed that such increase was fully quenched by rapid perfusion of a low-pH solution (Figure 1D, see STAR Methods). We noticed that LGI1-pH translocation to the surface occurred preferentially in synapses (Figure 1E). Quantifying changes in fluorescence in synapses versus inter-synapse axonal regions of the same axons revealed that virtually no change is found in the axon outside of presynaptic sites (Figure 1F, G). Conversely, no increase was observed in somas and dendrites as consequence of back-propagated action potentials, which contrarily generated a slight decrease in the signal (Figure S1D). Such decrease, however, is likely a reflection of activity-driven acidification of the endoplasmic reticulum, where LGI1-pH is transiently located while being synthetized, as an ER-localized pHluorin construct also reports a decrease in fluorescence during same stimulation paradigms (Figure S1E) and estimates of compartment pH obtained from neurons expressing ER-pHluorin or LGI1-pH in the dendrites appeared indistinguishable (Figure S1F). Taken together, these results show for the first time, to our knowledge, that neuronal activity controls LGI1 translocation to the synaptic surface at the presynapse.
LGI1 is not located in synaptic vesicles
We next asked whether the intracellular pool of LGI1 vesicles is distinct from that of synaptic vesicles (SVs) and dissected this issue with several complementary approaches. First, leveraging the use established methods to quantify pH inside organelles harboring pHluorin (Sankaranarayanan et al., 2000), we found that the pH of presynaptic LGI1 vesicles was around ∼6.1, significantly more alkaline than our pH estimates from synaptic vesicles labelled with vGlut1-pHluorin (Figure 2A). Looking closely at the behavior of LGI1-pH in single boutons during electrical stimulation, we found that not all presynaptic sites responded simultaneously as known for SV trafficking (Figure 2B, top panel), but rather exocytosis events appeared to be delayed at least in 50% of the responding boutons (Figure 2B, lower panel). We quantified the delay time between stimulation start and peak response in single boutons of neurons expressing either vGlut1-pH or LGI1-pH, and found that, compared to the average time for synaptic vesicles to reach their maximal exocytosis, LGI1-pH exocytosis events were delayed on average more than 5 seconds and could be delayed up to 20s seconds in some boutons (Figure 2C). We also quantified the decay times after peak fluorescence, which were significantly slower in the case of LGI1-pH (Figure 2D, E), supporting the idea that LGI1 vesicles are distinct from synaptic vesicles. Next, we reasoned that LGI1 exocytosis delays in individual boutons could be the consequence of a looser coupling between activity-driven Ca2+ entry and binding to the Ca2+ sensor present in LGI1 vesicles, making the process of exocytosis less efficient than in the case of synaptic vesicles, and thus, more prone to failure. To test this hypothesis, we incubated neurons expressing either vGlut-pH or LGI1-pH in the presence of EGTA-AM, a calcium chelator that impairs channel-vesicle coupling to greater extents in loosely coupled exocytosis mechanisms (Nakamura et al., 2018). We calibrated EGTA-AM exposure and concentration to have a relatively small impact on synaptic vesicle exocytosis during prolonged stimulation at 50Hz and tested whether in such conditions LGI1-pH exocytosis was significantly affected. Our results revealed that, contrarily to synaptic vesicles, LGI1-pH vesicle exocytosis is greatly blocked by the presence of EGTA-AM, thus revealing a much looser coupling to Ca2+ for exocytosis (Figure 2F, G). Lastly, we reasoned that if LGI1 vesicles are not synaptic vesicles, they should not contain neurotransmitter transporters. Recent data demonstrated that presence of neurotransmitter transporters in synaptic vesicles generates a steady-state H+ leak that is counteracted by the constitutive function of the vesicular H+-ATPase (vATPase), which continuously pumps H+ back to the synaptic vesicle lumen to maintain its H+ gradient. Acutely blocking vATPase using bafilomycin reveals the H+ leak, which can be quantified using pHluorin (Figure 2H, black trace). As in SVs of excitatory neurons the H+ leak is driven by the presence of vGlut transporters, we reasoned that if LGI1 vesicles are not synaptic vesicles, they should not present a H+ leak. We applied bafilomycin in neurons expressing LGI1-pH and confirmed that LGI1 vesicles, contrarily to synaptic vesicles, do not constitutively leak protons, indicating that they do not contain neurotransmitter transporters (Figure 2H, I). Taken together, these experiments demonstrate that LGI1 vesicles are distinct from synaptic vesicles, despite they are present at presynaptic sites and undergo activity-driven exocytosis.

(A) Vesicle pH in vGlut-pH vesicles (n=13) in comparison to LGI1-pH vesicles (n=25). Mean ± SEM vGlut-pH, 5.77 ± 0.04 pH units; LGI1-pH, 6.11 ± 0.05 pH units. t-test; ****p<0.0001. (B) vGlut-pH and LGI1-pH signals in presynaptic boutons identified by synapsin-mRuby expression (left, colored in red) at rest (middle image) and during a 1000AP 50Hz stimulus (displayed as a kymograph, right; pseudocolor scale shows low to high intensity). Scale bar, 5s. (C) Quantification of delay in exocytosis of vGlut-pH vesicles (n=1191 boutons) versus LGI1-pH vesicles (n=784 boutons). Mann-Whitney test; ****p<0.0001. Mean ± SEM, 5.197 ± 0.03 seconds for vGlut-pH and 8.57 ± 0.18 seconds for LGI1-pH. (D) Average traces of vGlut-pH (n=11) and LGI1-pH (n=11) responses to 1000AP 50Hz electrical stimulation. Error bars are SEM. (E) Quantification of endocytosis times after stimulation measured as the time to reach back half the amplitude of the peak response (t half) in vGlut-pH vesicles (n=11; mean ± SEM: 10.55 ± 1.26 seconds) and LGI1-pH vesicles (n=9; mean ± SEM: 36.39 ± 7.92 seconds). t-test; ***p<0.001. (F) Example traces of vGlut-pH (upper traces in black) and LGI1-pH (lower traces in blue) responses to 50Hz stimulation before (continuous line) and after (dotted line) 10 minutes of 2mM EGTA-AM treatment on the same neuron. (G) Quantification of the relative remaining response of vGlut-pH (n=10; 0.67 ± 0.12) and LGI1-pH (n=10; 0.16 ± 0.06) after EGTA-AM treatment. In this scale, 1=no EGTA effect, 0=complete block of the response by EGTA. t-test; **p<0.01. (H) vGlut-pH (n=4) and LGI1-pH (n=7) responses to bafilomycin 500nM over time. Changes are normalized to the maximal fluorescence change, obtained by applying NH4Cl at pH 6.9, the cytosolic pH. (I) Quantification of H for vGlut-pH (n=4, mean ± SEM, 0.50 ± 0.05) and LGI1-pH (n=7, -0.04 ± 0.05) neurons. Mann-Whitney test; **p<0.01.
LGI1 in neurons is not secreted but trafficked bound to ADAM23
LGI1 is considered to be a secreted protein, and indeed, it can accumulate in the conditioned media of primary neurons that have been cultured for several days (Baulac et al., 2012). As our stimulation paradigm exposes ∼35% of the internal pool of LGI1 molecules, we reasoned that such secretion event should lead to a significant depletion of the intracellular pool of LGI1 by secretion. We tested such hypothesis by 1) revealing the total pool of presynaptic LGI1 in the presence of NH4Cl in unstimulated neurons, 2) electrically stimulate them to confirm LGI1-pH translocation and 3) measure again the total pool of LGI1-pH in the same presynaptic sites, which should reveal the extent to which the internal pool was depleted by activity-driven secretion. Surprisingly, these experiments did not reveal any change in the total amount of LGI1-pH after stimulation (Figure 3A, black traces; Figure 3B, left panel). This suggests, unexpectedly, that during activity LGI1 is mostly not secreted but exo- and endo-cytosed. Given that LGI1 does not contain a transmembrane domain and it can behave as a secreted protein in heterologous cells and neurons, we reasoned that its ability to undergo exo- and endo-cytosis has to be conferred through an interaction with a transmembrane receptor. At the presynaptic site, LGI1 interacts with ADAM23, a single-transmembrane receptor of the disintegrin and metalloproteinase domain-containing protein family (Owuor et al., 2009). Incorporating the Y433A mutation in LGI1 disrupts such interaction (Yamagata et al., 2018). We reasoned that incorporating the Y443A mutation should force presynaptic LGI1 to behave as a secreted protein, as ADAM23 would not be able to retain it for subsequent endocytosis after translocation. We first generated the LGI1Y433A-pH mutant, which expressed well, was located in an intracellular compartment with the same pH as wild type LGI1 and translocated to the surface during activity to the same extent as wild type (See below; Figure 5). To test whether LGI1Y433A-pH is secreted during activity, we followed the same approach as for wild type LGI1 and we measured the total pool of LGI1Y433A-pH in synapses before and after stimulation. Remarkably, we found the total amount of LGI1Y433A-pH was significantly reduced after activity (Figure 3A, blue traces; Figure 3B, right panel). This suggests that if LGI1 cannot bind ADAM23, LGI1 molecules translocated during activity are secreted and lost from the presynapse. As the LGI1 mutant Y433A impairs binding to both ADAM22 and ADAM23, we next studied the behavior of a mutant that selectively blocks the interaction with ADAM22 but preserves the interaction with ADAM23, the epilepsy-associated S473L mutant (Yokoi et al., 2014). When compared to wild type LGI1, LGI1S473L-pH was located in an intracellular compartment with the same pH and translocated during activity to the synaptic surface with similar dynamics and amplitude (See below; Figure 5). However, contrarily to mutant Y433A, LGI1S473L-pH did not behave as a secreted protein but was exo- and endo-cytosed as wild type LGI1, as its total pool remained unchanged after robust neuronal activity (Figure S2A), indicating that its preserved ability to bind ADAM23 prevents it from behaving as a secreted protein.

(A) Example traces comparing LGI1-pH and LGI1Y433A-pH ΔF responses to MES (pH 5.5) and NH4Cl (pH 7.4) to reveal the total levels of LGI1 at presynapses before and after electrical stimulation, noted as the light and dark traces, respectively. (B) Quantification of total LGI1 levels in synapses of expressing WT LGI1-pH (n=16) or LGI1Y433A-pH mutant (n=11) before and after electrical stimulation. Wilcoxon matched-pairs signed rank test; LGI1 WT, n.s; **p<0.01 for Y433A. (C) Diagram showing ADAM23-pHluorin (ADAM23-pH), only fluorescent when expressed at the surface. (D) ADAM23-pHluorin signals in presynaptic boutons identified by synapsin-mRuby expression (left, colored in red) at rest (middle image) and during a 1000AP 50Hz stimulus (displayed as a kymograph, right; pseudocolor scale shows low to high intensity). Scale bar, 10s. (E) Average trace of ADAM23-pHluorin responses to 1000AP 50Hz stimulus (n=6). Bars are SEM. (F) Quantification of delay in exocytosis of vGlut-pH vesicles (n=1191 boutons) versus ADAM23-pH vesicles (n=361 boutons). Mann-Whitney test; ****p<0.0001. Quartiles (small, dotted lines) and median (dotted line). Mean ± SEM, 5.197 ± 0.03 seconds for vGlut-pH and 8.07 ± 0.27 seconds for ADAM23-pH. Note that the data shown for vGlut-pH is already shown in figure 2C but displayed here again for clarity in the comparison to ADAM23. (G) Quantification of endocytosis times after stimulation measured as the time to reach back half the amplitude of the peak response (t half) in vGlut-pH vesicles (n=11; mean ± SEM: 10.55 ± 1.26 seconds) and ADAM23-pH vesicles (n=10; mean ± SEM: 40.55 ± 4.41 seconds). Student’s t-test; ***p<0.001. (H) Vesicle pH in vGlut-pH vesicles (n=13) in comparison to ADAM23-pH vesicles (n=25). Mean ± SEM vGlut-pH; 5.768 ± 0.04064; ADAM23-pH; 6.546 ± 0.07896. t-test; ****p<0.0001.

(A) Example traces of LGI1-pH (left, blue) and of vGlut-pH (right, black) in response to 1000AP 50Hz electrical stimulation. Dotted line indicates the baseline before stimulation. (B) LGI1-pH fraction present at the synaptic surface before and after electrical stimulation (1000AP 50Hz) for individual neurons (n=14 paired neurons). Wilcoxon matched-pairs signed rank test; ***p<0.001. (C) vGlut-pH fraction present at the synaptic surface before and after electrical stimulation (1000AP 50Hz) for individual neurons (n=6 paired neurons). Wilcoxon matched-pairs signed rank test; n.s. (D) Example images of LGI1-pHluorin expression levels at the surface (middle panel) and total (right panel, revealed by NH4Cl pH 7.4) in control neurons versus neurons treated with TTX for 5 days. Presynaptic boutons are identified by synapsin-mRuby (left, in red). Pseudocolor scale shows low to high intensity. (E) Fraction of LGI1-pH present at the synaptic surface in control (n=18) versus neurons treated with TTX for 5 days (n=19). Mean ± SEM, 35.18 ± 4.13 for control and 12.20 ± 1.82 for TTX. Mann-Whitney test, ****p<0.0001. (F) Fraction of ADAM23-pH present at the synaptic surface in control (n=11) versus TTX treated neurons (n=7). Data are mean ± SEM, 46.47 ± 2.536 for control and 26.27 ± 3.354 for TTX. Mann-Whitney test, ***p<0.001. (G) Diagram showing experimental flow to biochemically isolate synaptic cleft proteins (see materials and methods). (H) Example blot for total biotinylation rates in neurons expressing LRRTM-HRP treated with or without TTX for 5 days; Minus signal (-) indicates a negative control in which reaction was not run. (I) Example western blot experiment showing endogenous LGI1 levels isolated from the synaptic surface in control and neurons treated with TTX for 5 days (top panel), with the same experimental conditions shown in (H). As a control, endogenous levels of synaptically-localized GluR1 remained unchanged (lower panel). (J) Quantification of endogenous levels of LGI1 at the synaptic surface in TTX treated neurons, Mann-Whitney test, *p<0.05; and total levels of LGI1 obtained from whole cell lysate of the same experiments. Mann-Whitney test, n.s.

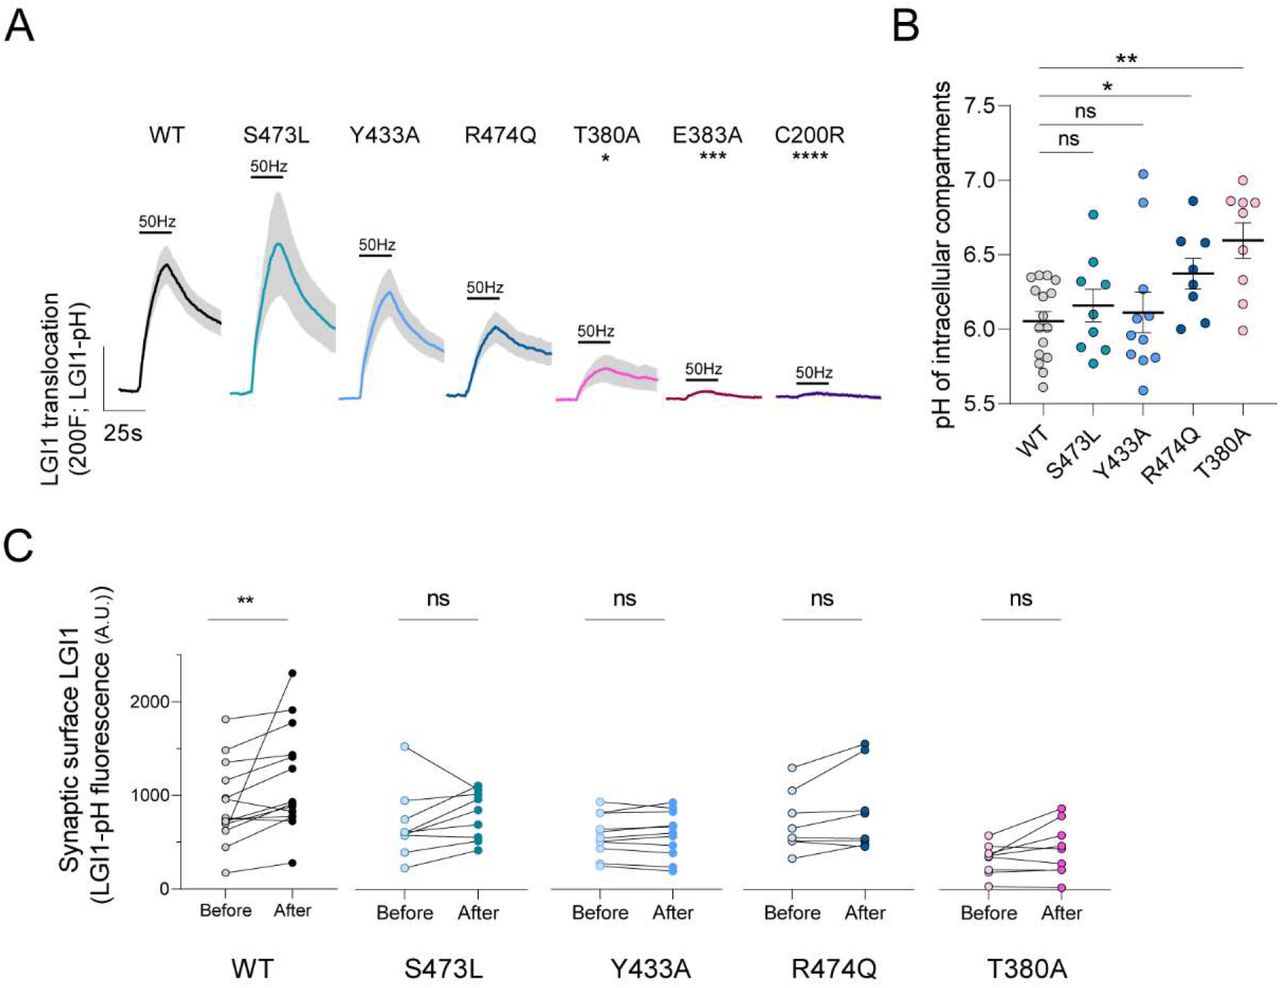
(A) Average ΔF response traces to 1000AP 50Hz stimulation of pHluorin-tagged LGI1 constructs: WT, S473L, Y433A, R474Q, T380A, E383A and C200R. Bars are SEM. Dunn’s multiple comparisons test of the peak response of WT vs. T380A*p<0.05, WT vs. E383A ***p<0.001 and WT vs. C200R****p<0.0001. Comparison of wild type peak responses to responses of mutants S473L, Y433A and R474Q did not reveal significant differences (n.s., p>0.05). (B) pH of intracellular compartments containing pHluorin-tagged LGI1 constructs WT, S473L, Y433A, R474Q or T380A. Data are mean ± SEM in pH units, n=16, 6.05 ± 0.06 pH units for WT; n=9, 6.16 ± 0.11 for S473L; n=11, 6.11 ± 0.14 for Y433A; n=8, 6.37 ± 0.10 for R474Q; n=9, 6.60 ± 0.12 for T380A. t-test, WT vs. S473L n.s.; WT vs. Y433A n.s.; WT vs. R474Q *p<0.05; WT vs. T380A, ***p<0.001. (C) Stable synaptic surface LGI1-pH change after 1000AP 50Hz electrical stimulation, measured 5min after stimulation, for WT (n=14), S473L (n=9), Y433A (n=11), R474Q (n=8) and T380A (n=9) conditions. Wilcoxon matched-pairs signed rank test; **p<0.01.
We next hypothesized that if LGI1 requires ADAM23 for trafficking, ADAM23 should also undergo activity-driven translocation with similar dynamics. To test this, we designed a novel construct in which we cloned pHluorin after the signal peptide of the n-terminus of ADAM23, generating pHluorin-ADAM23 (ADAM23-pH, Figure 3C). Similarly to LGI1-pH, neuronal activity robustly drove ADAM23-pH translocation on demand to the presynaptic surface (Figure 3D, E). ADAM23-pH appeared to locate mostly in intracellular compartments at the presynapse that presented a pH more alkaline than SV pH (Figure 3H). This increase in fluorescence during stimulation was delayed in many individual boutons, similarly to LGI1 (Figure 3F), and was followed by a decay in the signal with a similar half-time decay to LGI1 (Figure 3G). These results support the idea that during activity LGI1 is not secreted but undergoes exo- and endo-cytosis bound to ADAM23.
Activity controls the stable localization of LGI1 at the synaptic surface
In vivo studies have shown that the extent to which LGI1 can be secreted, and thus be present at the synapse, is a key controlling point for brain excitability (Yokoi et al., 2014), yet the molecular control of LGI1 stabilization at the synaptic surface remains unknown. We noticed that after stimulation, fluorescence of LGI1-pH at the synapse did not fully return to the baseline after endocytosis, suggesting that a number of new LGI1 molecules were stabilized on the synaptic surface after activity (Figure 4A). To quantify this more precisely, we measured the surface fraction of LGI1-pH at the presynapse before and after stimulation (see STAR Methods). While the total amount of LGI1 remains unchanged (Figure 3A, B), the percentage of LGI1 molecules at the synaptic surface stably increased by ∼30% when measured 5 to 10 min after firing (Figure 4B). In a different set of experiments, we stimulated three times longer at the same frequency, which also increased LGI1-pH stabilization by ∼30% (Figure S3A), indicating that activity-driven increases in surface LGI1 may reach a saturation point, at least for a single stimulation train. As a control, the same stimulation paradigm did not induce surface stabilization of vGlut-pH, indicating that the activity-driven synaptic stabilization observed in LGI1 is not generalizable to other presynaptic proteins that traffic during firing (Figure 4C). These results indicate that the presence of LGI1 at the synaptic surface in a given time is controlled by the history of firing of such synapse.
To test this hypothesis, we reasoned that inhibiting spontaneous firing in culture for several days should decrease synaptic surface localization of LGI1. We transfected LGI1-pH and two days later neurons were treated for five days with tetrodotoxin (TTX), a selective inhibitor of neuronal Na+ channels that results in blockage of action potential propagation. We found that LGI1-pH was hardly detectable in the surface of TTX-treated neurons, which presented on average a reduction in LGI1 surface localization of 70% compared to untreated neurons (Figure 4D-E). We confirmed that this is not a consequence of loss of expression of LGI1 by TTX, as LGI1-pH total pool is not only not reduced, but even slightly increased (Figure S3B). To confirm that stable surface localization of endogenous LGI1 in synapses is controlled by their history of firing, we isolated endogenous synaptic cleft proteins in control and TTX-treated neurons using recent technologies for synaptic cleft proximity biotinylation (Figure 4G). In this technique specific isolation of synaptic cleft proteins is achieved by expressing only in excitatory synapses a postsynaptic surface protein from the LRRTM family fused to a biotinylating enzyme (HRP), and running a local biotinylation reaction for 1 minute exclusively in the synaptic surface leveraging the use of a biotin-phenol variant that cannot cross the plasma membrane (Loh et al., 2016). We first confirmed that TTX treatment did not impair biontinylation rates (Figure 4H). However, TTX treated neurons presented a significant reduction in the abundance of endogenous LGI1 at the synaptic cleft (Figure 4I, J). As controls, the abundance in the synaptic surface of other synaptic cleft proteins, such as GluRI, remained unchanged (Figure 3I), and the total amount of endogenous LGI1 was not affected by TTX treatment. Taken together, these experiments show that neuronal activity is a major regulatory element in the control of LGI1 surface localization at excitatory synaptic clefts and show that the extent to which LGI1 is present at the synaptic surface reflects the history of activity of the synapse.
Epilepsy-associated LGI1 mutants present translocation or stabilization defects at the synapse
Our novel tools have enabled us to discover previously unrecognized mechanisms controlling LGI1 abundance at the synaptic cleft. Loss of LGI1 function at the synaptic surface is thought to cause epilepsy because most pathogenic mutations inhibit LGI1 protein secretion in heterologous cells (Baulac et al., 2012; di Bonaventura et al., 2011; Chabrol et al., 2007; Kalachikov et al., 2002; Yokoi et al., 2014). However, a few disease-causing LGI1 mutants can be easily found in the media of transfected heterologous cells (Dazzo et al., 2016), and thus what is dysfunctional in these cases remains poorly understood. We reasoned that LGI1-pHluorin should enable straightforward quantitative analyses of the molecular dysfunction of LGI1 disease-causing mutations. As such, we generated a series of LGI1-pHluorin mutants that in HEK cells are known to be secretion-defective (C200R, E383A) or secretion-positive (S473L, R474Q), together with a mutant (T380A) whose behavior remains controversial, as it has been claimed to be both secretion-defective (Yokoi et al., 2014) and secretion-positive (Dazzo et al., 2016). Using LGI1-pHluorin, we first saw that secretion-defective mutants C200R and E383A appeared mostly retained in the neuronal somatic ER, did not show any detectable surface LGI1 in synapses at rest (not shown) and did not undergo activity-driven translocation (Figure 5A). In contrast, for mutant T380A we observed a reduced, yet detectable presence at the synaptic surface (Figure S4A, S4B), and electrical stimulation drove its translocation to the synaptic cleft, although with much less efficiency than wild type LGI1 (Figure 5A). We measured the pH of presynaptic the intracellular compartment where LGI1T380A was located and found it to be significantly less acidic, with a pH ∼7 (Figure 5B). This is likely the consequence of this mutant being in LGI1 vesicles (pH ∼6.1) but also partially retained in axonal ER, whose pH ∼7.2 (de Juan-Sanz et al., 2017), and thus the final measurement reflects a mix of both populations at the synapse. The partial localization of LGI1T380A at the ER also matches with its detectable but reduced capacity to undergo activity-driven translocation, as ER localized LGI1 molecules should in principle be unable to undergo exocytosis. Leveraging the quantitative nature of our measurements, these data resolve the current controversy around the molecular behavior of this mutant by demonstrating that its translocation is severely impaired, despite detectable.
Following the same strategy, we next studied secretion-positive mutants S473L and R474Q. Both mutants were found at the synaptic surface in levels comparable to wild type LGI1 (not shown). However, LGI1R474Q presented a small yet significant defect in its pH compartment, indicating that this mutation is partially retained in the ER, despite being classically considered as fully secretion-competent. On the other hand, the extent of activity-driven translocation of LGI1S473L was indistinguishable from wild type LGI1. However, as LGI1S473L cannot bind ADAM22, we reasoned that it should not be able to undergo synaptic stabilization after activity to the same extent as wild type LGI1. Following the methodology outlined for wild type LGI1 we found that indeed LGI1S473L did not get stably increased in synapses after activity (Figure 5C). Supporting this idea, the surface presence of LGI1Y433A, which also cannot interact with ADAM22, did not stably increase after firing (Figure 5C). These analyses exemplify the robustness of LGI1-pHluorin to precisely study how disease-causing mutations impair LGI1 function, allowing dissecting many different aspects of dysfunctionality beyond large defects in secretion. Moreover, these experiments demonstrate that our novel tools provide the field with a much more powerful approach to dissect the pathogenicity of newly-identified LGI1 mutations, which should help defining whether novel variants identified by molecular genetic testing could indeed cause epilepsy.
LGI1 surface abundance in individual boutons serves as a major modulatory mechanism of glutamate release
Loss of LGI1 increases glutamate release from excitatory hippocampal neurons (Boillot et al., 2016; Lugarà et al., 2020), as LGI1 constitutively constrains the function of the potassium channel Kv1.1, curbing activity-driven Ca2+ entry and reducing glutamate release (Petit-Pedrol et al., 2018; Schulte et al., 2006; Seagar et al., 2017). Thus, we reasoned that the extent to which LGI1 is present at the surface of individual boutons should result in proportional synapse-specific readjustments of the magnitude of action potential (AP)-driven Ca2+ entry and glutamate release. To test this hypothesis, we generated a novel construct to visualize surface LGI1 in a different color to be able to combine single bouton measurements of LGI1 surface localization with activity-driven Ca2+ entry or glutamate release. For this, we used pHmScarlet (Liu et al., 2021), a recently developed red pH-sensitive fluorescent protein optimized to monitor trafficking events (Figure 6A). The extent to which LGI1-pHmScarlet is present in the synaptic surface was reduced by the history of activity (Figure 6B), as observed for LGI1-pH (Figure 4D, E) and endogenous LGI1 (Figure 4G-J). We reasoned that if surface LGI1 is controlling AP-driven Ca2+ entry and glutamate release, neurons in which surface LGI1 is reduced by TTX treatment should present increased Ca2+ entry and glutamate release. Thus, we first co-expressed LGI1-pHmScarlet together with the genetically-encoded Ca2+ sensor jGCaMP8f and measured the magnitude of AP-driven Ca2+ entry in neurons treated or not with TTX for 5 days. We found that neurons in which surface LGI1 was reduced by TTX presented a ∼30% increase in presynaptic Ca2+ entry during single action potential firing (Figure 6C-E), in agreement with the proposed function of LGI1 as a controller of the presynaptic action potential shape (Petit-Pedrol et al., 2018; Schulte et al., 2006; Seagar et al., 2017). As Ca2+ entry directly controls vesicle fusion and glutamate release, we next measured in the same conditions the extent to which glutamate release is affected by the observed increase in Ca2+. To do this, we leveraged the use of novel genetically-encoded glutamate sensors that present improved activation kinetics and localization for imaging synaptic transmission. iGluSnFR3 exhibits fast non-saturating activation dynamics and reports synaptic glutamate release with improved linearity and specificity versus extrasynaptic signals (Aggarwal et al., 2022). Single action potential firing generated robust presynaptic iGluSnFR3 signals as previously reported (Figure 6F), and we observed that glutamate release was increased by ∼50% in TTX-treated neurons that were overexpressing LGI1-pHmScarelt (Figure 6G-H). As expected, glutamate release was increased to a larger extent than Ca2+ entry, as coupling between nerve terminal Ca2+ influx and synaptic vesicle exocytosis is highly non-linear and small modulations of Ca2+ entry potently impact neurotransmitter release (Schneggenburger and Neher, 2000).

(A) Diagram showing LGI1-pHmScarlet (LGI1-pHmS), which is only bright when exposed to the extracellular media. (B) Effect of TTX on the LGI1-pHmScarlet abundance at the synaptic surface. Data are Mean ± SEM. Control, n=21, 3116 ± 408; TTX, n=25, 2108 ± 334. Mann-Whitney, *p<0.05. (C) LGI1-pHmScarlet signals in boutons (left, colored in red) co-expressing jGCaMP8f at rest (middle image) and during a 1AP stimulus (displayed as a kymograph, right; pseudocolor scale shows low to high intensity). Scale bar 200ms. (D) Average traces showing cytosolic calcium entry to 1AP stimulus in control versus TTX treated neurons. n=21 and n=27 cells, respectively. Error bars are SEM. (E) Quantification of peak cytosolic calcium entry responses to 1AP stimulus in control versus TTX treated neurons. Data are mean ± SEM. Control n=21, 0.035 ± 0.007 ΔF/F; TTX n=27, 0.085 ± 0.02 ΔF/F. Mann-Whitney test, *p<0.05. (F) LGI1-pHmScarlet signals in boutons (left, colored in red) co-expressing iGluSnFR3 at rest (middle image) and during a 1AP stimulus (displayed as a kymograph, right; pseudocolor scale shows low to high intensity). Scale bar, 50ms. (G) Average traces showing glutamate release to 1AP stimulus in control versus TTX treated neurons; n=33 and n=34 neurons, respectively. Bars are SEM. (H) Quantification of peak glutamate release to 1AP stimulus in control versus TTX treated neurons. Data are mean ± SEM. Control n=33, 2.94 ± 0.25; TTX n=34, 3.96 ± 0.29. Mann-Whitney test, **p<0.01.
Given that chronic TTX treatment could be modulating additional signaling pathways unrelated to LGI1 that may modulate presynaptic strength (Kim and Ryan, 2010), we next compared the extent to which increasing LGI1 synaptic surface abundance would control presynaptic function. LGI1 function is tightly linked to the control of Kv1.1 channels (Baudin et al., 2022; Petit-Pedrol et al., 2018; Seagar et al., 2017). However, patching small CNS terminals is not currently possible and thus it has remained poorly understood whether LGI1 levels could control K-channel function at presynaptic sites. We leveraged the use of a novel optical voltage sensor, Archon (Piatkevich et al., 2018), which robustly replicates voltage changes measured by electrophysiology in patched somas of neurons (Milosevic et al., 2020), to quantify directly whether increasing the presence of LGI1 at synapses could modulate locally Kv function. We found that overexpressing LGI1-pHmScarlet resulted in a significantly narrowed presynaptic action potential waveform (Figure 7A), while the amplitude its peak remained unaltered. Such modulation is indicative of Kv1 function, as blockade of Kv1.1/1.2 channels broadens the AP waveform at the presynapse (Cho et al., 2020; Hoppa et al., 2014).

(A) Presynaptic action potential waveform measured using Archon in control versus LGI1-pHmS overexpressing neurons. (B) Comparison of the AP width by quantification of the full width at 0.1 of the peak response of each neuron. Data are mean ± SEM. Control n=8, 12.44 ± 4.56; LGI1 overexpression, n=18, 4.29 ± 0.67. (C) Quantification of peak response of the action potential. Data are mean ± SEM. Control n=8, 10.78 ± 0.6071; LGI1 overexpression, n=18, 10.21 ± 0.7662. (D) Average of cytosolic calcium entry to 1AP stimulus in control versus LGI1-pHmS overexpressing neurons. n=40 and n=21 neurons, respectively. Bars are SEM. (E) Quantification of D; n=40 and n=21 neurons. (F) LGI1-pHmScarlet expression and corresponding Ca2+ entry during 1AP stimulus was performed by grouping individual boutons according to their LGI1-pHmScarlet fluorescence and averaging their corresponding 1AP-evoked Ca2+ entry. Binning size was fixed at n=212 per group for equivalent sampling, except for controls not co-transfected with LGI1-pHmScarlet (n=732). Data are mean ± SEM. Group 0, n=732, LGI1-pHmScarlet 0.00 ± 0.00, jGCaMP8f 0.84 ± 0.03; group 1, n=212, LGI1-pHmScarlet 1.10 ± 0.003, jGCaMP8f 0.54 ± 0.02; ; group 2, n=212, LGI1-pHmScarlet 1.23 ± 0.003, jGCaMP8f 0.59 ± 0.03; group 3, n=212, LGI1-pHmScarlet 1.379 ± 0.004, jGCaMP8f 0.523 ± 0.028; ; group 4, n=212, LGI1-pHmScarlet 1.63 ± 0.01, jGCaMP8f 0.46 ± 0.03; ; group 5, n=212, LGI1-pHmScarlet 2.24 ± 0.02, jGCaMP8f 0.31 ± 0.03; ; group 6, n=211, LGI1-pHmScarlet 4.92 ± 0.23, jGCaMP8f 0.29 ± 0.02. Dotted line represents the fitting of the data to a single exponential decay model. (G) Average traces showing glutamate release in response to 1AP stimulus in control versus LGI1-pHmScarlet overexpressing neurons. n=23 and n=40 neurons, respectively. Bars are SEM. (H) Quantification of glutamate release to 1AP stimulus in control versus LGI1 overexpressing neurons. n=23 and n=40 neurons. (I) LGI1-pHmScarlet expression anticorrelation to presynaptic glutamate release in single boutons was performed as in F, using a binning size was fixed at n=216 per group for equivalent sampling, except for controls not co-transfected with LGI1-pHmScarlet (n=994). Data are mean ± SEM. Group 0, n=994, LGI1-pHmScarlet 0.00 ± 0.00, iGluSnFR3 4.18 ± 0.09; group 1, n=216, LGI1-pHmScarlet 1.49 ± 0.02, iGluSnFR3 2.51 ± 0.16; group 2, n=216, LGI1-pHmScarlet 2.13 ± 0.01, iGluSnFR3 2.02 ± 0.09; group 3, n=216, LGI1-pHmScarlet 2.94 ± 0.02, iGluSnFR3 1.87 ± 0.11; group 4, n=216, LGI1-pHmScarlet 5.54 ± 0.13, iGluSnFR3 1.63 ± 0.09. (J) Representative example image of LGI1-pHmScarlet baseline signal (top left) and glutamate release (ΔF) (bottom left) in different synaptic boutons of a single neuron (1-5). Glutamate release traces for each individual bouton from 1 to 5 (green) and the associated surface LGI1-pHmScarlet level (dotted line, scale on the left) exemplify the correlation observed in (I). All statistical comparisons in this figure are though Mann-Whitney test, n.s. p>0.05, *p<0.05, **p<0.01, ***p<0.001, ****p<0.0001.
We reasoned that LGI1-based narrowing the AP waveform should in turn curb both AP-driven Ca2+ entry and glutamate release. We overexpressed LGI1-pHmScarlet and found that increasing LGI1 levels decreased both presynaptic Ca2+ entry (Figure 7D-F) and glutamate release (Figure 7G-I) by 25% and 40%, respectively. In our initial experiments we observed that synapses belonging to the same axon present different levels of surface LGI1 (Figure 1B, figure S1A) and thus we reasoned that if LGI1 is a key control mechanism of synaptic function, individual presynaptic strength in single nerve terminals could be correlatively modulated by local surface LGI1 abundance in synapses. As both jGCaMP8f and iGluSnFR3 allowed us to quantify single AP-driven responses in single synapses with sufficient signal-to-noise, we measured individual synapse surface levels of LGI1-pHmScarlet and the corresponding responses in Ca2+ entry and glutamate release to a single action potential. We first analyzed over 1300 individual boutons from 21 separate neurons expressing cytoGCaMP8f and LGI1-pHmScarlet and our data revealed a striking correlation in which higher expression of LGI1 was robustly correlated with lower AP-driven Ca2+ entry (Figure 7D-F). With a similar approach, we analyzed individual boutons both LGI1-pHmScarlet fluorescence and single AP-driven glutamate release using iGluSnFR3. Similarly to our Ca2+ entry experiments, we analyzed over 800 individual boutons from 40 separate neurons and we confirmed that individual boutons with higher expression of LGI1 at the surface release significantly less glutamate during single action potential firing (Figure 7G-I). Taken together, these results show that LGI1 surface abundance in individual boutons controls locally the action potential waveform and Ca2+ entry, serving as a major modulatory mechanism of glutamate release that controls differently presynaptic strength in boutons belonging to the same axon.
Discussion
A decade of accumulating evidence using in vivo experimental approaches has demonstrated that reductions in LGI1 drive synaptic dysfunction, causing seizures and premature death in rodents, yet how the presence of LGI1 at the synaptic surface is controlled has remained poorly understood. Leveraging the development of novel optical tools to monitor the behavior of LGI1 in single firing synapses, we found that neuronal activity is a robust controller of LGI1 abundance at the synaptic cleft. The history of activity of a neuron is essential for developing appropriate connectivity (Pan and Monje, 2020), which requires the formation of strong trans-synaptic interactions to facilitate the function of established synapses (Biederer et al., 2017; Chen et al., 2018). We find that both chronic and acute neuronal activity stably boost LGI1-mediated trans-synaptic bridges and their abundance at the cleft of individual terminals correlatively attunes presynaptic function. Given that optimal synaptic transmission relies heavily on the sub-synaptic molecular architecture (Tang et al., 2016), our results suggest that neuronal activity may acutely remodel trans-synaptic molecular landscape to adapt the strength of the connection. Indeed, activity remodels synaptic geometry (Glebov et al., 2016), driving structural changes that could be the consequence of activity-driven adjustments of trans-synaptic molecular networks.
LGI1 is broadly considered as a secreted protein, as when overexpressed in heterologous cells it can easily be found in their media (de Bellescize et al., 2009; di Bonaventura et al., 2011; Chabrol et al., 2007; Dazzo et al., 2016; Senechal et al., 2005; Sirerol-Piquer et al., 2006; Yokoi et al., 2014). Applying purified LGI1 obtained from heterologous cell media impairs Kv1 function and reduces the intrinsic excitability of CA3 neurons in slices (Seagar et al., 2017), in agreement with the idea that soluble LGI1 can bind available ADAM22/23 receptors (Ohkawa et al., 2013; Petit-Pedrol et al., 2018). However, while LGI1 can also be detected in the media of cultured neurons (Baulac et al., 2012; Hu et al., 2022; Tüshaus et al., 2020), this occurs to much less extent than in heterologous cells (Baulac et al., 2012). In agreement with the latter observation, our data shows that the majority of LGI1 molecules exposed during firing do not behave as secreted proteins, but are trafficked to, and retrieved from, the synaptic surface. We propose this is possible through a sustained interaction with ADAM23, which also is exposed to the synaptic surface with similar dynamics as LGI1 during activity. Contrarily, we can observe a clear secretion of LGI1 if its interaction with ADAM23 is impaired by the LGI1 mutation Y433A (Yamagata et al., 2018). Similarly to what occurs in heterologous cells, which do not express ADAM23 (de Bellescize et al., 2009; di Bonaventura et al., 2011; Chabrol et al., 2007; Dazzo et al., 2016; Senechal et al., 2005; Sirerol-Piquer et al., 2006; Yokoi et al., 2014), LGI1Y433A cannot be retained by ADAM23 in synapses and thus behaves as a secreted protein (Figure 3B). Thus, our data indicate that while LGI1 is indeed a secreted protein, it is unlikely behaving as such in the synaptic environment. This unexpected result challenges the current notion on how LGI1, and possibly other secreted synaptic proteins, are translocated to the synaptic cleft and exert their function.
Mechanisms preventing secretion of LGI1 optimize the metabolic efficiency of its translocation, as the energy spent in its synthesis is not lost if LGI1 molecules that are not successful in forming a trans-synaptic bridge can be recovered back to the terminal through endocytosis. Indeed, evolutionary pressure has optimized neuronal function to favor metabolic efficiency (Alle et al., 2009; Li and van Rossum, 2020; Niven and Laughlin, 2008; Yu and Yu, 2017), and our results highlight yet another mechanism that ameliorates the presynaptic energetic burden associated with neuronal activity (Ashrafi et al., 2017, 2020; Rangaraju et al., 2014). Under this view, our results open the possibility that many neuronal proteins that are currently considered to be presynaptically secreted and later bound to their presynaptic receptors, such as Cbln1 (Ibata et al., 2019), NPTX (Schlimgen et al., 1995) or MTG (Rushton et al., 2009), could be in fact translocated through the coordinated exocytosis of their corresponding transmembrane receptors. Further research is needed to explore this exciting hypothesis.
Given the clinical importance of LGI1, developing novel strategies to establish the pathogenicity of newly identified LGI1 genetic variants in the clinic has become of great importance. As current assays only distinguish qualitatively between secretion-competent and -incompetent mutants, deciphering whether a secretion-competent mutant is pathogenic requires laborious experimentation, including co-immunoprecipitation and binding assays to ADAM22/23 receptors (Dazzo et al., 2016; Yamagata et al., 2018). We provide here a simple quantitative toolkit to robustly test several possible aspects of dysfunction in LGI1 by combining the use of primary neurons and field stimulation. We demonstrate that this approach reveals defects that were previously undetectable for epilepsy-associated mutants: 1) LGI1T380A, despite defined previously as secretion-incompetent (Yokoi et al., 2014), translocates partially to the synaptic surface and is partially retained in axonal ER and 2) LGI1S473L and LGI1R474Q, while translocate efficiently, they cannot get stably increased in synapses after neuronal activity. Similarly, we propose that our tools should help to dissect quantitatively how autoantibodies against LGI1, which cause limbic encephalitis (LE) and seizures (Fels et al., 2021; Lai et al., 2010), can affect the abundance of LGI1 at the synaptic surface and impair synaptic function using this system. Thus, the quantitative nature of this novel methodology provides the field with an improved assay for better understanding the molecular dysfunction of known LGI1 disease variants and a novel approach for dissecting the pathogenicity of new mutations identified in the clinic.
LGI1 dysfunction leads to disease through increased brain excitation, but controversy remains on the cellular origins of this unbalance (Fukata et al., 2006, 2010). Here we find that the abundance of surface LGI1 in single synapses strongly influences the presynaptic action potential waveform, presynaptic Ca2+ handling and glutamate release. Remarkably, we find that such control is synapse-specific. Different presynaptic sites belonging to the same axon present different levels of surface LGI1, which strongly correlate with their variable presynaptic strength (Figure 7). Computational complexity in the brain is thought to benefit from the diversity in presynaptic strength found in diverse neuronal connections (Dittman et al., 2000; O’Rourke et al., 2012) and in different presynaptic sites belonging to the same axon (Ariel et al., 2012; Karlocai et al., 2021; Sun et al., 2013). Principal neurons like pyramidal cells of the hippocampus can present up to 15.000 synaptic contact sites (Sik et al., 1993), and the ability to individually tune their strength increases the complexity of information that can be transmitted (Branco and Staras, 2009). However, the molecular underpinnings enabling such heterogeneity in presynaptic strength, and how such variability is readjusted during different functional states, remain poorly understood. Our work identifies LGI1 as novel regulator of presynaptic strength variability and, surprisingly, this modulatory role appears not to be static but adjustable in short timescales. This enables LGI1 to act as an integrator of synaptic function that correlatively attunes synaptic strength to match the history of activity to neurotransmission.
The fact that both LGI1 and its presynaptic receptor ADAM23 can acutely change their abundance at the synaptic cleft during activity suggests that the molecular landscape of the synaptic cleft is plastic in faster timescales than initially thought (Rudenko, 2017). As these trans-synaptic proteins are not present in typical synaptic vesicles (Figure 2, figure 3D-F), our results open up the possibility that the surface abundance of other presynaptic proteins may be regulated by the exocytosis of these alternative vesicles. For example, the presynaptic translocation of a glucose transporter, GLUT4, has been shown to occur from presynaptic vesicles that are not SVs and whose luminal pH is significantly less acidic (Ashrafi et al., 2017), as we find for LGI1 (Figure 2A). Thus, future studies dissecting the proteome of LGI1 vesicles surely will provide new insights into defining the dynamic nature of synaptic cleft proteome and the extent to which the surface abundance of certain molecules may modulate synaptic physiology. Taken together, our results open new avenues of research that will define how activity can remodel the trans-synaptic molecular landscape of firing synapses in fast timescales, defining novel molecular mechanisms controlling neurotransmission.
Supplementary figure

(A) Example images of surface pHluorin signals in axons (upper left) co-expressing synapsin-mRuby (upper left, colored in red) and LGI1 pHluorin signal in presynaptic boutons identified by synapsin-mRuby expression (lower left, colored in red). pHluorin signal shown as pseudocolor; scale shows low to high intensity. (B) Quantification of pHluorin abundance in synaptic surface of surface pHluorin versus LGI1-pHluorin expressing neurons. Data are mean ± SEM. Surface pH; n=13, 1.71 ± 0.23; LGI1-pH, n=15, 2.43 ± 0.21. Mann-Whitney test, **p<0.01. (C) Average internal pool of LGI1-pH, calculated using MES pH5.5 and NH4Cl pH 7.4 as shown in materials and methods. Bars are SEM. n=34, mean ± SEM, 0.68 ± 0.03. (D) Example trace of somatic LGI1-pH response to 1000AP 50Hz. (E) Relative fluorescence change in the soma before and after 1000AP 50Hz electrical stimulation in ER-pH (n=7) or LGI1-pH (n=7) expressing neurons. Wilcoxon matched-pairs signed rank test, *p<0.05. (F) Estimates of pH in somas of neurons expressing ER-pH or LGI1-pH. n=7, mean ± SEM, 6.76 ± 0.12 for ER-pH and n=7, mean ± SEM, 6.80 ± 0.12 for LGI1-pH. Mann-Whitney test, ns.

(A) Total LGI1S473L in synapses before and after electrical stimulation of 1000AP 50AP. n=9. Wilcoxon matched-pairs signed rank test, ns.

(A) LGI1-pH surface fraction before and after electrical stimulation of 3000AP 50Hz for individual neurons (n=8 paired neurons). Wilcoxon matched-pairs signed rank test, **p<0.01. (B) Total LGI1-pH abundance in synapses in control versus TTX treated neurons, measured as peak response in NH4Cl pH 7.4. n=18, Mean ± SEM 3789 ± 653 for control and n=19, Mean ± SEM 7385 ± 1094 for TTX. Mann-Whitney test, *p<0.05.

(A) LGI1T380A-pH signal in presynaptic butons (right, pseudocolor) identified by synapsin-mRuby expression (left, colored in red). (B) Synaptic surface LGI1 at rest in LGI1WT (n=14) versus LGI1T380A (n=9) expressing neurons. Mean are ±SEM, 895.3±116.4 for LGI1WT neurons and 296.9±49.15 for LGI1T380A. t-test, ***p<0.001.
Materials and methods
Resource availability
Lead contact
Further information and requests for resources and reagents may be directed to and will be fulfilled by the lead contact, Dr. Jaime de Juan-Sanz (jaime.dejuansanz{at}icm-institute.org).
Material availability
Novel optical tools generated in this work are available at Addgene.org, as indicated in the Key Reesources Table.
STAR METHODS
Experimental model and subject details
Animals
Wild-type rats were of the Sprague-Dawley strain Crl:CD(SD), which are bred by Charles River Laboratories worldwide following the international genetic standard protocol (IGS). All experiments were carried out in strict accordance with the guidelines of the European Directive 2010/63/EU and the French Decree n° 2013-118 concerning the protection of animals used for scientific purposes.
Primary co-culture of postnatal neuronal and astrocytes
All experiments were performed in primary co-cultures of hippocampal neuronal and astrocytes, except for proximity biotinylation experiments. P0 to P2 rats of mixed-gender were dissected to isolate hippocampal CA1-CA3 neurons. Neurons were plated on poly-ornithine-coated coverslips, transfected 5-7 days after plating, and imaged 14-21 days after plating. Neurons were maintained in culture media composed MEM (Thermo Fisher Scientific), of 20 mM Glucose, 0.1 mg/mL transferrin (Sigma), 1% Glutamax (Thermo Fisher Scientific), 24 μg/mL insulin (Sigma-Aldrich), 5-10% FBS (Thermo Fisher Scientific), 2% N-21 (Bio-techne) and 4μM cytosine β-d-arabinofuranoside (Milliopore). Cultures were incubated at 37°C in a 95% air/5% CO2 humidified incubator for 14– 21 days prior to use.
Primary culture of embryonic cortical neurons for synaptic cleft biotinylation
Pregnant wild-type Sprague Dawley Crl:CD(SD) rats between were purchased from Charles River Laboratories. After euthanasia by CO2 asphyxiation (carried out by the animal facility from Paris Brain Institute), embryos were sacrificed at embryonic day 18 (E18). Dissected rat embryo cortical tissue was digested with papain (Worthington Biochemical, LK003178) and DNase I (Roche, 10104159001), next/then 3.5M cortical neurons were plated per 10 cm dish in the same growth medium used in (Loh et al., 2016) and cultured at 37 °C under 5% CO2. Previously the dishes were coated through a pre-incubation overnight at 37 °C with 0.1 mg/ml poly-D-lysine (Sigma, P2636). At 5 days in vitro, half of the culture medium was replaced with fresh BrainPhysTM Neuronal Medium supplemented with 2% (v/v) SM1 (STEMCELLTM Technologies, 05792) and 12.5 mM D-(+)-Glucose (Sigma, G8270) in addition to 10 µM 5’-fluoro-2’-deoxyuridine (FUDR, Fisher Scientific, 10144760), an anti-mitotic drug less toxic than the commonly used Cytosine Arabinofuranoside (Ara-C). This medium replacement was repeated every 4-5 days until the day of the experiment.
Method details
Replication: Not applicable
Strategy for randomization and/or stratification: Not applicable
Blinding at any stage of the study: Analysis was not blinded to genotype
Sample-size estimation and statistical method of computation: Not applicable
Inclusion and exclusion criteria of any data or subjects
Glutamate release and AP-driven presynaptic Ca2+ signals in response to electrical activity (ΔF) were normalized to the resting fluorescence (F0). To avoid overestimating ΔF/F0 in responding neurons with low F0 values, we set an arbitrary threshold such that F0/background > 1.25 to be included for further analysis. This threshold included X% of all neurons tested in this study (X/X). For the experiments quantifying LGI1-pHluorin and ADAM23-pHluorin changes during prolonged stimulation (1000AP 50Hz, 3000AP 50Hz) we occasionally observed a global decrease in fluorescence of the entire field of view, including the background. Thus, we set a threshold to exclude experiments without stable background conditions. Background regions were measured over time and experiments that experimented a change in background higher than 30% were excluded. Thus, for 1000AP 50Hz stimulation recordings, 3 out of 21 neurons were excluded and for 3000AP 50Hz stimulation recordings, 2 neurons out of 10 were excluded.
Gene constructs
LGI1-pHluorin was designed to express wild type rat LGI1 followed by a short flexible linker (SGSTSGGSGGTG) and pHluorin. This construct was optimized in silico for rat protein expression, synthesized in vitro (Invitrogen GeneArt Gene Synthesis) and cloned into the BamHI and EcoRI sites of the CaMKII promoter vector, which was a gift from Edward Boyden (Addgene plasmid #22217). Individual mutants were generated on this vector using site-directed mutagenesis (Q5® Site-Directed Mutagenesis Kit, New England Biolabs E0552) following manufacturer instructions. LGI1-pHmScarlet was generated by replacing pHluorin with pHmScarlet using Gibson Assembly (NEBuilder® HiFi DNA Assembly Master Mix, New England Biolabs). Insert containing pHmScarlet which was obtained by PCR amplification from VAMP2-pHmScarlet (Liu et al., 2021), a gift from Pingyong Xu (Addgene plasmid # 166890). A plasmid to express mRuby-synapsin was generated by removing GFP from GFP-synapsin (Chi et al., 2001) using restriction sites AgeI and BglII, and substituting it in frame with mRuby obtained from pKanCMV-mRuby3-18aa-actin, which was a gift from Michael Lin (Addgene plasmid # 74255). ADAM23-pHluorin was designed to express the signal peptide of wild type rat ADAM23 (first 56 amino acids) followed by pHluorin, a short flexible linker (SGSTSGGSGGTG) and the rest of ADAM23 (amino acids 56-828). This construct was optimized in silico for rat protein expression, synthesized in vitro (Invitrogen GeneArt Gene Synthesis) and cloned into the BamHI and EcoRI sites of the CaMKII promoter vector, which was a gift from Edward Boyden (Addgene plasmid #22217). These constructs have been deposited in addgene, where exact maps can be found easily.
Image analysis, statistics and exclusion criteria
Images analysis was performed with the ImageJ plugin Time Series Analyzer V3 where typically 150-250 regions of interest (ROIs) corresponding to synaptic boutons or 10-150 ROIs for responding boutons were selected and the fluorescence was measured over time. Statistical analysis was performed with GraphPad Prism v8 for Windows. Statistic tests are indicated in the figure legends. Mann–Whitney U test was done to determine the significance of the difference between two unpaired conditions. Kruskal-Wallis H Test used in order to analyze more than two unpaired conditions. Wilcoxon matched-pairs test was performed for our two paired datasets. p < 0.05 was considered significant and denoted with a single asterisk, whereas p < 0.01, p < 0.001 and p < 0.0001 are denoted with two, three, and four asterisks, respectively.
Live imaging of neurons
Primary hippocampal neurons were transfected using calcium phosphate at DIV7 as previously described (Sankaranarayanan et al., 2000) and were imaged from DIV14 to DIV21. Imaging experiments were performed using a custom-built laser illuminated epifluorescence microscope (Zeiss Axio Observer 3) coupled to an Andor iXon Ultra camera (model #DU-897U-CSO-#BV), whose chip temperature is cooled down to -90 °C using the Oasis(tm) UC160 Cooling System to reduce noise in the measurments. Illumination using fiber-coupled lasers of wavelengths 488 (Coherent OBIS 488nm LX 30mW) and 561 (Coherent OBIS 561nm LS 80mW) was combined through using the Coherent Galaxy Beam Combiner, and laser illumination was controlled using a custom Arduino-based circuit coupling imaging and illumination. Neuron-astrocyte co-cultures were grown in coverslips (D=0.17mm, Warner instruments), mounted on a RC-21BRFS (Warner Instruments) imaging chamber for field stimulation and imaged through a 40x Zeiss oil objective “Plan-Neofluar” with an NA of 1.30 (WD=0.21mm). Unless otherwise noted, imaging frequency was 2Hz. Different imaging frequencies are used in certain experiments: 100Hz for single action potential cytosolic GCaMP8f, 350Hz for single action potential iGluSnFR3 and 2000Hz for single action potential waveform using Archon1. For voltage imaging, light was collected through the objective using a cropped sensor mode (10 MHz readout, 500 ns pixel shift speed) to achieve 2 kHz frame rate imaging (exposure time of 485 μs) using an intermediate image plane mask (Optomask; Cairn Research) to prevent light exposure of nonrelevant pixels as described previously (Hoppa et al., 2014). To obtain sufficient signal to noise, each neuron AP waveform data comes from the average of 50 independent measurements taken at 5Hz. Temperature of all experiments was clamped at 36.5 °C, except for voltage imaging, where it was clamped at 34 °C. Temperature was kept constant by heating the stimulation chamber through a heated platform (PH-2, warner instruments) together with the use of an in-line solution heater (SHM-6, warner instruments), through which solutions were flowed at 0.35ml/min. Temperature was kept constant using a feedback look temperature controller (TC-344C, warner instruments).
Imaging was performed in continuously flowing Tyrode’s solution containing (in mM) 119 NaCl, 2.5 KCl, 1.2 CaCl2, 2.8 MgCl2, 20 glucose, 10 mM 6-cyano-7-nitroquinoxaline-2,3-dione (CNQX) and 50 mM D,L-2-amino-5-phospho-novaleric acid (AP5), buffered to pH 7.4 at 37°C using 25 mM HEPES. NH4Cl solution for pHluorin measurements had a similar composition as Tyrode’s buffer except it contained (in mM): 50 NH4Cl and 69 NaCl for a pH of 7.4 at 37°C. The solution for surface acid quenching of pHluorin is identical to the Tyrode’s solution but was buffered using MES instead of HEPES and was set to pH 5.5 (at 37°C). Cells were flowed with MES and NH4Cl at faster speeds of 0.8ml/min for a quick pH change.
For experiments in figure 2, bafilomycin (Cayman Chemical Company) was diluted in Tyrode’s to a final concentration of 500nM and it was continuously flowed on neurons expressing either vGlut-pHluorin or LGI1-pHluorin for 1000 seconds, acquiring images every 0.5 seconds. In experiments in which neurons vGlut-pHluorin or LGI1-pHluorin transfected neurons were treated with EGTA-AM, we first acquired the response to stimulation, then neurons were incubated with 2mM EGTA-AM for 10 minutes, and then we acquired the response to stimulation in the same region. Chronic incubation with TTX (Tocris) was performed by adding 1 µM final concentration of TTX in the culture media 5-6 days prior imaging. Next, TTX was washed by flowing Tyrode’s solution during 10 minutes and optophysiological recordings using cytoGCaMP8f or iGluSnFRV3 were performed.
pH, surface fraction and total pool measurements using pHluorin constructs
Intraluminal organelle pH in vGlut-, ADAM23- and LGI1-pHluorin containing vesicles was calculated leveraging the known properties of pHluorin response to pH (pKa 7.1), as previously described (Sankaranarayanan et al., 2000). The pH estimates obtained from LGI1-pH secretion-defective mutants C200R and E383A in axons was not reliable and thus it is not shown, as the signal-to-noise change in fluorescence during NH4Cl application was very low due to the low expression in the axon of these mutants. For measuring surface fraction of pH-tagged constructs, axons of neurons expressing vGlut-, ADAM23- and LGI1-pHluorin constructs were perfused briefly with an acidic solution at pH 5.5 buffered with MES for acid quench of pHluorin expressed at the neuronal surface followed by a NH4Cl solution at pH 7.4 for alkalization of vesicular pH, which reveals the total pool of pHluorin-tagged molecules. For these fast perfusions, flow rate was ∼0.8ml/min. Surface fraction of vGlut-pH, LGI1-pH and of LGI1 mutants-pH were determined before and after electrical stimulation using MES/NH4Cl measurements as previously described (Sankaranarayanan et al., 2000). Cells were flowed sequentially with MES and NH4Cl solutions and then washed for 10min in Tyrode’s solution. Next, neurons were stimulated using field stimulation as indicated in the text (1000AP 50Hz or 3000AP 50Hz) and 5 minutes later surface fraction was measured again using MES/NH4Cl. To measure the total pool of LGI1 or LGI1 mutants before and after stimulation, a similar approach was used. Change in fluorescence by NH4Cl solution reveals the total pool present, and thus ΔF in the presence of in the presence of NH4Cl pH 7.4 was acquired before and after electrical stimulation. All experiments were acquired with the same laser power and exposure times to be comparable.
Quantification of times to undergo exocytosis during electrical stimulation
To quantify the time to reach exocytosis peak during stimulation in vGlut-pH, LGI1-pH and ADAM23-pH, we first subtracted background from adjacent regions from the fluorescence of the presynaptic region of interest to obtain the f values (1). After this, we applied a rolling average (2) and differential (3) was calculated using the averages from (2). Then the maximum value was selected and used if the maximum value was superior to five times the standard deviation of the baseline (4). If included, the maximum value was used to get the corresponding time.
f = Fraw - Fbgck
 for k ∈ ⟦0; m − 10⟧; m = total values
Δk = nk − nk−1
Peak considered if(Δkmax) > 5 × stdev(n1 … n90)

Quantification of endogenous surface LGI1 levels in the synaptic cleft by proximity bioltinylation
Isolation of synaptic cleft proteins was performed as previously described in detail (Loh et al., 2016), with small modifications. Two 10 cm dishes were plated with 3.5M of primary embryonic cortical neurons per each experimental condition and at day 15 DIV transduced with lentiviruses expressing FSW-HRP-V5-LRRTM1 and FSW-HRP-V5-LRRTM2 constructs, then live cell biotinylation experiments were performed at DIV19. Chronic incubation with TTX (Tocris) was performed by adding 1 µM final concentration of TTX in the culture media 5 days prior experiment. The impermeant BxxP version of biotin phenol that allows selective surface biotinylation was purchased from ApexBio Technology (Biotin-XX Tyramide Reagent, A8012). For the western blotting visualization of whole lysates, these were combined with 4x SDS protein loading buffer supplemented with 40 mM dithiothreitol DTT (Sigma, D9779), then were run on an 8% SDS-PAGE gel and transferred to a 0.22 µm nitrocellulose membrane (AmershamTM Protran, G10600080). The membranes were blocked with 10% Milk (Merck Milipore, 70166) in TBS-T (0.2% Tween-20 in Tris-buffered saline) at room temperature for 1 hour, then incubated with primary antibodies at 4°C overnight in gentle agitation. Anti-Lgi1/EPT (abcam 30868, 1:500 dilution), anti-V5 (Invitrogen R96025, 1:2000 dilution) and anti-Beta Actin (Thermo Fisher Scientific PA5-85271, 1:5000 dilution) primary antibodies were diluted in 10% milk. The following day, the membranes were washed with 1x TBS-T four times for 10 min each time and probed with Goat Anti-Rabbit IgG (H + L)-HRP Conjugate or Goat Anti-Mouse IgG (H + L)-HRP conjugate secondary antibodies (BioRad 1706515 and 1706516, 1:5000 dilution in 10% milk), then washed with 1x TBS-T four times for 10 min each time and finally developed with Clarity or Clarity Max ECL Western Blotting Substrates (BioRad 1705060 and 1705062) using for imaging one ChemiDocTM Touch Imaging System (BioRad laboratories). For checking or to visualize the global biotinylation reaction, the membrane was blocked with 3% w/v BSA in TBS-T (0.2% Tween-20 in Tris-buffered saline) at 4°C overnight and incubated with Pierce(tm) High Sensitivity Streptavidin-HRP (Thermo Fisher Scientific 21130, 1:5000 dilution in 3% w/v BSA in TBS-T) at room temperature for 1 hr, then washed with TBS-T 3-4 times for 10 min each time and developed as described above.
For gel-based visualization of the biotinylated proteins on the neuronal surface/synaptic cleft, 150 µg of lysate per condition were incubated with 40µl of PierceTM Streptavidin Magnetic Beads slurry (Thermo Fisher Scientific 88817) at 4°C overnight with gentle rotation. The next day, beads washes were carried out as described in (Loh et al., 2016) and for the elution the biotinylated proteins, beads were boiled for 10 min in 25 µl of 3x protein loading buffer supplemented with 20 mM DTT and 2 mM Biotin (Sigma, B4501). Finally, the streptavidin eluate was collected and run on an 10% SDS-PAGE gel, then the membranes were immunoblotted and developed how we have previously described. Anti-Lgi1/EPT (abcam 30868) and anti-GluA1 antibodies (UC Davis/NIH NeuroMab Facility, 75-327) were used at a 1:500 concentration diluted in 10% milk.
Author contributions
Conceptualization, U.C. L.C-R. and J.d.J-S.; methodology, U.C., L.C-R., C.P-C. and J.d.J-S.; investigation, U.C., L.C-R., C.P-C. A.A.A, M.B.H. and J.d.J-S.; funding acquisition, project administration, and supervision, J.d.J-S.; providing essential unpublished materials; A.A. and K.P.; writing – original draft, U.C. and J.d.J-S.; writing – review & editing, U.C., L.C-R., C.P-C. A.A.A, M.B.H. and J.d.J-S
Declaration of interests
The authors declare no competing interests.
Acknowledgments
We would like to thank all members of the de Juan-Sanz laboratory for insightful discussions and comments. This work was made possible by the Paris Brain Institute Diane Barriere Chair in Synaptic Bioenergetics awarded to Jaime de Juan-Sanz. Our funding sources are an ERC Starting Grant SynaptoEnergy (European Research Council), 2019 ATIP-Avenir Grant (CNRS, Inserm) and a Big Brain Theory Grant (ICM) awarded to J.d.J-S. C.P-C. is the recipient of a postdoctoral fellowship from the Fundacion Martin Escudero. J.d.J-S is a permanent CNRS researcher.
References


