

Abstract
Plant viruses account for enormous agricultural losses worldwide, and the most effective way to combat them is to identify genetic material conferring plant resistance to these pathogens. Here, we screen a large panel of Arabidopsis thaliana natural inbred lines for four disease-related traits in response to infection by A. thaliana-naïve and -adapted isolates of the natural pathogen turnip mosaic virus (TuMV). We detected a strong, replicable association in a 1.5 Mb region on chromosome 2 with a 10-fold increase in relative risk of necrosis in response to infection. The region contains several plausible causal genes as well as abundant structural variation, including an insertion of a Copia transposon into an NBS-LRR coding gene, that could be either a driver or a consequence of the disease-resistance locus. Susceptible alleles are found worldwide, and their distribution is consistent with a trade-off between resistance during viral outbreaks and a cost of resistance otherwise, leading to negative frequency-dependent selection.
Author summary Plant viruses are an enormous burden to agriculture worldwide. The best way to combat these losses is to use plants that are naturally resistant, so identifying and characterizing genes associated with viral resistance is a priority. Because it is closely related to many crop species and excellent genetic resources, Arabidopsis thaliana is a useful model to investigate the genetic basis of virus resistance. We inoculated a large sample of natural lines of A. thaliana with two isolates of its natural pathogen turnip mosaic potyvirus, and looked for genes associated with variation in resistance. We found a cluster of several genes that showed a strong association with whether the infection was fatal or not. We also compared the fine-scale structure of a subset of the available genomes assembled using long-read DNA sequencing technology, and found enormous variation in the local structure of the genome between individuals. How this variation interacts with disease resistance is unclear, though a transposon insertion in a resistance-related gene, might be relevant. Finally, alleles associated with increased susceptibility to the virus are found at low frequency all over the world. Since potyvirus outbreaks are common in nature, but short-lived, this is consistent with virus resistance being beneficial during outbreaks, but costly when the virus is absent.
Introduction
Plant viruses represent an enormous threat to crop yields and food security [1-3]. Infected plants are difficult to treat, so it is of vital importance to identify genetic material which is resistant to infection [4]. Despite this, the genetic architecture of plant responses to viral infections has received much less attention than the response to bacterial and fungal pathogens [4,5]. In agricultural settings, plants predominantly form monocultures, thus allowing for more virulent and specialized viruses that cause more detrimental effects on the host [6]. Through their specialization in one host species, viruses also evolve better counter defenses than their naive counterparts [7].
In this study, we examined responses in Arabidopsis thaliana (L.) HEYNH to infection by a naïve “ancestral” and an “adapted” isolate of the turnip mosaic virus (TuMV; species Turnip mosaic virus, genus Potyvirus, family Potyviridae). Potyviruses affect a wide variety of crops, especially from the families Brassicaceae and Solanaceae, and are among the most widespread crop pathogens worldwide [8]. TuMV is among the most damaging of the potyviruses [2], and also has a high incidence in wild populations of A. thaliana [9]. The extensive genetic resources available in A. thaliana make it a useful system for investigating mechanisms of viral resistance in plants, and because it is also closely related to the agriculturally important brassicas, a large array of relevant crop viruses can infect and be studied in this system [9,10]. Viral outbreaks are frequent in natural populations of A. thaliana, and there is substantial genetic variation in resistance, indicating that viral coevolution represents a meaningful selection pressure in this species [9]. Several previous genome-wide association (GWA) studies of the response of A. thaliana to viral infection have been carried out. Rubio et al. used TuMV and 317 lines grown under field conditions [11], while Butković et al. also used TuMV but 450 lines kept in laboratory conditions [12]. Montes et al. [13] and by Liu et al. [14] used 156 and 496 inbred lines respectively to measure the response of A. thaliana to infection by cucumber mosaic virus under controlled conditions. These studies have demonstrated that genetic variation for virus response exists, and that individual loci with large effects on virus response segregate in A. thaliana.
Here, we report the results of GWA using two isolates of TuMV and 1,050 A. thaliana inbred lines. We compare an ancestral isolate of TuMV that was obtained from a calla lily (Zantedeschia sp.) and was naïve to A. thaliana [15], to its evolved adapted descendant that had been through 12 passages of experimental evolution on A. thaliana Col-0 line [16]. Both isolates widely differ in their symptomatology and fitness in A. thaliana. We aim to identify plant genes that play a role in TuMV infection and whether some of these genes may respond differently to each viral isolate.
Results
Increased disease phenotypes in response to the evolved virus
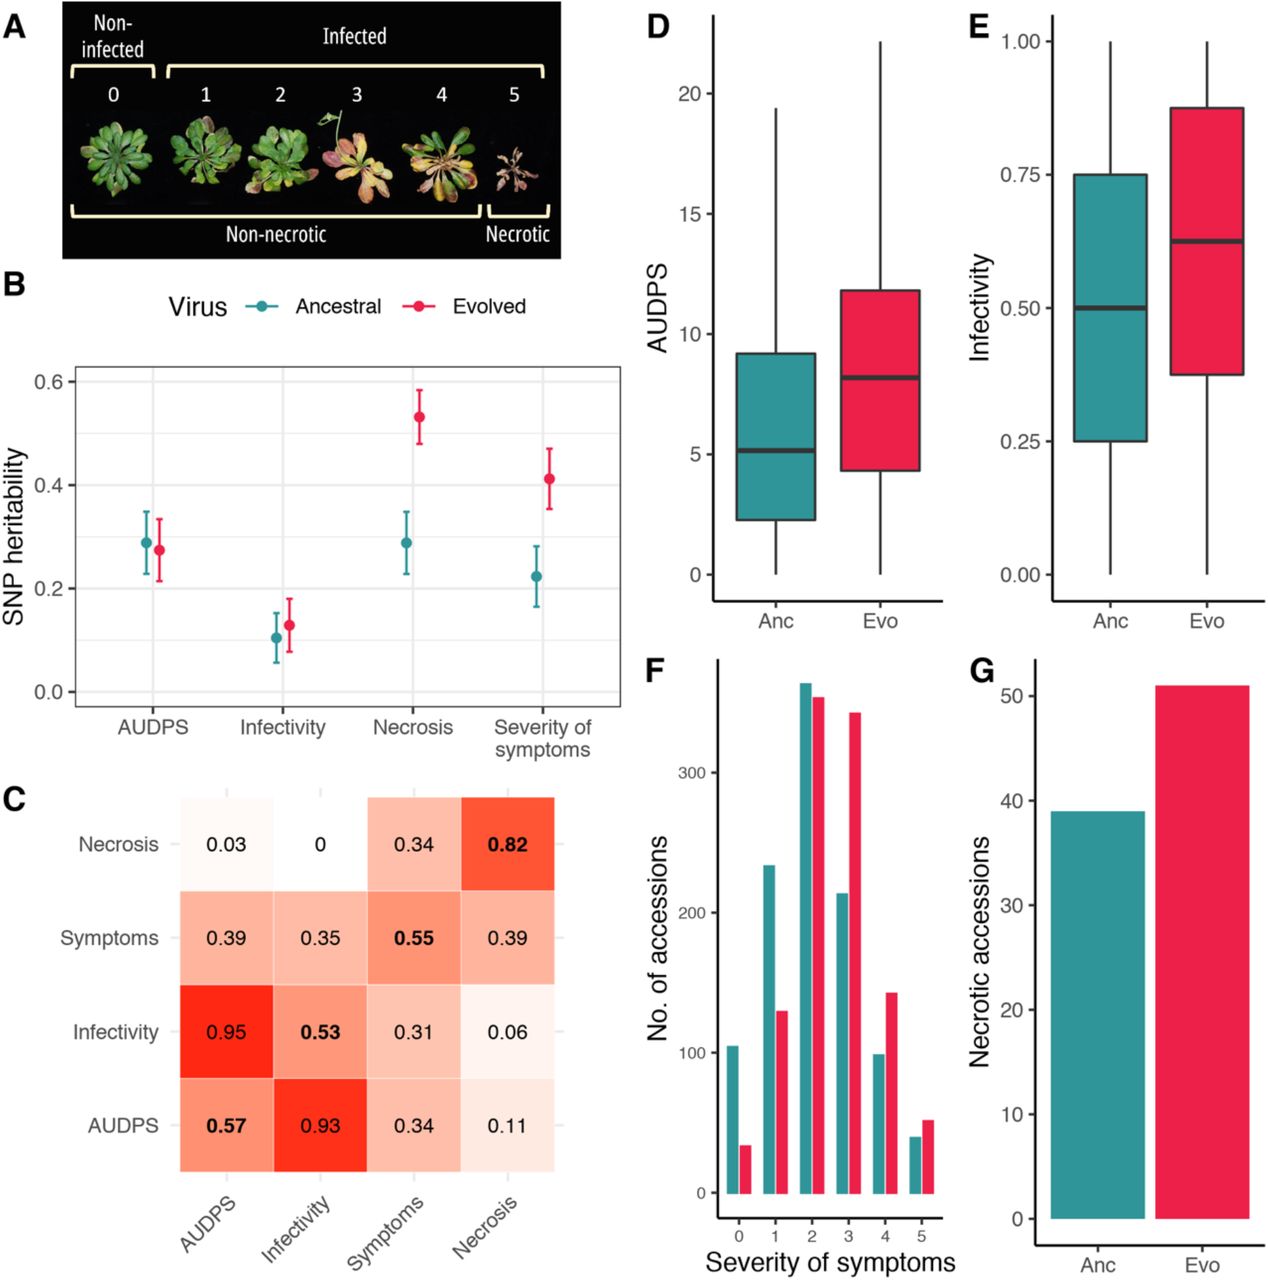
We inoculated 1,050 lines of A. thaliana [17] with the ancestral [15] or evolved isolates of TuMV [16] and characterized the response to each virus based on four phenotypes: (1) AUDPS (“area under the disease progress stairs”, a measure of disease progress [18]), (2) infectivity (proportion of plants showing symptoms), (3) severity of symptoms on a semiquantitative scale ranging from 0-5 (Fig. 1A) [19], and (4) necrosis (a binary trait reflecting presence/absence of necrosis). These traits showed low to moderate SNP heritability, with substantially higher heritability for necrosis (> 50%) and severity of symptoms (∼ 40%) in response to the evolved virus (Fig. 1B).

Disease phenotypes. (A) Illustration of the scale used to evaluate the severity of symptom: (0) no symptoms or healthy plant (1) mild symptoms without chlorosis (2) visible chlorosis, (3) advanced chlorosis, (4) strong chlorosis and incipient necrosis, (5) clear necrosis and death of the plant. (B) SNP heritability for each disease-related trait in response to each viral isolate. (C) Correlation matrix between disease phenotypes in response to the ancestral (upper left) and evolved (lower right) isolates. The diagonal shows correlations between the same phenotype in response to each virus. (D-G) Distributions of phenotypes across lines in response to the ancestral (Anc, red) and evolved (Evo, blue) TuMV isolates.
Plants infected with the evolved virus showed significantly more severe disease symptoms than those infected with the ancestral virus. On average, we found a 37% increase in AUDPS (Fig. 1D: Mann-Whitney U = 1.2×10⁵, P < 0.001), 27% increase in infectivity (Fig. 1E: U = 9.5×10⁴, P < 0.001), 23% increase in severity of symptoms (Fig. 1F: U = 2.7×10⁴, P < 0.001), and a 31% increase in necrosis (Fig. 1G: McNemar χ2 = 7.562, 1 d.f., P = 0.006). None of the 2,100 mock-inoculated plants showed any symptoms.
Although the severity of disease phenotypes increased in response to the evolved virus, the nature of that increase varied between phenotypes (Fig 1D-G). Off-diagonal elements of the correlation matrix between phenotypes were largely symmetric, with strong correlations between AUDPS and infectivity, and weak correlations between necrosis and other traits, indicating that the overall pattern of correlations between phenotypes in response to a single virus were very similar (Fig. 1C). However, although necrosis was highly repeatable between viruses, we found only moderate correlations for AUDPS, infectivity and severity of symptoms in response to the two viruses (Fig. 1C, diagonal elements). This suggests that disease phenotypes in response to each virus varied between A. thaliana lines.
A major locus associated with necrosis and severity of symptoms
We used the multi-trait GWA analysis implemented in the software package LIMIX to identify individual genetic loci that correlate with the response to each virus [20]. LIMIX assesses the response to each virus jointly, and identifies loci associated with (1) a shared response to both viruses, and (2) specific responses to individual viral isolates.
We found a single strong peak of association for necrosis in response to both viruses on chromosome 2 (Figs. 2A-D). The region of association encompasses five annotated genes, and is within 300 bp of two more, as well as at least six annotated transposable elements (Fig. 3, Table 1). 56% and 49% of the lines showing necrosis in response to the ancestral and evolved viruses respectively harbor the susceptible allele at the most strongly associated SNP at position 5,927,469. To validate this association, we repeated the experimental procedure using 51 lines that showed necrosis in the initial experiment and 65 that did not, and recovered the association in the same region on chromosome 2, with a peak at position 5,927,469 (Fig. S1). These results demonstrate that a major association on chromosome 2 explains approximately half the cases of necrosis.
Significant SNPs and their corresponding genomic regions on chromosome 2 detected for necrosis in the multiple trait analysis for both viral isolates.

Genetic associations with necrosis. (A), (C) and (E) show SNPs associated with a common response to both viruses. (B), (D) and (F) show SNPs associated with a differential response to each viral isolate. (A) and (B) show associations with raw necrosis data. (C) and (D) show associations in a model that includes the genotype at the most strongly associated SNP in (A) as a cofactor. (E) and (F) show relative risk of necrosis in response to the ancestral (closed symbols) and evolved (open symbols) TuMV isolates for the susceptible alleles at (E) the five loci associated with the response to both isolates and (F) the eight loci associated with a isolate-specific response. Note the log scale of the ordinate axis. Colors in (E) and (F) correspond to those in the Manhattan plots above.

Multiple sequence alignment around the major association with necrosis on chromosome 2. (A) Enlarged view of the peak in Fig. 2A, with the TAIR10 annotation below. (B) A summary of structural variation in 53 assembled genomes. Transposable elements are shown in orange and coding genes in gray, with candidate genes AT2G14080 and DRP3B highlighted in purple and pink respectively. Black lines connect homologous features. Each genome is labeled (by squares on the right) according to its necrosis phenotype and genotype at the most associated SNP. The lines without boxes have not been phenotyped.
The peak of association with necrosis overlaps with a peak found for severity of symptoms (Fig. S2). Since necrosis is the final stage of disease progress in the semiquantitative scale used to score symptoms, this overlap in genetic architecture likely reflects the same biological signal. We did not identify any significant associations with AUDPS or infectivity (Figs. S2, S3), consistent with the low heritability for these traits (< 30%; Fig. 1B).
The presence of a strong association can interfere with the detection of other associations [20]. To identify additional loci associated with necrosis we therefore repeated the GWA analysis including the genotype at the most strongly associated SNP as a covariate. This revealed four additional loci showing a significant association with the shared response to both TuMV isolates (Figs. 2A, 2C), and eight loci with an isolate-specific response (Figs. 2B, 2D). Linkage disequilibrium between these loci is weak (Fig. S4). Susceptible alleles at these loci were rare (3.1-17.0% allele frequency; median = 3.6%) and showed up to 9.7-fold increase in the relative risk of necrosis compared to the resistant alleles (Table S1, Figs. 2E, 2F). Where loci displayed a virus-specific effect, this was associated with increased relative risk of necrosis in response to the evolved virus compared to that of the ancestral virus (Fig. 2F). Overall, all but two necrotic lines harbored the susceptible allele in at least one of the loci identified.
A Copia element insertion in the primary candidate gene
We explored haplotypes in the region associated with necrosis in 53 genomes assembled de novo from long-read PacBio sequencing data as part of a different study (https://1001genomes.org/). We aligned the sequences in the region around the strong association for necrosis and severity of symptoms. To assess patterns of synteny we looked for homology with the two most strongly associated genes (AT2G14080 and DRP3B) and the eight annotated genes or transposable elements from the TAIR10 genome annotation on either side of these genes using BLAST. This analysis revealed many structural polymorphisms (Fig. 3), including abundant intergenic indel variation, duplications and a large presence/absence polymorphism downstream of AT2G14080 containing AT2G14100 and a block of transposable elements. At least one line (9470) shows a large-scale inversion for the entire region. The region around the strong association for necrosis and severity of symptoms appears to be a hotspot for structural variation.
We next looked for structural polymorphism that might be causal for the disease phenotypes. We categorized lines as “alive” vs. “necrotic” based on whether they showed necrosis in response to either virus, and as having the “susceptible” vs. “resistant” allele at the most strongly associated SNP (Fig. 2). Unfortunately, only four lines of the 53 sequenced both showed necrosis and had the susceptible allele at the major association, but all of them harbored a Copia-element inside the first intron of AT2G14080 that was present in only one other line. We tried to genotype the presence/absence of this element in the full sample using short-read sequencing data, but this turned out to be unachievable due to the repetitiveness of the sequence (see Materials and methods). Thus, this element remains a promising candidate for a causal polymorphism.
The major susceptibility allele is spatially overdispersed
The susceptible allele at the major association with necrosis on chromosome 2 is spread throughout the geographic range of the GWA panel, and is found at a similar frequency in all but three admixture groups identified by reference [17] (Fig. 4A, 4B). To test whether this broad spatial distribution could be due to chance, we compared the mean geographic distance between lines with the susceptible alleles at each of the SNPs identified by GWA (Fig. 2) to the mean distances between alleles at 10,000 randomly chosen loci with minor allele counts between 10 and 200. For most associated loci, distances between lines with susceptible alleles are well within the distribution of randomly chosen loci, consistent with genetic drift acting on a local scale. In contrast, lines harboring the susceptible alleles at the major association on chromosome 2 are further apart on average than 98.5% of randomly chosen alleles at similar frequencies (Fig 4C). We found similar spatial overdispersion for the associated loci on chromosome 4 at positions 273,465 and 7,917,355. Susceptible alleles associated with increased necrosis at the major association, thus seem to be spatially overdispersed, in a way which is independent of genetic background, and which is unlikely to be due to genetic drift alone.

Global distribution of necrotic alleles. (A) Global distribution of genotypes (resistant/susceptible alleles at the SNP most strongly associated with necrosis), and phenotypes (whether lines showed necrosis or not). The inset table shows the numbers of each genotype/phenotype; colors correspond to those on the map. (B) Frequencies of susceptible alleles at chromosome 2 position 5,927,469 within each admixture group. The horizontal line indicates global frequency. (C) Mean distances between pairs of loci harboring the susceptible allele at the 13 associated loci (red) and between minor alleles at 10,000 randomly chosen loci.
Discussion
We report results from the largest GWAS done so far aiming to identify Arabidopsis thaliana genes involved in the infection response to one of its natural pathogens, turnip mosaic virus, using an ancestral isolate naïve to A. thaliana, and a second isolate that had been experimentally evolved on A. thaliana line Col-0.
Increased virulence of the evolved virus
Lines infected with the evolved virus showed increased disease symptoms compared to plants infected with the ancestral virus (Fig. 1D-G). Necrosis was strongly correlated between virus treatments (Fig. 1C), and there was no evidence for a virus-specific effect of alleles at the major association locus on chromosome 2 (Fig. 2E). The increase in necrosis can thus probably be attributed to increased virulence of the evolved virus. In contrast, the increase in AUDPS, infectivity and severity of symptoms was associated with changes in the rank order of lines, reflected in only moderate correlations between phenotypes in response to the two viruses (Fig. 1C). This suggests that the change in these phenotypes reflects a more complex line-specific response to the two viruses.
The increase in virulence of the evolved virus is associated with mutations in two genes acquired during adaptation to A. thaliana [23]. First, the cylindrical inclusion protein (CI) is involved in viral genome replication and cell-to-cell movement [24], and has been shown to interact with the photosystem I PSI-K protein in A. thaliana [25]. Second, viral genome-linked protein (VPg) is involved in replication and intracellular movement [26], and is a hub for interactions with other viral proteins [27]. Mutations in VPg have been pervasively observed in evolution experiments of potyviruses in A. thaliana, in all cases resulting in increased infectivity, virulence and viral load [23,28-31]. Together, these observations indicate that genome replication and viral movement underlie the increased virulence of the evolved virus.
The genetic architecture of TuMV resistance
We identified a 1.5 Mb region on chromosome 2 that was strongly associated with necrosis and severity of symptoms, accounting for approximately half the cases of necrosis. This region encompasses several genes (Table 1), two of which are especially strong candidates for causing the phenotype. Firstly, AT2G14080 encodes a known nucleotide-binding-site leucine-rich repeat (NBS-LRR) disease-resistance protein with an N-terminal Toll/interleukin receptor. These proteins recognize and block translation of viral transcripts in the cytoplasm [32-35]. NBS-LRR genes are the most numerous disease resistance genes in the A. thaliana genome and are under diversifying selection to respond to as broad a spectrum of pathogens as possible [36]. This raises the question of whether a role for AT2G14080 would be TuMV-or Potyvirus-specific. Secondly, DYNAMIN-RELATED PROTEIN 3B (DRP3B) encodes for a self-assembling GTPase involved in fission and fusion of membranes in mitochondria and peroxisomes [26,37]. Its analogue, DRP2B, has been shown to be co-opted by TuMV to enhance virulence, and treatment with dynamic-specific inhibitors suppresses growth by interfering with VPg [26]. As previously noted, one of the two amino-acid differences between the ancestral and evolved viruses is in VPg [23]. These observations make AT2G14080 and DRP3B strong candidate genes for a role in viral resistance, either independently or in tandem.
Twelve additional loci (besides the major association on chromosome 2) were significantly associated with the response to one (5) or both (8) viruses (Fig. 2). Lines with the susceptible alleles at these loci were associated with up to 9.7-fold increased risk of necrosis compared to lines with the resistant allele (Figs. 2E-F), and the low linkage disequilibrium between these loci indicates that they segregate independently of the major association on chromosome 2, and of each other (Fig. S4). However, these alleles are also at very low global frequencies (Table S1). On one hand, this is consistent with the expectation that selection against such deleterious alleles keeps susceptible alleles rare. On the other hand, there is a substantial risk that alleles at such low frequency should be associated with a binary phenotype at similar frequency just by chance. As such, caution is warranted in interpreting a causative role for these associations.
We found very little overlap with associations found in two previous GWA analyses of TuMV resistance in A. thaliana. First, Butković et al. [12] identified genome-wide associations for AUDPS, severity of symptoms and infectivity under very similar experimental conditions to those used here, but using two viral isolates that differed in their host range (one evolved as a specialist in more permissive A. thaliana lines and the other evolved as a generalist able to successfully infect more resistant lines) and fewer host lines. That analysis recovered the association with AT2G14080 for both isolates, and identified eleven additional loci associated with the response to one or both viruses. These eleven loci identified were not recovered in our larger dataset. This lack of consistency can either indicate that these associations were spurious artifacts of a limited sample size or, alternatively, a true biological effect due to the different TuMV isolates used by Butković et al. [12] and in this study. Second, we did not detect any of the genes associated with viral load or infectivity in 317 lines grown under field conditions identified by Rubio et al. [11], and nor did that study detect the association on chromosome 2 reported here. In this case, the lack of overlap may be explained not only by the differences in sample sizes, but also by the differences in traits measured, viral isolate and environmental conditions.
The Copia-element insertion is a candidate causative variant
We identified a Copia-element polymorphism in the first intron of AT2G14080, which is found in all the four lines with long-read genome assemblies that show necrosis in response to either virus (and only one other line). Given this strong association, and the fact that first introns often harbor regulatory elements, this insertion is a strong candidate for a causative mutation. Whether it turns out to be casual or not, the abundance of structural variation in this region highlights the need for restraint when trying to identify any causal polymorphisms from SNP data alone, and more generally the limitation of reference-biased polymorphism data.
It is also interesting to consider whether structural variation is driven by selection for diversification of resistance genes, or whether particular structural variants themselves cause variation in disease resistance. It has been previously observed that plant disease-resistance genes often form clusters of duplicated copies within the genome, which would contribute to structural variation between genomes [38]. In particular, NBS-LRR genes, of which AT2G14080 is an example, are known to have undergone expansion by numerous large-and small-scale duplication and translocation events [38]. However, we did not observe widespread duplications of AT2G14080 or its domains, nor evidence of synteny with other regions of the genome that would indicate translocations, so in this case a simple transposon insertion remains the most likely explanation.
The distribution of susceptible alleles is consistent with frequency-dependent selection
Given that potyvirus outbreaks are common in nature [9] and susceptibility is unquestionably deleterious, it is curious that susceptible alleles should be at sufficiently high frequency to be detectable. There are three explanations for this. First, selection may be sufficiently weak or the virus geographically restricted, such that alleles can arise in one location and increase in frequency by genetic drift. If this were true, we would expect to see a clustered geographic distribution of susceptible alleles, reflected in underdispersion of distances between pairs of susceptible lines. While this is true for most of the loci with small effects on necrosis, susceptible alleles at the major association on chromosome 2 are spatially overdispersed worldwide, and found throughout unrelated lines (Fig. 4). These patterns are difficult to explain via genetic drift. Second, it may be that the genomic instability in the region surrounding this association leads to a high turnover of new structural mutations that decrease viral resistance. This is implausible because this would not generate linkage with individual SNPs that could be detected by GWA. Moreover, we found a striking concordance between a single Copia-element insertion into AT2G14080 and necrosis, suggesting that only a single variant is responsible for increased necrosis in this region. Neither genetic drift nor mutation-selection balance can thus explain the persistence of susceptible alleles at the major association for necrosis.
An alternative explanation is that susceptible alleles are beneficial in the absence of the virus. This would cause a fitness trade-off between alleles in this region, as has been previously demonstrated for many other pathogen-resistance systems in plants [39,40]. Potyvirus outbreaks are common in natural A. thaliana populations, but ephemeral [9], causing susceptible alleles to decrease in frequency during outbreaks, but to increase at other times. This would lead to negative frequency-dependent selection maintaining the susceptible allele at a frequency in proportion to the frequency of TuMV outbreaks. Despite being at low frequency worldwide, the susceptible allele is found across the geographic and genealogical distribution of A. thaliana, indicating that the polymorphism must either be very old and has been maintained by balancing selection over long periods, or that alleles have spread by adaptive introgression during viral outbreaks. These data do not allow us to distinguish these hypotheses, nor are they mutually exclusive, but both are consistent with a fitness trade-off at this locus. We conclude that the worldwide geographic distribution of susceptible alleles is therefore consistent with negative frequency-dependent selection maintaining the susceptible allele at low, but non-zero, frequency.
Materials and methods
Viruses and inoculation procedure
We obtained the ancestral virus from infected Nicotiana benthamiana DOMIN plants inoculated with a transcript product from a p35STunos infectious plasmid that contains TuMV genome cDNA (GenBank line AF530055.2), corresponding to YC5 isolate from calla lily [15]. This cDNA was under the control of the cauliflower mosaic virus 35S promoter and a NOS terminator. We obtained the evolved virus via 12 passages of experimental evolution on A. thaliana line Col-0; see [16] for full details. In both cases, symptomatic tissues were pooled, frozen with liquid N2 and homogenized into a fine powder using a Mixer Mill MM400 (Retsch GmbH, Haan, Germany). For inoculations, we mixed 100 mg of powdered liquid-nitrogen-frozen infected tissue in 1 mL of phosphate buffer (50 mM phosphate pH 7.0, 3% PEG6000, 10% Carborundum) and rubbed 5 μL of this mixture into three central rosette leaves per plant. We inoculated all the lines at a similar growth stage to reduce the noise that large differences in vegetative development could cause. We inoculated the plants when they reached growth stage 3.2 - 3.5 in the Boyes et al. [41] scale. In our growing conditions the lines used in this study reached that stage approximately 21 days after germination.
Plant growth and phenotyping
We screened a total of 1,050 lines from the Arabidopsis 1001 Genomes Project [17] for disease phenotypes (S1 Appendix). We grew selected lines in climatic chambers under a long-day regime (16 hours light/8 hours darkness) with 24 °C day and 20 °C night, 45% relative humidity and light intensity of 125 µmol m−2s−1 using a 1:3 mixture of 450 nm blue and 670 nm purple LEDs. Due to limited growth-chamber space and labor, we inoculated and phenotyped lines in four independent cohorts of 4,800 plants each. Five lines in the fourth block that did not reach the proper size on the day of the inoculation were inoculated four days after the other lines. We inoculated eight plants per line with the ancestral virus and another eight with the evolved virus, as well as two mock-inoculated plants that served as negative controls. We placed four lines inoculated with each viral isolate and the corresponding mock-inoculated plants in the same tray and randomized tray positions every day.
We measured four disease-related traits daily for 21 days post inoculation, at which point infection phenotypes reached a steady plateau. We measured AUDPS [18], infectivity, severity of symptoms (Fig. 1A), and necrosis. Necrosis was considered present in a line if at least one plant showed full-leaf systematic necrosis, as shown with number 5 in Fig. 1A. We compared differences in AUDPS, infectivity, and severity of symptoms between plants inoculated with the ancestral vs. evolved viruses using Mann-Whitney-U tests. We compared differences in necrosis using McNemar’s test, which allows for data which are both binary and paired.
To validate the association between necrosis and symptom severity with the candidate region on chromosome 2, we tested an additional cohort including all 51 lines that had previously shown necrosis in response to one or both viruses together with 67 randomly chosen non-necrotic lines from the previous screen. This confirmation cohort was inoculated and grown in the same way as the four previous cohorts.
Genetic associations
We used the Python package LIMIX 3.0.3 [20] in Python 3.7.3 to perform multi-trait genome-wide association analyses of disease-related traits based on the statistical framework developed in [21,22]. We accounted for cohort effects by including these as fixed cofactors, and for population structure by modeling the covariance between lines due to relatedness as a random effect [42]. We used a liberal minor-allele-frequency cut-off of 3% to allow us to detect rare variants associated with necrosis, since only 3.7% and 4.9% of lines showed necrosis in response to the ancestral and evolved viruses respectively. In a second analysis, we repeated this GWA for necrosis including the genotype at chromosome 2 position 5,927,469 as a covariate to account for the confounding effects of this locus [21].
We estimated narrow-sense SNP heritability using the package Sommer 4.1.4 [43] by regressing phenotypes onto the matrix of pairwise relatedness between individuals [44]. To estimate variance explained by the major association for necrosis, and to assess the sensitivity of GWA and heritability to the presence of this locus we also repeated both GWA and heritability estimates including genotypes at the SNP most strongly associated with necrosis as a covariate.
Structural variation around locus AT2G14080
Confirming the insertion using long-read genome assemblies
We examined haplotype structure in the 225 Kb surrounding the region associated with necrosis using data from 53 full genomes sequenced using PacBio long reads [45], and assembled using the methods previously described for the 1001 Genomes Plus Project [46]. We extracted sequences around the peak of association close to AT2G14080. We identified the precise location of that gene, as well as eight annotated genes and transposable elements on each side from the Araport 11 database (https://www.araport.org/), using BLAST [47] if they showed 70% percent identity and were at least 70% of the length of the gene or transposable element in the reference genome. When comparing whole genomes, it is not meaningful to plot SNP positions with the coordinate system of a reference genome, so to visualize the results we plotted haplotypes on a relative scale centered between AT2G14050 and DRP3B, since these genes were largely syntenic between lines and flanked most of the region associated with necrosis. Finally, we sorted lines based on the distance between those two genes (Fig. 3).
To confirm the insertions observed in lines 351, 870, 7346, and 9102, we mapped the raw PacBio reads to the new assembly using Minimap2 [48] with the option “-ax map-pb” and checked if any breaks coincided with the insertion position that would suggest an artifact of the assembly. This was not the case.
Genotyping the insertion in the 1001 Genomes
We attempted to confirm the presence of the insertion in the full sample using existing short-read sequencing data [17]. We used multiple approaches, all based on the flanking sequence of the insertion. First, using two different mappers, bwa-mem (http://bio-bwa.sourceforge.net) as well as bowtie [49], we mapped all the short-read data to the insertion sequence plus 5 Kb of flanking sequence (on either side) from line 870, filtering the bam files using samtools “rmdup” [50] to remove duplicates. For each line, the number of paired reads mapping to each side of the insertion borders were extracted and counted. We assumed that the presence of such reads would confirm the presence of the insertion, whereas lines without the insertion would only have paired reads flanking the whole insertion. However, the mapping quality at the flanking regions was too low for this approach to work. Many flanking regions had no coverage from short-read sequencing (even when duplicated reads were kept). The reasons for this are not clear, but presumably reflect high levels of repetitiveness and high levels of polymorphism in the region. In a second approach, we use bbmap (https://sourceforge.net/projects/bbmap) to look for the exact sequence at the insertion site (±50 bp) within the raw fastq file. However, when we used the four lines with a confirmed insertion from de novo long-read assemblies as a control, this approach only worked in two cases. Again, the reasons are not clear, but the approach is clearly too unreliable for genotyping.
Geographic distribution of major and minor necrosis alleles
We plotted the worldwide distribution of necrosis phenotypes and genotypes at the most strongly associated SNP using R packages maps and mapdata [51,52]. We defined “resistant” and “susceptible” genotypes at each associated SNP based on the allele most strongly associated with necrosis. To test whether the lines harboring susceptible alleles are more or less geographically dispersed than would be expected by chance, we first calculated the mean distances between all pairs of lines with the susceptible alleles, and compared this to mean distances between lines with the minor allele at 10,000 randomly chosen lines with minor allele counts between 10 and 200 (minor allele counts at significant ranged from 33 to 178).
Data availability
Phenotype data and code to reproduce the analyses presented here are given at GitHub (https://github.com/ellisztamas/tumv_ms) and Zenodo (doi: 10.5281/zenodo.5789488). Sequence data are available from the 1001 Genomes Project website (https://1001genomes.org/) [17]. Unless otherwise stated analyses and plotting were done in R 4.0.3 [53] under RStudio Server Pro 1.3.1093-1 [54].
Supporting information
S1 Fig. Manhattan plots for the association between SNPs and necrosis in the replicate dataset of 116 lines.
S2 Fig. Manhattan plots for associations with common disease responses to both TuMV isolates.
S3 Fig. Manhattan plots for associations with disease responses specific to individual TuMV isolates.
S1 Appendix. Full list of A. thaliana lines for the GWAS analysis. (EXCEL).
Acknowledgements
We thank Paula Agudo, Francisca de la Iglesia and Joanna Gunis for excellent technical support. Work was funded by Spain’s Agencia Estatal de Investigación-FEDER grant PID2019-103998GB-I00 and Generalitat Valenciana grants GRISOLIAP/2018/005 and PROMETEU2019/012 to SFE. RG were supported by Agencia Estatal de Investigación-FEDER contract BES-2016-077078. MN was funded by ERC AdG 789037 -EPICLINES, ERA-CAPS (FWF I 3684-B25) and by the GMI.
References


