

ABSTRACT
Herbicide resistance in weeds is a growing threat to global crop production. Non-target site resistance is problematic because a single resistance allele can confer tolerance to many herbicides (cross resistance), and it is often a polygenic trait so it can be difficult to identify the molecular mechanisms involved. Most characterized molecular mechanisms of non-target site resistance are caused by gain-of-function mutations in genes from a few key gene families – the mechanisms of resistance caused by loss-of-function mutations remain unclear. In this study, we first show that the mechanism of non-target site resistance to the herbicide thaxtomin A conferred by loss-of-function of the gene PAM16 is conserved in Marchantia polymorpha, validating its use as a model species with which to study non-target site resistance. To identify mechanisms of non-target site resistance caused by loss-of-function mutations, we generated 107 UV-B mutagenized M. polymorpha spores and screened for resistance to the herbicide thaxtomin A. We isolated 13 thaxtomin A-resistant mutants and found that 3 mutants carried candidate resistance-conferring SNPs in the MpRTN4IP1L gene. Mprtn4ip1l mutants are defective in coenzyme Q biosynthesis and accumulate higher levels of reactive oxygen species (ROS) than wild-type plants. Mutants are also defective in thaxtomin A metabolism, consistent with the hypothesis that loss of MpRTN4IP1L function confers non-target site resistance. We conclude that loss of MpRTN4IP1L function is a novel mechanism of non-target site herbicide resistance, and propose that other mutations which increase ROS levels or decrease thaxtomin A metabolism could confer thaxtomin A resistance in the field.
AUTHOR SUMMARY Modern agriculture relies on herbicides to control weed populations. However, herbicide resistance in weeds threatens the efficacy of herbicides and global crop production, similar to how antibiotic resistance poses a global health threat. Understanding the molecular mechanisms behind herbicide resistance helps to prevent resistance from evolving and to better manage herbicide resistant weeds in the field. Here, we use a forward genetic approach in the model species Marchantia polymorpha to discover novel mechanisms of herbicide resistance. We report the discovery of a novel mechanism of herbicide resistance caused by loss-of-function mutations in the MpRTN4IP1L gene. We find that Mprtn4ip1l mutants are resistant to the herbicides thaxtomin A and isoxaben, accumulate higher levels of reactive oxygen species than wild type plants, and are defective in thaxtomin A metabolism. We predict that loss-of-function mutations or treatments that increase reactive oxygen species production could contribute to thaxtomin A tolerance.
INTRODUCTION
The control of weeds by herbicides is threatened by the evolution of resistance in the field (1, 2). This is analogous to how human and animal health is threatened by the evolution of antibiotic resistance in bacteria. The intense selection pressure resulting from herbicide treatments can lead to the rapid evolution of herbicide resistance in the agricultural landscape (1). Resistance can result from genetic changes in the gene encoding the herbicide target which lead to conformational changes in the target protein blocking herbicide binding, or overexpression of the target (3, 4). This form of resistance, which involves mutations only in the gene encoding the target protein, is known as target site resistance. Resistance can also result from genetic changes in a variety of genes which prevent inhibitory levels of herbicide reaching the target, or that alleviate the toxic effects of the herbicide downstream from the target (1, 3, 5). For example, a mutation which causes constitutive expression of a glycolsyltransferase gene causes resistance in the weed species Alopecurus myosuroides. This is due to increased herbicide metabolism and increased accumulation of antioxidant flavonol metabolites which confer resistance to herbicides whose toxicity depends on the accumulation of toxic reactive oxygen species (6–8). These types of resistance – which do not involve mutations in the gene encoding the herbicide target – are known as non-target site resistance.
Both target site and non-target site herbicide resistance can be caused by gain of function mutations, which cause an increase in expression of a gene or enhanced activity of a protein. For example, EPSPS encodes a protein essential for aromatic amino acid biosynthesis which is the target of the herbicide glyphosate (9). Gain of function mutations in the gene encoding 5-enolpyruvyl shikiminate-3-phosphate synthase (EPSPS) resulting from gene amplification (multiple rounds of gene duplication) confers target site resistance to the herbicide glyphosate (10, 11). EPSPS gene copy number is greater in many glyphosate-resistant populations than in glyphosate-sensitive populations, resulting in higher steady state levels of EPSPS mRNA, protein, and total enzyme activity. The resulting elevated levels of EPSPS activity increase glyphosate resistance (11). Non-target site resistance can also be conferred by spontaneous gain of function mutations in genes encoding enzyme activities that chemically modify or compartmentalize herbicides and prevent the herbicide reaching the target (1, 5, 12). For example, constitutive overexpression of an ABC transporter causing glyphosate export into the apoplast results in glyphosate resistance in Echinocloa colona (13).
Loss-of-function mutations – mutations that result in reduced gene and protein function – can also cause target site resistance. This is because mutations in the gene encoding a herbicide target which cause conformational changes that prevent herbicide binding can also reduce the capacity of the protein to carry out its function. For example, some mutations in EPSPS that confer glyphosate resistance by preventing the binding of glyphosate also reduce the affinity of EPSPS for its substrate phosphoenolpyruvate, leading to reduced catalytic activity (14). However, very few loss-of-function mutations causing non-target site resistance have been reported in weeds. Recent genome wide association studies have identified mutations associated with glyphosate resistance in the weed species A. tuberculatus and I. purpurea of which some are likely to be loss-of-function, suggesting that the contribution of loss-of-function mutations to non-target site resistance has been underestimated, however the contribution of these mutations to resistance has not yet been experimentally confirmed (15–17). Only two mechanisms of non-target site resistance involving loss-of-function mutations have been proven to confer resistance, using forward genetics in the model species A. thaliana (18, 19). As such, the role of loss-of-function mutations in non-target site resistance in weeds is unclear.
It is likely that both gain- and loss-of-function mutations contribute to non-target site resistance in herbicide resistant weed populations, but it is difficult to identify resistance mechanisms of non-target site resistance, including those conferred by loss of gene function. This is partly because non-target site resistance is usually a polygenic trait, and each single allele may contribute little to resistance. For example, in a sample of glyphosate resistant Amaranthus tuberculatus individuals, it was estimated that 25 % of the variance in resistance was attributed to non-target site resistance associated with SNPs in 274 genes with a range of allele frequencies and effect sizes (15, 17). Identifying the mutant genes that contribute such a small amount to total resistance phenotypes is challenging in weeds. This makes defining the molecular basis of non-target site resistance difficult. The few alleles which have been identified are those which have a large effect on resistance. So far, these have all been gain-of-function alleles involving genes from a few key gene families such as cytochrome P450s, glutathione-S-transferases, glycosyltransferases, and ABC transporters (5). There are likely a variety of undiscovered non-target site resistance causing mutations which each have a small effect on resistance but additively cause strong resistance. Identifying these diverse mechanisms of non-target site resistance – which likely include loss-of-function mutations – remains a challenge.
We set out to identify mechanisms of non-target site resistance to thaxtomin A – a natural product being developed as a herbicide – caused by loss-of-function mutations. We chose thaxtomin A because it has been approved by the US Environmental Protection Agency as a herbicide (EPA registration number 84059-12) (20–26). Thaxtomin A is thought to act by inhibiting plant cell wall biosynthesis, a process necessary for plant growth and the inhibition of which leads to plant death (27, 28). This plant specific mode of action makes thaxtomin A a favourable herbicide choice due to its low toxicity to animals. To date, only one mechanism of resistance to thaxtomin A has been identified (via forward mutagenesis in Arabidopsis thaliana) caused by loss-of-function mutations in PAM16, which encodes a member of the TIM complex, involved in protein transport into mitochondria (18, 29, 30).
To identify novel loss-of-function mutations that confer resistance to thaxtomin A, we UV mutagenized a large population of Marchantia polymorpha spores and screened for mutants which survived the lethal dose of thaxtomin A. We chose M. polymorpha as a model species because a single female sporophyte produces millions of haploid spores which can be mutagenized and directly screened for resistance. This enables rapid mutant screens in large populations that would be difficult to carry out at the same scale in diploid flowering plant models (31, 32). Furthermore, there is evidence that gene networks underlying bryophyte gametophyte physiology and development are similar to those in angiosperms (33, 34). We identified 13 thaxtomin A-resistant mutants. Three independent mutants carried candidate resistance-conferring mutations in the MpRTN4IP1L gene, which functions in the biosynthesis of coenzyme Q, a component of the mitochondrial electron transport chain. Mprtn4ip1l mutants accumulated higher levels of reactive oxygen species (ROS) than wild type controls and were defective in thaxtomin A metabolism. Taken together these data suggest that mutations that lead to ROS accumulation or which hinder thaxtomin A metabolism may confer resistance to thaxtomin A. We predict that loss-of-function mutations that increase ROS levels or decrease thaxtomin A metabolism in weeds will confer resistance to thaxtomin A in the field.
RESULTS
A mechanism of non-target site resistance conferred by loss-of-function of PAM16 is conserved in M. polymorpha
To determine if M. polymorpha is a suitable model species for discovering novel mechanisms of non-target site resistance to thaxtomin A, we first tested if M. polymorpha is sensitive to thaxtomin A. Wild type gemmae from Takaragaike-1 (Tak-1) and Takaragaike-2 (Tak-2) accessions were grown on solid medium supplemented with different concentrations of thaxtomin A. The area of living tissue of these plants was measured after 14 days (Fig 1A). Thaxtomin A treatment inhibits the growth of wild type M. polymorpha in a dose-dependent manner (Fig 1A and 1B). The IC50 (dose at which average area of living tissue is reduced by 50 %) was 56 ± 6 nM for Tak-1, and 135 ± 24 nM for Tak-2. The LD100 (lethal dose at which no plant tissue is alive) for both Tak-1 and Tak-2 was 5 µM, although in rare cases Tak-1 can survive this dose (Fig 1A and 1B).

A: Dose-response curves of the growth of wild type lines on thaxtomin A (TXTA). Wild type gemmae (Tak-1 and Tak-2) were grown for 14 days on solid medium supplemented with different concentrations of thaxtomin A. The fitted curves and IC50values were calculated using the four-parameter log-logistic equation. Error bars represent ± standard deviation (n = 18). B: Wild type (Tak-1) gemmalings grown for 12 days on solid medium supplemented with DMSO, 100 nM thaxtomin A, or 5000 nM thaxtomin A. Images were taken with a Keyence VHX-7000. Scale bars represent 2 mm. C: Phylogenetic analysis of PAM16 in plants. Proteins similar to AtPAM16 (At3G59280) were identified by protein BLAST search (E value < 1E-5) against the reference proteomes of various species (Table 1) (35). Orthologues were aligned and a maximum likelihood analysis was conducted. The tree was rooted with the PAM16 homologue from S. cerevisiae. A non-parametric approximate likelihood ratio test based on a Shimodaira-Hasegawa-like procedure was used to calculate branch support values (36). D: Schematic representation of the MpPAM16 (Mp3g09390) gene. CDS regions are represented in yellow. The regions of the gene targeted by guide RNAs are marked with green arrowheads. E and F: Wild type gemmae (Tak-1 and Tak-2) and gemmae from the nine thaxtomin A-resistant Mppam16 mutants were grown for 12 days on solid medium supplemented with 5 µM thaxtomin A (E) or 0.1 % DMSO (F). The fitted curves and IC50 values were calculated using the four-parameter log-logistic equation. Error bars represent ± standard deviation (n = 2-7). Stars represent the level of significance (as determined by Student’s t-tests) of the difference between mutant and control lines (comparison to Tak-1 in red and Tak-2 in green): * = p < 0.05, ** = p < 0.01, *** = p < 0.001.
To validate the suitability of M. polymorpha to study non-target site resistance to thaxtomin A, we tested whether a known mechanism of non-target site thaxtomin A resistance discovered in Arabidopsis thaliana is conserved in M. polymorpha. Loss-of-function mutations in the AtPAM16 gene (AT3G59280) confer non-target site resistance to thaxtomin A in A. thaliana (18, 30). PAM16 encodes a subunit of the PAM/TIM complex that transports proteins across the inner mitochondrial membrane (29). We tested the hypothesis that loss of PAM16 function confers thaxtomin A-resistance in M. polymorpha.
The closest homologue of AtPAM16 in M. polymorpha was identified by BlastP as Mp3g09390 (35). To determine the evolutionary history of the PAM16 gene and determine if Mp3g09390 is the only copy of PAM16 in M. polymorpha, a phylogeny was created of the homologues of PAM16 from different species. Protein sequences similar to AtPAM16 (AT3G59280) from 11 species were identified by searching their proteomes using the BlastP algorithm (Table 1) (35). The plant species included were the liverwort M. polymorpha, the moss P. patens, the hornwort A. agrestis, the lycophyte S. moellendorfii, the fern A. filiculoides, the gymnosperm P. abies, and the angiosperms A. trichopoda, A. thaliana, Z. mays, and O. sativa. PAM16 from the yeast Saccharomyces cerevisiae was used as an outgroup. The sequences were aligned using the L-INS-i strategy in MAFFT (37) and manually trimmed to remove poorly conserved regions (S1A and S1B Fig). A maximum likelihood tree was constructed using this alignment and a non-parametric approximate likelihood ratio test based on a Shimodaira-Hasegawa-like procedure was used to calculate node support values using PhyML 3.0 (36) (Fig 1C). There were between one and three copies of PAM16 in each species and there was one copy in M. polymorpha (Mp3g09390). Mp3g09390 is therefore the only PAM16 gene in the M. polymorpha genome and will be referred to as MpPAM16.
To determine if loss of MpPAM16 function confers thaxtomin A resistance, Mppam16 loss-of-function mutants were generated using CRISPR-Cas9 mutagenesis. Guide RNAs were designed to generate mutations in the highly conserved N-terminal predicted signal peptide which targets the PAM16 protein to the inner mitochondrial membrane (sgRNA 2), and a non-conserved region at the C-terminal end of the protein (sgRNA 1) (Fig 1D). Thirty-three Mppam16 mutants were generated. The highly conserved signal peptide was mutated in 28 Mppam16 mutants; the non-conserved C-terminal region of the protein was mutated in the 5 remaining Mppam16 mutants.
Gemmae from the Mppam16 mutant lines were grown on solid medium supplemented with 5 µM thaxtomin A (LD100) (Fig 1E) or 0.1 % DMSO (Fig 1F). The area of living plant tissue was quantified after 12 days of growth. Mppam16 mutant lines which were significantly larger than wild type plants on thaxtomin A were classed as resistant. Nine Mppam16 lines were significantly larger than both Tak-1 and Tak-2 on 5 µM thaxtomin A and therefore classed as thaxtomin A-resistant (p < 0.05) (Fig 1E).
Five of the nine thaxtomin A-resistant Mppam16 mutants were significantly smaller than Tak-1 and Tak-2 plants in control conditions, including the four Mppam16 mutants which grew largest on thaxtomin A – Mppam16GE258, Mppam16GE255, Mppam16GE235, and Mppam16GE26 (Fig 1F). This suggests that growth defects are more likely in Mppam16 mutant lines with stronger resistance to thaxtomin A.
All 9 thaxtomin A-resistant Mppam16 mutants were mutated in the highly conserved region that comprises the predicted PAM16 signal peptide (S1C Fig). The mutations in the thaxtomin A-resistant mutants affect between 2 and 19 amino acids and involve a range of substitutions, insertions, and deletions (S1C Fig). A mutation in the signal peptide is predicted to disrupt PAM16 function by preventing its transport to the mitochondria. These mutations are therefore likely to be loss-of-function. Given that all 9 thaxtomin A-resistant Mppam16 mutant lines carry likely loss-of-function mutations, we conclude that loss-of-function of Mppam16 can confer thaxtomin A resistance. The resistance of Mppam16 mutants to thaxtomin A validates M. polymorpha as a model to identify novel mechanisms of non-target site resistance to this herbicide.
13 thaxtomin A-resistant M. polymorpha mutants were isolated from a screen of 107 mutants
A genetic screen was carried out to identify mutants resistant to the herbicide thaxtomin A. To generate thaxtomin A-resistant mutants, 2 x 10⁷ wild type M. polymorpha spores were plated on solid medium supplemented with 5 µM thaxtomin A and exposed to UV-B irradiation to induce mutations. A screening dose of 5 µM thaxtomin A (LD100) was selected as screening at the lethal dose (as opposed to higher than the lethal dose) preferentially selects for non-target site resistance (38). The dose of UV-B radiation used killed approximately 50 % of spores (S2 Fig). Ten million mutagenized spores were screened for resistance to thaxtomin A 14 days after mutagenesis (Fig 2A). Resistant mutants were transferred to fresh solid medium supplemented with 5 µM thaxtomin A to confirm their resistance. Mutants that survived the second round of selection were retained, and gemmae from each resistant mutant were plated onto fresh solid medium supplemented with 5 µM thaxtomin A to verify the retention of resistance through asexual reproduction (Fig 2B). Mutant gemmae that survived and grew significantly larger than wild type gemmae on 5 µM thaxtomin A were classed as thaxtomin A-resistant (Fig 2C). Using this protocol, 13 thaxtomin A-resistant Mpthar (thaxtomin A resistant) mutant lines were identified out of the 107 mutagenized spores screened.
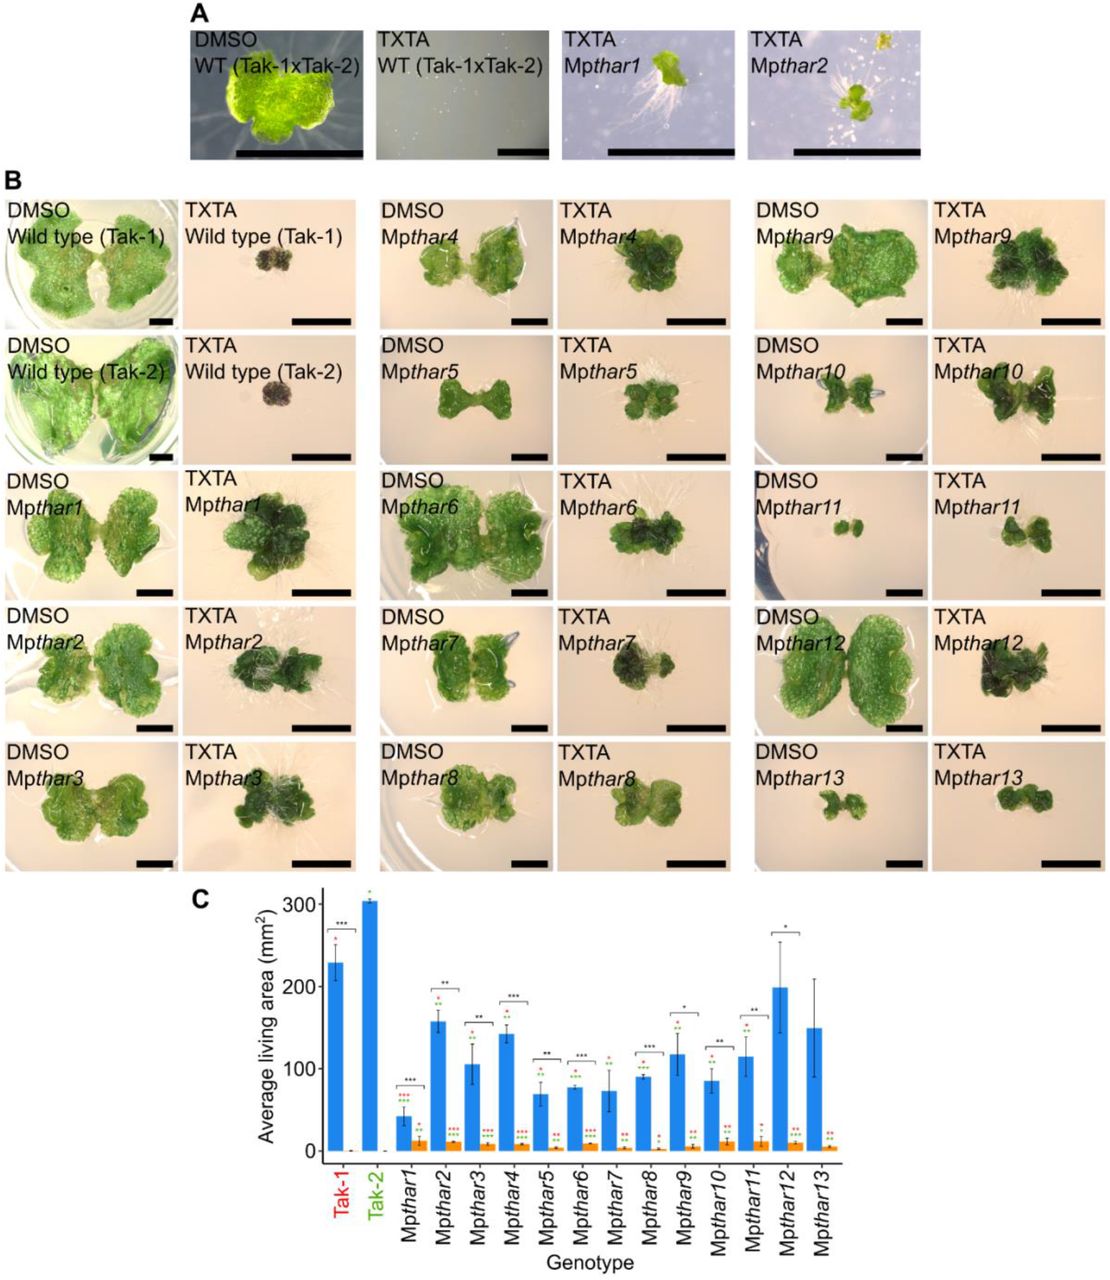
A: Wild type spores from a cross between Tak-1 and Tak-2 grown for 14 days on solid medium supplemented with 0.1 % DMSO or 5 µM thaxtomin A (TXTA), and UV-B mutagenesis selection plates supplemented with 5 µM thaxtomin A showing 14-day old thaxtomin A-resistant mutants Mpthar1 and Mpthar2 surrounded by dead mutagenized thaxtomin A-sensitive spores. Images were taken with a Leica DFC310 FX stereomicroscope. Scale bars represent 2 mm. B: Wild type (Tak-1 and Tak-2) and Mpthar gemmalings grown for 12 days on solid medium supplemented with 0.1 % DMSO or 5 μM thaxtomin A. Images were taken with a Keyence VHX-7000 and the maximum pixel value was adjusted to 188 in ImageJ. Scale bars represent 2 mm. C: Gemmae from wild type lines (Tak-1 and Tak-2) and from Mpthar lines were plated on solid medium supplemented with DMSO (blue bars) or 5 μM thaxtomin A (orange bars) and grown for 21 days (n = 3-13). The fitted curves and IC50 values were calculated using the four-parameter log-logistic equation. Error bars represent ± standard deviation. Stars represent the level of significance (as determined by Student’s t-tests) of the difference between mutant and control lines subjected to the same treatment (comparison to Tak-1 in red and Tak-2 in green), or between individuals of the same genotype subjected to different treatments (black): * = p < 0.05, ** = p < 0.01, *** = p < 0.001.
The MpRTN4IP1L gene is mutated in three Mpthar mutants
To identify mutations that confer thaxtomin A resistance, the genome of each Mpthar mutant was sequenced and the most likely resistance-conferring SNP in each mutant was identified using a modified version of a SNP calling bioinformatic pipeline adapted from (39). Mismatches in the genomes of Mpthar mutants were compared to mismatches in the genomes of thaxtomin A-sensitive plants (Tak-1, Tak-2, and thaxtomin A-sensitive UV-B mutants (39)). Mismatches found only in Mpthar mutants and which passed further filtering steps were considered to be candidate resistance-conferring mutations. Between 6 and 27 candidate resistance-conferring mutations were identified for each Mpthar mutant. These SNPs were compared between Mpthar mutants. There were candidate resistance-conferring SNPs in the Mp3g19030 gene in 3 independent Mpthar mutants (Mpthar2, Mpthar4, and Mpthar6) (Fig 3A and 3B). The presence of these SNPs was confirmed by Sanger sequencing (S3A, S3B, and S3C Fig). Given that the Mp3g19030 gene carries a candidate resistance-conferring mutation in 3 independent Mpthar mutants, it is likely that a mutation in Mp3g19030 confers thaxtomin A resistance.

A: Schematic representation of the MpRTN4IP1L (Mp3g19030) gene. CDS regions are represented in yellow. The positions of the SNPs in Mpthar are marked with blue arrowheads. The regions of the gene targeted by guide RNAs (sgRNA 1 and sgRNA 2) are marked with green arrowheads. B: Nucleotide alignments of the wild type MpRTN4IP1L gene and the mutant Mpthar genes, and amino acid alignments of the MpRTN4IP1L protein and predicted mutant Mpthar proteins. C: Phylogenetic analysis of RTN4IP1 in eukaryotes. Proteins similar to the human RTN4IP1 protein were identified by protein BLAST search (E value < 1E-5) against the reference proteomes of various species (Table 2) (35). Orthologues were aligned and a maximum likelihood analysis was conducted. The tree was rooted with the RTN4IP1 homologue (Yim1p) from S. cerevisiae. A non-parametric approximate likelihood ratio test based on a Shimodaira-Hasegawa-like procedure was used to calculate branch support values (36). D: Magnification of the red boxed branch from (C) showing that Mp3g19030 diverges into a monophyletic clade containing the human RTN4IP1 gene.
Proteins similar to HsRTN4IP1.1 were identified via BlastP search of proteomes from these species (35). Only homologues with an E value < 1 E-5 were included in the analysis.
Mp3g19030 is annotated in the reference M. polymorpha genome (MpTak v6.1) as a homologue of the H. sapiens RETICULON 4-INTERACTING PROTEIN 1.1 (HsRTN4IP1.1) gene. HsRTN4IP1.1 encodes a mitochondrial NADH oxidoreductase involved in the biosynthesis of Coenzyme Q, and its homologue RAD-8 was first discovered in C. elegans (40, 41). To determine the phylogenetic relationship between Mp3g19030 and its homologues, protein sequences similar to HsRTN4IP1.1 from 9 species were identified using the BlastP algorithm to search their proteomes (35). These species included H. sapiens, S. cerevisiae, M. musculus, C. elegans, M. polymorpha, A. thaliana, S. moellendorffii, A. filiculoides, and P. abies (Table 2). The protein sequences were aligned via the L-INS-i strategy in MAFFT (37) and trimmed to remove poorly conserved regions (S3D Fig). A maximum likelihood tree was constructed and a non-parametric approximate likelihood ratio test based on a Shimodaira-Hasegawa-like procedure was used to calculate node support values using PhyML 3.0 (36). The RTN4IP1 homologue (Yim1p) from the yeast S. cerevisiae was used to root the tree (Fig 3C).
There were between 4 and 8 HsRTN4IP1.1 homologues in each of the species analyzed (Table 2). The homologues group into a clade of 2-methylene-furan-3-one reductases (support value 0.9999), a clade containing HsRTN4IP1.1 and its closest homologues (support value 0.9684), and a clade containing quinone oxidoreductases, alcohol dehydrogenases, and prostaglandin reductases (support value 0.9223) (Fig 3C). Based on the annotations, the identified homologues of HsRTN4IP1.1 therefore likely include enzymes with similar activities.
Mp3g19030 forms a clade (support value 0.9999) with the closest HsRTN4IP1.1 homologues from A. thaliana and S. moellendorffii (AT3G15090.1; E value 6 x 10-54, and XP_024530385.1; E value 1 x 10-46) that is sister to the clade representing the RAD-8/RTN4IP1 genes from H. sapiens, M. musculus (RTN4IP1; E value 0) and C. elegans (RAD-8; E value 4 x 10-63) (support value 0.9985) (Fig 3D). Mp3g19030 is the most closely related M. polymorpha homologue of HsRTN4IP1.1 gene based on BlastP. However, the topology of the phylogenetic tree suggests that Mp1g20380, a chloroplast envelope quinone oxidoreductase homologue, is the closest M. polymorpha homologue of HsRTN4IP1.1 (Fig 3D). Therefore, Mp3g19030 will be referred to as MpRTN4IP1-LIKE (MpRTN4IP1L).
Loss-of-function of MpRTN4IP1L is a novel mechanism of herbicide resistance
To independently verify that loss of MpRTN4IP1L function confers thaxtomin A resistance, Mprtn4ip1l loss-of-function mutants were generated using CRISPR-Cas9 targeted mutagenesis. A guide RNA was designed to mutate the beginning of the gene to induce frameshifts (sgRNA 1), and 2 guide RNAs were designed to mutate the sites mutated in Mpthar2, Mpthar4, and Mpthar6 (sgRNA 2 and sgRNA 3) (Fig 3A). In total, 19 Mprtn4ip1l mutants were generated. Based on the nucleotide and predicted protein sequences, there were in frame indels in Mprtn4ip1l which affected 5 or fewer amino acids in the Mprtn4ip1l protein of Mprtn4ip1lGE111 and Mprtn4ip1lGE117 (S4 Fig). There were large indels or frameshift mutations in Mprtn4ip1l which affected 10 or more amino acids in the Mprtn4ip1l protein of the remaining 17 Mprtn4ip1l mutants, therefore these 17 lines were predicted loss-of-function lines (S4 Fig).
Gemmae from the Mprtn4ip1l mutant lines and from lines with a wild type MpRTN4IP1L (Tak-1, Tak-2, and 3 lines which were transformed with the CRISPR construct but had no mutations in the MpRTN4IP1L gene; MpRTN4IP1LGE153, MpRTN4IP1LGE314, and MpRTN4IP1LGE356) were grown on solid medium supplemented with 5 µM thaxtomin A (LD100) (Fig 4A and 4B) or 0.1 % DMSO (Fig 4A and 4C). The average area of living plant tissue was quantified after 12 days of growth. Plant lines which grew significantly larger than Tak-1 and Tak-2 plants on thaxtomin A were classed as resistant.

A: Gemmae from wild type lines (Tak-1 and Tak-2) and from Mprtn4ip1l mutants (Mprtn4ip1lGE118 and Mprtn4ip1lGE149) were grown for 12 days on solid medium supplemented with DMSO or 5 μM thaxtomin A (TXTA). Images were taken with a Keyence VHX-7000 and the maximum pixel value was adjusted to 200 in ImageJ. B and C: Wild type gemmae (Tak-1 and Tak-2) and gemmae from Mprtn4ip1l mutants were grown for 12 days on solid medium supplemented with 5 µM thaxtomin A (B) or 0.1 % DMSO (C). Error bars represent ± standard deviation (n = 2-6). Stars represent the level of significance (as determined by Student’s t-tests) of the difference between mutant and control lines (comparison to Tak-1 in red and Tak-2 in green): * = p < 0.05, ** = p < 0.01, *** = p < 0.001. Red arrowheads indicate lines with a wild type copy of MpRTN4IP1L; yellow arrowheads indicate lines with a small (< 5 amino acids) in frame mutation in MpRTN4IP1L. D: Dose-response curves of the growth of wild type and Mprtn4ip1l mutants on thaxtomin A, and table of corresponding IC50, LD100, and RI values. Gemmae from wild type lines (Tak-1 and Tak-2) and from two independent Mprtn4ip1l mutants generated via CRISPR-Cas9 mutagenesis (Mprtn4ip1lGE118 and Mprtn4ip1lGE149) were grown for 12 days on solid medium supplemented with different concentrations of thaxtomin A. The fitted curves and IC50 values were calculated using the four-parameter log-logistic equation. Error bars represent ± standard deviation (n = 3).
The 17 predicted loss-of-function Mprtn4ip1l lines were significantly larger than both Tak-1 and Tak-2 on 5 µM thaxtomin A so were classed as thaxtomin A-resistant (p<0.05) (Fig 4B). The 2 mutants with small in frame indels in Mprtn4ip1l and the lines with a wild type copy of MpRTN4IP1L however did not grow significantly larger than Tak-1 and Tak-2 on 5 µM thaxtomin A so were classed as thaxtomin A-sensitive (Fig 4B). This suggests that loss-of-function of MpRTN4IP1L confers resistance to thaxtomin A.
When grown in control conditions, the areas of plant lines with a wild type copy of MpRTN4IP1L and the 2 Mprtn4ip1l mutants with small in frame indels are statistically indistinguishable from wild type (Fig 4C). However, 13 of the 17 predicted loss-of-function Mprtn4ip1l mutants were significantly smaller than wild type lines in control conditions (Fig 4C). Loss-of-function of MpRTN4IP1L therefore likely causes decreased growth in control conditions.
To quantify the thaxtomin A resistance of Mprtn4ip1l CRISPR mutants, gemmae from 2 independent Mprtn4ip1l CRISPR lines (Mprtn4ipl1lGE118 and Mprtn4ip1lGE149) were grown on solid medium supplemented with different doses of thaxtomin A (Fig 4A and 4D). The average area of living plant tissue was quantified after 12 days of growth. Dose-response curves were fitted using the four-parameter log-logistic equation (Fig 4D). Three parameters of resistance were calculated from the curves: IC50 (the concentration of thaxtomin A at which the area of living tissue is reduced by 50 %), LD100 (lethal dose at which there is no surviving tissue), and RI (resistance index; ratio between wild type and mutant IC50). The IC50 of Tak-2 was used to calculate the most conservative estimate of RI of each Mprtn4ip1l line. The IC50, RI, and LD100 values of both Mprtn4ip1l mutant lines were significantly higher than either wild type line (Fig 4D). Based on their RI, Mprtn4ip1lGE1518 and Mprad8GE1549 are respectively at least 9.1 ± 2.95 times and 4.1 ± 2.29 times more resistant to thaxtomin A than wild type (Fig 4D). Taken together, these data indicate that loss-of-function mutations in MpRTN4IP1L confer thaxtomin A resistance.
Mprtn4ip1l mutants produce lower levels of coenzyme Q and accumulate higher levels of reactive oxygen species than wild type plants
Having shown that loss-of-function mutations in the MpRTN4IP1L gene confer thaxtomin A resistance, we sought to determine how these mutations changed the physiology of plants to make them thaxtomin A resistant. HsRTN4IP1 interacts with proteins involved in coenzyme Q (CoQ) synthesis and knock-out mutants in the mouse RTN4IP1 gene accumulate less CoQ than wild type (41). We therefore hypothesized that CoQ levels would be lower in Mprtn4ip1l mutants than in wild type M. polymorpha. To test this hypothesis, we measured the levels of coenzyme Q10 (CoQ) in the extracts of wild type (Tak-1) and Mprtn4ip1lGE149mutants via LC-MS/MS. The levels of CoQ in Mprtn4ip1lGE149 are significantly lower than wild type levels in both control and TXTA-treated conditions, consistent with the hypothesis that MpRTN4IP1L is involved in CoQ synthesis (Fig 5A).

A: Ion counts of coenzyme Q10 (CoQ) in wild-type and Mprtn4ip1l mutants as quantified by targeted LC-MS/MS. Tak-1 and Mprtn4ip1lGE149 gemmae were grown on solid medium supplemented with 0.1 % DMSO for 14 days, then transferred to solid medium supplemented with 0.1% DMSO or 5 μM thaxtomin A for 2 days. Cellular fractions were extracted from the plants and analysed via LC-MS/MS. Stars represent the level of significance of the difference between Tak-1 and Mprtn4ip1lGE149 samples as determined by Student’s t-tests: * = p < 0.05, ** = p < 0.01, *** = p < 0.001. Error bars represent ± standard deviation (n = 3-6). B: DAB staining of Tak-1, Tak-2, Mprtn4ip1lGE118, and Mprtn4ip1lGE149. 12-day old gemmalings were stained with 3,3’-diaminobenzidine (DAB), which forms a brown precipitate upon reaction with H2O2. Stained plants were bleached to remove chlorophyll and imaged with a Keyence VHX-7000. Scale bars represent 500 μm. C: Concentration of ROS in wild type and Mprtn4ip1l mutants. The concentration of ROS in 12-day old Tak-1, Tak-2, Mprtn4ip1lGE118, and Mprtn4ip1lGE149 plants was determined by homogenising frozen samples in perchloric acid, followed by incubation with ferric xylenol-orange (FOX) and measurement of absorbance at 560 nm using an Ultrospec 3100 pro spectrophotometer. The absorbance measurements were converted to concentrations of ROS using a calibration curve. Stars represent the level of significance of the difference between mutant and control lines (Tak-1 in red and Tak-2 in green) as determined by Student’s t-tests: * = p < 0.05, ** = p < 0.01, *** = p < 0.001. Error bars represent ± standard deviation (n=3). D: Dose-response curves of the growth of wild type and Mprtn4ip1l mutants on H2O2. Gemmae from Tak-1 (orange), Tak-2 (green), Mprtn4ip1lGE118 (blue), and Mprtn4ip1lGE149 (purple) were grown for 10 days on solid medium supplemented with different concentrations of H2O2. The fitted curves and IC50 values were calculated using the four-parameter log-logistic equation. Error bars represent ± standard deviation (n = 3). LD100 is the lowest concentration at which area of all replicates was 0. RI is the ratio between each Mprtn4ip1l mutant’s IC50 and the IC50 of Tak-1, the more sensitive wild type line, to calculate the most conservative estimate of RI.
Coenzyme Q is an electron acceptor that transports electrons from Complexes I and II to Complex III of the oxidative phosphorylation electron transport chain (42). As electrons flow through the electron transport chain, electrons may leak from Complexes I, II and III and react with oxygen to form reactive oxygen species (ROS). The binding site of CoQ at Complex I is one of the sites of ROS production in the mitochondria (42). Reduced levels of CoQ result in fewer electron carriers active in the oxidative phosphorylation transport chain leading to an excess of electrons leaking from the chain and reacting with oxygen to form ROS. Furthermore, non-mitochondrial CoQ acts as a lipid soluble antioxidant, protecting against oxidative stress by reacting with lipid peroxide radicals thereby preventing their ability to cause lipid peroxidation (43–45). Therefore, we hypothesized that ROS levels would be higher in Mprtn4ip1l mutants than in wild type plants.
To test the hypothesis that Mprtn4ip1l mutants produce higher levels of ROS than wild type plants, 12-day old gemmalings of Tak-1, Tak-2, Mprtn4ip1lGE118 and Mprtn4ip1lGE149 were stained with 3,3’-diaminobenzidine (DAB). DAB reacts with hydrogen peroxide (H2O2) – a form of ROS – to form a brown precipitate. The amount of brown precipitate is proportional to the amount of H2O2 in each sample (46). Both Mprtn4ip1l mutants stained darker than the two wild type lines, indicating higher levels of H2O2 in mutant thalli than in wild type (Fig 5B). The concentration of various forms of ROS (including H2O2 and lipid hydroperoxides) was also quantified in Mprtn4ip1l mutants using a modified ferric-xylenol orange (FOX) assay (47, 48). ROS concentrations were significantly higher in Mprtn4ip1lGE118 and Mprtn4ip1lGE149 than in wild type plants (Fig 5C).
Since Mprtn4ip1l mutants produce more ROS than wild type, we hypothesized that Mprtn4ip1l mutants would be more sensitive (hypersensitive) to ROS treatment than wild type plants. To test this hypothesis the sensitivity of Mprtn4ip1l mutants to toxic levels of exogenous ROS was compared to that of wild type plants. Tak-1, Tak-2, Mprtn4ip1lGE118 and Mprtn4ip1lGE149 gemmae were grown on solid medium supplemented with a range of H2O2 concentrations. The average area of living plant tissue was quantified after 10 days of growth. Dose-response curves were fitted using the four-parameter log-logistic equation, and resistance parameters IC50, LD100 and RI were calculated from the curves (Fig 5D). Both Mprtn4ip1l mutants were more sensitive to H2O2 than wild type lines. The RI values of Mprtn4ip1lGE118 and Mprtn4ip1lGE149 were 0.64 ± 0.26 and 0.88 ± 0.35 respectively, demonstrating that these lines are more sensitive to H2O2 than either wild type line. The RI value of Mprtn4ip1lGE118 was statistically significant (Fig 5D). While the RI value of Mprtn4ip1lGE1549 was not statistically significant, the LD100 of Mprtn4ip1lGE149 was lower than either wild type line (Fig 5D). These data demonstrate that Mprtn4ip1l mutants are more sensitive to H2O2 than wild type plants.
Together, these data indicate that ROS levels are higher in Mprtn4ip1l mutants than in wild type plants. Addition of H2O2 to A. thaliana cells in culture confers partial thaxtomin A resistance (49). The stiffening of the cell wall observed upon H2O2 treatment is thought to prevent the toxic action of thaxtomin A on cell wall biosynthesis (49). We hypothesize that the reduced levels of CoQ in Mprtn4ip1l mutants causes thaxtomin A resistance by increasing ROS levels which changes the physiology of the plant making thaxtomin A less effective. According to this hypothesis, loss-of-function of Mprtn4ip1l is a mechanism of non-target site resistance.
Loss-of-function of MpRTN4IP1L likely confers non-target site resistance
To test the hypothesis that loss-of-function of RTN4IP1L results in non-target site resistance, the strength of thaxtomin A resistance and the cross resistance to other herbicides were tested in Mprtn4ip1l mutants. Herbicide cross resistance and weak thaxtomin A resistance would be consistent with the hypothesis that RTN4IP1L loss-of-function mutations confer non-target site resistance.
The strength of thaxtomin A resistance in Mprtn4ip1l mutants was measured and compared to the strength of resistance to chlorsulfuron in chlorsulfuron target-site resistant mutants. Chlorsulfuron is a herbicide which targets the enzyme acetohydroxyacid synthase (AHAS), also known as acetolactate synthase (ALS). We generated 5 M. polymorpha chlorsulfuron-resistant target site resistant mutants – Mpahaschlorsulfuron resistant (Mpahaschlr) – in a UV-B mutagenesis screen for resistance to chlorsulfuron. Each mutant carries a target site resistance mutation in MpAHAS which confers chlorsulfuron resistance (S6 Fig). Mutations causing a Pro197Ser or Pro197Leu amino acid change, which have been observed to confer chlorsulfuron resistance in angiosperm weeds, were present in 4 out of the 5 Mpahaschlr mutants isolated in this screen (2, 50, 51).
To compare the strength of herbicide resistance in Mprtn4ip1l and Mpahaschlr lines, gemmae from 2 independent Mprtn4ip1l mutants (Mprtn4ip1lGE118 and Mprtn4ip1lGE149) were grown on solid medium supplemented with LD100 or 5 x LD100 of thaxtomin A (Fig 6A and 6B), and gemmae from 5 independent Mpahaschlr mutant lines were grown on solid medium supplemented with LD100 or 5 x LD100 of CS (Fig 6C and 6D). The average area of living plant tissue was quantified after 12 days of growth.

A and B: Wild type gemmae (Tak-1 and Tak-2) and gemmae from Mprtn4ip1l mutants were grown on solid medium supplemented with LD100 (5 µM) or 5 x LD100 (25 µM) of thaxtomin A. (A) Gemmalings were imaged using a Keyence VHX-7000 (scale bars represent 2 mm) (B) Error bars represent ± standard deviation (n = 3). Stars represent the level of significance (as determined by Student’s t-tests) of the difference between mutant and control lines (comparison to Tak-1 in red and Tak-2 in green), or between individuals of the same genotype subjected to different treatments (black): * = p < 0.05, ** = p < 0.01, *** = p < 0.001. C and D: Wild type gemmae (Tak-1 and Tak-2) and gemmae from Mpahaschlr mutants were grown on solid medium supplemented with LD100 (33 nM) or 5 x LD100 (165 nM) of chlorsulfuron. (C) Gemmalings were imaged using a Keyence VHX-7000 (scale bars represent 2 mm) (D) Error bars represent ± standard deviation (n = 3). Stars represent the level of significance (as determined by Student’s t-tests) of the difference between mutant and control lines (comparison to Tak-1 in red and Tak-2 in green), or between individuals of the same genotype subjected to different treatments (black): * = p < 0.05, ** = p < 0.01, *** = p < 0.001. E,F, and G: Dose-response curves of the growth of Mprtn4ip1l mutants on herbicides with different targets and tables of corresponding IC50, LD100, and RI values. Gemmae from Tak-1 (orange), Tak-2 (green), Mprtn4ip1lGE118(blue), and Mprtn4ip1lGE149 (purple) were grown for 12 days on solid medium supplemented with different doses of isoxaben (E), dichlobenil (F), or 2,4-D (G). The fitted curves and IC50 values were calculated using the four-parameter log-logistic equation. Error bars represent ± standard deviation (n = 3). LD100 is the lowest concentration at which area of all replicates was 0. RI was calculated as the ratio between each Mprtn4ip1l mutant’s IC50 and the IC50 of the most resistant wild type line to calculate the most conservative estimate of RI.
Mprtn4ip1l mutants are significantly larger than wild type plants on the thaxtomin A LD100, confirming their thaxtomin A resistance (Fig 6A and 6B). Similarly, Mpahaschlr mutants are significantly larger than wild type on the chlorsulfuron LD100 (Fig 6C and 6D). However, Mprtn4ip1l mutants grow significantly less on thaxtomin A LD100 than in control conditions (Fig 6A and 6B). Conversely, Mpahaschlr mutants are either statistically indistinguishable or significantly larger when grown on chlorsulfuron LD100 than in control conditions (Fig 6C and 6D). This suggests that Mprtn4ip1l mutants are weakly resistant to thaxtomin A, whereas Mpahaschlr are strongly resistant to chlorsulfuron. This is consistent with the hypothesis that Mprtn4ip1l mutants are non-target site resistant.
Mprtn4ip1l mutants die when grown on five times the LD100 of thaxtomin A (Fig 6A and 6B), whereas Mpahaschlr mutants do not die on five times the LD100 of chlorsulfuron (Fig 6C and 6D). The inability of Mprtn4ip1l mutants to survive 5 x LD100 is also consistent with the hypothesis that Mprtn4ip1l mutants are weakly resistant to thaxtomin A. Resistance from loss-of-function mutations in Mprtn4ip1l is therefore more likely to be non-target site resistance than target site resistance.
To further test the hypothesis that loss-of-function of Mprtn4ip1l function causes non-target site resistance against thaxtomin A, we tested if Mprtn4ip1l mutants were resistant to other herbicides (cross resistance). To quantify the cross resistance of Mprtn4ip1l mutants to different herbicides, the resistance of Mprtn4ip1lGE118and Mprtn4ip1lGE149 to the herbicides isoxaben, dichlobenil, and 2,4-D was tested. Isoxaben targets cellulose biosynthesis, targeting the cellulose synthase subunits CESA1, CESA3, and CESA6 (52). Dichlobenil is also classed as a cellulose biosynthesis inhibitor, but its target protein is still unknown (53). 2,4-D is an auxin mimic, causing deregulation of the auxin signalling pathway (54). Gemmae from Tak-1, Tak-2, Mprtn4ip1lGE118, and Mprtn4ip1lGE149 were grown on solid medium supplemented with different doses of isoxaben (Fig 6E), dichlobenil (Fig 6F), or 2,4-D (Fig 6G). After 10 days of growth, the area of living tissue was quantified, and dose-response curves were fitted using the four-parameter log-logistic equation. IC50, LD100, and RI for wild type and Mprtn4ip1l mutant lines were calculated from the resulting dose-response curves (Fig 6E, 6F, and 6G).
Mprtn4ip1l mutant lines were resistant to isoxaben, Mprtn4ip1lGE118 with an RI of 4.22 ± 8.96 and Mprtn4ip1lGE149 with an RI of 3.94 ± 6.01. Although these RI values are not statistically significant, the LD100 of both Mprtn4ip1l mutant lines was higher than wild type; both were alive when grown on 20 µM isoxaben which is lethal to Tak-1 and Tak-2 (Fig 6E). These data demonstrate that Mprtn4ip1lGE118 and Mprtn4ip1lGE149 are resistant to isoxaben. The cross resistance of Mprtn4ip1l mutants to isoxaben is consistent with the hypothesis that loss of MpRTN4IP1L function confers non-target site resistance.
Mprtn4ip1l mutant lines were not resistant to dichlobenil or 2,4-D. The RI values of Mprtn4ip1lGE118 and Mprtn4ip1lGE149 on dichlobenil are not statistically significant, and neither mutant can survive at a higher concentration of dichlobenil than wild type (Fig 6F). Mprtn4ip1lGE118 has an RI value of 0.33 ± 0.20 on 2,4-D so is significantly 2,4-D sensitive, while the RI of Mprtn4ip1lGE149on 2,4-D is not statistically significant. Neither Mprtn4ip1l mutant has a higher LD100 than wild type on 2,4-D (Fig 6G). Mprtn4ip1l lines are therefore not cross resistant to dichlobenil or 2,4-D.
Taken together, the weak thaxtomin A resistance and isoxaben cross resistance of Mprtn4ip1l mutants demonstrate that loss-of-function of MpRTN4IP1L is likely to confer non-target site resistance. Non-target site resistance is often caused by chemical modification of a herbicide to a non-toxic product, or by reduced herbicide uptake (1, 5). Non-target site resistance to thaxtomin A in Mprtn4ip1l mutants could be caused by a change in herbicide metabolism or uptake that result from elevated ROS levels in Mprtn4ip1l mutants caused by defective CoQ synthesis.
Mprtn4ip1l mutants are defective in thaxtomin A metabolism
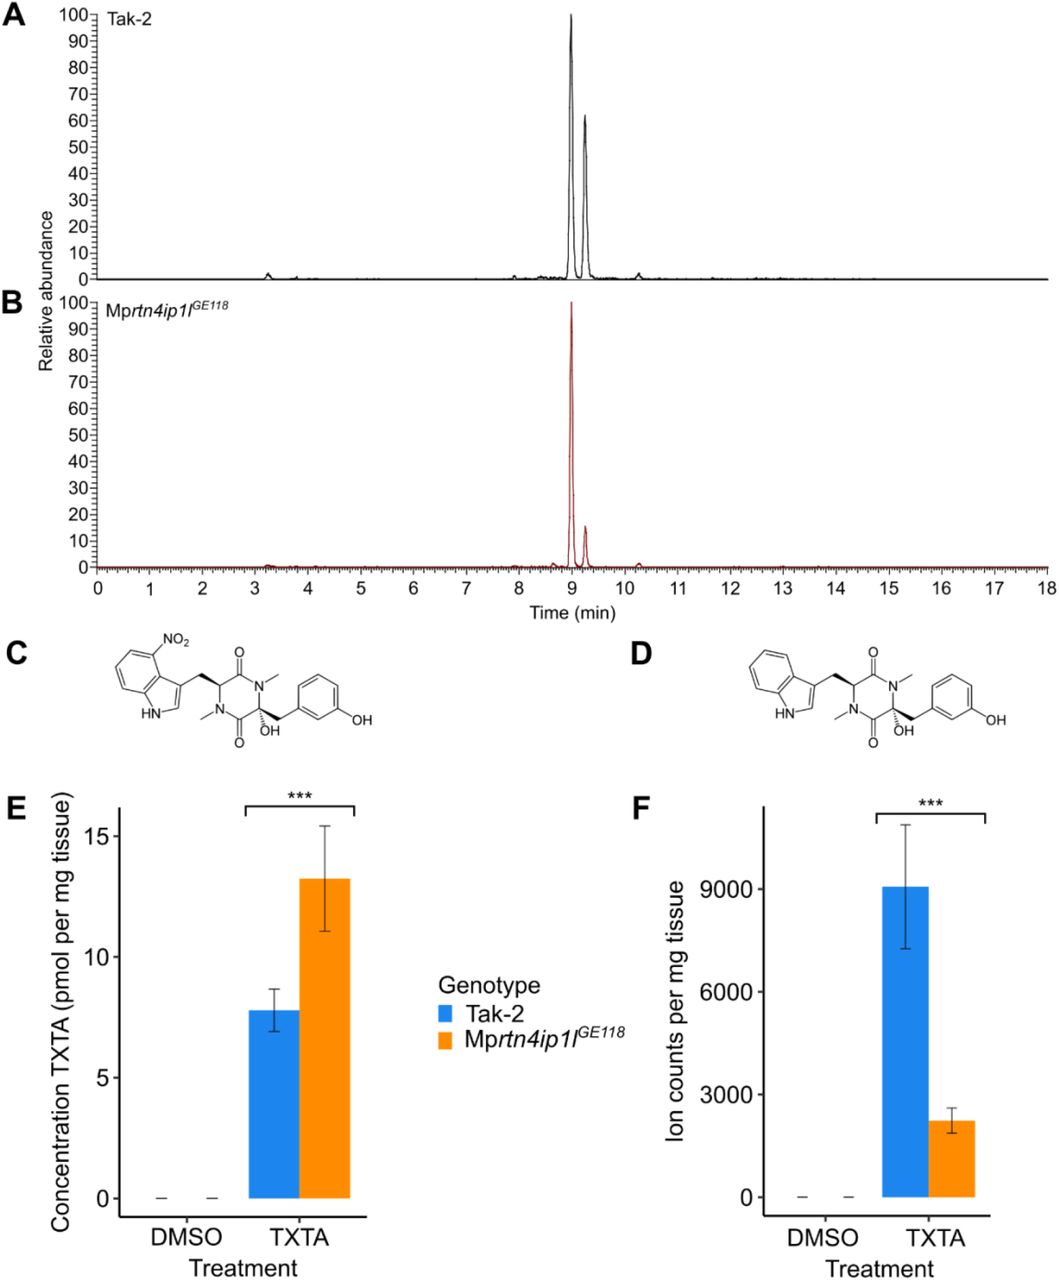
We set out to test the hypothesis that non-target site resistance in Mprtn4ip1l mutants results from differences in the metabolism or uptake of thaxtomin A between wild type and mutants. To test this hypothesis, thaxtomin A and putative thaxtomin A metabolites in thaxtomin A-treated samples of Tak-2 wild type and Mprtn4ip1lGE118 mutants were detected via a precursor ion analysis for the two most abundant fragment ions of thaxtomin A using LC/MS-MS (Fig 7A and 7B). There is a peak of pure thaxtomin A (retention time – RT – 8.99 min) and a peak of an unknown compound (RT 9.25 min) in the chromatogram of wild type Tak-2 (Fig 7A). Both peaks are absent in the analysis of the untreated samples (S7A Fig). The two prominent fragment ions of thaxtomin A are present in the MS/MS spectra of the unknown compound, suggesting that it is a thaxtomin A derivative (S7B and S7C Fig). The molecular mass of the unknown compound is 45 Da less than pure thaxtomin A. An explanation for these observations is that the unknown compound is a derivative of thaxtomin A that lacks the NO2 group (delta mass of 45 Da) (Fig 7C and 7D). This suggests that wild type M. polymorpha metabolizes thaxtomin A by removing the NO2 group of the 4-nitro-tryptophan moiety. These two peaks are present in the chromatogram from Mprtn4ip1lGE149. However, the RT 9.25 peak is considerably smaller in Mprtn4ip1lGE149 than wild type (Fig 7B). This suggests that Mprtn4ip1l mutants accumulate less of the derivative and are therefore defective in thaxtomin A metabolism.

A and B: LC-MS/MS analysis of thaxtomin A and its putative metabolite in Tak-2 (A) and Mprtn4ip1lGE118 (B) extracts. Gemmae from each line were grown on solid medium supplemented with 0.1 % DMSO for 14 days, then transferred to solid 1 medium supplemented with 5 μM thaxtomin A and grown for 2 days. Cellular fractions were extracted from thaxtomin A-treated samples and a precursor ion analysis was conducted via LC-MS/MS (n = 6). Chromatograms of the total ion currents of precursor ion scanning for m/z 247.1 are depicted. The peak eluting at a retention time of 8.99 min. is thaxtomin A (m/z 439.1), the peak eluting at a retention time of 9.25 (m/z 394.1) is its putative metabolite. C: Molecular structure of thaxtomin A D: Molecular structure of putative thaxtomin A metabolite E: Concentration of pure thaxtomin A (TXTA) in DMSO and herbicide-treated samples of Tak-2 and Mprtn4ip1lGE118 as quantified by targeted LC/MS-MS. F: Ion counts (normalised by weight) of the putative thaxtomin A metabolite in DMSO and herbicide-treated samples of Tak-2 and Mprtn4ip1lGE118 as quantified by targeted LC-MS/MS.
To quantify the potential defect in thaxtomin A metabolism in Mprtn4ip1l mutants, we measured the relative amounts of thaxtomin A (RT 8.99) and the putative thaxtomin A derivative (RT 9.25 min) in wild type and mutant plants using targeted LC-MS/MS employing selected reaction monitoring (Fig 7E and 7F). The concentration of thaxtomin A is significantly higher in Mprtn4ip1lGE118 than in Tak-2 (p < 0.05) (Fig 7E). This is consistent with the hypothesis that the chemical modification of thaxtomin A is defective in the mutants (Fig 7E). Furthermore, this is inconsistent with the hypothesis that Mprtn4ip1l mutants uptake less thaxtomin A than wild type plants, suggesting that their resistance is not conferred by reduced herbicide uptake.
The ion counts of the putative thaxtomin A derivative (RT 9.25) are significantly lower in Mprtn4ip1lGE118 than in Tak-2 (p < 0.05), consistent with the hypothesis that the chemical modification of thaxtomin A is defective in the mutants (Fig 7F). Although the difference in the concentration of thaxtomin A between the samples cannot be directly compared to the difference in ion counts of the unknown compound, these data suggest that wild type plants metabolize thaxtomin A to form a derivative compound, but this metabolism is defective in Mprtn4ip1l mutants. Given that Mprtn4ip1l mutants are resistant to thaxtomin A, this is consistent with the hypothesis that thaxtomin A metabolism has a toxic effect on the plant.
To independently verify that the metabolism of thaxtomin A is defective in Mprtn4ip1l mutants, the presence of thaxtomin A and its putative metabolite were also detected via precursor ion analysis in Tak-1 wild type and Mprtn4ip1lGE149 mutants. The peak corresponding to the putative metabolite was stronger in Tak-1 than in Mprtn4ip1GE149, supporting the hypothesis that thaxtomin A metabolism is defective in Mprtn4ip1 mutants (S7D Fig).
Together these data indicate that a thaxtomin A derivative that accumulates in wild type plants accumulates at much lower levels in the resistant Mprtn4ip1l mutants. It is hypothesized that the metabolism of thaxtomin A is toxic to plants. According to this hypothesis, Mprtn4ip1l mutants are resistant to thaxtomin A because they are defective in thaxtomin A metabolism. The high levels of ROS produced in Mprtn4ip1l mutants because of low levels of CoQ may inhibit the metabolism of thaxtomin A.
DISCUSSION
We report the discovery of a novel mechanism of non-target site resistance caused by loss-of-function mutations in the MpRTN4IP1L gene using a forward genetic screen. We demonstrate that Mprtn4ip1l mutants are not only resistant to thaxtomin A and isoxaben, but are also defective in thaxtomin A metabolism. Our findings demonstrate the potential of our approach to identify novel mutations conferring non-target site herbicide resistance which have been difficult to identify and characterize to date.
We propose that resistance to thaxtomin A in Mprtn4ip1l mutants is the result of defective metabolism of the herbicide. Loss of MpRTN4IP1L function may directly or indirectly cause the defect in thaxtomin A metabolism. One hypothesis is that the chemically modified thaxtomin A derivative is herbicidally active (bioactive) whereas unmodified thaxtomin A is not toxic. Decreased thaxtomin A metabolism in Mprtn4ip1l mutants would therefore prevent the production of bioactive molecules, leading to thaxtomin A resistance. The difference in molecular mass between thaxtomin A and its derivative is 45 Da suggesting that the derivative lacks an -NO2 group. If true, it is consistent with the hypothesis that denitration of thaxtomin A produces the bioactive form of the herbicide. However, it has been suggested that the nitro group of thaxtomin A is required for phytotoxicity (20), and other nitroaromatic compounds are known for their toxicity (55, 56), consistent with the hypothesis that unmodified thaxtomin A is toxic. An alternative hypothesis is that the metabolism of thaxtomin A results in the formation of toxic by-products. The reduction of nitro groups in nitroaromatic compounds produces toxic nitrogen-containing radicals (57). Therefore, if the removal of the nitro group during metabolism involves its reduction, toxic nitro radicals could be formed. The nitro group may alternatively react to form other nitro group-containing toxic compounds. According to this hypothesis, the decreased thaxtomin A metabolism in Mprtn4ip1l mutants would lead to decreased levels of toxic by-products, and therefore resistance to thaxtomin A. These two alternative mechanisms could explain the thaxtomin A resistance observed in Mprtn4ip1l mutants. Further analysis of the chemical structure, toxicity, and production in planta of the putative thaxtomin A metabolite are necessary to elucidate its potential role in thaxtomin A toxicity.
Mprtn4ip1l mutants are defective in the biosynthesis of coenzyme Q, an electron transporter in oxidative phosphorylation. Consequently, mutants produce more ROS than wild type plants. ROS are highly reactive, oxygen-containing radicals with one or more unpaired electrons. High levels of ROS cause peroxidation of cell membrane lipids leading to cell death (58, 59). Several herbicides such as paraquat or glufosinate kill plants by inducing ROS overproduction (59–61). However, at lower concentrations, ROS contribute to plant defenses, both by causing physiological changes such as cell wall strengthening, or by acting as signaling molecules (62–65). ROS pretreatment confers resistance to thaxtomin A in A. thaliana (49). The higher ROS levels of Mprtn4ip1l mutants could therefore contribute to non-target site resistance to thaxtomin A. One hypothesis is that increased ROS levels inhibit the metabolism of thaxtomin A in Mprtn4ip1l mutants leading to decreased production of toxic by-products.
Cross resistance with isoxaben suggests that resistance conferred by the Mprtn4ip1l mutations constitutes non-target site resistance. However, Mprtn4ip1l mutants are not resistant to dichlobenil. Thaxtomin A, isoxaben, and dichlobenil are cellulose biosynthesis inhibitors. Based on their effects on the movement and presence of cellulose synthase enzymes at the plasma membrane, thaxtomin A and isoxaben are classed as group 1 cellulose biosynthesis inhibitors and dichlobenil is classed as group 2 (28). ROS can increase the rigidity of the cell wall, which may hinder the effect of cellulose biosynthesis inhibitors (49, 62). An alternative hypothesis to explain the contribution ROS to resistance in Mprtn4ip1l mutants – which takes into account their cross resistance pattern – is that the increased ROS levels alter the cell wall in a way which confers resistance to group 1 but not group 2 cellulose biosynthesis inhibitors.
The mechanism of non-target site resistance reported here is also likely to operate in angiosperm weeds and not be restricted to M. polymorpha or other liverworts. First, the RTN4IP1L gene is found throughout the angiosperms and therefore agricultural weeds, where mutation would likely result in weak resistance. Second, our data indicate that loss-of-function mutations in the PAM16 gene confer weak thaxtomin A resistance in both M. polymorpha and A. thaliana (18). Therefore, non-target site resistance caused by loss of PAM16 function in M. polymorpha also operates in angiosperms. Furthermore, we report that four chlorsulfuron-resistant M. polymorpha UV-B mutants carry Pro197Ser or Pro197Leu mutations, which are among the most frequently reported mechanisms of chlorsulfuron resistance observed in chlorsulfuron-resistant angiosperm weeds (2, 50, 51). Together, these data demonstrate that at least some herbicide resistance mechanisms are conserved between M. polymorpha and angiosperms, validating the use of M. polymorpha as a model with which to identify novel mechanisms of non-target site resistance which could evolve in weeds.
Mprtn4ip1l mutants are smaller than wild type plants in control conditions, suggesting that loss of MpRTN4IP1L function would incur a considerable fitness cost in the wild. Given this, the evolution of Mprtn4ip1l loss-of-function based resistance in the field is uncertain. However, some alleles conferring herbicide resistance – both target site and non-target site – incur a fitness cost but are nevertheless maintained in weed populations due to the intense selection imposed by herbicide treatment (66–69). We propose that loss-of-function of RTN4IP1L, or mutations which affect the same molecular processes, could therefore evolve in weed populations treated with thaxtomin A. If loss-of-function of RTN4IP1L is identified in resistant weeds in the field, our findings can inform weed management practices. Based on our characterization of phenotypes of Mprtn4ip1l loss-of-function mutants, weeds with RTN4IP1L loss-of-function mutations cannot be controlled by isoxaben. However, our data suggest that weeds that evolve thaxtomin A resistance through loss-of-function mutations in the RTN4IP1L genes, or through the overproduction of ROS, would be hypersensitive to herbicides which kill plants by ROS overproduction such as paraquat or glufosinate (59–61). We conclude that our methodology can uncover novel mechanisms of non-target site resistance caused by loss-of-function mutations which allows for more informed and efficient weed management in practice.
MATERIALS AND METHODS
Plant lines and growth conditions
Wild-type plants were M. polymorpha laboratory accessions Takaragaike-1 (Tak-1) and Takaragaike-2 (Tak-2) (70). Mppam16 and Mprtn4ip1l lines were generated via CRISPR-Cas9 mutagenesis of wild-type M. polymorpha spores (from a cross between Tak-1 and Tak-2). All lines were maintained via asexual propagation of gemmae or thallus excision in the case of mutants which did not produce gemmae. Plants were grown on solid ½ Gamborg medium. All plant material used for experiments was grown in a growth chamber at 23 °C under 24-hour 10-30 µmol m-2 s-1 white light. Plant material to be stored long-term was kept in a growth chamber at 17 °C under 6 hours 10-30 µmol m-2 s-1 white light and 18 hours dark. To produce spores, plants were grown on a mixture of John Innes n. 2 compost and fine vermiculite at a ratio of 2:1. Plants were grown in growth chambers at 23 °C and under 16 hours white light and continuous far-red light to induce transition to the reproductive phase. Once mature, water was pipetted onto the antheridia produced by male plants to collect sperm, then transferred to archegonia produced by female plants. Sporangia were harvested before bursting and stored fresh at 4 °C in sterile dH2O.
Fresh spore sterilization
Fresh sporangia were sterilized with 1 % NaDCC (sodium dichloroisocyanurate) for 4 minutes followed by rinsing with sterile dH2O.
Chemicals and stock solution preparation
Thaxtomin A (TXTA) (SML1456), dichlobenil (45431), isoxaben (36138), chlorsulfuron (34322), 2,4-dichlorophenoxyacetic acid (2,4-D) (31518), were obtained from Sigma-Aldrich. Stock solutions were prepared by dissolving in pure dimethyl sulfoxide (DMSO) (D8418) from Sigma-Aldrich.
Gemmaling dose-response assays
Gemmae were grown on solid ½ Gamborg medium supplemented with different concentrations of herbicide dissolved in DMSO. Gemmalings were imaged using a Berthold Nightowl II LB 983 In Vivo Imaging System (Berthold, Bad Wildbad, Germany). Images were taken after exposing gemmalings to 120 s white light. The imaging system detects chlorophyll autofluorescence (560 nm). The lateral area of autofluorescing (living) tissue was determined using the indiGo™ software package (Berthold, Bad Wildbad, Germany). Dose-response curves were generated using the ggplot2 and drc packages in R (71, 72); the four-parameter log-logistic equation with a fixed lower limit of 0 was used to fit a dose-response curve to the data.
Phylogenetic analysis of PAM16 and RTN4IP1 homologues
Homologues of the A. thaliana At3G59280 protein or of the H. sapiens RTN4IP1.1 protein were identified by protein BLAST search against the reference proteomes of various species (35). Only homologues with an E value less than 1E-5 were used to construct the trees. Homologues were aligned via the L-INS-i strategy using MAFFT version 7 (37). The alignments were manually trimmed using BioEdit7.2. A maximum likelihood tree was constructed with PhyML 3.0 using an estimated gamma distribution parameter and the LG model of amino acid substitution (36). A non-parametric approximate likelihood ratio test based on a Shimodaira-Hasegawa-like procedure was used to calculate branch support values using PhyML 3.0 (36). The trees were visualized in FigTree v1.4.4 and rooted with the respective Saccharomyces cerevisiae homologues (PAM16 or Yim1p).
CRISPR-Cas9 mutagenesis
CRISPR-Cas9 mutants were generated based on the protocols described in (73) and (74). Guide RNAs (sgRNAs) annealing to different parts of the genes MpPAM16 (Mp3g09390) or MpRTN4IP1L (Mp3g19030) were designed to be 5’ of an “NGG” site (PAM sequence) as required by the CRISPR-Cas9 system (73). Guide RNAs were cloned into the pHB453 or pMpGE_En03 constructs (74) to generate the entry vectors using primers “sgRNA” (Table 3). The expression vectors were generated by LR reaction of the destination vector pMpGE010 and the entry vectors. Vectors were transformed into Escherichia coli One Shot OmniMAX 2 T1R (Thermo Fisher Scientific: Cat. # C854003).
The expression vectors were transformed into Agrobacterium tumefaciens strain GV3101. Wild-type M. polymorpha spores from a cross between Tak-1 and Tak-2 accessions were transformed as per the protocol in (75). Transformants were selected by growth on solid ½ Gamborg medium supplemented with 10 mg/l hygromycin B (Melford: CAS# 31282-04-9) to select for plants with the CRISPR-Cas9 construct insertion, and 100 mg/l cefotaxime (Melford: CAS# 64485-93-4) to kill any remaining A. tumefaciens.
To identify potential mutations in the MpPAM16 or MpRTN4IP1L genes, genomic regions including the loci targeted by the guide RNAs were amplified by PCR and Sanger sequenced using primers “PAM16_G” or “RTN4IP1L_G” (Table 3). Sanger sequencing of the purified PCR products was conducted by Source BioScience or by the Molecular Biology service at Vienna BioCenter Core Facilities (VBCF), member of the Vienna BioCenter (VBC), Austria. Mutants were named according to the gene mutated (Mppam16 or Mprtn4ip1l), followed by “GE” (gene edited), the number of the guide RNA targeting the locus in which the mutation is found, and the number transformant that was genotyped (e.g. Mprtn4ip1lGE149– a gene edited transformant with a mutation in the RTN4IP1L gene at the locus targeted by sgRNA 1 which was the 49th transformant genotyped).
Generation of herbicide-resistant M. polymorpha lines via UV-B mutagenesis
Spores were mutagenized according to the protocol in (39). Sterilised fresh wild type M. polymorpha spores were plated on solid modified Johnson’s medium supplemented with thaxtomin A (5 µM – LD100) or chlorsulfuron (140 nM – 4 x LD100). The spores were exposed to UV-B irradiation (302 nm) for an exposure time corresponding to or near the LD50 (an exposure time of UV-B at which 50 % of spores are killed – S2 Fig) using a UVP BioDoc-It™. Plates of mutagenized spores were wrapped in aluminium foil and left in the dark overnight. Plates were then unwrapped and placed in a Sanyo growth chamber at 23 °C in 24-hour light. After 14 days of growth, plates were screened for surviving sporelings. Surviving sporelings were transferred to solid modified Johnson’s medium supplemented with fresh herbicide. Plants which survived this second transfer onto a lethal dose of herbicide were maintained. To test for retention of resistance through asexual reproduction, gemmae from these plants were plated onto a lethal dose of herbicide. Lines whose resistance was inherited were classified as herbicide resistant lines and maintained. Lines with thaxtomin A resistance were named Mpthar (thaxtomin A resistant).
Chlorsulfuron-resistant lines were tested for target site resistance by PCR amplification and Sanger sequencing of regions of the MpAHAS gene using primers GCS_Fw and GCS_Rv (Table 3). Sanger sequencing of the purified PCR products was carried out by Source BioScience. Lines with target site resistance to chlorsulfuron were named Mpahaschlr (Mpahas chlorsulfuron resistant).
Genomic DNA sequencing
Wild-type (Tak-1, Tak-2, OxTak1F, and OxTak2M) lines and herbicide-resistant lines (Mpthar and Mpahaschlr) were grown on solid ½ Gamborg medium for three weeks on in a growth chamber at 23 °C under 24-hour 10-30 µmol m-2 s-1 white light. After three weeks of growth, plant material was harvested and flash frozen in liquid nitrogen. Samples were ground in liquid nitrogen and genomic DNA was extracted using the Qiagen DNeasy Plant Maxi kit (Cat. # 68163) according to the kit protocol. After elution, the gDNA was cleaned up and concentrated using the Zymo Genomic DNA Clean & Concentrator kit (Cat. # D4010). The gDNA was eluted in nuclease-free water.
The concentration of the gDNA was checked using a Nanodrop™ 1000 spectrophotometer and a Qubit® 2.0 fluorometer according to the instruction manuals. The gDNA quality was checked by running 2 µl DNA (approximately 10 µg µl-1) on a 0.7 % agarose gel at 70 V for 45 minutes and checking for degradation. Genomic DNA samples which had passed quality control checks were sent for sequencing to the Next Generation Sequencing Facility at Vienna BioCenter Core Facilities (VBCF), member of the Vienna BioCenter (VBC), Austria. DNA Libraries were prepared using the Westburg NGS Library Prep kit and fragment size was determined using a BioLabTech Fragment Analyzer™. The DNA was sequenced on an Illumina NovaSeq 6000 SP flowcell using 150 bp paired-end reads.
Non-allelism based SNP discovery pipeline
The “non-allelism based SNP discovery” pipeline from (39) was used with slight adaptations to identify candidate resistance-conferring SNPs in herbicide-resistant lines. Raw reads were trimmed to remove low-quality reads and NEB adaptors using Trimmomatic 0.38 (76). The read coverage was then normalized using khmer 2.1.2 (77). Reads were aligned to the Marchantia polymorpha reference genome (MpTak1 v5.1 plus the female chromosome from v3.1; now known as MpTak v6.1) using bowtie2. Reads were sorted by position and reads from different lanes were merged using samtools 1.10. The variant call analysis was carried out using samtools and bcftools (ploidy defined as haploid, multiallelic/rare variant call option selected) to generate bcf files listing mismatches between the sequencing reads and the reference genome for each line (78). For each bcf file, only mismatches which were supported by 7 – 100 reads and where the number of reads supporting high quality alternative alleles ≥ the number of reads supporting high quality reference alleles were retained (DP4[2]+DP4[3])/sum(DP4)>0.5). Non-canonical UV-B induced mismatches (not C → T or G → A) were filtered out using bcftools. Filtered mismatches were retained only if they were not present in other sequenced non-allelic lines without that phenotype. The resulting lists were filtered to retain only mismatches present in a CDS using bash scripting, then filtered manually in Interactive Genomics Viewer v 2.10 to remove mismatches which did not induce an amino acid change and which were misaligned or poor quality.
SNPs identified in the MpRTN4IP1L gene in Mpthar2, Mpthar4 and Mpthar6 by the pipeline were confirmed by PCR amplification and Sanger sequencing using primers “GRT” (Table 3). Sanger sequencing was carried out by Source BioScience.
Metabolomic analysis of pure and modified thaxtomin A in M. polymorpha thallus
Gemmae were grown on autoclaved cellophane (AA Packaging Limited, Preston, UK) on solid ½ Gamborg medium supplemented with 0.1 % DMSO for 14 days at 23 °C in 24 h light. Gemmalings were then transferred (by transfer of the cellophane disc) onto solid ½ Gamborg medium supplemented with either 0.1 % DMSO or 5 µM thaxtomin A and grown in these conditions for 2 days at 23 °C in 24 h light. Treated and untreated gemmalings were harvested by flash freezing in liquid nitrogen.
For thaxtomin A analysis, frozen tissue samples were ground in liquid nitrogen and homogenized in ice-cold extraction solvent (2:1:1 methanol:acetonitrile:H2O, v/v) for 2 min at 4 °C followed by incubation at -20 °C for one hour. Samples were centrifuged at full speed at 4 °C for 3 mins. Supernatants were collected and kept at -20 °C. Pellets were redissolved in ice cold 80 % (v/v) methanol and homogenized for 1 min at 4 °C followed by incubation at – 20 °C for one hour. Samples were centrifuged at full speed at 4 °C for 3 mins. Supernatants were collected and added to the supernatants from the first extraction step. Samples were incubated at -20 °C for 2 hours. Samples were then centrifuged at full speed at 4 °C for 10 mins. Supernatants were collected and shock frozen in liquid nitrogen. For coenzyme Q10 analysis, a chloroform/methanol extraction from frozen plant tissue was carried out.
Metabolite extracts were analyzed by the Metabolomics Facility at Vienna BioCenter Core Facilities (VBCF), member of the Vienna BioCenter (VBC), Austria and funded by the Austrian Federal Ministry of Education, Science & Research and the City of Vienna. For amino acid analysis, 100 µl of the extracts were dried down in a vacuum centrifuge and resolved in 100 µl of 0.1% formic acid in water. For each sample, 1 µl was injected onto a Kinetex (Phenomenex) C18 column (100 Å, 150 x 2.1 mm) connected with the respective guard column, and employing a 7-minute-long linear gradient from 99% A (1 % acetonitrile, 0.1 % formic acid in water) to 60% B (0.1 % formic acid in acetonitrile) at a flow rate of 80 µl/min. Detection and quantification was done by LC-MS/MS, employing the selected reaction monitoring (SRM) mode of a TSQ Altis mass spectrometer (Thermo Fisher Scientific), using the following transitions in the positive ion mode: 76 m/z to 30 m/z (glycine), 90 m/z to 44 m/z (alanine), 106 m/z to 60 m/z (serine), 116 m/z to 70 m/z (proline), 118 m/z to 72 m/z (valine), 120 m/z to 74 m/z (threonine), 132 m/z to 86 m/z (leucine and isoleucine),133 m/z to 74 m/z (asparagine), 134 m/z to 74 m/z (aspartic acid), 147 m/z to 84 m/z (lysine), 147 m/z to 130 m/z (glutamine), 148 m/z to 84 m/z (glutamic acid), 150 m/z to 133 m/z (methionine), 156 m/z to 110 m/z (histidine), 166 m/z to 133 m/z (phenylalanine), 175 m/z to 70 m/z (arginine), 176 m/z to 159 m/z (citrulline), 182 m/z to 36 m/z (tyrosine), 205 m/z to 188 m/z (tryptophan), 241 m/z to 74 m/z (cystine).
Thaxtomin A was analyzed by using a 4-minute-long linear gradient from 96% A to 90% B, directly analyzing the metabolite extract. Here, the transitions 439.1 m/z to 247.1 m/z and 439.1 m/z to 219.1 m/z were used in the positive ion mode. Quantification was done by external calibration using an authentic standard. The putative thaxtomin A metabolite (without the nitro-functionality) was discovered by analyzing the samples with precursor ion scanning for the dominant fragment ion (m/z 247.1) of thaxtomin A. Here only one compound was evident with a m/z of 394, sharing both dominant fragment ions (m/z 247.1 and m/z 219.1) with thaxtomin A). This metabolite was analyzed in the samples using the transitions 394.1 m/z to 247.1 m/z and 394.1 m/z to 219.1 m/z. Data interpretation was performed using TraceFinder (Thermo Fisher Scientific).
Coenzyme Q10 was analyzed after chloroform/methanol extraction from powdered frozen plant tissue. 100 µl of the lower phase was diluted with 50 µl methanol and 1 µl was directly injected onto a Kinetex (Phenomenex) C8 column (100 Å, 100 x 2.1 mm) and employing a 5-minute-long linear gradient from 90 % A (50 % acetonitrile, 49.9 % water, 0.1% formic acid, 10 mM ammonium formate) to 95% B (10 % acetonitrile 88% isopropanol, 1.9 % water, 0.1% formic acid, 10 mM ammonium formate) at a flow rate of 100 µl/min. Detection and quantification was done by LC-MS/MS, employing the selected reaction monitoring (SRM) mode of a TSQ Altis mass spectrometer (Thermo Fisher Scientific), using the transition 863.8 m/z to 197.1 m/z in the positive ion mode.
DAB staining
3,3’-diaminobenzidine (DAB) (Sigma Aldrich: D8001) was used to prepare a DAB staining solution according to (46). Tak-1, Tak-2, Mprtn4ip1lGE118 and Mprtn4ip1lGE14911-day old plants were incubated in 3 ml solution in 24 well plates and vacuum infiltrated for 5 minutes. The plates were covered in aluminium foil and incubated for 1.5 hours shaking at 100 rpm. After incubation, the staining solution was replaced by bleaching solution prepared according to (46). Plants were bleached for 2 hours. Bleached gemmae were imaged using a Keyence VHX-7000.
Ferric-xylenol orange (FOX) assay
A modified FOX assay was carried out according to the protocol in (48). The FOX working solution was prepared as follows: 500 µM ammonium ferrous sulphate; 400 µM xylenol orange; 200 mM sorbitol; 25 mM H2SO4. Twelve-day old gemmalings of Tak-1, Tak-2, Mprtn4ip1lGE118 and Mprtn4ip1lGE149were frozen and ground in liquid nitrogen and homogenized in 200 mM perchloric acid. Samples were centrifuged at 1000g for 5 minutes at 4 °C. 500 µl of the supernatant were mixed with 500 µl FOX working solution. Samples were incubated at room temperature in the dark for 30 minutes followed by quantification of the absorbance at 560 nm using an Ultrospec 3100 pro spectrophotometer. The concentration of H2O2 in each sample was calculated using a calibration curve of known concentrations of H2O2 quantified using the same protocol.
Media
Modified Johnson’s medium was prepared as described in (75).
½ Gamborg medium:
pH adjusted to 5.5 using 1 M KOH
Footnotes
Competing interests: L. D. and C. C. are co-founders of MoA Technology Ltd.
REFERENCES


