

Abstract
The Iberian ribbed newt (Pleurodeles waltl) constitutes a central model for probing the basis of regeneration. Here, we present the sequencing and chromosome-scale assembly of the 20.3Gb P.waltl genome, which exhibits the highest level of contiguity and completeness among giant genomes. We uncover that DNA transposable elements are the major contributors to its expansion, with hAT transposons comprising a large portion of repeats. Several hATs are actively transcribed and differentially expressed during adult P.waltl limb regeneration, along with domesticated hAT transposons of the ZBED transcription factor family. Despite its size, syntenic relationships are conserved across the genome. As an example we show the high degree of conservation of the regeneration-associated Tig1 locus with several neighbouring genes. Together, the P.waltl genome provides a fundamental resource for the study of regenerative, developmental and evolutionary principles.
Introduction
Uncovering the basis underlying the ability to regenerate organs and entire structures, as manifested in a few exceptional animal species, remains a central goal in regenerative biology. Featuring the widest repertoire of regenerative abilities among vertebrates (Brockes and Kumar, 2008; Joven et al., 2019; Tanaka, 2016; Yun et al., 2021), salamanders constitute ideal models in which to accomplish this aim. While an impressive range of research tools has been developed for salamander species, in particular axolotls and Iberian ribbed newts (Elewa et al., 2017; Hayashi et al., 2013; Joven et al., 2018; Nowoshilow and Tanaka, 2020; Yun et al., 2021), their exploitation has been hampered by a scarcity of genomic resources. This is largely attributed to their enormous genome size (ranging from 14 to 120Gb, Sun et al 2012) and to their substantial enrichment in repetitive sequences, which represent significant hurdles for sequencing, assembly and annotation.
Recent developments in long-read sequencing methods (Wenger et al., 2019), assembly algorithms (Cheng et al., 2021; Nurk et al., 2020) and chromosome conformation capture methods (Hi-C) (Lieberman-Aiden et al., 2009) have enabled the generation of high-quality assemblies for species with giant genomes such as lungfish (c.40Gb, (Meyer et al., 2021; Wang et al., 2021)) and axolotl (c. 32Gb, (Nowoshilow et al., 2018; Schloissnig et al., 2021; Smith et al., 2019)). Comparing axolotl and newts among salamanders has identified key differences in terms of life cycle, regeneration repertoire, regeneration mechanisms, and genome composition (Joven et al, 2019; Yu et al, 2022). Hence it is important to also characterize the newts’ genomes in detail, to reveal the genetic basis of salamander-as well as species-specific mechanisms and innovations. Among newts, Pleurodeles waltl (P. waltl) has emerged as an ideal laboratory model because of its experimental tractability (Hayashi et al., 2013; Joven et al., 2018). Prior attempts to sequence its giant genome resulted in an assembly based on Illumina short-reads (Elewa et al., 2017), providing the first source of genomic information for P. waltl albeit with reduced completeness and contiguity. Here, we leveraged advanced long-read and chromosome conformation capture technologies to generate a highly-contiguous, complete chromosome-scale assembly for the giant genome of the Iberian ribbed newt. Further, we illustrate the applicability of this resource by revealing several attributes of the P. waltl genome of relevance to regeneration research and comparative genomics
Results and discussion
Sequencing, chromosome-scale assembly and annotation of the Pleurodeles waltl genome
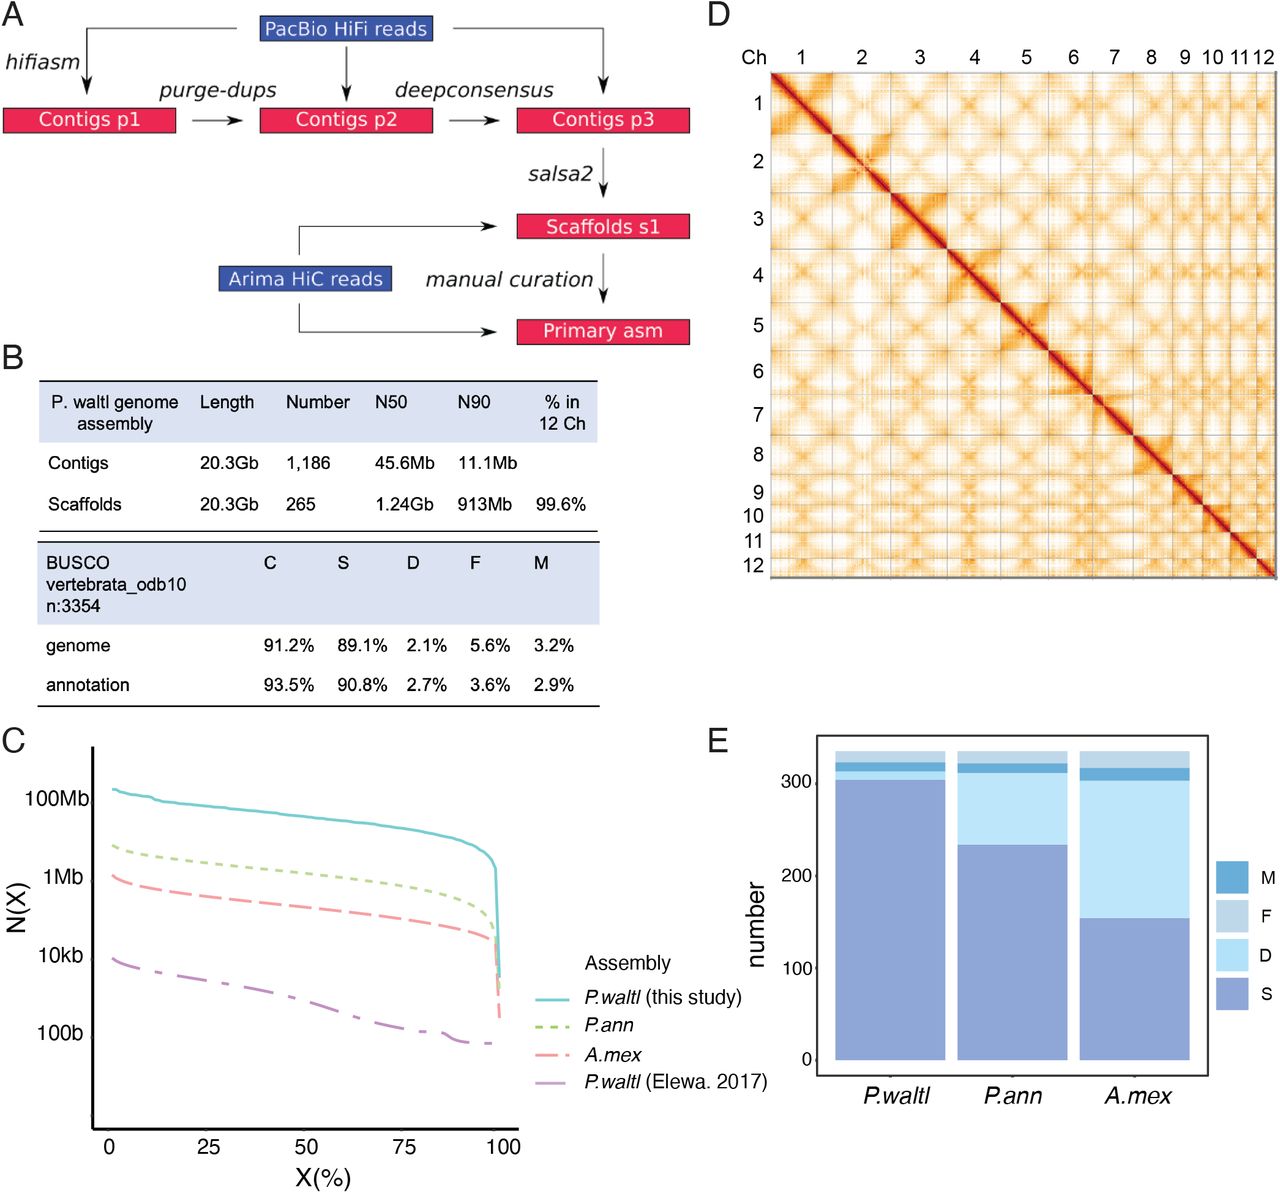
In order to overcome the challenges inherent to sequencing and assembling a giant genome, we took advantage of the highly-accurate Pacific Biosciences (PacBio) HiFi technologies (Fig. 1a). We sequenced genomic DNA from a female P. waltl newt (Suppl. Fig. 1) generating 44,683,779 long-reads, representing 41X genome coverage. We employed HiFiasm (Cheng et al., 2021) and purge-dups (Guan et al., 2020) yielding a 20.3Gb contig assembly of remarkably high contiguity with an N50 of 45.6Mb and N90 of 11.1Mb (Fig. 1b). Indeed, its contiguity is increased by an order of magnitude compared to the Protopterus annectens assembly, based on Oxford nanopore (Wang et al., 2021), two orders of magnitude compared to the Ambystoma mexicanum assembly, based on PacBio RSII reads (Schloissnig et al., 2021), and 4 orders of magnitude compared to the short-read P. waltl assembly (Elewa et al., 2017) (Fig 1c). Kmer-based analysis indicated a level of heterozygosity of 0.39% (Suppl. Data 1).

A) Schematic representation of the sequencing and assembly strategy. B) P. waltl genome assembly features (top) and BUSCO assessment (bottom). C) Contig N(X) plot showing which % of each assembled genome (X) is contained within pieces at least N(X) bp in size. Shown are contig statistics from Pleurodeles waltl (this study and Elewa et al., 2017), Protopterus annectens (Wang et al., 2021) and Ambystoma mexicanum (Schloissnig et al., 2021). D) Hi-C interaction heatmap of contact data for scaffolded genome. Individual scaffolds are delineated. Denser areas of red signal off-diagonal represent interactions between the arms of the same chromosome. E) Gene completeness based on BUSCO single-copy vertebrata orthologs (n=3,354). Scores are based on annotations for Pleurodeles waltl, Protopterus annectens and Ambystoma mexicanum. C: Complete, S: Single copy, D: Duplicated, F: Fragmented, M: Missing.
Next, we set out to generate a high-resolution chromosome-scale assembly based on chromosome conformation capture (Hi-C) Illumina reads. We generated two Arima Hi-C libraries from liver tissue (6 billion read pairs - 1.8Tbp) of the same individual sequenced above (Suppl Fig.1). Following scaffolding with salsa2 (Ghurye et al., 2019) and manual curation (Fig. 1a, 1d, Suppl Fig.2), we obtained a chromosome-level assembly with a scaffold N50 of 1.24Gb (chromosomes 1-4 are in two parts due to technical limitations of standard tools in processing scaffolds larger than 2Gb) in which 99.6% of the contigs could be assigned to the 12 chromosomes (Fig. 1b). The percentage of chromosome incorporation of contigs is on a par with the highest among all reported giant genomes at 99.6% (Wang et al., 2021). Of note, the number and length of the chromosomes is in agreement with the reported P. waltl karyotype (Elewa et al., 2017). At the structural level, Hi-C contact analysis (Fig. 1d) indicates the existence of two inversions between the two haplotypes of the sequenced individual, one within the central region of chromosome 2 (Suppl. Fig. 3, Suppl. Data 2) and another one in chromosome 5 (Suppl. Fig. 4, Suppl. Data 3), the significance of which should be determined by subsequent research.
To facilitate the annotation of genomic loci we took advantage of the PacBio Iso-seq platform, and generated full-length mRNA sequences for brain (1Gb, (Woych et al., 2022)) and spleen (0.86Gb) of the same newt used for sequencing. These were combined with PacBio Iso-seq data from adult limb blastema (1.76Gb), de-novo transcriptomes from (Elewa et al., 2017) and (Matsunami et al., 2019), and Augustus predictions. We identified a total of 23,375 conserved protein coding genes in our assembly, comprising 93.5% of vertebrate single-copy orthologs based on BUSCO analysis, with only 2.9% missing (Fig 1b). Gene completeness analysis based on BUSCO single-copy orthologs within vertebrata confirmed the high completeness of the P.waltl assembly in comparison to other giant genomes (Fig. 1e). Further, we found that P. waltl has a similar number of protein-coding genes compared to other vertebrates, indicating that whole-genome duplication events are not responsible for the expansion of the P. waltl genome.
Transposable elements underlie Pleurodeles waltl genome expansion
Proliferation of transposable elements (TE) has emerged as a chief mechanism underlying the expansion of giant genomes, as observed in lungfish and axolotl (Meyer et al., 2021; Nowoshilow et al., 2018; Wang et al., 2021). Indeed, expansion of Gypsy retrotransposons and DNA Harbinger TEs were proposed to account for two thirds of the repetitive content based on the short-read P. waltl assembly (Elewa et al., 2017). We therefore performed repeat masking of our highly complete genome assembly, uncovering that 74% of the genome (corresponding to 15Gb) is made up of repetitive elements (Fig. 2a). Repeat content is higher than that of the giant axolotl genome based on our analysis (68%, Fig. 2a), and that previously reported (Schloissnig et al., 2021). This may be attributable to either a higher retention of transposable elements within the Iberian newt genome, or the higher contiguity and completeness of its assembly. Further, the percentage of repetitive sequences in the Iberian ribbed newt genome is comparable to that of lungfish (Meyer et al., 2021; Wang et al., 2021), which exhibits the highest repetitive content found in the animal kingdom. Unlike in the axolotl, where long terminal repeat (LTR) transposable elements are dominant (45% of repeats, 8.7Gb), the DNA repeat class is the major contributor (51% of repeats, 7.6Gb) to the P. waltl genome (Fig. 2a). In depth analysis of the genomic contributions of each repeat superfamily (Fig. 2b) revealed that Gypsy (19.7% of repeats, 3Gb) and Harbinger (19.6% of repeats, 2.9Gb) elements are among the most represented superfamilies, as previously suggested (Elewa et al., 2017). Notably, it also uncovered a large contribution of DNA/hAT (hobo-Ac-Tam3) transposable elements (15% of repeats, 2.3Gb) to the P. waltl genome. Among the predominant DNA/hAT elements, the non-autonomous Miniature Inverted Repeat Transposable Element (MITE) and nMITE types make up 15% of all repeats in the assembly (Fig. 2c).

A) Pie charts showing the contribution of the main repeat element (RE) classes to each of the indicated genomes. Note the abundance of DNA repeat elements in P. waltl. B) Contribution of repeat element superfamilies to each indicated genome. C) Relative contribution of hAT families to the total RE repertoire of the P. waltl genome, expressed as percentage of all RE based on sequence length. D) Expression of indicated hAT elements in PacBio Iso-seq-derived transcriptomes from P. waltl limb blastema, brain and spleen. E) Differential expression of hATs (left) as well as domesticated hATs (ZBED1, ZBED4, ZBED6, ZBED8) and corresponding isoforms (right) during limb regeneration in P. waltl, based on normalised and centered RNAseq counts for the indicated conditions. Only genes whose differential expression is significantly altered (between 0 and 3dpa, or 0 and 7dpa) are depicted. Colour key represents Z-score values.
With regards to both repeat element class and superfamily contributions (Fig. 2a, 2b), significant differences arise among representative vertebrate genomes, even between the Iberian newt and the axolotl, indicating that independent mechanisms drive genome expansion in each organism. To gain insights into the expansion history of transposable elements in the P. waltl genome, we performed Kimura distance analysis, whereby the number of substitutions to the consensus sequence of each element is used to estimate its relative age (Suppl Fig. 5). Results highlight differential expansion kinetics between the main transposable element types (Suppl Fig. 5A,B), with DNA/hAT and Harbinger elements having undergone one wave of expansion with overlapping periods, and LTR/Gypsy elements exhibiting a longer period of basal activity, including a very recent, extended wave of expansion (Suppl. Fig. 5). Thus, the P. waltl genome has sustained several waves of TE-driven expansion.
Bursts of transposition are key regulators of the genome landscape. For example, DNA/hAT elements are distributed primarily within intergenic regions (76%, Suppl. Fig. 6) yet they are also found in exons (0.07%), contributing to the exapted or ‘domesticated hAT’ gene category, and are abundant among introns (23.85%). Of note, transposable element contributions have resulted in an increase in intron dimensions in P. waltl (Suppl. Fig. 7), leading to a median (6,312 bp), mean (18,237bp) and maximum (4.3Mb) intron size several orders of magnitude greater than in frogs, mice and humans (Nowoshilow et al., 2018). Intergenic regions also displayed a significant expansion, with a median of 50 kb and a mean of 117 kb. In contrast, P. waltl exon dimensions (median: 146bp; mean: 312bp; maximum: 15kb) are comparable to other vertebrates. These data show that transpositions shape gene structure and may impact gene function in P. waltl.
DNA/hAT and domesticated hAT expression during Pleurodeles waltl limb regeneration
The significant expansion of DNA/hAT elements prompted us to probe whether these were being expressed. Mining of the PacBio Iso-seq transcriptomes from P. waltl adult limb blastema, brain and spleen (Fig. 2d) indicate that all hAT types are expressed in these tissues, albeit to a different degree. Notably, these include several hATs longer than 2000bp, thus likely to contain full transposition elements (Suppl. Fig. 8).
We further observed that the diversity of expressed hAT elements (Suppl. Fig. 8) and number of transcribed copies (Suppl. Fig. 9) is higher in limb blastema than in the other tissues examined. Thus, we went on to probe available RNAseq datasets of P. waltl limb regeneration stages (Elewa et al., 2017). Differential expression analysis uncovered dynamic transcriptional changes in several Tip100, Charlie, MITE and Ac hATs during limb regeneration (Fig. 2e, Suppl. Data 4), both after wounding (3 days post-amputation (dpa)) and at early blastema formation stages (7dpa). Further, we found that isoforms of various ZBED (zinc finger BED-type) gene family members, which derive from hAT transposons following a ‘domestication’ event (Etchegaray et al., 2021), are differentially upregulated during limb regeneration (Fig. 2e, Suppl. Data 5). These include ZBED6, a transcription factor involved in muscle development (Markljung et al., 2009), ZBED1, a putative transcriptional regulator of cell proliferation and ribosomal gene expression (Yamashita et al., 2007), and ZBED4, a retina-associated factor (Saghizadeh et al., 2009), isoforms of which are found significantly upregulated during blastema formation. The latter is of particular interest in light of a previous report of ZBED4 upregulation in lungfish tail blastemas (Verissimo et al., 2020). A number of ZBED isoforms are also differentially expressed across additional P. waltl tissues, including in the germline (Suppl. Fig. 10). The existence of several isoforms for each ZBED gene is worthy of note, as they may be indicative of recent transposition events. Collectively, these data show that, unlike in other vertebrate genomes (Lander et al., 2001; Mouse Genome Sequencing Consortium et al., 2002), hATs are actively transcribed and thus may continue to shape the P. waltl genomic landscape. Further, they suggest a potential functional involvement of hATs and domesticated hATs in limb regeneration, an avenue for further exploration.
Synteny conservation
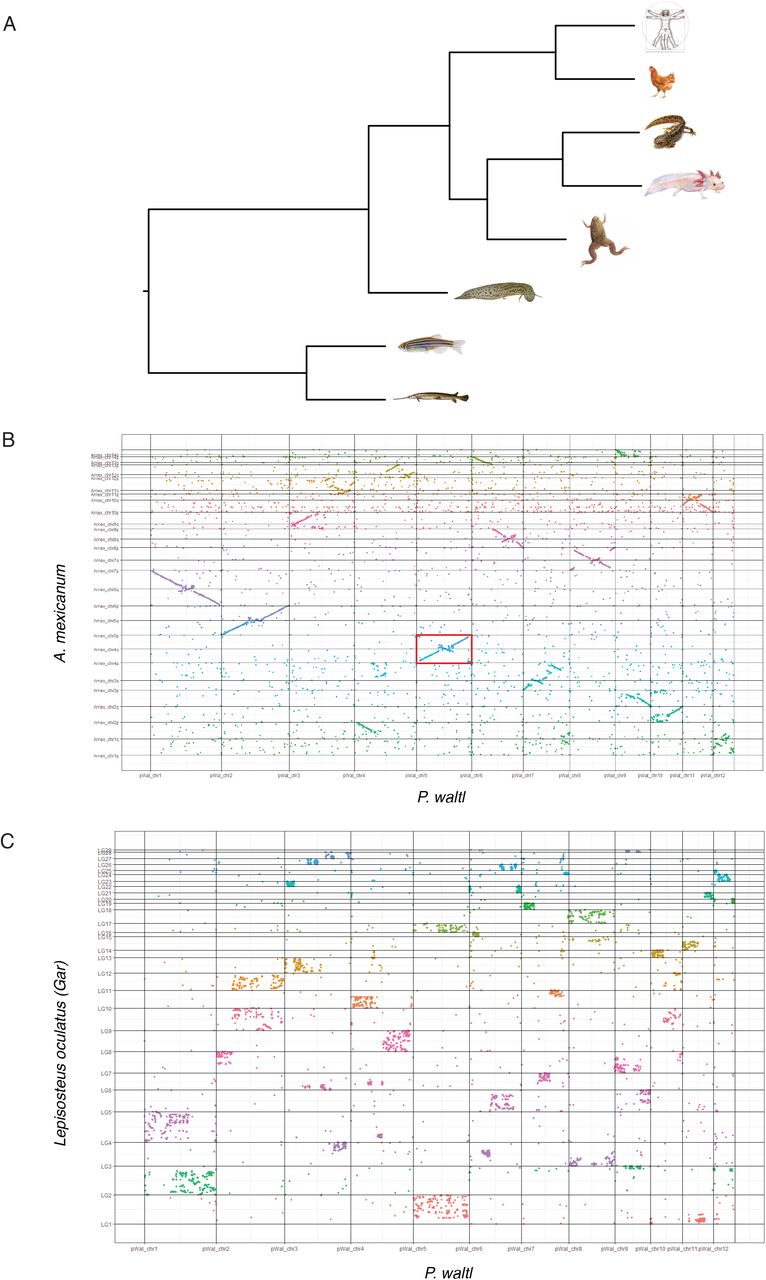
The gigantic TE-dependent expansion observed in the P. waltl genome could have led to the disruption of syntenic relationships between P. waltl and vertebrate orthologues. To address this, we first performed macrosynteny comparisons of 1:1 orthologous genes between P. waltl and representative jawed vertebrates (phylogenetic relationship shown in Fig. 3a). Our analysis revealed a high level of syntenic conservation based on 6,434 1:1 orthologues between the Iberian ribbed newt and the axolotl assemblies (Fig. 3b) as well as the local organisation of 11,925 orthologues found in the Gar genome (Fig. 3c), identifying homologous chromosomal tracts between species. Conservation of macrosyntenic correspondence is observed for additional regenerative organisms such as Xenopus (Suppl. Fig. 11) and lungfish (Suppl. Fig. 12), as well as for human (Suppl. Fig. 13). Of note, the analysis of syntenic boundaries between P. waltl and axolotl as well as Xenopus provide independent evidence for the aforementioned inversion of chromosome 5 in one haplotype, indicated by the Hi-C data (Suppl. Fig. 4, 11). Altogether, this analysis provides further proof of the quality of our chromosome-scale assembly, and offers insights into its macrosyntenic conservation.

A) Phylogenetic relationships between the indicated species constructed using the maximum-pseudolikelihood coalescent method MP-EST, based on one-to-one orthologues identified through blastp between Pleurodeles waltl and Ambystoma mexicanum, Xenopus tropicalis, Lepisosteus oculatus, Danio rerio, Protopterus annectens, Homo sapiens and Gallus gallus. Vitruvian man: © A. Prahlad. B) Oxford plot of macrosyntenic relationships between P. waltl and A. mexicanum chromosomes. Coloured dots indicate relative chromosomal arrangement of newt-axolotl orthologues. Inversion of P. waltl chromosome 5 is indicated by the red rectangle. C) Oxford plot depicting macrosyntenic relationships between P. waltl and Gar (L. oculatus) orthologues. LG: linkage group, chr: chromosome.
To probe synteny conservation at the gene loci level, we next centered on the Tig1/Rarres1 locus (Fig. 4a, see also Suppl. Data 6 for a general pipeline for microsynteny analysis), recently implicated in the regulation of proximo-distal identity during salamander limb regeneration (Oliveira et al., 2022). Despite clear variations in gene size, we uncovered a remarkable conservation of loci organisation, with the presence of Tig1 neighbours Schip1 and Mfsd1 at one end, and of Gfm1, Mlf1 and Shox2 at the other end of the Tig1 locus, a structure that is recapitulated across representative vertebrate genomes (Fig. 4a).
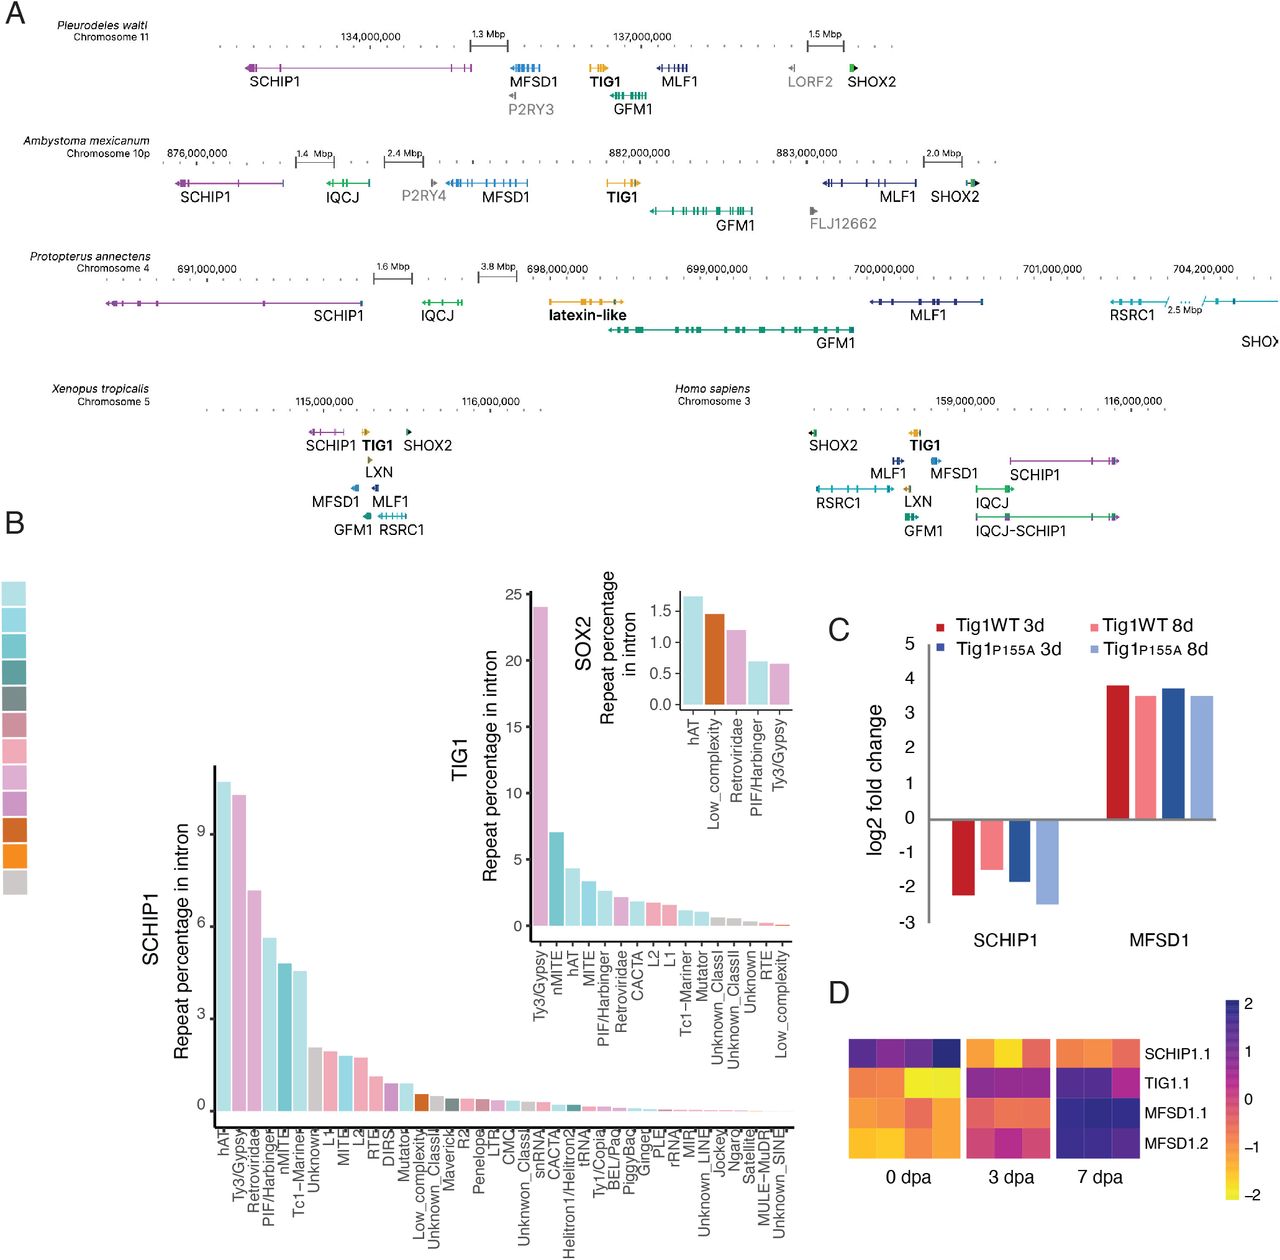
A) Analysis of genomic location and structure of genes associated with the Tig1 locus in the indicated tetrapod species. Genes are indicated in colour. Arrowheads indicate reading frame direction. Perpendicular bars within genes represent exons. Note the increase in intron size for all genes associated with the Tig1 locus in P. waltl compared to X. laevis and H. sapiens. Variation in intron length among species with giant genomes is indicative of independent intron expansion. B) Relative contribution of repeat elements to intron expansion for the indicated genes. C) Tig1 overexpression affects expression of nearby genes in A. mexicanum. Bars represent ratios of gene expression in Tig1 or Tig1P155A overexpressing cells versus control cells (analysis based on dataset from (Oliveira et al., 2022)). D) Heatmap depicting differences in gene expression of Tig1 and its genomic neighbours during P. waltl limb regeneration.
Within this exemplary region of the P. waltl genome, the major contributor to gene size change is intron expansion, driven by accumulation of TEs such as hATs, Gypsy and Harbinger (Fig. 4b). Intron size differs for each orthologous gene across species, indicative of independent expansion events (Fig. 4a). In agreement, we observed differential contribution of transposon elements to intron size in genes within the locus (Fig. 4b). Interestingly, while most of the aforementioned genes seem to have undergone significant expansion during evolution, the orthologous of Shox2, a gene involved in limb development (Liu et al 2012) remains stable, displaying a lack of intron expansion in all species analysed. This is consistent with the notion that intron size of key developmental genes is under constraint in evolution, possibly related to their transcriptional requirements (Nowoshilow et al., 2018).
With regards to the conservation of the Tig1-Mfsd1-Schip1 arrangement, it is possible that this bears functional implications. Notably, we found that both Schip1 and Mfsd1 are differentially regulated during Tig1-mediated reprogramming of distal cells to a proximal identity in axolotls (Fig. 4c), with Mfsd1 upregulated and Schip1 downregulated upon Tig1 overexpression in distal cells. Similar regulatory effects are observed upon reprogramming with a hyper-proximalising version, Tig1P155A (Fig. 4c). Accordingly, the three genes are differentially regulated during limb regeneration in P.waltl (Fig. 4d, Suppl. Data 7) in a manner that reflects the proposed hierarchy. Therefore, the preservation of their genomic location relative to Tig1 could result from their participation in a hitherto unknown, common regulatory network. The relevance of this network to the extreme regenerative abilities found in salamanders remains to be determined.
Concluding remarks
The genomic and transcriptomic resources hereby presented provide new insights into the evolution of giant genomes and the molecular underpinning of complex regeneration. The chromosome scale assembly for the Iberian ribbed newt exhibits the highest contiguity and completeness among all giant genomes reported to date (Meyer et al., 2021; Schloissnig et al., 2021; Wang et al., 2021). DNA transposable elements are the major contributors to the genome size, and uncover a significant role played by hAT elements in genome expansion and the shaping of gene loci architecture. Moreover, their functional impact may extend beyond the latter, as we find that many hATs are actively transcribed in newt tissues, and members of this transposon superfamily as well as hAT-derived genes are regulated during limb regeneration in adult newts. Hence, hATs and relative members may represent a previously overlooked set of contributors to salamander limb regeneration.
Despite its size, the P. waltl genome exhibits a striking conservation of syntenic relationships at both macro- and micro-levels. In the case of the proximo-distal determinant Tig1, our study suggests that its genomic arrangement reflects a regulatory connection between Tig1 and the genes it clusters with, of potential relevance to the remarkable regenerative abilities found in P. waltl.
Collectively, our findings highlight the usefulness of the P. waltl chromosome-scale assembly as a resource for enhancing gene discovery in the context of development, physiology and regeneration, while providing a foundation for epigenetic studies, enhanced gene-editing and the detailed exploration of regulatory networks underlying biological processes.
We deposit this manuscript ahead of submission to a peer reviewed journal. The contents of the current and future versions may substantially differ. Genome and annotation files are available through the Max Planck Digital Library (https://doi.org/10.17617/3.90C1ND).
Materials and methods
Animal procedures
All animal experiments were performed in accordance with the guidelines of local, European and Japanese ethical permits. Adult Iberian Ribbed newts (Pleurodeles waltl) were obtained from the aquatic animal facility in Karolinska Institutet, where they were bred, raised and kept in captivity for generations according to (Joven et al., 2015). Only female newts were used in this study, as in this species the females represent the sex that display a heterogametic ZW genotype involved in sex determination (Dumond et al., 2008). To ensure that ensuing sequencing would be performed in a diploid animal, we analysed tail tip tissue from a tail clip from six adult females. The tissue collected was fixed, processed, sectioned at 30μm, and stained with DAPI to highlight the DNA according to (Joven and Simon, 2018). The 2n DNA content was confirmed by analysing both the expected size of the nuclei (Joven and Simon, 2018) as well as chromosome quantification in cartilage cells found in the M-phase of the cell cycle (2n = 24 chromosomes; (Elewa et al., 2017)) (Suppl. Fig 1). A 14.1cm-long adult female weighing 17.93g was selected for tissue collection. Tissues from the same animal were used for genome sequencing, Hi-C as well as brain and spleen Iso-Seq. After the tail clip was allowed to regenerate, the animal was deeply anaesthetised in 0.1% tricaine (MS-222, Sigma, pH=7) and sacrificed by decapitation. Immediately after, tissue dissection and collection were performed by three researchers working simultaneously to minimise sample degradation. The samples collected consisted of blood, brain, spinal cord, limb skeletal muscle, spleen, heart, and liver. Samples were snap-frozen in liquid nitrogen and stored at -80 for further processing.
For blastema Iso-seq preparation, adult newts were obtained from the Amphibian research center at Hiroshima University, Japan, and their rearing and treatments were performed and approved in accordance with the Guidelines for the Use and Care of Experimental Animals and the Institutional Animal Care and Use Committee of National Institute for Basic Biology, Japan.
Genome sequencing
The spleen from a female, adult Pleurodeles waltl was collected. Genomic DNA from the spleen was extracted using the Monarch® HMW DNA Extraction Kit for Tissue (NEB #T3060) as per manufacturer’s protocol. DNA was then immediately frozen and stored at -20°C until further downstream processing. Input QC of the DNA was performed using Dropsense, Qubit and Femto pulse to evaluate concentration, purity and size. Sample libraries were prepared according to Pacbio’s Procedure & Checklist – Preparing HiFi SMRTbell® Libraries using the SMRTbell Express Template Prep Kit 2.0, PN 101-853-100 Version 05 (August 2021) using the SMRTbell Express Template Prep Kit 2.0. Samples were sheared on Megaruptor 3 with speed setting 31 followed by 32. An Ampure bead purification was performed after the shearing. The samples were size selected using SageElf, according to Pacbio’s protocol. Fractions 1-4 were used for sequencing. Quality control of sheared DNA and SMRTbell libraries was performed on Fragment analyzer, using the Large Fragment standard sensitivity 492 kit. Primer annealing and polymerase binding was performed using the Sequel II binding kit 2.2. They were sequenced on the Sequel II and IIe instrument, using the Sequel II sequencing plate 2.0 and the Sequel® II SMRT® Cell 8M, movie time 30 hours and pre-extension time 2 hours.
Hi-C
Chromatin conformation capturing was performed using the ARIMA-HiC+ High Coverage Kit (Article Nr. A101030-ARI) following the user guide for animal tissues (ARIMA Document, Part Number: A160162 v00). In brief, 40 mg flash-frozen powdered heart tissue was chemically crosslinked. The crosslinked genomic DNA was digested with a restriction enzyme cocktail consisting of four restriction enzymes. The 5’-overhangs were filled in and labelled with biotin. Spatially proximal digested DNA ends were ligated and purified. The proximally-ligated DNA was then sheared and enriched for the ligated biotin containing fragments. Due to the expected genome size, two barcoded Illumina sequencing libraries were prepared following the ARIMA user guide for Library preparation using the Kapa Hyper Prep kit (ARIMA Document Part Number A160139 v00). The barcoded Hi-C libraries were sequenced on a NovaSeq6000 (NovaSeq Control Software 1.7.5/RTA v3.4.4) with a 151nt(Read1)-10nt(Index1)-10nt(Index2)-151nt(Read2) setup using ‘NovaSeqXp’ workflow in ‘S4’ mode flowcell. The Bcl to FastQ conversion was performed using bcl2fastq_v2.20.0.422 from the CASAVA software suite. The quality scale used was Sanger / phred33 / Illumina 1.8+.
Iso-seq
Spleen Iso-seq: Tissue was harvested from the spleen of a female adult Pleurodeles waltl. Tissue was immediately frozen on dry ice and stored at -80 °C. Approximately 10 mg of each indicated tissue were pulverised in liquid nitrogen and used for RNA extraction by means of Total RNA Purification Kit (Cat. 17200 from Norgen Biotek) as per manufacturer’s instructions. The pulverised spleen powders are mixed well with the β-mercaptoethanol containing buffer RL and the homogenates are further passing through the needle attached syringe for 5-10 times. The genomic DNA was removed via on column DNA removal using Norgen RNAse free DNAase kit (Cat. 25710). Input QC of the RNA was performed on the Agilent Bioanalyzer instrument, using the Eukaryote Total RNA Nano kit to evaluate RIN and concentration. RIN value obtained was above 9 for both samples. The sample libraries were prepared according to Pacbio’s Procedure & Checklist – Iso-Seq™ Express Template Preparation for Sequel® and Sequel II Systems, PN 101-763-800 Version 02 (October 2019) using the NEBNext® Single Cell/Low Input cDNA Synthesis & Amplification Module, the Iso-Seq Express Oligo Kit, ProNex beads and the SMRTbell Express Template Prep Kit 2.0. 300 ng RNA was used as input material. The samples were amplified 12 cycles. In the purification of amplified cDNA the standard workflow was applied (sample is composed primarily of transcripts centered around 2 kb). Quality control of the SMRTbell libraries was performed with the Qubit dsDNA HS kit and the Agilent Bioanalyzer High Sensitivity kit. Primer annealing and polymerase binding was performed using the Sequel II binding kit 2.0. Libraries were sequenced on the Sequel IIe instrument, using the Sequel II sequencing plate 2.0 and the Sequel® II SMRT® Cell 8M, movie time=24 hours and pre-extension time=2 hours (1 SMRT cell per sample). Raw sequencing data was fed into IsoSeq3 (https://github.com/PacificBiosciences/IsoSeq), as per standard instructions, to generate fasta outputs of high-quality and low-quality reads. The high quality fasta output was taken for further use as part of the reference transcriptome.
Brain Iso-seq: the dataset is published (Woych et al., 2022) and publicly available at NCBI (SRX16252717). Of note, the brain tissues correspond to the same individual described above. Blastema Iso-seq: Adult newts (1-year-old) were anaesthetised in 0.1% MS-222, and the forelimbs were amputated with a surgical knife at the middle of the forearm level. Blastema was collected at the late-bud blastema stage (Iten and Bryant, 1973) under anaesthesia, and 4∼6 blastemas were pooled for each library. Total RNAs were purified using RNeasy mini kit (Qiagen) or NucleoSpin RNA Plus XS (Takara Bio) kit. Sample libraries were prepared according to the following PacBio Iso-Seq protocols: Iso-SeqTM Template Preparation for Sequel Systems and Iso-SeqTM Express Template Preparation for Sequel and Sequel II Systems. One of four blastema libraries was treated with gRNA/Cas9 ribonucleocomplex which targets 20 transcripts highly expressed in blastema to deplete abundant transcripts in vitro after the first bead purification step, another was treated with tyr Cas9 RNP to act as negative control, and the other two samples were untreated (Suzuki et al., unpublished). Libraries were sequenced on the Sequel I or II in National Institute for Genetics, Japan.
Genome assembly and scaffolding
CCS reads (rq > 0.99) were called from the subreads.bam file using PacBio ccs (v6.0.0). Two contig assemblies were then created using hifiasm (v 0.16.0-r369) with arguments -l2 using the ccs reads as input. Purge-dups (v1.2.3) was then run on the primary contigs to create the set of contigs used for scaffolding. A further run of purge-dups on the combined assembly made up of the purged output from the primary contigs and the alt contigs from hifiasm created the alternate assembly.
To polish the assembled contigs from the primary assembly, all CCS reads were mapped to the contig assemblies using pbmm2 with arguments: --preset CCS -N 1 and variants were called using DeepVariant (v 1.2.0). Sites were filtered for those with ‘genotype 1/1’ to specify that all or nearly all reads support an alternative sequence at this position and a ‘PASS’ filter value to specify that the site passed DeepVariant’s internal filters. Base errors were then corrected using bcftools consensus (v 1.12). Based on the QV values produced by merqury (v 1.0) this resulted in an assembly with QV 72.9 and QV 54.8 using PacBio CCS reads and Arima V2 Hi-C reads as a kmer database, respectively. The discrepancy between these values can be attributed to the fact the CCS reads were used to assemble the genome itself, therefore overestimate the accuracy of the genome, whereas the Hi-C reads are not uniform and contain coverage gaps, resulting in an under-estimate. The “true” value is likely to lie between these two values, but without an independent sequencing dataset we are unable to estimate the true value.
For scaffolding, SALSA2 and the VGP’s Arima mapping pipeline were run (https://github.com/VGP/vgp-assembly/blob/master/pipeline/salsa/arima_mapping_pipeline.sh). Briefly, Hi-C reads were mapped to the contigs using BWA-MEM (v 0.7.17-r1198-dirty).
Alignments were then filtered using the Arima filter_five_end.pl script (https://github.com/VGP/vgp-assembly/blob/master/pipeline/salsa/filter_five_end.pl) and removed potential PCR duplicates with Picard’s MarkDuplicates (v 2.22.6).
The resulting read-sorted bed file was used as input for SALSA2 (v 2.2). A number of manual curation rounds were then performed to correct scaffolding errors and to scaffold those contigs which were not automatically scaffolded into the 12 chromosomes. To this end, cooler (v 0.8.11) and HiGlass (v 2.1.11) were used to visually inspect the Hi-C maps and SeqKit (v 0.13.2) was used to re-arrange contigs and scaffolds into chromosome-level scaffolds.
Repeat masking
In order to mask the P.waltl genome a de-novo repeat library was first created using RepeatModeler (v 2.0.2) with argument -LTRStruct. The resulting pleurodeles-specific repeat library was combined with the Dfam repeat library for all ancestors of pleurodeles with famdb.py (v 0.4.2): famdb.py -i Dfam.h5 families --ancestors -f fasta_name “pleurodeles waltl” > pleurodelesWaltl_repeatLibrary.fasta
The combined repeat library was then used to mask the genome using RepeatMasker (v 4.1.2): RepeatMasker -gff -xsmall -e crossmatch -libdir RepeatMasker-4.1.2-p1/Libraries -lib aPleWal_combinedRepLibraries.fasta -rmblast_dir rmblast-2.11.0/bin -crossmatch_dir /sw/bin aPleWal_genome.fasta
Genome annotation
Transcriptome and transcript mapping
cDNA from de-novo transcriptomes (Elewa et al., 2017; Matsunami et al., 2019) and high-quality I so-seq reads from three libraries (brain, spleen and blastema) were aligned to the Pleurodeles genome using minimap2 (v 2.24-r1122) and the following arguments:
-I200G -axsplice:hq --secondary=no -uf -G5m -a
Gff files from the resulting sam file were created using the following commands:
samtools view -b in.sam | samtools sort -o in.sorted.bam
bedtools bamtobed -bed12 -i in.sorted.bam > in.bed bedToGenePred in.bed in.genepred
genePredToGtf \“file\” in.genepred in.gtf
genometools-1.6.1/bin/gt gtf_to_gff3 -tidy in.gtf | genometools-1.6.1/bin/gt gff3 -tidy -sort > out.gff
Augustus
The gff files produced from mapping transcripts to the genome (see Transcriptome and transcript mapping section) were used as evidence for augustus (v 3.4.0) with the following arguments: augustus --extrinsicCfgFile=extrinsic.M.RM.E.W.cfg --hintsfile=hints.gff --species=chiloscyllium pleurodeles.fasta > augustus.predictions.gff
Species chiloscyllium was chosen as a model as Braker was not able to produce a de novo model for Pleurodeles due to the genome size causing errors in the GeneMark step.
EvidenceModeler
The gff files produced from the last two sections were given to EvidenceModeler (v 1.1.1) to filter alignments for correct annotations with weights:
OTHER_PREDICITON rna 2
ABINITIO_PREDICTION AUGUSTUS 1
A chunk size of 30Mb and an overlap size of 10Mb were used to avoid the larger introns being removed due to default sizes used by EvidenceModeler.
As EvidenceModeler aims to only produce one isoform per gene, afterwards we included any transcripts that were present in at least two of the transcript evidences (2 transcriptome assemblies and 3 I so-seq libraries).
Gene nomenclature
Combining “high-confidence” transcripts with the output from EvidenceModeler resulted in 164,283 predicted isoforms including 56,783 conserved protein coding isoforms (i.e., with a significant homology hit E-value cutoff 10^-10 with a protein in UniprotKB’sSwiss-prot database). For the purpose of gene nomenclature and downstream analysis, multiple isoforms belonging to the same gene were grouped under the same name using a custom python script (aPleWal.mergeisoforms.py), which took isoforms with consecutive numbers (e.g. gene47, gene48, gene49, gene50 and gene51) and the same homology hit (e.g. XYNB_NEOPA) and gave them the same gene name (e.g. XYNB.1). In the event that multiple genes shared the same UNIPROT ID, each additional gene was given a greater integer suffix (e.g. XYNB.2, etc.). Transcript isoforms are identified with an additional integer suffix after the gene name (e.g. XYNB.1.1, XYNB.1.2, etc.). The outcome of this process created 142,667 gene models of which 35,167 were conserved protein coding genes. Finally ncbi’s table2asn function (https://ftp.ncbi.nlm.nih.gov/asn1-converters/by_program/table2asn/) was used to filter spurious annotations for features such as internal stop-codons or errors in frame resulting in our gff3 file: aPleWal1.anno.20220803.gff3.
Transposable elements
Among the 35,167 conserved protein coding genes, 8,313 genes were putative transposable elements by virtue of either protein homology with a transposable element component or protein homology with a transposable element derived protein and presence in more than 10 distinct copies in the genome (aPleWal.BasicRscript.R).
Pseudogenes
RNA-seq data from twenty-five published P. waltl RNA libraries covering different body parts, life and regeneration stages (Elewa et al., 2017) were mapped to the genome using STAR (v2.7.9a). Of the 26,854 conserved protein encoding non-TE genes, 3,479 genes were not expressed at all (0 mapped reads in all 25 libraries combined). We consider these genes to be putative pseudogenes (aPleWal.BasicRscript.R).
Current protein-coding gene count
The exclusion of 8,313 putative transposable elements and 3,479 putative pseudogenes from the 35,167 conserved protein coding genes left 23,375 conserved protein coding genes [that are not putative TEs nor pseudogenes], which is the current protein-coding gene count for Pleurodeles waltl (aPleWal.BasicRscript.R).
Protein-based synteny
Synteny plots between assemblies were created by aligning protein sequences from Pleurodeles against protein sequences downloaded for Homo sapiens (grch38), axolotl -Ambystoma mexicanum-(AmexT_v47-AmexG_v6.0-DD), Protopterus annectens (GCF_019279795.1_PAN1.0), gar - Lepisosteus oculatus-(Lepisosteus_oculatus.LepOcu1) and Xenopus tropicalis (GCF_000004195.4_UCB_Xtro_10.0) using blastp (v 2.11.0+) and vice-versa only allowing max_target_seqs=1. In instances where the same transcripts were mapped against each other one-to-one, these locations in the two genomes were included in the synteny plots based on locations in the gff files.
Phylogenetic tree
The one-to-one orthologs identified via best-matches between Pleurodeles and axolotl, Xenopus, Gar, Danio rerio (GCF_000002035.6_GRCz11), Protopterus, human and Gallus gallus (bGalGal1.mat - GCF_016699485.2) as above using blastp on protein sequences from ncbi. Multiple alignments between all orthologs were created using MAFFT (v7.505 https://doi.org/10.1093/nar/gkf436) with arguments – auto. For each ortholog alignment, maximum likelihood trees were created using RAxML (v8.2.12 https://doi.org/10.1093/bioinformatics/btu033) using arguments: -f a -m PROTGAMMAAUTO -p 15256 -T 50 -x 271828 -N 100 -o zebrafish,gar. Finally, a consensus tree was created using MP-EST (v.2.1 https://doi.org/10.1186/1471-2148-10-302) with all 7.524 pairwise ortholog trees.
Intron counting
Gene intron coordinates were retrieved from the P. waltl genome annotation gff-file using faidx from SAMtools (Danecek et al., 2021) 1.12 and the complement tool from BEDtools (Quinlan and Hall, 2010) 2.30.0. First, the genome annotation was formatted to gtf with AGAT Toolkit (Dainat et al., 2022) (agat_convert_sp_gff2gtf.pl). Afterwards, the chromosome sizes were calculated with faidx, and the intergenic regions were retrieved from the annotation file. Finally, the intron coordinates were obtained by crossing the intergenic regions with the exon coordinates from the annotation file with the bedtools complement command.
Repetitive element annotation and analysisRepeat library assembly
The de novo repeat libraries of A. mexicanum, X. tropicalis, and H. sapiens genomes were developed via RepeatModeler 2.0.2a (Flynn et al., 2020), with RECON 1.0.8 (Bao and Eddy, 2002), RepeatScout 1.0.6 (Price et al., 2005), and LTRStruct (LTR_retriever 2.9.0 (Ou and Jiang, 2018) and LTRharvest (Ellinghaus et al., 2008) from genometools 1.6.2) methodologies for the identification of repetitive elements. Repetitive elements classified by RepeatModeler as “Unknown” were further processed with the DeepTE (Yan et al., 2020) algorithm to identify their possible family.
A de novo repeat library of each genome was made into a database with RepeatModeler BuildDatabase function. Then, a fasta file with predicted classified repeats and their sequences was generated: RepeatModeler-2.0.2a/RepeatModeler -database “REF_db” -pa 32 –LTRStruct DeepTE was executed with a metazoan repeat training dataset to classify “Unknown” repeats: python DeepTE/DeepTE.py -d deep_temp -o REF_DeepTE -sp M -m_dir Metazoans_model -i repeatFamiliesUnknowns.fa As a final step, the obtained de novo library was combined with the Dfam 3.3 database consensus:
RepeatMasker/famdb.py -i RepeatMasker/Libraries/Dfam.h5 families --ancestors -f fasta_name “organism name” > Dfam.fasta cat Dfam.fasta db-families.fa > repeatFamilies.fasta
Masking of transposable elements
To identify the location of the predicted repeats, the combined Dfam and de novo library consensus were mapped to the whole genome using RepeatMasker 4.1.2-p1 (Smit et al., 2013) with RMBlast 2.11.0 as a search engine. This generated a gff-annotation file with repetitive elements position across the genome: RepeatMasker -pa 32 -gff -xsmall -dir repeat_masker/ -e rmblast -libdir RepeatMasker/Libraries -lib repeatFamilies.fasta genome.fa
Classification procedure of repetitive elements
To assess repeat composition, a custom bash script was written to process files in an automatic manner. Classification of repeats was based on (Wells and Feschotte, 2020) and was expanded with further information on unclassified ancient repeats from Repbase (Kojima, 2018). The categorization of other non-transposable elements was based on the Dfam classification. Each element was assigned to a class, a superfamily, a family, and a category, as shown in Table 1.
Classification structure of repetitive elements
The generated repeat IDs and their corresponding names from RepeatModeler and DeepTE were combined into a dictionary with added classifications. Files were parsed with GNU Awk, where each string was split to retrieve a family name. This name was then compared with the file with classification structure. In the case of repeats that aligned with the Dfam database consensus, no IDs were generated. Thus, they were processed separately and repeat classification was retrieved from Dfam classification using RepeatMasker inner function famdb.py. The result was a repeat annotation gtf-file with coordinates, the names of repetitive elements, and full classification. This annotation was subsequently used to quantify repeat family contributions to the genome size of P. waltl, A. mexicanum, X. tropicalis, and H. sapiens.
Genomic location of the annotated repeats
To identify the location of repetitive elements within introns, exons and intergenic regions of the P. waltl genome, their coordinates were intersected with bed-files generated in the ‘Intron counting’ section (see above) via BEDtools intersect tool.
P. waltl transcriptome analysis
For expression analysis, transposons from the hAT family as well as domesticated hATs genes (ZBED) were used. Due to the existence of more than 4 million entries in our hAT annotation file, hAT transposons’ coordinates were split into different files based on their chromosome location and further analysis was done separately. Raw RNASeq data was only used for counting hAT transcripts. The raw counts of ZBED genes were available (Elewa et al., 2017).
Iso-Seq data analysis
Iso-Seq data was mapped to P. waltl genome with minimap2 2.24 (Li, 2018) with following parameters:
minimap2 -I200G -t24 -axsplice:hq --secondary=no -uf -G5m $genome_file $isoseq_file
The resulting sam file was transformed into a bam format, sorted by coordinates and indexed creating a csi-file to accelerate further transcript counting:
samtools view -@24 -b isoseq.pWaltl.mapped.sam | samtools sort -@24 -o isoseq.pWaltl.sorted.bam - &&ools index -c -@24 isoseq.pWaltl.sorted.bam
The number of reads for hAT transposons and ZBED genes was acquired with featureCounts (Liao et al., 2014) from subread 2.0.1 package:
featureCounts -t similarity -g gene_id -L -a annotation.gtf -o $outfile $bam_file
RNAseq data analysis
STAR (Dobin et al., 2013) 2.7.9a package was used to index the P. waltl genome and then map RNASeq transcripts to it:
STAR --runThreadN 24 --runMode genomeGenerate --genomeDir ./indexed_genome --genomeFastaFiles $genome_file --sjdbGTFfile $full_annotation.gtf --sjdbOverhang 124 --limitGenomeGenerateRAM 55000000000
Mapping was performed using parameters previously reported (Elewa et la, 2017).
STAR --genomeLoad LoadAndRemove --genomeDir $genome_dir --runThreadN 24
--readFilesIn rnaseq1_1.fastq rnaseq1_2.fastq --outFileNamePrefix “rnaseq1_tr_”
--limitGenomeGenerateRAM 300000000000 --runDirPerm All_RWX --outFilterMultimapNmax 1000 -- outFilterMismatchNoverLmax 0.05 --alignIntronMax 1 --alignIntronMin 2
--scoreDelOpen -10000 --scoreInsOpen -10000 --alignEndsType EndToEnd
--limitOutSAMoneReadBytes 100000000000
Sam-file transformations were performed as described for the Iso-Seq analysis. Then transcripts were counted: featureCounts -p -T 10 -t similarity -g gene_id -a $hAT.gtf -o $outfile $bam
Data processing
Differential expression of RNASeq data was processed with DESeq2 (Love et al., 2014) R package. DESeq2’s median of ratios was used to normalise raw counts to measure up- or downregulation of transposons and genes. Transcriptional count mean-dispersion relationship was performed with parametric fit or local regression fit (transposons). For hATs, analysis was only performed on predicted repeats that were longer than 2000 bp. Samples from 0 days post amputation (dpa) and 3dpa or 7 dpa were compared pairwise to determine significantly differentially expressed genes/transposons. Genes or repeats were filtered by adjusted p-value (<0.1) for visualisation. After regularised log transformation and data centering Z-scores were calculated and visualised as a heatmap applying pheatmap package. All other plots were generated using package “ggplot2” from “tidyverse” (Wickham et al., 2019).
Funding sources
TB supported by DFG (INST 269/768-1). AE is supported by grant PID2020-115672RJ-I00 type JIN from Ministerio de Ciencia y Innovación (Spain). K.T.S is supported by JSPS KAKENHI, Grant-in Aid for Scientific Research(C), 18K06257 and 16H06279 (PAGS). NDL receives funding from the Knut and Alice Wallenberg Foundation and the Swedish Research Council (Registration # 2020-01486). AS is supported by ERC (951477), Swedish Research Council (2018-02443), KAW (2018.0040), Cancerfonden (20 0417). MHY is supported by Deutsche Forschungsgemeinschaft grants (DFG 22137416, 450807335 & 497658823) and TUD-CRTD core and seed funds.
Author contributions
TB performed genome assembly and chromosome scaffolding. AE and TB performed genome annotation, with input and scripts from EO. SI performed computational genomic analysis, with input from MHY, TB, AE, AP and NDL. ES optimized and generated tissue samples for genomic and Iso-seq sequencing. AJA analysed 2n DNA content prior to tissue collection. ES, AJA and NDL coordinated sample extraction. MS, KS, TH, AT generated limb blastema Iso-seq. CO analysed data. TB performed macrosynteny comparisons. NDL developed microsynteny pipeline. MHY and AS provided scientific coordination. MHY, AS and NDL supervised the project. AS and MHY provided funding (AS: genome and Iso-seq sequencing except for limb blastema, staff; MHY: computational capacity, staff). AS and MHY edited the manuscript. MHY wrote the manuscript with contributions from all authors.
Competing interests
None
Data Availability
Genome and annotation files are available through the Max Planck Digital Library at the following location: https://doi.org/10.17617/3.90C1ND and NCBI under the BioProject: PRJNA847026. PacBio HiFi, Hi-C and Iso-seq data will also be available under the same BioProject.
Material & Correspondence
Correspondence and request for materials should be addressed to NDL, AS & MHY.
Supplementary information
Supplementary Figures 1 - 13
Supplementary Data 1 – 7
Supplementary Figure legends
Supplementary Figure 1. A) Adult Iberian Ribbed female newt used in the present study for tissue collection and subsequent genome sequencing, Hi-C as well as brain and spleen Iso-Seq. B) Maximum intensity projection of a Z-stack confocal image of chondrocytes found in the tail vertebra in interphase and metaphase. The cells show both the expected size of the nucleus for a diploid animal (10μm-diameter) and the correct number of chromosomes (2n=24). c) Individual Z-planes corresponding to Suppl Fig. 1b.
Supplementary Figure 2. Scaffold N(X) plot showing which % of each assembled genome (X) is contained within pieces at least N(X) bp in size. Shown are contig statistics from Pleurodeles waltl (this study and (Elewa et al., 2017)), Protopterus annectens (Wang et al., 2021) and Ambystoma mexicanum (Schloissnig et al., 2021).
Supplementary Figure 3. 500Mb inversion of the central region of chromosome 2. Hi-C interaction heatmap of contact data for chromosome 2 (left) and corresponding heatmap after inverted central 500Mb region (right).
Supplementary Figure 4. 350Mb inversion of the central region of chromosome 5. Hi-C interaction heatmap of contact data for chromosome 5 (left) and corresponding heatmap after inverted central 350Mb region (right).
Supplementary Figure 5. Expansion history of transposable elements based on the kimura substitution level for each copy of the indicated repetitive element against its consensus sequence: A) for the indicated repeat types; B) for the top contributor TE families.
Supplementary Figure 6. Distribution of hAT elements within exons, introns and intergenic regions of the P. waltl genome, expressed as % contribution to each genomic component.
Supplementary Figure 7. Analysis of exon/intron/intergenic region size in P. waltl. Violin plots for intron (left, in kb), intergenic region (middle, in kb) and exon (right, in bp) size. Coloured circles indicate the median of each distribution.
Supplementary Figure 8. a) Expression of hAT elements in Iso-seq-derived transcriptomes from limb blastema, brain and spleen according to element length (bp). b) Example of a >2000bp hAT from P. waltl, highlighting the domains present within its ORF including the transposase region.
Supplementary Figure 9. Number of transcribed copies for the indicated hAT (a,b) or domesticated hAT (c) categories based on PacBio Iso-seq data for limb blastema, brain and spleen.
Supplementary Figure 10. RNAseq quantification of domesticated hATs and relevant isoforms differentially expressed across the indicated P. waltl tissues.
Supplementary Figure 11. Oxford plot of macrosyntenic relationships between P. waltl and X. tropicalis chromosomes based on 13,736 one-to-one orthologues. Coloured dots indicate relative chromosomal arrangement of newt-frog orthologues. Inversion of P. waltl chromosome 5 is indicated by the red rectangle.
Supplementary Figure 12. Oxford plot of macrosyntenic relationships between P. waltl and P. annectens chromosomes based on 13,423 one-to-one orthologues. Coloured dots indicate relative chromosomal arrangement of newt-lungfish orthologues.
Supplementary Figure 13. Oxford plot of macrosyntenic relationships between P. waltl and H. sapiens chromosomes based on 13,127 one-to-one orthologues. Coloured dots indicate relative chromosomal arrangement of newt-human orthologues.
Supplementary Data description
Supplementary Data 1. GenomeScope profile (k-mer based statistical analysis) of the P. waltl genome assembly. (ab) indicates level of heterozygosity; (aa) indicates level of homozygosity.
Supplementary Data 2. List of genes contained within the 500Mb inverted region of chromosome 2.
Supplementary Data 3. List of genes contained within the 300Mb inverted region of chromosome 5.
Supplementary Data 4. DGE analysis of hAT transposons (over 2000bp) during P. waltl limb regeneration (0, 3 and 7dpa)
Supplementary Data 5. DGE analysis of domesticated hAT genes during P. waltl limb regeneration (0, 3 and 7dpa)
Supplementary Data 6. A pipeline for microsynteny analysis.
Supplementary Data 7. DGE analysis of genes neighbouring the Tig1 locus during P. waltl limb regeneration (0, 3 and 7dpa).
Acknowledgments
Storage and handling of sequencing data was enabled by resources provided by the Swedish National Infrastructure for Computing (SNIC) at UPPMAX -partially funded by the Swedish Research Council through grant agreement no. 2018-05973-, the DRESDEN Concept Genome Center -part of the technology platform of the CMCB at the TU Dresden, supported by DFG (INST 269/768-1)-, the MPI-CBG computing cloud, and the Center for Information Services and High-Performance Computing (ZIH) at Technische Universität Dresden. Work performed at NGI/Uppsala Genome Center has been funded by RFI/VR and Science for Life Laboratory, Sweden. We thank Miho Kiyooka and Wei Chen for blastema Iso-s eq library preparation and Sequel sequencing in the National Institute for Genetics, Japan.
Footnotes
↵** co-first authors


