

Abstract
Background Evaluation of carbon (C), nitrogen (N) and phosphorus (P) ratios in aquatic and terrestrial ecosystems can advance our understanding of biological processes, nutrient cycling and the fate of organic matter (OM). Eutrophication of aquatic ecosystems can upset the accumulation and decomposition of OM which serves as the base of the aquatic food web. This study investigated nutrient stoichiometry within and between wetland ecosystem compartments of two treatment flow-ways (FWs) in the Everglades Stormwater Treatment Areas located in south Florida (USA). These FWs include an emergent aquatic vegetation FW dominated by Typha spp.(cattail) and a submerged aquatic vegetation FW composed of species such as Chara spp. (muskgrass) and Potamogeton spp. (pondweed).
Results This study demonstrates that C, N, and P stoichiometry can be highly variable within and between wetland ecosystem compartments influenced largely by biota. Generally, total P declined along the length of each treatment FW in all ecosystem compartments, whereas trends in total N and C trends were more variable. These changes in C and nutrient concentrations results in variable nutrient stoichiometry along treatment FWs signaling potential changes in nutrient availability and biogeochemical processes.
Conclusions Assessment of wetland nutrient stoichiometry between and within ecosystem compartments suggest decoupling of OM decomposition from nutrient mineralization which may have considerable influence on nutrient removal rates and contrasting dominate vegetation communities. Moreover, based on these OM dynamics and nutrient stoichiometric relationships differences food webs structure and composition could vary between systems resulting in variable feedback cycles related to nutrient cycling. Therefore, this information could be used to further understand water treatment performance and adaptively manage these constructed wetlands.
Introduction
The study of nutrient stoichiometry, pioneered by Redfield (1934, 1958), laid the foundation of two important biogeochemical principles that later became basic tenets of ecological stoichiometry: (1) organisms have consistent carbon (C), nitrogen (N) and phosphorus (P) molar ratios and (2) the abundance of C, N and P in organisms is regulated by interactions between them and their environment. The basic premise of the Redfield ratio is that C:N:P is well constrained based on the similarity of measured N and P concentrations in marine plankton relative to the nitrate (NO3) to phosphate (PO4) ratio in deep ocean water. The Redfield ratio describes the ratio of NO3, PO4 and non-calcite inorganic C (i.e. inorganic C, N and P) in deep seawater (Redfield 1934, 1958; Lenton and Watson 2000; Geider and La Roche 2002). The stoichiometric values of the Redfield ratio thus describe the average composition of marine OM and the necessary oxygen required to decompose the organic matter (OM) via respiration. Since its acceptance, the Redfield ratio has been debated and revisited frequently in light of new analytical methods, more data, and clarification of the frequent misrepresentations of the notable Redfield ratio (Lenton and Watson 2000; Geider and La Roche 2002). Furthermore the Redfield ratio concept has been extended beyond marine ecosystems into freshwater and terrestrial systems (Dodds et al. 2002; Dodds 2003; Cleveland and Liptzin 2007; Xu et al. 2013).
In general, wetlands are net C sinks that store a large amount of the global C driven by a disproportionate accumulation of C via plant productivity and export from the decomposition of organic matter (Billett and Moore 2008; Kayranli et al. 2010). Decomposition of OM involves a stepwise conversion of complex organic molecules into simple constituents through physical leaching and fragmentation, extracellular hydrolysis, and catabolic activities by microbes (Reddy and DeLaune 2008). Anthropogenically mediated nutrient loading to otherwise pristine wetlands has a potential to disrupt the ecological balance and substantially affect nutrient (i.e. N and P) cycling through the disruption of OM decomposition dynamics and other biogeochemical processes. Long-term nutrient enrichment in wetlands can affect OM decomposition rates by increasing microbial productivity leading to accelerated rates of C mineralization and nutrient cycling (Qualls and Richardson 2000). Therefore, excessive external inputs of nutrients to an ecosystem can lead to disruption in the stoichiometric balance of ecosystem compartments by preferential uptake and assimilation resulting in alteration of OM decomposition processes mediated by microbes (Zhan et al. 2017). Other factors that also influence OM decomposition associated with excessive loading include changes in water column oxygen regime, oxidation-reduction conditions and hydrology.
In addition to changes to microbial OM decomposition dynamics, enrichment of natural systems significantly influences OM accumulation via larger ecosystem through shifts in plant and algal communities (Pan et al. 2000). Eutrophication of aquatic ecosystems allows for nutrient tolerant species to establish and thrive while reducing the overall coverage of nutrient sensitive species leading to a cascading effect on the entire ecosystem structure and function. In the Everglades ecosystem, stormwater run-off has accelerated soil accretion dynamics, and the spread of Typha spp. (cattail) have been well documented (Davis and Ogden 1994; Newman et al. 1998). Because of nutrient inputs and altered hydrology, Everglades flora and fauna have been significantly impacted through widescale encroachment of cattails, loss of calcareous periphyton and other ecological changes within the Everglades marsh (Davis and Ogden 1994). In an effort to restore the biological integrity of the system, the State of Florida and the US Federal government initiated restoration and control efforts. One such effort is the construction of treatment wetlands to improve the quality of agricultural surface runoff water originating in the Everglades Agricultural Area (EAA) prior to entering the downstream Everglades ecosystem (Chen et al. 2015). These treatment wetlands, referred to as the Everglades stormwater treatment areas (STAs) were constructed with the primary objective of removing P from surface water prior to discharge to the Everglades Protection Area. The STAs are composed of several treatment cells which use natural wetland communities to facilitate the removal of P from the water column by leveraging natural wetland processes including nutrient storage in vegetative tissues and soils (Kadlec and Wallace 2009). Previous studies have suggested that C:N:P ratios in soil and soil microbial biomass are tightly constrained providing a Redfield-like stoichiometric ratio across forested, grassland and natural wetland ecosystems (Cleveland and Liptzin 2007; Xu et al. 2013). Given the role of OM accumulation and decomposition in wetland ecosystems, nutrient stoichiometry is important to understand the cycling and controls of nutrient removal. Given the primary objective of the STAs and the role they play as biogeochemical hotspots (McClain et al. 2003), this study will evaluate stoichiometry relationships within treatment wetlands. The objectives of this study were to investigate nutrient stoichiometry within a treatment wetland ecosystem to understand changes in nutrient pools within each ecosystem compartment. The first objective of this study was to evaluate nutrient relationships (i.e. C x N, C x P and N x P) within surface water, soil flocculent material (floc), recently accreted soil (RAS) and vegetation live aboveground biomass (AGB) ecosystem between two cells, one dominated by emergent aquatic vegetation (EAV) and the other by submerged aquatic vegetation (SAV). The second objective of this study was to assess changes in nutrient stoichiometry in surface water, floc and RAS ecosystem compartments along each flow way transect. The first hypothesis is that along a given treatment cell, nutrient stoichiometry will be tightly constrained across different ecosystem compartment as suggested by previous studies (Cleveland and Liptzin 2007; Xu et al. 2013). The second hypothesis is that due to external loading, shifts in nutrient stoichiometry is likely to occur along a given flow path due to biogeochemical processes associated with uptake, utilization and storage of excess nutrients that supersede the ecosystem demands resulting in strong nutrient gradients from inflow-to-outflow. The final hypothesis is that due to differences in vegetation and associated biogeochemical processes nutrient stoichiometry in surface water, floc, RAS and living-AGB will differ between flow paths inhabited by different vegetation types.
Methods
Study Area
Everglades STAs reduce surface water P loads in an effort to preserve and protect the remaining Everglades ecosystem (Chimney 2017). A total of six STAs with an approximate area of 18,000 ha are located south of Lake Okeechobee in the southern portion of the EAA (Fig 1). Prior land uses within the current STA boundaries include natural wetlands and agricultural land use dominated by sugarcane. The primary source of inflow water to the STAs is agricultural runoff originating from approximately 284,000 ha of farmland upstream. Everglades STA treatment cells are comprised of a mixture of EAV and SAV communities in several configurations including EAV and SAV treatment cells arranged in parallel or in series (Chen et al. 2015).

Surface water, soil and vegetation monitoring locations within Everglades Stormwater Treatment Area-2 cells 1 (right) and 3 (left). Cell 1 is predominately emergent vegetation and Cell 3 is predominately submerged aquatic vegetation. Operationally these cells are identified as flow-way 1 and 3, respectively.
Stormwater Treatment Area-2 has been in operation since June 1999 with an effective treatment area of approximately 6,270 ha divided into eight treatment cells. This study was conducted in two cells, cells 1 and 3 which are conventionally called flow-ways (FWs) 1 and 3, respectively. The vegetative community of FW 1 is comprised predominately of EAV vegetation including Typha domingensis Pers. (cattail) and Cladium jamaicense Crantz (sawgrass) while FW 3 is dominantly SAV including Chara spp. (muskgrass), Potamogeton spp. (pondweed) and Najas guadalupensis Spreng (southern naiad) with approximately a third of the FW occupied by EAV species. Furthermore, prior to STA-2 construction FW 1 was a historic natural wetland while approximate two-thirds of FW 3 was previously farmed and is now managed as a SAV system (Juston and DeBusk 2006).
Data Source
Water quality monitoring locations were established along two flow paths within STA-2 along a transect running from inflow to outflow of the FW. Weekly surface water grab samples were collected at monitoring locations within FW 1 and 3 to characterize changes in nutrient concentrations and availability during prescribe/semi-managed flow events (Fig 1). When adequate water was available within the water management systems, prescribed flow events were scheduled and cycled through various flow/no-flow sequences for FWs 1 and 3. Water column parameters such as total P (TP), total N (TN), and dissolved organic carbon (DOC) were analyzed on these water samples. Soil samples were also collected along the flow transects twice during the dry and wet seasons throughout the course of this study. Soils were sampled using the push-core method by a 50-cm long polycarbonate coring tube (10-cm internal diameter) consistent with methods used in prior wetland soil studies (Bruland et al. 2007; Osborne et al. 2011; Newman et al. 2017). Samples were extruded from the soil core tube and partitioned into floc and RAS. Soil samples were analyzed for loss-on-ignition (LOI), TP, TN, TC and total calcium (TCa). Living and senescent aboveground biomass (AGB) were sampled from dominant vegetation in FW 1 while only living aboveground biomass was sampled from FW 3 at the end of the 2015 (November 2015) and 2016 (September 2016) wet seasons. Vegetations samples were collected from four to eight randomly placed 0.25 m2 quadrats adjacent to the identified sampling locations. Vegetation sampling locations were located at inflow, mid and outflow regions of the FWs within close proximity to the surface water and soil monitoring locations (Fig 1). Dry homogenized vegetation samples were analyzed for TP, TN and TC content consistent with U.S. Environmental Protection Agency approved methods (Table 1). Surface water inflow volume and TP concentrations were retrieved from the South Florida Water Management District (SFWMD) online database (DBHYDRO; www.sfwmd.gov/dbhydro) for each FW. For purposes of this data analysis and summary statistics, data reported as less than method detection limit (MDL) were set to the MDL.
Summary of parameters, matrices and analytical methods used for this study. Additional parameters were collected but not used in this study. All analytical methods are consistent with Florida Department of Environmental Protection or U.S. Environmental Protection Agency Standard Operating Procedures and methods.
Data Analysis
Hydraulic and P loading rates (HLR and PLR, respectively) were calculated based on methods by Kadlec and Wallace (2009). Inflow structure daily flow rates were determined using the difference between head-water (upstream) and tail-water (downstream) stage elevations in combination with structure geometry. Weekly surface water grab total phosphorus samples were collected at inflow and outflow structures and used to estimate inflow and outflow load amounts. Hydraulic loading rate were estimated by dividing flow volume and FW area for each FW. Phosphorus loading rate were estimated using daily TP load divided by FW area.
Surface water nutrient concentrations were converted from mass of nutrient per volume concentration (i.e. mg L-1) to a molecular concentration (i.e. mM). Soil, floc and vegetation nutrient concentrations were converted from a mass of nutrient per mass of soil (i.e. mg kg-1) to a molecular concentration per mass of soil (i.e. mmol kg-1). Relationships among surface water, soil, floc and vegetation nutrients were examined by log-log regression using Siegel repeated median’s linear model (Siegel 1982) (‘mblm’ package). All parameters were log transformed prior to analysis. Log-Log regression is commonly used in allometric analyses of growth and biomass where a slope equal to one indicates isometric (proportional) scaling while slopes not-equal to one indicates allometric (disproportional) scaling. This same approach was used in this study to test if the proportional relationships (i.e. C x P) are preserved as concentrations change in the various nutrient pools within each compartment similar to (Cleveland and Liptzin 2007).
Surface water (DOC:TP, DOC:TN and TN:TP), soil and floc molar ratios (TC:TP, TC:TN and TN:TP) were compared between FWs by Kruskal-Wallis rank sum test. To characterize the relationship between floc and soil along the two-flow path transects, fractional distance downstream was broken into two categories, inflow to mid-point region (<0.5) and mid-point to outflow region (>0.5). Soil and floc TN:TP were compared between FWs and distance downstream by Kruskal-Wallis rank sum test, separately. Floc and RAS TN:TP were also compared by spearman’s rank sum test by flow path separately.
Longitudinal change point analysis was performed on mean surface water, floc and soil nutrient stoichiometric ratios for data collected in FWs 1 and 3. Surface water nutrient ratios considered were TN:TP, OC:TP, and OC:TN, similarly floc and RAS nutrient ratios include N:P, C:P and C:N. Mean nutrient ratios were compared to fractional distance downstream by spearman’s rank sum correlation and rate of change was evaluated using Theil-Sen slope estimator (‘zyp’ package)(Bronaugh and Werner 2013). Nutrient stoichiometry change-point detection along the flow way transects was evaluated using Davies’ difference-in-slope test (‘segmented’ package)(Vito and Muggeo 2003; Muggeo 2008). Despite only three sampling locations along the flow path transect for vegetation (Fig 1), spearman’s rank sum correlation test was used to assess changes in absolute nutrient concentrations (i.e. TP, TN and TC) and molar ratio (TC:TP, TC:TN and TN:TP) of vegetation living-AGB along each flow path. All statistical operations were performed with R© (Ver 3.1.2, R Foundation for Statistical Computing, Vienna Austria), unless otherwise stated all statistical operations were performed using the base R library. The critical level of significance was set at α=0.05.
Results
A total of five prescribed/managed flow events occurred between August 10th, 2015 and November 22nd, 2016 with events ranging from 35 to 63 days between FWs 1 and 3 within STA-2. During the flow events, daily HLR ranged between 0 (no inflow) to 33.7 cm d-1 with FW 3 receiving a relatively higher mean HLR of 3.2 ± 0.1 cm d-1 and higher maximum daily HLR of 33.7 cm d-1. Flow-way 1 achieved a mean HLR of 2.7 ± 0.07 cm d-1 with a daily maximum HLR of 23.7 cm d-1. Observed daily PLR values ranged from 0 (no loading) to 92.9 mg m-2 d-1 with FW 3 received a higher relative load with a mean PLR of 3.2 ± 0.1 mg m-2 d-1 and experiencing the highest daily maximum PLR rate. Flow-way 1 achieved a mean PLR of 2.6 ± 0.01 mg m-2 d-1 with a daily maximum PLR of 66.1 mg m-2 d-1 (complete summary of flow event characteristics can be found in Supplemental Table 1). The daily HLR and PLR observed during this study was consistent with historic operational loading rates experienced for these FWs to date (Chen et al. 2015).
Water column C:N:P dynamics
During this study DOC ranged from 15.1 to 40.2 mg C L-1, TP ranged from 6 to 378 μg P L-1 and TN ranged from 0.78 to 4.14 mg N L-1 between the two study FWs. Molar ratios of DOC to TP ranged from 280 to 14,613, DOC to TN ranged from 9.3 to 24.0 and TN to TP ranged from 16.3 to 788.7 (Table 2). Qualitatively, mean DOC, TN and TP concentrations were relatively comparable (Table 2) between the FWs as expected since they receive the same source water but experience different loading (HLR and PLR) regimes and dominant vegetative communities.
Summary statistics for parameters and matrices used in this study of samples collected along the Cell 1 and 3 flow-path transect within Stormwater Treatment Area-2. Summary statistics include mean, standard error, range, and coefficient of variance. Matrices include surface water, soil flocculent material, recently accreted soil and living aboveground biomass of sampled vegetation.
All surface water stoichiometric relationships resulted in statistically significant relationships with slopes significantly different from one (Table 3) indicating that none of the nutrient pools proportionally scale. The models between the two FWs diverge drastically in most cases except for the DOC-TN relationship which is relatively constrained (Fig 2) as indicated by the similar slopes and intercepts between the two FWs (Table 3). Stoichiometric relationships associated with TP (i.e. DOC:TP and TN:TP) were not tightly constrained driven largely by the extreme variability in weekly measurements (Table 2). Stoichiometric ratios of DOC:TP, DOC:TN and TN:TP (Table 4) were significantly different between the two FWs with FW 3 experiencing greater DOC:TP and TN:TP values and lower DOC:TN values (Table 2 and Fig 3).

Relationships between carbon (organic carbon in surface water), nitrogen and phosphorus in surface water, soil flocculent material (floc), recently accreted soil, and dominate vegetation aboveground living biomass for STA-2 flow-ways (FWs) 1 and 3. Relative correlation from Spearman’s rank sum correlation indicated by lines through the data by Thiel-Sen linear model estimate.

Boxplot comparing stoichiometric relationships between study flow-ways (FWs) for surface water, soil flocculent material (floc), recently accreted soil, and dominate vegetation aboveground living biomass.
Siegel repeated median’s linear model results for stoichiometric relationships within each ecosystem compartment along flow-way (FW) 1 and 3 within Stormwater Treatment Area-2. Bold ρ-values indicate models where slope was not significantly different than one.
Comparison by Kruskal-Wallis rank sum test of stoichiometric ratios between flow-way 1 and 3 for surface water, soil flocculent material (floc) and recently accreted soil ecosystem compartments. Statistically significant comparison identified by italicized ρ-values.
Total P, TN and DOC concentrations were negatively correlated with distance downstream indicating a gradual decline in concentrations along the STA-2 FW 1 flow way transect (Table 5 and Fig 4). Dissolved OC decline the most along the flow way transect followed by TN and TP (Table 5). Along with significant declines in concentrations along the flow path DOC:TN and TN:TP significantly increased with no significant change points detected (ρ=0.59 and ρ=0.22, respectively) along the flow way transect. (Table 5). However, DOC:TP did not significantly change along the flow path and no change point was detected (ρ=0.19) despite having the largest rate of increase between stoichiometric ratios (Table 5). Similar to FW 1, FW 3 TP and TN were negatively correlated with distance downstream with TN with largest decline along the transects (Table 5). Meanwhile, in FW 3 DOC was not significantly correlated with distance downstream (Table 5). All surface water stoichiometric ratios were positively correlated with distance downstream at a similar rate as FW 1 (Table 5) and no change points detected for any of the stoichiometric ratios (DOC:TP ρ=0.08; DOC:TN ρ=0.21; TN:TP ρ=0.12).

Mean ± SE phosphorus (TP), nitrogen (TN) and associated molar ratios by fractional distance downstream for STA-2 flow-ways (FWs) 1 and 3. Carbon is expressed as dissolved organic carbon (DOC) for surface water and total carbon (TC) for soil flocculent material (floc), recently accreted soil and vegetation living aboveground biomass. Note scales differ across each ecosystem compartment and parameter.
Flow way assessment of total phosphorous (TP), total nitrogen (TN) and carbon (dissolved organic carbon [DOC] for surface water and total carbon [TC] for floc, soil and vegetation) along flow-ways 1 and 3 of STA-2. Spearman’s rank sum correlation and Thiel-Sen Slope estimate results summarized by flow way and ecosystem compartment.
Floc C:N:P dynamics
Percent organic matter (OM), as indicated by LOI, ranged from 12.1 to 91.4% across the FWs with FW 1 having higher OM in the floc material (Table 2). In addition to having lower OM, FW 3 floc material was more mineral as indicated by TCa concentrations which were several orders of magnitude greater the than concentrations observed in FW 1 (Table 2). Meanwhile, floc TC concentrations ranged from 160 to 448 g kg-1 (13,321 to 40,630 mmol kg-1), TP concentrations ranged from 307 to 2,436 mg kg-1 (9.9 to 78.6 mmol kg-1) and TN concentration ranged from 7.8 to 39.4 g kg (651 to 3,280 mmol kg-1) across FWs 1 and 3. Floc molar ratios of TC to TP ranged from 410.9 to 1,369.2, TC to TN ranged from 10.2 to 21.1 and TN to TP ranged from 23.8 to 87.4 (Table 2). Generally, TP concentration was the most variable parameter between and within sites with coefficients of variance as high as 78% at any given site but overall FW 3 exhibited the highest overall coefficient of variance with 27% spatial and temporal variability (Table 2).
Floc TC-TN and TN-TP models for both FWs and the TC-TP model for FW 3 resulted in slopes significantly different from one while the TC-TP slope for FW 1 was not significantly different than one, indicating TC and TP scale proportionally (Table 3). Similar to surface water stoichiometry models, floc stoichiometry models deviate drastically when comparing the two FWs except for the TC-TN relationships which are nearly identical and fall along a continuum (Fig 2) with FW 1 generally having greater TN concentrations in the floc compartment (Table 2). Floc TC:TP and TC:TN stoichiometry significantly differ between FWs (Table 4) with FW 3 having higher TC:TN and TC:TN ratio (Fig 3), suggesting TP and TN are less constrained relative to TC. Meanwhile, floc TN:TP was not significantly different between FWs (Table 4) suggesting that even though TP concentrations are highly variable between and within FWs TP and TN are tightly constrained.
Floc TP concentration was negatively correlated with distance downstream along the FW 1 transect at a rate of -1531 mg kg-1 Distance-1 (Fractional Distance, Table 5) indicating a significant decline in TP concentration along the flow path. Meanwhile, floc TC and TN were not significantly correlated with distance downstream (Table 5). Floc TC:TP and TN:TP molar ratios were positively correlated with distance downstream while TC:TN molar ratio did not exhibit a significant correlation with distance downstream (Table 5). Furthermore, no significant change points were detected for any stoichiometric ratios along the FW 1 flow way transect (TC:TP ρ=0.13; TC:TN ρ=0.78; TN:TP ρ=0.07). Along the FW 3 flow way transect, TP, TN, TC, TC:TN were not significantly correlated with distance downstream (Table 5). While, floc TC:TP and TN:TP were positively correlated with distance downstream at rates of change comparable to that of FW 1 (Table 5 and Fig 4). Moreover, no change points were detected in along the FW 3 flow transect for TC:TP, TC:TN or TN:TP (TC:TP ρ=0.12; TC:TN ρ=0.16; TN:TP ρ=0.22).
Soil C:N:P dynamics
Much like the floc compartment, LOI values in the RAS compartment range from 16.5 to 91.0% across the study FWs with FW 1 having a higher observed mean LOI value for RAS (81.2 ± 1.4 %; Table 2). Additionally, FW 3 soils were more mineral in nature with greater TCa concentrations relative to FW 1 soils (Table 2). Soil TC concentration ranged from 171 to 504 g kg-1, TN ranged from 7.7 to 38.2 g kg-1 and TP ranged from 312 to 1449 mg kg-1 across FWs 1 and 3 with FW 1 being generally more enriched with nutrients as indicated by qualitatively greater average concentrations (Table 2). Soil nutrient ratios were generally greater than those observed in the floc compartment with TC:TP values ranging from 534 to 4,061, TC:TN ranged from 11.6 to 22.2 and TN:TP ranged from 26.0 to 262 (Table 2). Much like the floc compartment, TP was the most variable parameter as indicated by intra- and inter-site coefficients of variance reaching as high as 58% at any given site. Overall FW 1 exhibited the highest overall coefficient of variance with 42% spatial and temporal variability (Table 2).
Soil TC-TP and TC-TN models for both FWs and the TN-TP model for FW 3 resulted in slopes significantly different from one while the TN-TP model for FW 1 was not significantly different than one, indicating TN and TP ratio for FW 1 scale proportionally (Table 3). Soil TC:TN significantly differed between FWs (Table 4) with FW 3 having a greater TC:TN ratio (Fig 3). Meanwhile, TC:TP and TN:TP were not significantly different between FWs (Table 4) indicating that despite the lack of proportional scaling for TC-TP and TN-TP, P is somewhat constrained along the flow path between the two FWs.
Soil TP concentration was negatively correlated with distance downstream with no change point detected within FW 1 (Table 5). Within FW 1, soil TC and TN were not significantly correlated with distance downstream (Table 5). Both TC:TP and TN:TP stoichiometry were not significantly correlated with distance downstream along the FW 1 flow way transect with no significant change point detected (TC:TP ρ=0.59; TN:TP ρ=0.46). Soil TC:TN was negatively correlated with distance downstream along the FW 1 flow way transect (Table 5) with no change point detected (ρ=0.30). Along the FW 3 flow transect, TN and TC were positively correlated with distance downstream with a greater rate of change than FW 1 while TP was negatively correlated with distance downstream at a comparable rate of change downstream relative to FW 1 suggesting similar removal rates between FWs (Table 5). Soil TC:TP was positively correlated with distance downstream (Table 5) and a significant change point was detected along the FW 3 flow way transect (Estimate=0.78, ρ<0.05). Soil TC:TN was negatively correlated with distance downstream (Table 5) and a significant change point was detected along the FW 3 flow way transect (Estimate=0.71, ρ<0.05). Soil TN:TP was not significantly correlated with distance downstream (Table 5), however a significant change point was detected along the FW 3 flow way transect (Estimate=0.71, ρ<0.05)
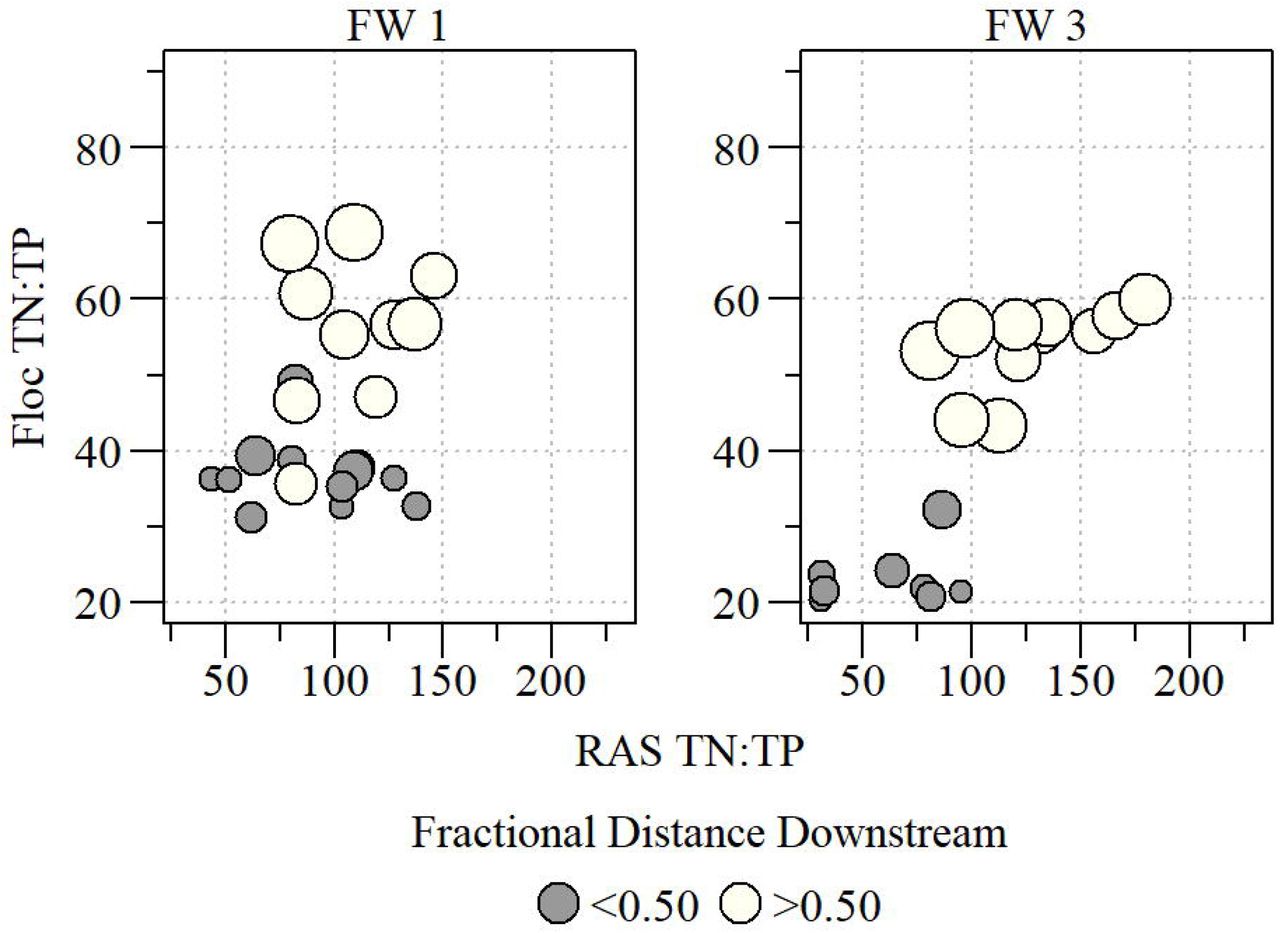
Floc and soil N:P molar ratios were significantly correlated for sites within FW 3 (r=0.85, ρ<0.01). In FW 3, the distribution of the data formed what appears to be an S-shaped curve with sharp transition in floc N:P ratio when soil N:P is approximately 100 (Fig 5), but not in FW 1. Furthermore, both floc (χ2=20.41, ρ<0.01) and soil (χ2=4.67, ρ<0.05) N:P molar ratios were significantly different along FW 3 between the two distance categories. Within FW 1, floc and soil N:P was not significantly correlated (r=0.28, ρ=0.21) and qualitatively the floc-soil relationship within FW 1 appears to be different than that of FW 3 where the upper arm of the S-curve is missing for FW 1 (Fig 5). The lack of an “upper arm” in the FW 1 floc-soil relationship could indicate the floc compartment has not reached saturation or microbial decomposition dynamics differ. Despite the difference in the floc-soil N:P relationships between the two FWs, N:P molar ratios were significantly different between the two distance classes in FW 1 for floc (χ2=19.44, ρ<0.01) and soil (χ2=4.35, ρ<0.05).

Comparison of floc and soil TN:TP molar ratio with location along the flow-way identified by size of point (i.e. larger point further down flow path) and distance categories.
Vegetation C:N:P dynamics
During the vegetation sampling within FW 1 three EAV species were sampled including cattail, sawgrass and Nymphaea odorata Aiton (water lily) with cattails accounting for most of the samples collected. Within FW 3, a mix of SAV species were sampled including muskgrass, pondweed and southern naiad with muskgrass being the most common. Plant tissue TP concentrations from both FWs 1 and 3 ranged from 87.2 to 4,693 mg kg-1 with vegetation within FW 3 having higher absolute tissue TP concentrations (Table 2). Plant tissue TN concentrations ranged from 4.0 to 48.7 g kg-1 and TC concentrations ranged from 186 to 464 g kg-1 with FW 3 having higher tissue TN and FW 1 having higher tissue TC concentrations (Table 2). Living AGB molar ratios of TC to TP ranged from 205 to 13,012, TC to TN ranged from 6.4 to 100 and TN to TP ranged from 4.6 to 146 with FW 1 having higher TC:TP and TC:TN ratios and FWs 3 having higher TN:TP ratios (Table 2). Much like the other compartments, variability in TP was greatest amongst the other nutrient parameters with an overall coefficient of variance of 82.0% while between FWs, FW 1 had a higher coefficient of variance with 83.1% and FW 3 having a coefficient of variance of 72.7%.
Much like the other ecosystem compartments living-AGB TC-TP, TC-TN and TN-TP models for FWs 1 and 3 resulted in slopes significantly different than one (Table 3) suggesting that nutrient concentrations within vegetation do not proportionally scale. Between FWs, TC-TP and TC-TN models appear to converge at the higher TP and TN concentrations, respectively (Fig 2). While TN-TP models between FWs seem to gradually diverge from one another (Fig 2). Living-AGB TP and TN concentration were negatively correlated while TC concentration was positively correlated with distance downstream along the FW 1 flow way transect (Table 5). Meanwhile, living-AGB TC:TP, TC:TN and TN:TP along the FW 1 flow way transect was positively correlated with distance downstream (Table 5 and Fig 4). Similarly, living-AGB TP and TN concentrations were negatively correlated with distance downstream along the FW 3 flow way transect (Table 5). Living-AGB TC concentration along the FW 3 flow way transect was not significantly correlated with distance downstream (Table 5). As observed along the FW 1 flow way transect TC:TP, TC:TN and TN:TP were positively correlated with distance downstream (Table 5 and Fig 4).
Discussion
Surface Water Stoichiometric Relationships
(Redfield 1958) focused on the composition of inorganic fractions of C and nutrients of deep ocean waters. This emphasis on inorganic nutrients have carried forward because of the relative homogenous reservoir of inorganic nutrients in the deep ocean (Guildford and Hecky 2000). However, in freshwater ecosystems nutrient availability can be highly variable, analytical methods can be tenuous and interpreting inorganic nutrient data can be problematic (Guildford and Hecky 2000; Dodds 2003). Furthermore, biogeochemical cycling of nutrients in freshwater ecosystems is influenced by the ability of some biota to utilize dissolved and particulate inorganic and organic fractions with the organic fractions being utilized via enzymatic hydrolysis (Bergström 2010). Therefore some studies have successfully used total nutrient fractions to indicate nutrient limiting status and trophic dynamics across the freshwater-to-marine aquatic continuum (Downing 1997; Guildford and Hecky 2000)
The Everglades STAs are optimized to effectively remove P from the water column (Chen et al. 2015). This process is completed through a combination of physical removal and biological uptake. Physical removal of P is done through settling and entrainment of particulate P while biological uptake removes P from the water column through metabolic uptake along a given flow path (Kadlec and Wallace 2009). Therefore, changes in nutrient stoichiometry within and between FWs (Fig 2 and 4) can be the result of biological or physical configurations of the treatment system. The extreme variability in aquatic stoichiometric relationships among the FWs, especially DOC:TP could be attributed to vegetation mediated dynamics, nutrient uptake and OM decomposition (Fig 2). Flow-way 3 of STA-2 is a SAV dominated system where the sequestration of P is facilitated partly by the co-precipitation of calcite (Dierberg et al. 2002). Meanwhile, FW 1 is an EAV dominated system where particle entrainment and P mining from soils by vegetation and microbial decomposition are dominate nutrient uptake mechanisms (Reddy and DeLaune 2008). This difference in P removal mechanisms could explain the variability in the water column DOC:TP relationship and to some extent TN:TP where FW 3 is less reliant on microbial decomposition but rather SAV-geochemical mediated P removal (Fig 2). Another line of evidence is the distance downstream trend in DOC concentrations where DOC declines along the flow path in FW 1 while FW 3 remains relatively constant (Fig 4). This difference may indicate microbial consumption of DOC via decomposition of dissolved OM (DOM) within FW 1 (Qualls and Haines 1992; Cleveland et al. 2004), and is less likely the product of changes in vegetation, as TC in vegetation declines in FW 3 but not FW 1.
Soil Stoichiometric Relationships
Redfield (1958) concluded that the elemental composition of plankton was “uniform in a statistical sense…”. Several studies have taken this approach to explain the relatively consistent elemental composition in other ecosystems and ecosystem compartments (Cleveland and Liptzin 2007; Xu et al. 2013). Cleveland and Liptzin (2007) determined that much like marine plankton and oceanic water, soil and soil microbial biomass are well-constrained at the global scale across forest and grassland ecosystems. Despite significant differences in nutrient stoichiometry between forest and grassland ecosystems, Cleveland and Liptzin (2007) concluded that similarities in soil and microbial element ratios among sites and across large scales were more apparent than different. Xu et al. (2013) presented comparable results with a larger dataset spanning several other ecosystems including natural wetlands and concluded that soil and microbial nutrient stoichiometry vary widely among ecosystems. Cleveland and Liptzin (2007) estimated the “Redfield-like” stoichiometric ratios of C, N and P in soil as 186:13:1, while Xu et al. (2013) estimated a global average soil C:N:P of 287:17:1. Additionally, Xu et al. (2013) demonstrated the soil stoichiometric ratios of natural wetlands to be 1347:72:1. It is clear that stoichiometric relationships in soil are variable between ecosystems as presented by Cleveland and Liptzin (2007) and Xu et al. (2013) with C being the most variable stoichiometric component along the ecosystem continuum.
The stoichiometric relationships apparent in the Everglades STAs lacks the degree of proportional (allometric) scaling (this study) and diverges from the “Redfield-like” relationships demonstrated in previous studies at an ecosystem and global scale (Cleveland and Liptzin 2007; Xu et al. 2013). However, this study provides a unique case for applying stoichiometric relationships to understand nutrient cycling and transformations between soil and water column along an enriched nutrient gradient. Unlike relationships presented by prior studies C and P concentrations were not well-constrained (Fig 2) between EAV and SAV communities and exhibit a strong non-linear relationship despite sharing the same source water. The response of C and P in the Everglades ecosystem is driven largely by the P limiting nature of the natural system combined with high loading of P from upstream sources (Chen et al. 2015). Meanwhile, C and N dynamics are somewhat constrained (Table 4) and following a near linear relationship (Fig 2) in the soil compartment. Within the Everglades the majority of TN is comprised of organic nitrogen as indicated by the strong near-linear relationship with C and N for most compartments (Fig 2) (Julian et al. 2016b). Overall the allometric (disproportional) relationships between C, N and P suggested the relative decoupling of P as OM accumulation driven by the rapid consumption of inorganic P (Corstanje et al. 2016), the decomposition of OM, and the utilization of labile organic P as indicated by changes in enzyme activities along the treatment FW (Inglett, et al., unpublished data). This decoupling could potentially indicate a more efficient use of P release from the organic pools along the flow path gradients and/or the interaction of mineral and organic pools as in the case of STA-2 FW 3 (Supplemental Fig 2). This decoupling of P cycling from OM accumulation is also hypothesized to occur in forested ecosystems where P is often limiting (Johnson et al. 2003; Cleveland and Liptzin 2007).
The stoichiometric relationships apparent in the STAs are consistent with relationships observed within the Everglades marsh (Julian et al. 2016a). In addition to direct loading, nutrient inputs in the form of senescent plant material can play a significant role in soil biogeochemistry, especially toward the back-end of the treatment FW where external inputs are reduced and internal loading drives nutrient cycling. The role of litter fall and its decomposition plays a significant role in internal nutrient cycling by enriching the soil OM through initially increasing both C and N concentration. Litter N is known to be conserved during decomposition processes ultimately enriching the soil below while C is lost due to microbial respiration. As litter decomposes soil TN concentrations increase, thereby soil TC:TN ratios decrease (Melillo et al. 1989; Julian et al. 2016a). During this study soil and floc TC:TN varied along flow path (Table 4 and Fig 4) where soil TC:TN values begin to increase toward the back third of the FW 3 suggesting a change in biogeochemical drivers such as enzyme activity microbial composition (Inglett, et al., unpublished data), substrate composition and deposition environment (i.e. redox, electron acceptor availability, etc.).
Unlike the conservative nature of N, P is rapidly cycled with internal nutrient regeneration from OM decomposition being more important than external inputs (Verhoeven et al. 1988). Phosphorus enrichment reduces net nutrient regeneration from senescent litter but increases nutrient regeneration in soil (Newman et al. 2001) suggesting that P-enrichment accelerates decomposition by increasing microbial activity. Newman et al. (2001) also observed soil TC:TN values indicating the potential for N mineralization which with the addition of P would alleviate P-limited microbial activity thereby releasing inorganic N via mineralization of organic matter. As demonstrated by changes along the flow paths (Table 5) and the variability of nutrient availability (Table 2 and Fig 4), biogeochemical cycling and contributions from different ecosystem compartments can be variable along the flow-paths as P concentrations are reduced lowering the enrichment potential. Furthermore, soil C:N values significantly decline (Table 5) along the flow paths suggesting the potential for N-mineralization which could imply differential nutrient limitations and mineralization processes along the flow path. This is especially apparent in FW 3, an SAV dominated community suggesting vegetation dynamics drive can influence biogeochemical cycling of nutrients when comparing the two flow paths.
Soils are long term integrators of environmental conditions where nutrient concentrations and availabilities are driven by external inputs (i.e. loading) and the interaction of biota and microbial communities dictate biogeochemical cycling (DeBusk and Reddy 2003). Moreover, nutrient concentrations and availability can significantly vary along environmental gradients (i.e. flow, vegetations, soil type) and spatial scales. Variability of nutrient stoichiometric estimates are apparent between local (i.e. STA; this study), ecosystem (i.e. Natural Wetland; Xu et al. 2013) and global scales (Cleveland and Liptzin 2007; Xu et al. 2013). This continuum of spatial scale (fine to course) is contrasted by a temporal component as indicated by net ecosystem productivity with tropical and subtropical ecosystems typically have longer periods of warmer conditions and prolonged photoperiods which facilitates longer and more frequent growing seasons of comparable ecosystems in more temperate regions which can significant influence biogeochemical cycling rates (Kadlec and Wallace 2009). Given the ecosystem level biophysical difference between tropical and temperate ecosystems, nutrient, cycling and demand will vary along this continuum (Kadlec and Wallace 2009; Xu et al. 2013).
Soil – Floc Interaction and Stoichiometry
Floc is a complex matrix of microbes, organic particles (i.e. cellular detritus) and inorganic particles (clays and silts) with substantial inter-floc spaces analogous to pore space in soils are formed from a variety of physical, chemical and biological processes (Droppo 2001). In the Everglades system, floc material is largely derived from senescing periphyton and macrophytes with very little to no terragenic sediments (Noe et al. 2001, 2003). This matrix of biologic, chemical and geologic material is ecologically important in aquatic systems due to its ability to act as a source or sink of nutrients to the overlaying water column ultimately influencing a variety of biogeochemical processes including nutrient cycling primarily through microbial activity. Furthermore floc represents the beginning of soil OM diagenesis in natural wetland ecosystems (Noe et al. 2003; Neto et al. 2006).
As observed elsewhere, floc and soil represent stoichiometric intermediaries between microbial and higher plant end-members. (Neto et al. 2006) evaluated floc and soil C:N ratios along a freshwater-to-marine transect suggesting a mixed source of OM to these compartments with a decoupling of C to N suggesting variable remineralization rates in soil relative to floc. In our study, floc and soil follow the same pattern as (Neto et al. 2006) in that N:P ratios of floc and soil are an apparent mixture of microbial biomass (TN:TP < 14; Xu et al. 2013) and EAV (TN:TP > 45; Table 2) or SAV (TN:TP > 60; Table 2). Additionally, this mixing is accompanied by a co-variate of distance downstream (Fig 5) where floc TN:TP values in the inflow-to-mid region of the treatment FW (fractional distance <0.5) are generally lower than TN:TP values in the mid-to-outflow region (fractional distance >0.5) potentially indicating shifts in OM decomposition or selective nutrient removal processes (Fig 5). Floc and soil TN:TP lacked any correlation potentially indicating selective removal or variable nutrient remineralization rates in FW 1 while in FW 3 floc and soil TN:TP were significantly correlated again suggesting variability in nutrient removal processes but also potential variability in N or P remineralization rates driven by different microbial communities and enzyme activities (Inglett, et al., unpublished data).
Conclusion and Further Research
Prior studies of stoichiometry suggest that the relationship between C and nutrients is tightly constrained and C:N:P stoichiometric relationships are relatively constrained and consistent with elemental composition of dominate phototrophs (i.e. algae and phytoplankton) in the water column and microbial biomass in soil. However, at a finer scale exemplified in this study nutrient stoichiometric relationship within treatment wetlands potentially decouple through processes such as enrichment, disruption of biotic-feedback loops, variable mineralization rates or selective removal of water column constituents via biotic uptake or physical settling. These processes translate across floc, soil and vegetation where stoichiometric relationship vary between compartments driven by biotic and physical processes.
At the onset of this study three hypotheses were suggested, the first hypothesis that nutrient stoichiometry was tightly constrained across ecosystem compartments was rejected as nutrient concentrations did not proportionally in each ecosystem compartment or study FW with a few exceptions (FW 1 Floc TC-TP and FW 1 Soil TN-TP). The second hypothesis related to observed shifts in nutrient stoichiometry due to ecosystem level biogeochemical processes was accepted due to the significant changes of nutrient stoichiometry relative to distance downstream and between flow paths were apparent. The final hypothesis that stoichiometry between ecosystem compartments significantly differed between flow paths was accepted as each flow path driven by its biota cycle and retain nutrients differently, especially relative to C and N dynamics. Future studies should address the potential for preferential removal and utilization of nutrients for different substrates and organism (uptake and mining in macrophytes, immobilization of nutrients), perhaps coupled with a modeling study that addresses the resulting accumulation in vegetation, floc and soil following the nutrient driven changes in biogeochemical cycles.
Conflict of Interest Statement
The authors declare that they have no conflict of interest.
Acknowledgements
We would like to SFWMD and UF Wetland Biogeochemistry Laboratory staff members for field and analytical support. We would also like to thank Mark Brenner, K. Ramesh Reddy, Odi Villapando, Delia Ivanoff and the anonymous peer reviewer(s) and editor(s) for their efforts and constructive review of this manuscript. Financial support for this project was provided by the South Florida Water Management District (Contract #4600003031).
References


