

ABSTRACT
The polyhydroxyalkanoates are a group of microbially-produced biopolymers that have been proposed as sustainable alternatives to several oil-derived plastics. However, polyhydroxyalkanoates are currently more expensive to produce than oil-derived plastics and therefore, more efficient production processes would be desirable. Cell-free transcription-translation-based metabolic engineering strategies have been previously used to optimise several different biosynthetic pathways but not the polyhydroxyalkanoates biosynthetic pathways. Here we have developed several Escherichia coli cell-free transcription-translation-based systems for in vitro prototyping of polyhydroxyalkanoates biosynthetic operons, and also for screening relevant metabolite recycling enzymes. These cell-free transcription-translation reactions were customised through the addition of whey permeate, an industrial waste that has been previously used as a low-cost feedstock for optimising in vivo polyhydroxyalkanoates production. We found that the inclusion of an optimal concentration of whey permeate enhanced relative cell-free GFPmut3b production by ~20% compared to control reactions that did not include whey permeate. An analysis of pH in our cell-free reactions suggests that the observed increase in GFPmut3b production was likely through enhanced ATP generation, as a consequence of the glycolytic processing of lactose present in whey permeate. We also found that whey permeate enhanced cell-free reactions produced ~3μM (R)-3HB-CoA, whilst, coupled cell-free biotransformation/transcription-translation reactions produced a ten-fold greater yield of (R)-3HB-CoA. These reactions were also used to characterise a Clostridium propionicum propionyl CoA transferase enzyme that can recycle Acetyl-CoA. Together our data demonstrate that cell-free approaches can be used to complement in vivo workflows for identifying additional strategies for optimising polyhydroxyalkanoates production.
1. Introduction
The mass production of oil-derived plastics has resulted in widespread and potentially irreversible global ecological damage (Eriksen et al., 2014; Suaria et al., 2016). Despite these environmental consequences, oil-derived plastics are still in very high-demand, due to their versatility and low-cost of production, that even with improvements in recycling processes, de novo plastic production has not been reduced (Geyer et al., 2017). Moreover, the societal and technological challenges that are associated with the introduction of more sustainable alternatives to oil-derived plastics are significant, several of which have been extensively reviewed (Kishna et al., 2017; Kourmentza et al., 2017). Synthetic biology is a field that is driven by the development and carefully-considered implementation of rationally-engineered biotechnologies that might help to address local or global challenges (Kelwick et al., 2015a, 2014; Tait, 2017; Webb et al., 2017, 2016). Developments in synthetic biology, along with a continuum of advancements in metabolic engineering, could potentially enable the routine and highly scalable production of microbially-produced biopolymers, such as polyhydroxyalkanoates (PHAs) (Chen et al., 2017; Gustavsson and Lee, 2016; Kelwick et al., 2015b; Lee, 2006; Meng and Chen, 2017). PHAs share several material characteristics with some of the most widely used oil-derived plastics, but beneficially, PHAs are also biodegradable (Dietrich et al., 2017; Z. Li et al., 2016). In order to develop PHAs as viable alternatives to oil-derived plastics, great efforts have been undertaken to design more efficient microbial PHAs production processes through the rational engineering of biosynthetic pathways (Hiroe et al., 2012; Kelwick et al., 2015b; T. Li et al., 2016; Tao et al., 2017), metabolite recycling processes (e.g. Acetyl-CoA) (Beckers et al., 2016; Ken’Ichiro Matsumoto et al., 2013) and the use of industrially-sourced, low-cost feedstocks (e.g. whey permeate) (Ahn et al., 2000; Cui et al., 2016; Kim, 2000; Nielsen et al., 2017; Nikel et al., 2006; Wong and Lee, 1998). Alternative, enzymatic approaches for the production of PHAs have also been investigated (Han et al., 2011; Opgenorth et al., 2016; Thomson et al., 2010).
From these extensive studies, we reasoned that cell-free transcription-translation (TX-TL) systems could be used to efficiently characterise different PHA biosynthetic operons. Indeed, cell-free TX-TL systems have been widely used as prototyping platforms for characterising DNA based parts, devices and systems including: DNA regulatory elements (Chappell et al., 2013; Garamella et al., 2016; Kelwick et al., 2016), increasingly complex genetic circuits (Hori et al., 2017; Niederholtmeyer et al., 2015; Shin and Noireaux, 2012; Sun et al., 2014; Takahashi et al., 2015) and cell-free medical bioreporter devices (Pardee et al., 2014; Slomovic et al., 2015; Wen et al., 2017). These cell-free applications have also renewed interest in cell-free metabolic engineering approaches for in vitro enzyme screening and prototyping of entire biosynthetic pathways (Dudley et al., 2015; Goerke et al., 2008; Hodgman and Jewett, 2012; Jewett et al., 2008; Karim and Jewett, 2016; Pardee et al., 2016; Ullah et al., 2016). Importantly, extract-based cell-free systems enable the in situ characterisation of enzymes and biosynthetic pathways within a metabolic context that is representative of the production strain (Karim et al., 2016). Since cell extracts contain not only the TX-TL machinery needed to express a biosynthetic operon but also relevant enzyme co-factors and potentially competing metabolic pathways, cell-free metabolic engineering approaches can be used to identify novel strategies that improve the in vivo activities of biosynthetic pathways (Perez et al., 2016). Yet, interestingly cell-free TX-TL systems have not been previously used to characterise PHA biosynthetic pathways. Here we report the development of several cell-free approaches for prototyping PHA biosynthetic operons that could be used in combination with in vivo strategies for optimising PHAs production.
2. Materials and Methods
2.1 Bacterial strains, constructs and growth conditions
All constructs and bacterial strains used in this study are listed in Supplementary Table 1. E. coli NEB10-beta was used for cloning, whilst E. coli MG1655 was used for experiments. For plasmid recovery E. coli strains were grown in Luria-Bertani (LB) supplemented with either 34 μg/ml Chloramphenicol (final concentration), 100 μg/ml Ampicillin (final concentration) or 50 μg/ml Kanamycin (final concentration), as appropriate, at 37°C, with shaking (220 rpm).
2.2 Construct assembly
The empty vector negative control constructs EV_101 (BBa_J23101; pRK21) and EV_104 (BBa_K608002; pRK4) were originally sourced from the 2013 distribution of the iGEM Registry of Standard Biological Parts (partsregistry.org). EV_104 was transformed into chemically competent E. coli MG1655 to create strain S_RK001. phaCAB bioplastic operon constructs: The native-phaCAB construct (BBa_K934001; pRK51) was transformed into E. coli MG1655 to create strain, S_RK002. The constitutive 104 phaCAB operon construct (C104 - BBa_K1149052; pRK61) was transformed into E. coli MG1655 to create strain, S_RK003. The native (pRK51) and C104 (pRK61) phaCAB constructs are also available in the iGEM Registry of Standard Biological Parts (partsregistry.org) and were also reported in our previous study (Kelwick et al., 2015b). To generate a constitutive phaCAB-operon with an inactive PhaC enzyme, PCR reactions were undertaken using PCR primer pairs PhaCCys319Ala_F (RK007) and PhaCCys319Ala_R (RK008) with C104 (pRK61) as the DNA template. The resultant PCR product was digested with DpnI restriction enzyme, phosphorylated, self-ligated (Quick Ligase - New England Biolabs, UK) and transformed into E. coli NEB10-beta, resulting in phaCAB-operon strain/plasmid, C104ΔPhaC_C319A (pRK7). This plasmid was then purified from E. coli NEB10-beta using the Qiaprep Spin Miniprep Kit (Qiagen, Germany) and transformed into E. coli MG1655 competent cells, resulting in E. coli MG1655 strain S_RK004.
To generate the GFP expression plasmid (101_GFP), plasmid pRK1 was digested with XbaI and PstI to generate a fragment containing the RBS B0034, gfpmut3b and terminators B0010 and B0012. This fragment was ligated (Quick Ligase - New England Biolabs, UK) into a SpeI and PstI digested EV_101 backbone (pRK3) and transformed into E. coli NEB10-beta to create plasmid/strain, pLR036. pT7 constructs: A negative control, empty vector, encoding a T7 promoter (BBa_I719005; pRK9) was originally sourced from the 2013 distribution of the iGEM Registry of Standard Biological Parts (partsregistry.org).
Plasmid pT7_PCT (pRK12) was generated to enable inducible expression of the propionyl CoA transferase (PCT) gene from Clostridium propionicum. To generate the construct the pct gene sequence was obtained from GenBank (AJ276553.1) and then synthesised as a GeneArt String DNA fragment (Life Technologies, USA). The GeneArt String DNA fragment was blunt-end cloned, using the Zero Blunt PCR Cloning Kit (Life Technologies, USA), into pCR-Blunt vector according to the manufacturer’s instructions – producing plasmid (pRK11). Afterwards, a PCR reaction was carried out using primers F1_PCT-FW (RK011) and F1_PCT-RV (RK012), where plasmid pRK11 served as the DNA template. The resultant PCR product generated a pct encoding DNA fragment. Additionally, a PCR reaction was carried out using primers T7_INF_FWD (RK009) and T7_INF_REV (RK010), where plasmid pRK10 served as the DNA template. The resultant PCR product generated a linearised plasmid vector. The PCR products from both reactions were used in an In-Fusion cloning reaction (Takara Bio, USA) and 2.5 μl of the completed reaction was transformed into NEB10-beta producing strain/plasmid pRK12 The DNA sequences of all inserts/constructs were verified by the sequencing service provided by Eurofins Genomics GmbH (Ebersberg, Germany). Primers used for sequencing and cloning are listed in Supplementary Table 2.
2.3 Preparation of cell extracts
To prepare cell-free extracts, E. coli MG1655 cells were revived from glycerol stocks onto 2x YTP plates (31 g/L 2x YT, 40 mM potassium phosphate dibasic, 22 mM potassium phosphate monobasic and 15 g/L agar). Once streaked, plates were incubated overnight at 37°C. Individual colonies were inoculated into 5 ml 2x YTP medium (31 g/L 2x YT, 40 mM potassium phosphate dibasic and 22 mM potassium phosphate monobasic) and incubated overnight with shaking (220 rpm) at 37°C. 2.5 ml aliquots of the resultant cultures were used to inoculate flasks containing 50 ml 2x YTP medium. These cultures were then incubated at 37°C with shaking (220 rpm) until the cell density reached an 0D600nm of 2. Finally, 25 ml of the resultant cultures were used to inoculate flasks containing 500 ml 2x YTP medium. These cultures were subsequently incubated at 37°C with shaking (220 rpm) until cell density reached an 0D600nm of between 2 to 3. For the preparation of cell extracts from strain S_RK004, the cells were cultured using these same conditions except that 2x YTP plates and media were also supplemented with 34 μg/ml Chloramphenicol.
To harvest cells, 500 ml cultures were centrifuged at 3,220 g for 15 minutes. Cell pellets were re-suspended into 20 ml S30-A buffer (14 mM Magnesium (Mg) glutamate, 60 mM Potassium (K) glutamate, 50 mM Tris, 2mM DTT, pH 7.7) and transferred into a pre-weighed 50 ml Falcon tube. Each 50 ml Falcon tube was centrifuged (2,000 g, 10 min, 4°C), pellets washed with 20 ml S30-A buffer and subsequently re-centrifuged (2,000 g, 10 min, 4°C) to form the final cell pellets in preparation for cell lysis. To determine the weight of the cell pellet, the weight of the 50 ml falcon tube was subtracted from the combined weight of the 50 ml tube and cell pellet. Pellets were stored at -80°C for no more than 48 h, prior to cell lysis.
To lyse the cells, pellets were defrosted on ice and re-suspended into 1 ml S30-A buffer per gram of cell pellet and aliquoted as 1 ml samples in 1.5 ml microtubes. Samples were sonicated on ice (3 x 40 seconds with 1-minute cooling interval; output frequency: 20 KHz; amplitude: 50%) and then centrifuged (12,000 g at 4°C for 10 min). The supernatants were removed, aliquoted at 500 μl into 2 ml screw cap tubes and incubated with shaking (220 rpm) at 37°C for 80 min. Post pre-incubation, samples were stored on ice and then centrifuged (12,000 g at 4 °C for 10 min). Supernatants were removed and were aliquoted into dialysis cassettes (GeBAflex-Maxi Dialysis Tubes - 8 kDa MWCO, Generon) for dialysis into S30-B buffer (14 mM Mg-glutamate, 60 mM K-glutamate, ~5 mM Tris, 1mM DTT; pH 8.2) with stirring at 4°C for 3 hr. Post-dialysis samples were centrifuged (12,000 g at 4 °C for 10 min), the extract supernatants were aliquoted into 1.5 ml tubes, flash frozen in liquid nitrogen and stored at -80°C for use in cell-free reactions.
2.4 Cell-free transcription-translation reactions
Cell-free transcription-translation reactions consisted of three parts mixed together in the indicated ratios: cell extract (33% v/v), energy buffer (42% v/v) and plasmid DNA (25% v/v). The final reaction conditions were: 8 mM Mg-glutamate, 260 mM K-glutamate, 1.5 mM each amino acid (except leucine - 1.25 mM leucine), 1.5 mM of both ATP and GTP, 0.9 mM of both CTP and UTP, 1.5 mM spermidine, a range (05.748 g/L) of Molkolac instant demineralised whey permeate (Orchard Valley Food Ingredients, UK), 0 or 100 μM (final concentration) SNARF-5F pH sensitive dye (Invitrogen, USA) and 10 nM (final concentration) plasmid DNA. For analysis of cell-free GFP production or pH, 10 μl cell-free reactions were aliquoted into individual wells of 384-well plates (Griener bio-one, NC, USA) and measured using a Clariostar plate reader (BMG, UK) with the following settings: GFP - excitation 483-14 nm and emission 530-30 nm, for pH - excitation 514 nm and the ratio of two different emissions, 580/640 nm were measured and used in conjunction with a calibration curve (Supplementary Figure 1). Plates were sealed, shaken prior to each reading cycle (500 rpm) and the plate reader was set to incubate the cell-free reactions at 30°C. For gas chromatography-mass spectrometry (GC-MS) analysis of 3HB content in cell-free transcription-translation reactions, the reactions were scaled up to 30 μl and were incubated in 1.5 ml tubes at 30°C for 5 h. Cell-free transcription-translation reactions were then treated with 30 μl ice cold acetonitrile, centrifuged (12,000 g at 4 °C for 10 min) and the resultant supernatants were used for downstream GC-MS analysis. For analysis of Acetyl-CoA content in cell-free transcription-translation reactions the reactions were scaled up to 30 μl and were incubated in 1.5 ml tubes at 30°C for 1 h. These samples were then deproteinised according to the manufacturer’s instructions in the PicoProbe Acetyl CoA Fluorometric Assay Kit (Abcam, UK). Briefly, cell-free samples were deproteinised using perchloric acid then neutralised with 3 M KHCO3 as per the kits instructions.
2.5 Cell-free biotransformation reactions
For GC-MS analysis of 3HB content in cell-free biotransformation reactions, 30 μl cell-free reactions were setup and consisted of three parts mixed together in the indicated ratios: cell extract (33% v/v), energy buffer (42% v/v) and plasmid DNA (25% v/v). The final reaction conditions were: 8 mM Mg-glutamate, 260 mM K-glutamate, 1.5 mM each amino acid (except leucine - 1.25 mM leucine), 1.5 mM of both ATP and GTP, 0.9 mM of both CTP and UTP, 1.5 mM spermidine, 0 or 0.004 g/L Molkolac instant demineralised whey permeate (Orchard Valley Food Ingredients, UK), 0 or 25 units T7 RNA polymerase and 0 or 10 nM (final concentration) of pT7_PCT (pRK12) plasmid DNA. Cell-free biotransformation reactions were incubated in 1.5 ml Eppendorf tubes at 30°C for 0 or 5 h at 30°C. The cell-free biotransformation reactions were then treated with 30 μl ice cold acetonitrile, centrifuged (12,000 g at 4 °C for 10 min) and the resultant supernatants were used for downstream GC-MS analysis. For analysis of acetyl-CoA content in cell-free biotransformation reactions, 30 μl reactions were incubated in 1.5 ml tubes at 30°C for 0 or 2.5h. These samples were then deproteinised according to the manufacturer’s instructions in the PicoProbe Acetyl CoA Fluorometric Assay Kit (Abcam, UK). Briefly, cell-free samples were deproteinised using perchloric acid then neutralised with 3 M KHCO3 as per the kits instructions.
2.6 SNARF-5F pH calibration curve
A pH-sensitive calibration curve was generated using the SNARF-5F dye, 5-(and-6)-carboxylic acid (Invitrogen, USA). The dye was dissolved in DMSO at 1 mM and stored at +4° C. SNARF-5F was diluted to 100 μM (final concentration) in 10 μl (total volume) of a range of different 100 mM Tris buffers (final concentration) that were set, using 0.5 M acetic acid, at a range of defined pH strengths. 10 μl aliquots of these mixtures were aliquoted into individual wells of a 384-well plate (Greiner bio-one, NC, USA). End-point fluorescence measurements were carried out using a Clariostar plate reader (BMG, UK) set to an excitation of 514 nm and a ratio of two different emissions, 580/640 nm. From the calibration curve a third order polynomial fitting was developed to extrapolate the pH values from the fluorescence 580/640 nm emissions ratio. These calibration curve data are shown in Supplementary Figure 1.
2.7 3-hydroxybutyric acid detection in cell-free samples using GC-MS
The cell free samples were subjected to trimethylsilylation reaction for the detection of 3-hydroxybutyric acid (3-HB) production using GC-MS. The 3-HB samples were centrifuged for 5 mins at 13,500 rpm, then 40 μl of the supernatant was dried under a gentle nitrogen stream. To the dried samples, 90 μl of MSTFA was added + MSTFA 1% TMCS silylation reagent (Thermo Fisher, part number: 11567851) and left to react at 37 °C for 30 minutes.
The commercial 3-HB standard (Sigma Aldrich, USA #54965-10G-F) was dissolved in methanol (Sigma Aldrich) at several different concentrations between the range of 0 μM to 200 μM in serial dilutions to generate a calibration curve (Supplementary Figure 2). 10 μl of the standards were then evaporated to dryness under a gentle nitrogen stream. The dried standards were treated with the trimethylsilylation reaction as described above.
The trimethylsilylated derivatised samples were analysed by GC-MS, using an Agilent Technologies 7890B GC and MSD 5977 series system with electron ionisation in SIM mode by monitoring ion with m/z value 117.1, 147.1, 191.1 and 233.0. Helium was used as the carrier gas. The temperatures of the injector and MS transfer line were 240°C and 250°C respectively, whereas MS quadrupole and MS source were 150°C and 250°C respectively. The samples were analysed with an injection volume of 1 μL, at a split ratio of 10 to 1. A temperature program was used for separation of the trimethylsilylated 3HB: initial temperature is 80°C, temperature increase 30°C/minute until 123°C, temperature increase 1°C/minute until 128°C, temperature increase 60°C/minute until 280°C, and hold for 3 minutes, followed by 0.5 minutes post run at 80°C.
2.8 Acetyl-CoA Assay
Acetyl-CoA content was quantified using the PicoProbe acetyl-CoA assay kit (ab87546, Abcam, UK). The 0-100 pM range acetyl-CoA standard curve was generated with a correlation coefficient of 0.9982 (Supplementary Figure 3). In order to correct for background (free CoASH and succ-CoA) in cell-free samples, as per the manufacturer’s instructions, CoASH Quencher and Quencher remover were used. Samples were then diluted with the reaction mix and fluorescence was measured (Excitation 535, Emission 589 nm) using a Clariostar plate reader (BMG, UK).
2.9 Nile Red plate assay
Nile Red plate assays for qualitative detection of PHAs were carried out as previously described (Kelwick et al., 2015b). Briefly, E. coli MG1655 transformed with either a negative control plasmid (EV_104) or a phaCAB operon (Native, C104, or C104 Δ(PhaC_C319A) were grown in 5 ml 2xYT+P media (supplemented with 34 μg/ml Chloramphenicol) overnight at 37°C with shaking (220 rpm). Liquid cultures were then streaked onto 2xYT+P-agar plates supplemented with 34 μg/ml Chloramphenicol, 0.5 μg/ml of Nile Red stain (Sigma-Aldrich, MO, USA, #72485-100MG) in 100% DMSO (v/v) and either 3% Glucose (w/v) or 120.48 g/L whey permeate. Nile Red plates were incubated for 24 h at 37°C and imaged using a Fuji Film LAS-5000 imager (Ex. 473 and Em. Cy5 filter).
2.10 Flow cytometry analysis of PHA production
Flow cytometry analysis of PHA content was carried out similarly to previous reports (Kelwick et al., 2015b; Lee et al., 2013). Briefly, E. coli MG1655 harbouring either a negative control plasmid (EV_104) or a phaCAB operon (Native, C104, or C104ΔPhaC_C319A) were grown overnight at 37°C in 5 ml of 2xYT+P medium supplemented with 34 μg/ml Chloramphenicol. The resultant cultures were diluted to an OD600nm of 0.8 in 6 ml of PHA production media; 2xYT+P supplemented with 34 μg/ml Chloramphenicol and 120.48 g/L Molkolac instant demineralised whey permeate (Orchard Valley Food Ingredients, UK), and were cultured at 37°C for 24 hours. Subsequently, 1 ml of each culture was centrifuged (7,200 g), washed with 1 ml 1X PBS, and fixed with 35% ethanol [v/v] at room temperature for 15 minutes. Post-fixation, cultures were centrifuged (7,200 g), re-suspended in 1ml 1X PBS and stained with Nile Red (Sigma-Aldrich, MO, USA, #72485-100MG) to a final concentration of 20 μg/ml (in 100% DMSO) for 10 minutes on ice. Nile Red stained E. coli were diluted (1:100) into 1X PBS before being loaded into an Attune NxT (ThermoFisher Scientific, MA, USA) flow cytometer. PHA content was determined via flow cytometry analysis of Nile Red staining (YL2-A+, Ex. 560 nm, Em. 610 nm). Flow cytometry data analysis was carried out using FlowJo (v 10.1) software. Doublets were removed during gating. The background signal, as determined by the average geometric mean (YL2-A) of the appropriate, Nile Red stained, empty vector transformed E. coli was removed and these data were normalised to native-phaCAB engineered E. coli.
2.11 PHA purification
PHA purification was carried out using a scaled down version of a previously reported sodium hypochlorite-based method (Heinrich et al., 2012; Kelwick et al., 2015b). Briefly, glycerol stocks of E. coli MG1655 strains harbouring either a negative control plasmid (EV_104) or a phaCAB-operon (native, or C104) were used to inoculate flasks containing 30 ml of 2xYT+P medium (supplemented with 34 μg/ml Chloramphenicol). These starter cultures were grown overnight, with shaking (220 rpm), at 37°C. The resultant cultures were then diluted to an OD600nm of 0.8 in 100 ml of PHA production media (2xYT+P media supplemented with 120.48 g/L whey permeate and 34 μg/ml Chloramphenicol (final concentration)). These PHA production cultures were then incubated at 37°C, with 220 rpm shaking, for 24 hours. Subsequently, 100 ml PHA production cultures were centrifuged at 4,200 rpm (Beckman J6-M1, USA) for 20 minutes. Post-centrifugation, bacterial cell pellets were re-suspended in 1X PBS, transferred into pre-weighed 50 ml tubes and centrifuged at 3,220 g for 15 minutes at 4°C. The supernatant from each 50 ml tube was removed and the cell pellets were dried at 70°C for 60 minutes and weighed. Dried cell pellets were re-suspended in 10 ml 1X PBS, centrifuged at 3,220 g for 15 minutes at 4°C, and the supernatant was discarded. Cell pellets were then suspended in 1X PBS with 1% Triton-X 100 (v/v in PBS) and then incubated for 30 minutes at room temperature. For the final PHA purification steps, cells were centrifuged at 3,220 g for 15 minutes at 4°C, washed with 1X PBS and then incubated with 12 ml aqueous sodium hypochlorite for 80 minutes at 30°C with 220 rpm shaking. The resultant purified PHA granules were centrifuged at 3,220 g for 30 minutes at room temperature, washed with distilled water and dried overnight at 37°C and then 2 hours at 70°C. To determine the weight of the dry cell pellets, the weight of the 50 ml tube was subtracted from the combined weight of the 50 ml tube and dry cell pellet. To determine the weight of the purified PHA, the weight of the 50 ml tube was subtracted from the combined weight of the 50 ml tube and PHA.
2.12 Monomer identification of in vivo produced PHAs using GC-MS
The P(3HB) and P(3HV) samples were subjected to methanolysis in a solution of 425 μl of methanol, 75 μl of sulphuric acid (6.6M) and 500 μl of dichloromethane in a small screw-top test tube and left to react for 3 hours at 100°C. After allowing the mixture to cool, 500 μL of dichloromethane and 1 ml of water were added; the mixture shaken vigorously for 1 minute followed by centrifugation at 4,000 rpm for 5 minutes. The organic phase was removed and transferred to a screw-cap glass vial. GC-MS analysis was performed on an Agilent Technologies 7890B GC and MSD 5977 series system with electron ionisation in scan mode. Helium was used as the carrier gas. The temperatures of the injector and MS transfer line were 240°C and 250°C respectively, whereas MS quadrupole and MS source were 150°C and 230°C respectively. The samples were analysed with an injection volume of 1 μl, at a split ratio of 14 to 1. A temperature program was used for efficient separation of the esters: 55°C for 3 minutes; temperature increase 15°C/minute until 200°C and hold for 3 minutes.
3. Results and discussion
3.1 Development of a whey permeate-based cell-free energy system
Conventional cell-free TX-TL reactions are broadly composed of three main components: a cell extract, an energy mix and the DNA construct (e.g. plasmid or linear PCR product) that encodes the protein, RNA/DNA based device or biosynthetic pathway that is being tested. Simplified, and/or automated cell extract preparation methods have led to improvements in cell-free performance (Krinsky et al., 2016; Kwon and Jewett, 2015; Sun et al., 2013). Likewise, changes in the composition and/or concentrations of cell-free energy mix components have also improved cell-free performance, largely through improved ATP regeneration, the recycling of inorganic phosphate and through the use of inexpensive single (e.g. glucose) or dual energy sources (e.g. maltose or maltodextrin and glutamate) that make optimal use of central metabolic pathways (e.g. glycolysis and tricarboxylic acid cycle) (Calhoun and Swartz, 2005; Caschera and Noireaux, 2015, 2014). Cell-free energy mixes can also be simplified through the rational testing and removal of unnecessary components that upon re-examination are largely historical artefacts from protocols that have now been superseded by improved cell-free methodologies. Such approaches have been used to develop minimal energy mixes that maintain cell-free performance but with seven fewer energy components than widely reported cell-free protocols (Cai et al., 2015).
Upon consideration of several cell-free methodologies, a fairly simplified cell extract preparation workflow was used in this study adapted from our previous cell-free work (Kelwick et al., 2016) and coupled with a recently reported glutamate-based minimal energy mix (Cai et al., 2015). Using these cell-free methods several batches of E. coli MG1655 TX-TL cell extracts and minimal energy mix were generated (see materials and methods 2.3 and 2.4). These cell-free reactions were customised for the purposes of characterising PHA biosynthetic pathways through the inclusion of whey permeate. Whey permeate is a waste by-product of industrial cheese production that has been proposed as an attractive low-cost feedstock for microbial PHAs production in vivo - particularly P(3HB) (Bosco and Chiampo, 2010; Ryan and Walsh, 2016). Whey permeate contains a high percentage of lactose (>70% of the mass), which can be readily metabolised in vivo by E. coli MG1655, using its β-galactosidase enzyme, to generate glucose for glycolytic processing into Acetyl-CoA (Pasotti et al., 2017). Acetyl-CoA can then directly feed into phaCAB biosynthetic operons where it is enzymatically processed by PhaA (3-ketothiolase) to form acetoacetyl-CoA. Subsequently, PhaB (acetoacetyl-CoA reductase) reduces acetoacetyl-CoA to form (R)-3-hydroxybutyl-CoA ((R)-3HB-CoA), which is finally polymerised by PhaC (PHA synthase) to form the final PHA polymer - poly-3-hydroxybutyrate (P(3HB)).
To determine whether whey permeate could be similarly metabolised in vitro a series of E. coli MG1655 cell-free TX-TL reactions were setup that included a minimal energy mix but with different concentrations of whey permeate (0-5.748 g/L) and a constitutive gfpmut3b expression plasmid (101_GFP) (Figure 1a). Cell-free TX-TL GFPmut3b production data are representative of three different cell extract batches (Figure 1). An endpoint (10 h) analysis of cell-free GFPmut3b production revealed that whey concentrations of at least 0.064 g/L could either partially or completely inhibit cell-free TX-TL activity (Figure 1b). It is likely that relatively high concentrations of whey permeate salts are responsible for this inhibitory effect (Supplementary Table 3). Indeed, previous reports have shown that the concentrations of different salts can significantly impact cell-free performance (Ge et al., 2011). We therefore used demineralised whey permeate which has been processed to lower its salt and mineral content. Lower concentrations of whey permeate were not inhibitory and interestingly 0.004 g/L of whey permeate enhanced relative cell-free GFPmut3b production by ~20% ± 7.5 (Figure 1b). Cell-free dynamics, in terms of the rate of cell-free GFPmut3b production, were also enhanced in cell-free reactions with 0.004 g/L of whey permeate in comparison to reactions that included the standard minimal energy mix (0 g/L) (Figure 1c).

(a) Schematic depicts whey permeate containing cell-free transcription-translation reactions that were used to test in vitro GFP protein production, (b) Endpoints (10 h) of cell-free reactions containing GFP expression plasmid (101_GFP) and 0 to 5.748 g/L whey permeate as indicated. The background fluorescence of cell-free reactions using negative control plasmid (EV101) were subtracted and these data were normalised to the relative fluorescence of cell-free reactions containing 0 g/L whey permeate, (c) Time-course analysis of GFP production in cell-free reactions which included GFP expression plasmid (101_GFP) and 0 or 0.004 g/L of whey permeate. The background fluorescence of cell-free reactions using negative control plasmid (EV101) were subtracted, (d) Time-course analysis of pH in cell-free reactions which included the negative control plasmid (EV101) and 0–5.748 g/L of whey permeate. Error bars denote standard error of the mean. Student t-test, **P<0.01.
The metabolism of whey permeate through glycolysis, is likely to lead to an increase in the production of lactate and acetate which have been previously shown to decrease the pH of cell-free TX-TL reactions (Kara and James, 2005). Previous reports have also shown that the coupling of maltose with glycolytic processing not only decreases the pH of cell-free reactions, through the production of lactate and acetate, but beneficially, enhanced glycolytic activity also increases ATP generation (Caschera and Noireaux, 2014). The pH of cell-free reactions can be measured using a pH sensitive fluorescent dye - known as SNARF-5F (see materials and methods 2.6). Similar to a previous report, we setup a SNARF-5F calibration curve to convert between dye fluorescence and pH (Supplementary Figure 1) (Caschera and Noireaux, 2014). The pH of cell-free reactions without whey permeate (0 g/L) was generally stable throughout the 10 h reaction (Figure 1d). Whereas the pH was slightly lower in cell-free TX-TL reactions with 0.004 g/L of whey permeate and the highest concentration tested (5.748 g/L) resulted in a significant pH drop from 6.2 to 5.6 (Figure 1d). Thus, an optimal whey permeate concentration is 0.004 g/L, which we found enhances in vitro protein production likely through increased ATP generation as a consequence glycolytic metabolism of lactose/glucose. Whey permeate was therefore included in subsequent prototyping experiments.
3.2 Cell-free TX-TL characterisation of PHAs biosynthetic operons
In our previous study, the native phaCAB operon from Cupriavidus necator was used to engineer several phaCAB operon variants that enhanced in vivo PHAs production in E. coli (Kelwick et al., 2015b). Amongst these variants, the C104 constitutive phaCAB operon (BBa_K1149052) was designed such that the native promoter and RBS were replaced by an Anderson constitutive promoter (BBa_J23104) and a strong synthetic ribosome binding site (RBS - BBa_B0034) (supplementary file 1). Previously, the C104 design enhanced in vivo P(3HB) production from glucose by up to three-fold in comparison to native phaCAB-engineered E. coli (Kelwick et al., 2015b). Since, the native and C104 phaCAB operons produce different levels of P(3HB) in vivo, several cell-free TX-TL experiments were designed to determine whether the differences in operon activity could be determined in vitro (cell-free).
Initial attempts to detect the cell-free TX-TL production of P(3HB) were based on several methods adapted from previously described liquid chromatography–mass spectrometry (LC-MS) and GC-MS approaches (de Rijk et al., 2005). However, these methods were found to be unreliable for detecting P(3HB) in cell-free TX-TL reactions. There are several reasons which could explain a lack of detection. Firstly, established PHA analyses methods were largely designed for detecting highly concentrated and purified, high molecular weight PHAs polymers (Huang and Reusch, 1996). Whereas, small-scale cell-free TX-TL prototyping reactions likely generate relatively low concentrations of PHAs at a range of molecular weights (polymer chain lengths). Secondly, the samples also contain a complex background of many different cell extract-derived metabolites that further complicate PHAs detection. Furthermore, additional processing steps that are required to depolymerise P(3HB) into the more easily detectable monomer form (3HB) may increase the risk of sample loss. Due to these challenges, additional methods development was carried out.
E. coli MG1655 cell extracts were spiked with known concentrations of commercially available 3-hydroxybutyrate (3HB) and these spiked extracts were analysed using different GC-MS methodologies. From these experiments, an optimised GC-MS method was developed, along with a calibration curve, that was used to detect 3HB in the low micromolar range within TX-TL cell extracts (Materials and Methods 2.7; Supplementary Figure 2). Method optimisation was achieved through improvements in the temperature gradient for better separation of derivatised 3HB from the cell extract background. A more sensitive and selective mass spectrometry (MS) acquisition was also acquired, using the selected ion monitoring (SIM) approach, coupled with monitoring m/z values, as described in the methods section 2.7, during the GC-MS analysis. In parallel we also engineered an additional phaCAB operon which maintained the same operon structure as C104, but with an inactive PhaC enzyme which is unable to polymerise (R)-3HB-CoA into P(3HB). Site specific mutation of the PhaC catalytic Cys 319 with alanine gave a C104 Δ(PhaC_C319A) phaCAB operon (materials and methods 2.2). This additional operon reduced the sample processing steps needed for PHA polymers and allowed the direct detection of PHAs monomers produced in cell-free reactions.
Cell-free TX-TL reactions were setup and analysed using our optimised GC-MS method and these data are representative of three cell extract batches. GC-MS analysis confirmed an average 3HB production of 3.15 μM ±1.5 in C104Δ(PhaC_C319A) cell-free TX-TL reactions and 3HB was not detectable in negative control reactions (EV104) (Figure 1b).
Cell-free TX-TL reactions can also be coupled with other types of assays that can provide additional insights into the cell-free activities of PHA biosynthetic operons. For instance, a pH analysis of negative control (EV104) and C104 phaCAB operon TX-TL reactions (Figure 2c) confirmed that, as expected, the pH of these cell-free reactions is largely determined by whey permeate metabolism and not by the activities of the PhaCAB enzymes. We also hypothesised that Acetyl-CoA content would be lower in TX-TL reactions that included a plasmid encoding a phaCAB operon, relative to the negative control (EV104). We reasoned that production of PhaCAB enzymes would more rapidly reduce Acetyl-CoA pools through conversion towards P(3HB). To test this, we set up a series of E. coli MG1655 TX-TL cell-free reactions and assayed Acetyl-CoA endpoint content as described in materials and methods. The average endpoint (1 h) Acetyl-CoA content was higher in negative control reactions (EV104 8.17 pmol/μl ±3.78) than reactions with either a native (3.19 pmol/μl ±1.42), C104 (0.55 pmol/μl ±0.55) or C104Δ(PhaC_C319A) (0.57 pmol/μl ±0.57) phaCAB operon. Together, these data demonstrate that PHAs can be produced and detected within cell-free TX-TL reactions and despite some variation between Acetyl-CoA assay, these types of cell-free analyses could be used to screen for differences in the activities of different phaCAB operons. Indeed, the general pattern in the Acetyl-CoA assays indicate that the C104 phaCAB operon is likely to enhance in vivo PHAs production, relative to the native phaCAB operon (Kelwick et al., 2015b)(Figure 4). Likewise, these data also demonstrate that coupling cell-free TX-TL systems with an industrial feedstock (whey permeate in our case) can potentially enhance in vitro protein production (Figure 1) and enable the prototyping of PHA biosynthetic operons that relate to the metabolic context of in vivo PHA production.
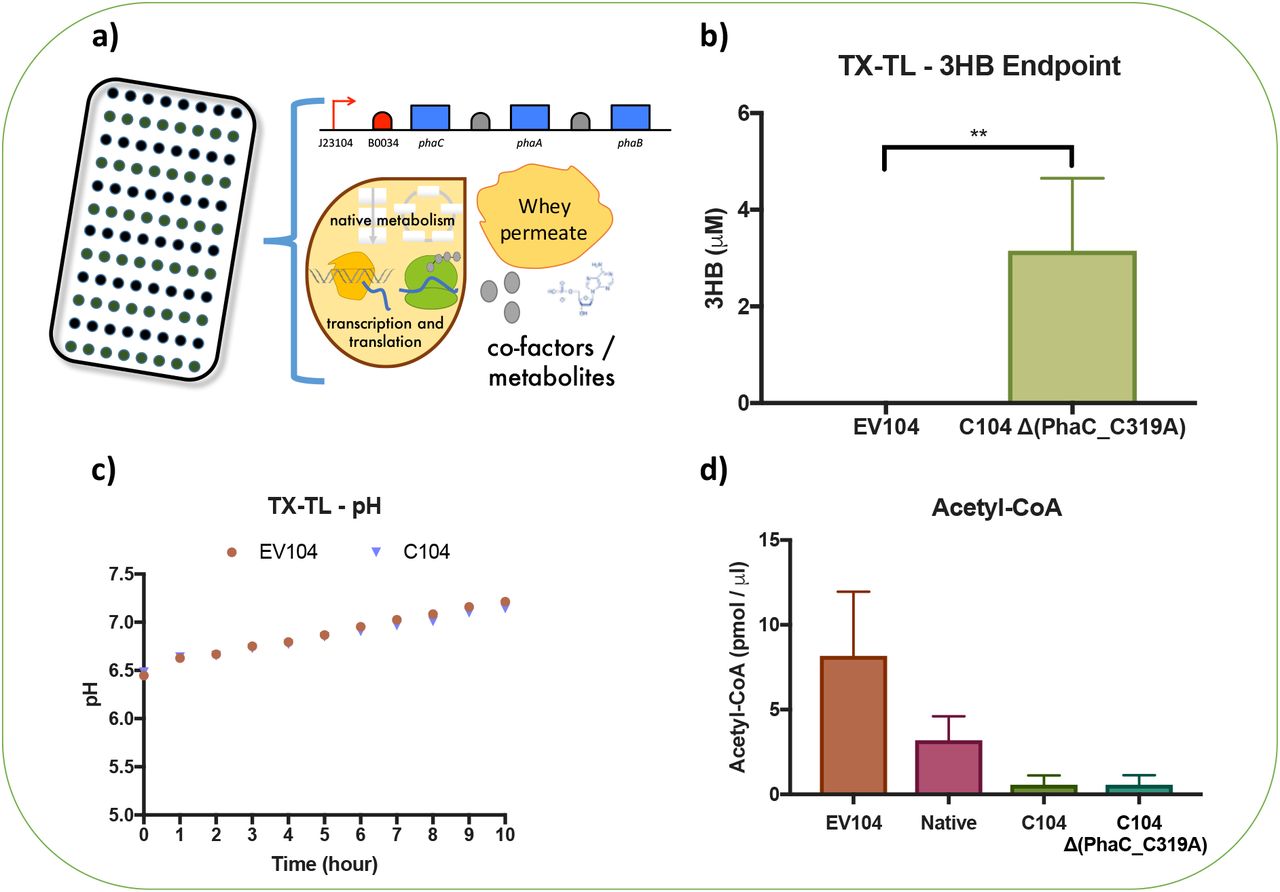
(a) Schematic depicts the whey permeate containing cell-free transcription-translation (TX-TL) reactions used to test the cell-free production of 3-hydroxybutyrate (3HB). (b) Endpoint (5 h) GC-MS analysis of 3HB production in whey permeate containing cell-free reactions. These reactions included either a negative control plasmid (EV104) or a plasmid encoding a phaCAB operon with an inactive PhaC (C104 Δ(PhaC_C319A)). (c) Time-course analysis of pH in whey permeate containing cell-free reactions that included either a negative control plasmid (EV104) or a plasmid encoding a phaCAB operon (C104). (d) Endpoint (1 h) analysis of Acetyl-CoA content in whey permeate containing cell-free reactions. These cell-free reactions included either a negative control plasmid (EV104) or a plasmid encoding a phaCAB operon (Native, C104 or C104 Δ(PhaC_C319A)). Error bars denote standard error of the mean. Student t-test, **P<0.01.
3.2 Biotransformation of whey permeate in phaCAB-engineered cell extracts
Extract-based cell-free metabolic engineering (also known as cell-free protein synthesis driven metabolic engineering – CFPS-ME) can be categorised into two main strategies; one that makes use of cell-free transcription and translation systems and the other involving mixing cell extracts (Karim and Jewett, 2016). Such strategies use cell-free TX-TL systems for in vitro enzyme production and expression of entire biosynthetic pathways. Cell-free metabolic engineering can also be used to construct biosynthetic pathways through the rational mixing of different cell extracts (lysates) that include the necessary enzymes, co-factors and metabolic pathways. It is possible to combine these different cell-free strategies. For instance, bacterial strains that produce desirable enzymes during cell growth can later be lysed and processed to generate cell extracts for use in cell-free transcription-translation reactions. Therefore, a combined cell-free metabolic engineering approach could be used as a prototyping platform for the in vitro characterisation of additional enzymes that may directly or indirectly enhance PHAs production (e.g. metabolite recycling enzymes).
In order to test the concept of cell-free biotransformation reactions, several batches of cell extract from C104 Δ(PhaC_C319A) phaCAB-engineered E. coli MG1655 (S_RK004) were generated. These cell extracts include endogenous β-galactosidase, central metabolic pathways (e.g. glycolysis) and all three PhaCAB enzymes (inactive PhaC), and thus contain all the enzymes needed for the biotransformation of whey permeate into the PHA monomers - (R)-3HB-CoA (Figure 3a). Biotransformation reactions were carried out as described in materials and methods. Endpoint (5 h) GC-MS analyses of the cell-free biotransformation reactions revealed that average (R)-3HB-CoA content was 8.84 μM ±2.47 in reactions with 0 g/L of whey permeate and 32.87 μM ±6.58 in reactions with 0.004 g/L of whey permeate (Figure 3b). Even those cell-free biotransformation reactions without an exogenously added glycolysis substrate (0 g/L whey permeate), produced (R)-3HB-CoA (Figure 3b), suggesting that these cell extracts generated Acetyl-CoA using an alternative pathway, such as through β-oxidation (Tee et al., 2014). Interestingly, cell-free production of (R)-3HB-CoA from whey permeate (0.004 g/L) was around 10x higher in biotransformation reactions (Figure 3b) than in TX-TL reactions (Figure 2a). We anticipate that, with further developments in strain engineering, cell-free biotransformation reactions could conceivably be used for PHAs production. Of course, cell-free biotransformation reactions are not limited to PHAs production applications and can potentially be combined with cell-free TX-TL approaches for screening enzymes that might enhance PHAs production in both cell-free and in vivo contexts.

(a) Schematic depicts the cell-free biotransformation of whey permeate into 3-hydroxybutyrate (3HB) using engineered cell extracts that contain PhaCAB enzymes. In these extracts, the PhaC enzyme was engineered to be inactive (PhaCΔC319A) to ensure that cell-free produced 3HB was not polymerised, (b) Endpoint (5 h) GC-MS analysis of 3HB production in cell-free biotransformation reactions. These cell-free reactions included either 0 or 0.004 g/L of whey permeate, (c) Schematic depicts the Acetyl-CoA recycling activity of propionyl CoA transferase (PCT) within the context of whey permeate metabolism in cell extracts. (d) End point (2.5 h) analysis of Acetyl-CoA content in whey permeate containing cell-free biotransformation reactions that also included plasmids encoding T7 inducible expression of an Acetyl-CoA recycling enzyme – PCT. Thus, extracts with T7 RNA polymerase (+T7) also enable transcription and translation of the PCT enzyme. Error bars denote standard error of the mean. Student t-test, **P<0.01 and ****P<0.0001.
As an exemplar, we tested the cell-free expression of the propionyl CoA transferase (pct) gene from Clostridium propionicum in C104 Δ(PhaC_C319A) phaCAB-engineered cell extracts. PCT couples the release of CoA from (R)-3HB-CoA with the generation of Acetyl-CoA from acetate (Figure 3c) (Ken’ichiro Matsumoto et al., 2013a; Selmer et al., 2002). Since, whey permeate is likely to increase the glycolytic production of acetate and PCT reactions generate Acetyl-CoA (a precursor of (R)-3HB-CoA), it was anticipated that Acetyl-CoA and 3HB levels would be relatively higher in cell-free biotransformation reactions that express the pct gene. The C. propionicum pct gene sequence was sourced from Genbank (AJ276553.1) and cloned into a T7 expression plasmid (as described in materials and methods 2.2) which was termed T7_PCT (pRK12). Combined biotransformation/TX-TL cell-free reactions were setup with C104 Δ(PhaC_C319A) phaCAB-engineered cell extracts, in combination with the T7_PCT plasmid, and either 0 (-T7) or 25 (+T7) units of T7 RNA polymerase (materials and methods 2.5). Thus, only those cell-free reactions that contain T7 RNA polymerase will express the pct gene. Endpoint analyses revealed that average Acetyl-CoA content was higher in cell-free reactions that contained T7 RNA polymerase (1.46 pmol/μl ±0.01) in comparison to control reactions with no T7 RNA polymerase (0.21 pmol/μl ±0.00) (Figure 3d). Whilst the PCT driven increase in Acetyl-CoA is relatively modest and did not result in increased (R)-3HB-CoA content (data not shown), these data suggest that coupled cell-free biotransformation and TX-TL prototyping could be useful in helping to identify metabolite recycling enzymes that might improve PHAs production in vivo. Indeed, in other experimental contexts pct genes from both C. propionicum and Megasphaera elsdenii have been shown to enhance in vivo Acetyl-CoA content (Ken’ichiro Matsumoto et al., 2013a, 2013b; Selmer et al., 2002; Tajima et al., 2016).
3.3 In vivo characterisation of PHAs production from whey permeate
Finally, in vivo PHA production experiments were carried out using the phaCAB-engineered E. coli MG1655 strains and negative control. The optimal whey concentration for cell-free assays (0.004 g/L, Figure 1b) is likely to be insufficient for in vivo PHAs production, where a relative excess of carbon is desirable. Therefore, a previously described whey permeate concentration of 120.48 g/L, corresponding to 100 g/L of lactose, was used in all in vivo assays (Bosco and Chiampo, 2010).
Qualitative analysis of Nile Red stained E. coli confirmed PHAs polymer production in native, and C104 phaCAB-engineered E. coli (Materials and methods 2.9, Figure 4 and Supplementary Figure 4). Whereas, both negative control (EV104) and C104 Δ(PhaC_C319A) phaCAB-engineered E. coli did not generate PHAs granules (Figure 4 and Supplementary Figure 4). In addition to the plate assays, a semi-quantitative Nile Red flow cytometry analysis of in vivo PHAs production was also carried out (Materials and methods 2.10, Figure 4b, Supplementary Figure 5, Supplementary Figure 6 and Supplementary Table 4). For these analyses, a gating strategy was implemented that excluded cell doublets and distinguished between negatively and positively Nile Red stained cell populations (Supplementary Figure 5 and Supplementary Table 4). Post gating, the background signal of negative control cells (EV104) was removed and these data were normalised to the Nile Red fluorescence of native phaCAB-engineered E. coli. Nile Red fluorescence levels were on average 2.18 ±0.05 fold-higher in C104 phaCAB-engineered E. coli than native phaCAB-engineered E. coli levels (Figure 4b and Supplementary Figure 6) indicating that PHAs content is higher in C104 phaCAB-engineered E. coli.

(a) E. coli MG1655 transformed with either a negative control plasmid (EV_104) or a phaCAB operon (native, C104, or C104ΔPhaC_C319A) were streaked onto 2xYT+P-agar plates supplemented with 3% glucose (w/v), 34 μg/ml Chloramphenicol and 0.5 μg/ml (final concentration) of Nile Red stain. Nile Red plates were incubated for 24 h at 37°C and then imaged using a Fuji Film LAS-5000 imager (Ex. 473 and Em. Cy5 filter), (b) E. coli MG1655 transformed with either an empty vector (EV104) or a phaCAB operon (native or C104) were Nile Red stained and analysed via flow cytometry (Attune NxT - YL2-A, Ex. 560 nm, Em. 610 nm). The background signal, as determined by the average geometric mean (YL2-A) of Nile Red stained, empty vector (EV_104) transformed E. coli was removed and these data were normalised to native phaCAB-engineered E. coli. In order to determine PHA production in phaCAB-engineered E. coli (native and C104), 100 ml PHA production cultures (2xYT+P media - supplemented with 120.48 g/L milk whey permeate and 34 μg/ml Chloramphenicol) were setup, as described in materials and methods, and were cultured for 24 hours at 37°C with shaking (220 rpm). PHAs were purified from these PHA production cultures and measured as (c) PHA content (weight [wt] % of cell dry weight [CDW]) and (d) PHAs production (g/L). Error bars indicate the standard error of the mean. Student t-test, ***P<0.001, and ****P<0.0001.
In vivo PHAs production experiments involving phaCAB-engineered E. coli were carried out in whey permeate production media and post-production, a sodium hypochlorite-based method was used to purify PHA content from these strains (materials and methods 2.11). PHAs production from whey permeate was almost three times higher in C104 phaCAB-engineered (5.10 ±0.35 g/L) cultures than native PHAs production cultures (1.83 ±0.07 g/L) (Figure 4c and Supplementary Table 5). PHAs production was also validated using GC-MS (Materials and methods 2.12, Supplementary Table 6). Similarly, PHAs content expressed as % weight of cell dry mass was also significantly higher in C104 phaCAB-engineered cultures (68.96 % ±4.91) than native PHAs production cultures (16.14 % ±0.68) (Figure 4d and Supplementary Table 5). Although the reaction scales, whey concentrations and PHAs production yields differ between these in vivo and in vitro cell-free assays, it is clear that the C104 phaCAB operon, and its derivative C104 Δ(PhaC_C319A) were more active than the native operon as observed in both cell-free and in vivo assays. This therefore illustrates how cell-free TX-TL approaches can complement in vivo workflows for prototyping PHA biosynthetic operons.
4. Summary and Conclusions
Despite the environmental consequences that are associated with the mass production of oil-derived plastics, global demand is likely to continue to increase unless viable economic alternatives are developed (Eriksen et al., 2014; Geyer et al., 2017). The polyhydroxyalkanoates are a family of biodegradable biopolymers, that could potentially be used as sustainable alternatives to replace several widely used oil-derived plastics (e.g. polypropylene). However, PHAs are currently more expensive to produce than oil-derived plastics which has hampered their adoption and therefore, more efficient PHAs production processes would be desirable. An array of advancements in synthetic biology and metabolic engineering have already led to improvements in PHAs production though we anticipate that cell-free metabolic engineering approaches, several of which have been underutilised in PHAs research (e.g. cell-free TX-TL), could lead to additional innovations in PHAs production strategies. Indeed, cell-free metabolic engineering approaches have already been used to prototype biosynthetic pathways in other contexts (Karim and Jewett, 2016). Yet, interestingly, cell-free TX-TL systems have not previously been used to prototype PHA biosynthetic operons. This may in part relate to the challenges associated with detecting PHAs and PHA monomers produced in small scale cell-free reactions. In order to overcome this and to accelerate the adoption of cell-free TX-TL prototyping platforms in PHAs research, several cell-free TX-TL approaches for characterising PHA biosynthetic pathways were developed. E. coli MG1655 cell-free prototyping reactions were customised with whey permeate as an energy source, an industrial waste that has been previously used as a low-cost feedstock for optimising in vivo PHAs production. The inclusion of an optimal concentration of whey permeate enhanced relative in vitro protein production and subsequent experiments also demonstrated, for the first time, the production and GC-MS detection of 3-HB (a PHAs monomer) within cell-free TX-TL reactions. pH and Acetyl-CoA assays were also used to demonstrate that additional insights into the activities of PHA biosynthetic pathways can also be gained through carrying out cell-free TX-TL prototyping assays. Therefore, these data demonstrate that suitably customised cell-free TX-TL systems can be used to characterise PHA biosynthetic operons within a metabolic context that relates to in vivo production. Additionally, we also demonstrated that coupled cell-free biotransformation/TX-TL strategies can be used to screen for useful metabolite recycling enzymes for enhancing in vivo PHAs production. As an exemplar, we in vitro expressed and characterised an Acetyl-CoA recycling enzyme (pct) within phaCAB-engineered biotransformation cell extracts.
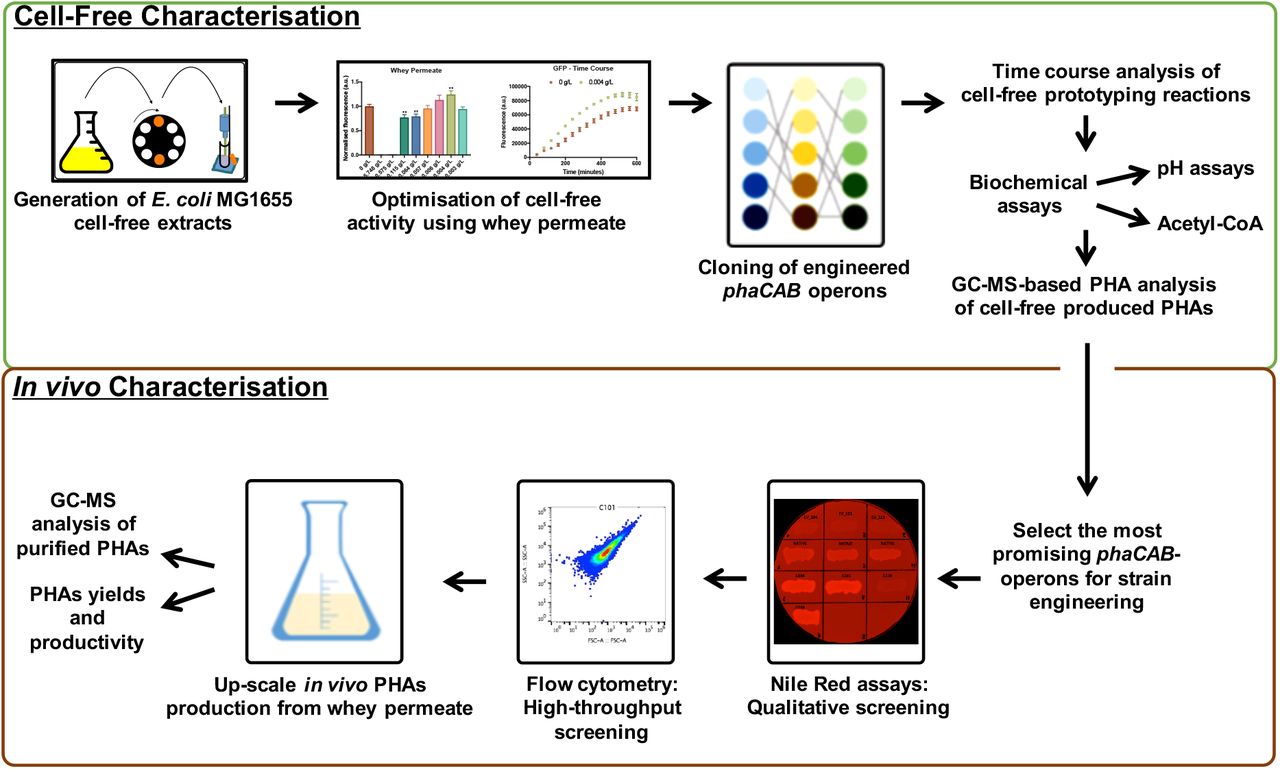
More broadly we envision that these types of cell-free metabolic engineering approaches could conceivably be used in combination with in vivo strategies for optimising PHAs production (Figure 5). Ultimately, the continuing development of cell-free TX-TL metabolic engineering approaches may lead to desirable innovations in PHAs production that enhance their potential as sustainable alternatives to oil-derived plastics.

Cell-free prototyping approaches complement in vivo strategies for characterising Polyhydroxyalkanoates (PHAs) production from whey permeate.
Author Contributions
Project conception (R.K. and P.S.F.), designed the experiments (R.K. and L.R.), performed the experiments (R.K. and L.R.) and analysed the data (R.K. and L.R.). GC-MS and LC-MS assays and analysis (S.M.C. D.B. and R.K.). Wrote the manuscript (R.K.). Edited and reviewed the manuscript (R.K., L.R. A.W. P.S.F. S.M.C. and D.B.). Project support and advice (P.S.F. and A. W.).
Data availability
Data available in supplementary material.
Acknowledgements
We wish to acknowledge the support of the Engineering and Physical Science Research Council (EPSRC) – [EP/J02175X/1] and that of our colleagues in the Centre for Synthetic Biology and Innovation (CSynBI), SynbiCITE at Imperial College London and also colleagues from The Flowers Consortium. We would also thank the Erasmus+ programme for supporting Luca during his master’s degree placement project.
Footnotes
↵# Joint First Authors.
References


