

Abstract
The human kidney is a complex organ composed of specialized cell types. To better define this cellular complexity, we profiled the individual transcriptomes of 22,469 normal human kidney cells, identifying 27 cell types. We describe three distinct endothelial cell populations, a novel subset of intercalated cells, interstitial macrophage and dendritic cells, and identify numerous novel cell-type-specific markers, many validated using imaging mass cytometry and immunohistochemistry. Receptor-ligand analysis revealed previously unknown intercalated-endothelial and intercalated-distal nephron interactions, suggesting a role in maintenance of vascular integrity and intercalated cell survival. Notably, kidney disease-associated genes were largely expressed in proximal tubules, podocytes, endothelial and myeloid cells, highlighting an underappreciated role for endothelial cells in kidney pathologies. Our analysis also provides a resource of cell type enriched markers, solute carriers, channels and lncRNAs. In summary, this cell-type-specific transcriptome resource provides the foundation for a comprehensive understanding of kidney function and dysfunction at single cell resolution.
The kidney is a complex organ composed of numerous cell types performing essential functions of filtering metabolic waste, balancing blood electrolytes and maintaining blood pressure. Kidney dysfunction has a significant impact on human health - chronic kidney disease (CKD) affects 10% of the worldwide population and 14% within the US resulting in 1.1 million deaths every year and costing nearly $100 billion in 20151,2. Adult kidney is composed of hundreds of thousands of nephrons, which allow intricate exchange of materials between the blood and urine compartments. Decades of research using lineage-tracing in animal models and histology on human biopsies have extensively described the kidney architecture and functions3.
The nephron is composed of multiple distinct compartments: glomerulus, proximal tubule, distal tubule, connecting tubule and collecting duct. These segments perform different aspects of the filtration process, beginning with the glomerulus where primary urine is first formed. At least 20 distinct cell types have been defined in the literature with 4 distinct cell types in the glomerulus alone - endothelial cells of the glomerular tuft, podocytes, mesangial cells and parietal epithelial cells forming the Bowman’s capsule. Primary urine within the Bowman’s space then flows into the proximal tubules which are lined with epithelial cells that alter the repertoire of proteins expressed as distance from the glomeruli increases. Epithelial cells of the distal tubule segments are well-characterized by molecules marking distinct positions along its length. However, once reaching the connecting tubules and collecting duct there is distinct heterogeneity within the epithelium with principal cells interspersed with acid-base regulating intercalated cells. Other cell types that form the kidney interstitium are fenestrated and non-fenestrated endothelial cells of the peritubular capillaries, vascular smooth muscle cells, pericytes, fibroblasts and resident immune cells4–8.
A comprehensive molecular and spatial knowledge of the human kidney – a cell atlas - is currently lacking. Single-cell technologies and multi-parameter spatial imaging techniques now enable the construction of such an atlas9. Kidney pathology is not restricted to a single cell type or renal structure - glomerular and tubular pathophysiology can be mediated through epithelial, endothelial, mesenchymal, and/or immune cell dysfunction10. Hence, a complete transcriptome of each cell type within the kidney will not only inform on their function within the normal kidney but aid in understanding the origin of various kidney pathologies10,11.
In this study, we profiled 22,469 cells from the normal human kidney by droplet-based single cell transcriptomics, identifying 27 cell types. We describe new markers for known cell types and define new subsets within the intercalated and endothelial cell populations. We also describe interactions between different cell types in the kidney revealing a potential role for endothelial cells in kidney pathologies. In addition, we utilize imaging mass cytometry (IMC) and traditional immunohistochemistry (IHC) to provide spatial context to cell types and associated markers. We also resolve the expression of genes associated with kidney pathologies which point to the primary cell type(s) of dysfunction in these diseases.
Results
To investigate the cellular composition in normal kidney, we adopted a high throughput single-cell transcriptomic approach. Normal kidney resection samples were enzymatically dissociated into a single cell suspension, then sorted for viable cells, before profiling using the Chromium™ system (Supplementary Fig. 1). We validated the cell type specific expression and spatial distribution of markers using IMC and IHC on formalin-fixed paraffin-embedded (FFPE) sections of normal kidney tissues (Supplementary Fig. 7).
We initially optimized tissue dissociation and cell profiling utilizing the first generation of Chromium™ chemistry, generating 3,128 single cell transcriptomes (Supplementary Fig. 8). We subsequently profiled two additional kidney resections, one male and one female, with version 2 Chromium™ chemistry and used this later data for comprehensive cell type identification. This represented a data set of 19,341 cells with an average of 1,018 genes and 2,462 median UMIs (Unique Molecular Identifiers) detected per cell (Supplementary Fig. 2). We employed unbiased clustering and dimensionality reduction methods to identify cell types. For cell typing, markers for each cluster were determined using Area Under Receiver Operating Characteristic (AUROC) analysis with genes greater than 2-fold difference in a cluster relative to all cells (Fig. 1, Supplementary Fig. 4 and Supplementary Table 1). We identified 8 distinct clusters from these 19,341 cells, with proximal tubule (PT) epithelial cells as the largest cluster (n=16,348; 84.5%) the predominant cell type in the kidney cortex and medulla (Fig. 1a).

(a) Unsupervised clustering of combined non-immune and immune cell types of human kidney represented as a tSNE plot. Different cell type clusters are color coded. (b) Cells were re-clustered (unsupervised) after removal of proximal tubule cell cluster shown in (a), revealing finer subsets of various non-immune and immune cell types, totaling 22 clusters. Different cell type clusters are color coded. (c) Bubble plot showing selected cell type specific markers across all 22 clusters. Size of dots represents percentage of cells expressing a particular maker and intensity of color indicates level of mean expression. Legends are shown below. (d) Heatmap showing scaled expression (log CPM) of discriminative marker gene sets across all 22 clusters, with cells as columns and rows as genes. Color scheme represents Z-score distribution with −3 (blue) to 3 (dark orange). (e) Illustration of cortical and juxtaglomerular nephrons and the various tubular segments of the kidney nephron. Spatial localization of nephrons across cortical, inner and outer medullary regions is demarcated. (f) Illustration of the glomerular region boxed in (e), showing various cell types present within the glomerulus and the adjacent macula densa segment of the thick ascending limb. Illustrations are not drawn to scale and corresponding cluster numbers are shown in [ ]. Abbreviations: NK – natural killer; IC-A – intercalated cell type A; IC-B – intercalated cell type B; EC – endothelial cell; Pct – percentage; PT – proximal tubule; DT – distal tubule; ATL – ascending thin limb; TAL – thick ascending limb; CD – collecting duct; AVR – ascending vasa recta; DVR – descending vasa recta; FEC – fenestrated endothelial cells; vSMCs – vascular smooth muscle cells; AEA – Afferent and efferent arterioles; PEC – Parietal epithelial cells; DCT – Distal convoluted tubule.
We further resolved the smaller subsets and rarer cell types by re-clustering the remaining 2,993 non-PT cells (Fig. 1b). This identified 21 clusters, including a cluster (cluster 5) of 311 PT-like cells that lay outside the original PT cluster 1 (Fig. 1b). We then integrated the original PT cluster with these 21 clusters to derive 22 clusters for downstream analyses (Fig. 1a-d). Subsequent cell type identification of each cluster was informed by markers from published studies and assisted by an analysis of the entire repertoire of transporters, solute carriers, channels and long non-coding RNAs (lncRNAs) across these 22 clusters (Supplementary Fig. 4-5 and Supplementary Table 1). This revealed in total 17 non-immune and 10 immune cell types (PTPRC+) (Fig. 1a-d). Where available, we provide a cell ontology ID from Ontobee (http://www.ontobee.org/)12.
Proximal tubule epithelial cells
The PT is the primary site of reabsorption and filtration, where 90% of ions (Na+, Pi, HCO3-, Cl-), 65% of water and 100% of amino acids and glucose are reabsorbed into the blood. Uric acid, H+ and organic acids are removed from the blood and enter the tubular compartments, while HCO3-is reabsorbed into the interstitial tissue. These functions are specified by cells possessing different water channels, solute carriers and transporters of amino acids, glucose and urea4. The PT is divided into three segments (S1, S2, S3) based on ultrastructure - S1 and S2 segments encompass the convoluted portion and S3 segment the straight tubule13.
We define cluster 1 as PT epithelial cells (CL_0002307) as they expressed PT-specific markers such as brush border membrane components PDZK1, LRP2, and CUBN, transporters SLC26A6, SLC13A2, SLC4A4, SLC5A12, and SLC22A6, and ACSM2B among numerous other markers (Fig. 14 1c, 2a, Supplementary Fig. 4a, 5a and Supplementary Table 1)14. We did not observe distinct subclustering of the PT segments suggesting a gradual transition between these epithelial cell states. To further identify differences across these segments, we assigned 1,281 cells to S1 (CL_1000838) and 821 cells to S3 (CL_1000839) segments using known S1 (SLC5A2, SLC2A2) and S3 (SLC7A13, SLC3A1) markers and identified additional differentially expressed genes6. Surprisingly, plasma protein encoding genes (e.g. ALB, RBP4, GC and PROC), normally thought to be liver-derived, were expressed in PT (Supplementary Fig. 3)15–17.
PT-like cluster 5, originally a sub-set of cells within the proximal/distal/PEC (PT-DT-PEC) cluster in Fig. 1a, expressed many of the PT markers but formed a distinct cluster. We identified 3 sub-clusters within: (1) cells abundant in mitochondrial genes; (2) cells with high expression of VIM, VCAM1, KRT18, SOCS3, ATF3 and PDZK1; and (3) a distal nephron - PT doublet cluster (Fig. 2a-d). PT cells in general and a subset of mouse S3 PT cells have been described to be especially abundant in mitochondria18. The 1st sub-cluster were not dying cells as the median number of genes and transcripts were higher than cluster 1, so we hypothesize that they belong to this poorly characterized cell type (Supplementary Fig. 2f-g)18. The 2nd sub-cluster marked parietal epithelial cells (PECs) (CL_1000452) lining the Bowman’s capsule, which are known to specifically express VCAM119. We also validated the expression of VIM and other identified markers in PECs through our IMC and IHC data from Human Protein Atlas (HPA) (www.proteinatlas.org) (Fig. 2b-d and Supplementary Fig. 7)20.

(a) Violin plot of selected markers of proximal tubule epithelial cells represented by clusters 1 and 5. (b) Subclustering of cluster 5 identifies high mitochondrial PTs, PECs and doublets. (c) tSNE plots of PEC enriched markers and (d) validation IHC images from HPA (www.proteinatlas.org). Arrows indicate PECs. (e) Violin plots of markers specific to TAL, DCT, CNT and CD segments. (f) tSNE plots of cluster 4 cells showing different segment specific markers of DCT, CNT and CD. (g) Illustration of cells within cluster 4, transitioning from DCT to CNT to CD segments of the distal nephron. Expression is represented as log CPM, from 0 (grey) to 3 (orange). (h) Violin plot of MAL, DEFB1 and WFDC2 expression across all 22 clusters. Abbreviations: DCT – distal convoluted tubule; CNT – connecting tubule; CD – collecting duct; TAL – thick ascending limb; MD – macula densa; PEC – Parietal epithelial cells; HPA – Human Protein Atlas; MT – Mitochondrial; PT – Proximal tubule epithelial cells.
Thick ascending limb (TAL) to distal nephron (DCT to CD)
The S3 of PT transitions into the Loop of Henle (LOH), which is the main site of urine concentration where water is reabsorbed into blood. It includes the thin descending and ascending limbs and the thick ascending limb (TAL). TAL connects to the distal nephron, the site for fine regulation of various solutes and water essential in blood pressure homeostasis, and is well-delineated with known markers5. We identified cells of the LOH and the entire distal tubule compartment – TAL, distal convoluted tubule (DCT), connecting tubule (CNT) and collecting duct (CD) (clusters 2, 4, 18 and 19; Fig. 1b-e, Supplementary Fig. 4 and Supplementary Table 1).
Cluster 2 cells expressed markers of the thin ascending limb (CL_1001016) (ELF3, CLDN3, CLDN4, CLDN10 and TACSTD2), and TAL (SLC12A1), representing cells transitioning from the thin segment of LOH to TAL (Fig. 1c and Sup Fig. 4b, n)6. Cluster 18 cells expressed the highest levels of UMOD and SLC12A1 marking them to be TAL (CL_1001106) (Fig. 2e-g)21. Cluster 19 represents cells transitioning from TAL to DCT (CL_1000849) as they expressed lower levels of SLC12A1 and UMOD but high levels of PVALB (an early DCT marker/DCT1) and co-expressed CLDN14, CLDN16 and CLDN19 (Fig. 1c, 2e and Supplementary Fig. 5c)7,22. Since both clusters 18 and 19 express SLC12A1, they may contain macula densa cells (CL_1000850) within21.
Cluster 4 contained a subset of cells uniquely expressing SLC12A3, a marker of DCT1/2 segment, followed by cells with a gradient in the expression of PVALB, CALB1, SLC8A1, AQP2 and AQP3, marking the transition from DCT1/2 to CNT (CL_1000768) and CD (CL_1001431) (Fig. 2e-g)4,21,22. No cells co-expressed SLC12A1 and SLC12A3, consistent with reports that SLC12A1+ TAL cells abruptly transition into the DCT segment lined by SLC12A3+ cells (Fig. 2e-g)5. CLCNKB (CIC-K2), an anion channel which mediates Cl-reabsorption, was present in TAL, DCT, CNT and intercalated cells but not in the AQP2+, AQP3+ CD principal cells, further confirming the identity of these sub-clusters (Fig. 2f and Supplementary Fig. 5k)23. Other known apical and basolateral ion channels and transporters such as CLCNKA, SCNN1A, KCNJ1, KCNJ16 and Na+/K+ ATPase subunits ATP1A1, ATP1B1, presented additional heterogeneity within the DCT, CNT and CD cells (Fig. 2f)21.
Notably, MAL, DEFB1 and WFDC2 mark cells of TAL, DCT, CNT and CD, with the exception of WFDC2, which was absent in Type A intercalated cells (Fig. 2h). Although MAL and DEFB1 have been described in the context of the kidney, and WFDC2 has been recently proposed as a serum biomarker of lupus nephritis, their cell type specific expression in the human kidney has not been well delineated24,25. From our data, we identify these as suitable pan-distal nephron markers.
Intercalated cells
Intercalated cells (ICs) are specialized epithelial cells which regulate acid-base homeostasis through the exchange of various ions (Na+, Cl-, K+, HCO3- and NH3+) via ion channels and pumps. Found interspersed in the distal tubule (DCT to CD), they have paracrine signaling roles with principal cells. Three different IC types are known – Type A (IC-A), Type B (IC-B) and Non-A/Non-B ICs. IC-As are acid secreting (urinary acidification), which possess the H+ATPase vacuolar type proton pumps on the apical pole, the AE1 chloride-bicarbonate exchanger (SLC4A1) on the basolateral pole and lack pendrin (SLC26A4), a chloride-bicarbonate exchanger. IC-Bs are basic/bicarbonate-secreting cells, which express pendrin on the apical pole and H+ATPase pumps on the basolateral pole. Non-A/Non-B ICs possess both pendrin and H+ATPase pumps on the apical pole and are hypothesized to represent the intermediate/transitional state when IC-Bs switch to IC-A cell types and are located in the CNT. Dysfunction of ICs is associated with acidosis and alkalosis24.
We found three clusters of ICs (CL_1001432) (Cluster 6, 10 and 16) marked by pan-IC markers - ATP6V0D2, ATP6V1B1 and ATP6V1G324. FOXI1, a transcription factor specific to and required for ICs, was also detected in these populations further confirming the identity of these cells (Fig. 1b-c, 3a-b)26.

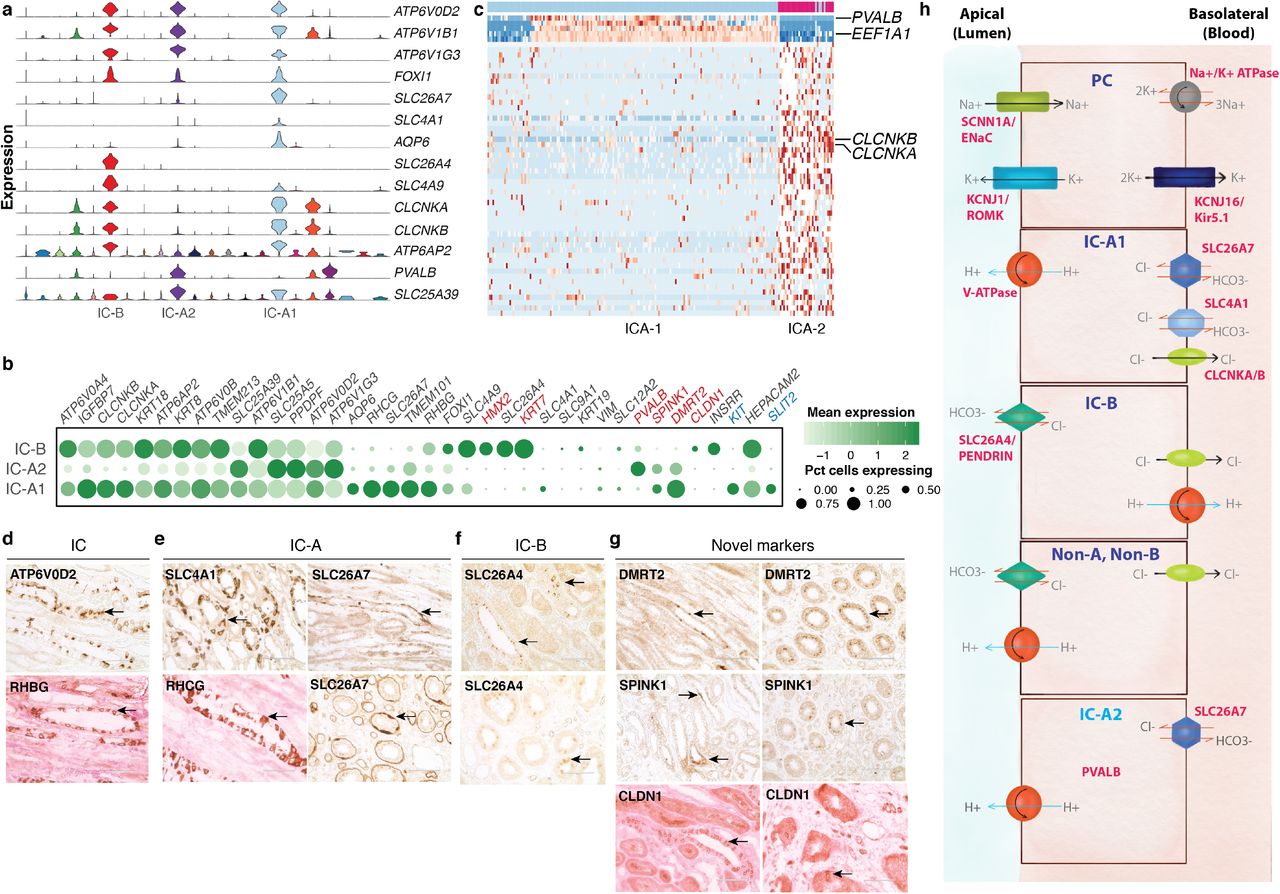
(a) Violin plot showing pan-intercalated, IC-B, IC-A1 and novel IC-A (IC-A2) subtype specific markers across all 22 clusters. (b) Bubble plot of selected IC-subtype markers. Size of dots represents percentage of cells expressing a particular maker and intensity of color represents level of mean expression. Novel markers are shown in red and signaling molecules in blue. Legends are shown below. (c) Heatmap showing scaled expression (log CPM) of discriminative marker gene sets across IC-A1 and IC-A2 (novel) subtypes, with cells as columns and genes as rows. PVALB and EEF1A are unique to IC-A2 while CLCNKA and CLCNKB are present in IC-A1 subtype. Color scheme represents Z-score distribution from −2 (blue) to 2 (dark red). (d-g) IHC on normal kidney FFPE section showing (d) intercalated cell markers, (e) IC-A markers, (f) IC-B markers, and (g) novel markers of IC-A (DMRT2 and SPINK1) and IC-B (CLDN1) subtypes. Arrows indicate respective protein expression in ICs. SPINK1 is a secreted protein, hence appears diffuse. Some sections, counter-stained with eosin, appear pink. (h) Illustration of solute carriers, channels and ATPase pumps present in PCs, IC-A1, IC-B, non-A/non-B and IC-A2 (novel) cell types. Not drawn to scale. Abbreviations: IC-B – intercalated cell type B; IC-A1 – intercalated cell type A; IC-A2 – novel intercalated cell type A; IC – intercalated cell; PC – principal cell; IHC – immunohistochemistry.
Two of these clusters - 10 and 16 - were marked by SLC26A7, a marker of IC-A (CL_0005011)27. Genes encoding transporters/pumps revealed further heterogeneity within these IC-A subtypes (Fig 3a-c)24. Cluster 16 cells (henceforth called IC-A1) co-expressed ATP6AP2, RHCG, CLCNKA/B, SLC4A1, KIT and high AQP6, which were low or absent in cluster 10 (Fig 3a-b)28. Cluster 10 cells (henceforth called IC-A2) however uniquely expressed PVALB, a DCT1 marker22. IC-A2 cells did not express SLC26A4, hence unlikely to be Non-A/Non-B ICs (Fig 3a-c). We denote this IC-A2 population as a novel subtype of IC-A. IC-A1 and IC-Bs had the greatest UMI counts of any cell type in our data set with median counts of 7,500 and 7,000, respectively. This is a measure of RNA content and likely reflective of cell size. ICA-2 cells were lower in median UMI detected (~4,900), still significantly higher than most all other clusters in the data set but further distinguishing these cells from the two other IC clusters, and perhaps reflecting a relatively smaller size (Supplementary Fig. 2g).
Cluster 6 expressed IC-B (CL_0002201) markers SLC26A4 and SLC4A9 (AE4)24. INSRR was specifically expressed in IC-B and not in either IC-A subsets29. Similar to the IC-As, they also expressed ATP6AP2, CLCNKA, CLCNKB, and RHBG (but not RHCG)24. IC-B uniquely expressed high levels of epithelial marker KRT7 (Fig. 3a-b, d and f). Apart from differences in the intracellular localization of SLC26A4, there are no known markers that distinguish Non-A/Non-B ICs from IC-Bs, thus both may be present within this cluster24.
We identified novel markers of IC-A and IC-B. TMEM101, an undefined transmembrane protein, SPINK1, a trypsin inhibitor, DMRT2, a transcription factor, and C12orf75, an undefined transcript, were all specifically expressed in IC-A1 and IC-A2 cells. IC-B uniquely expressed CLDN1. We verified these new markers by IHC (Fig. 3b and g). Indeed, a recent mouse study described the expression of Spink1 and Dmrt2 in IC-A cells29. They also reported HEPACAM2 expression in IC-A, in contrast, we found HEPACAM2 highly expressed primarily in IC-Bs and IC-A1 and lower in IC-A2 (Fig. 3b)29.
Blood vessels
Endothelial cells (ECs) form the inner lining of all blood and lymphatic vessels playing critical roles in kidney architecture and function. They are the primary filtration barrier between blood and interstitial tissues, allowing exchange of nutrients, metabolites, waste and cells. Glomerular endothelial cells (GECs), which are in close contact with the podocytes and mesangial cells form the first site of filtration. The peritubular capillaries of the descending vasa recta (DVR) and ascending vasa recta (AVR), are closely knit with the nephron to allow reabsorption and secretion of ions and water, assisting in establishing counter-current exchange and concentrating the primary urine8. The DVR is known to be continuous and non-fenestrated unlike the fenestrated GECs and AVR8. Water exchange happens between the DVR-interstitium-AVR regions, hence the DVR peritubular capillaries are marked by the water channel AQP1. AVR and GECs can be further distinguished by PLVAP, a fenestrae diaphragm marker, known to be present only on AVR and not GECs or larger blood vessels8.
We identified three distinct clusters of ECs, marked by pan-endothelial markers ENG and EMCN (clusters 12, 13 and 14 in Fig. 1b-c). Other little-known EC-specific markers include SLCO2A1, a prostaglandin transporter, and FXYD6, a phosphohippolin that potentially regulates the Na+/K+ ATPase (Supplementary Fig. 5h and j)30,31. We define cluster 12 as AVR (CL_1001131) as it expressed PLVAP but was low in AQP1, and cluster 13 as non-fenestrated DVR (CL_1001285) as it was PLVAP-, but positive for AQP1 and urea transporter SLC14A1 (UT-B1) (Fig. 1b-c and 4b)8. We also noted other differences between AVR and DVR, such as mutually exclusive expression of DNASE1L3 and IL13RA1 in AVR, and SOST and IL13RA2 in DVR. Moreover, GSN was higher in AVR (4-fold) while TGFBR2 was higher in DVR (5-fold) (Fig. 1c, 4b and Supplementary Table 1).

(a) tSNE plot of AVR (FECs), DVR and AEA endothelial subtypes. A cluster of cell doublets is also shown. (b) Bubble plot of selected markers of AVR, DVR and AEAs. Size of dots represents percentage of cells expressing a particular maker and intensity of color represents level of mean expression. Disease associated markers are shown in red. Legends are shown below. (c) Heatmap showing scaled expression (log CPM) of discriminative marker genes of AVR, DVR and AEA endothelial subtypes. Cells are arranged as columns, rows are genes. Color scheme represents Z-score distribution from −2 (blue) to 2 (dark red). (d) Illustration of glomerulus with afferent and efferent arterioles and localization of AVR and DVR with respect to nephron. Not drawn to scale. (e) Violin plots showing expression of vSMC/pericyte marker genes. (f) IHC of pan-endothelial (ENG), fenestrated (PLVAP) and AQP1 expression in ECs of normal kidney section. Panel on the right shows images from HPA (www.proteinatlas.org) showing expression of CLDN5, VIM and CAV1 in ECs within glomerulus. Black arrows point to afferent/ efferent arterioles. Red arrow indicates blood vessel not marked by PLVAP. Abbreviations: ECs-endothelial cells; AVR – ascending vasa recta; DVR-descending vasa recta; AEAs – afferent and efferent arterioles; FECs – fenestrated endothelial cells; HPA – Human Protein Atlas; IHC – immunohistochemistry; GECs – Glomerular endothelial cells; vSMCs – vascular smooth muscle cells.
We define the third cluster of ECs as arteries/afferent-efferent arterioles (AEAs) (CL_1001006/ CL_1001009/ CL_1000891), based on the expression of CLDN5, AQP1, CAV1, VIM and low in PLVAP. CLDN5+ ECs are known to be expressed in AEAs, arteries and podocytes but not in the kidney veins and glomerular capillaries, which we confirmed by IHC from HPA (Fig. 4b and f)20,32,33. ELN (elastin), a component of large artery extracellular matrix, GLUL and IGF2 are also unique to this cluster (Fig. 4b). Notably, while publications report the lack of PLVAP in fenestrated GECs, our IHC analysis clearly shows PLVAP expression in a subset of GECs (Fig. 4b and f)8.
The mural cells of blood vessels - vascular smooth muscle cells (vSMCs) and pericytes, surround the vessel walls and exchange signaling cues with ECs to regulate endothelial biology34. Cluster 17 consisted of cells negative for endothelial markers but co-expressing RGS5, PDGFRB, ACTA2 and TAGLN – markers of pericytes (CL_1001318) and vSMCs (CL_0000359) (Fig. 1b-c, 4e, Supplementary Fig. 4 and Supplementary Table 1)34 There has yet to be definitive markers that distinguish the two and we anticipate both of these mural cells to be present – vSMCs associated with large and pericytes with small vessels – based on our IMC analysis (Supplementary Fig. 7).
Glomeruli: Podocytes and mesangial cells
Podocytes are specialized epithelial cells lining the glomerular capillaries, separated from each other by a glomerular basement membrane. They possess a unique structure consisting of interdigitated podocyte foot processes with slit diaphragms, which wrap around the glomerular tuft for filtration3. They can be identified by podocyte-specific markers, WT1, PODXL, NPHS1 and SYNPO among others3.
Despite the challenges associated with dissociating glomeruli and isolating podocytes (CL_1000451), we identified four podocytes which co-expressed a set of markers, including well-known podocyte markers, highly specific to these cells (cluster 20; Fig. 1b-c, 5a-b and Supplementary Table 1). Novel markers enriched in these cells, some confirmed as glomeruli localized from HPA, included PCOLCE2, FGF1, ZDHHC6, and ENPEP (Fig. 5f)20. Many of these markers were also found in two cells from our original version 1 analysis (Supplementary Fig. 8). The biological reproducibility of multiple markers across multiple cells gives us confidence in assigning these six cells as podocytes.

(a) Violin plots showing the expression of podocyte marker genes. (b) Bubble plot showing genes enriched in podocytes. Novel markers of podocytes are shown in red. (c) Bubble plot showing showing genes enriched in mesangial cells. (e) IHC images validating protein expression of podocyte markers WT1, PODXL, SYNPO and NPHS2 on human kidney FFPE tissue. (f) IHC images from HPA (www.proteinatlas.org) validating protein expression of newly identified podocyte markers PCOLCE2, FGF1, ZDHHC6 and ENPEP. (g) IMC images showing co-localization of VIM and ACTA2 expression in the glomerulus (white arrow) and ACTA2 expressing pericytes (yellow arrow). Abbreviations: MC-mesangial cells; Podo-podocytes; HPA-Human Protein Atlas; IHC-immunohistochemistry; IMC-imaging mass cytomtery.
Mesangial cells are modified smooth muscle-like cells present in the glomerulus to provide structural support, basement membrane remodeling and maintenance of vascular integrity. They are highly similar in function to vSMCs/pericytes with contractile ability. Therefore, they share markers with these cell types and other known markers of fibroblasts, making it challenging to identify these cells by a combination of markers alone without spatial information35. They are however known to express a basal level of chemokines which are upregulated under certain conditions36.
We found three cells that co-expressed COL1A1, COL1A2, TPM2, MYL9, VIM, ACTA2, and chemokine CCL2, but devoid of RGS5 (cluster 21; Fig. 1b-c, 4e, 5c and Supplementary Fig. 5k and 7a). Owing to the lack of known specific markers to distinguish these cells from fibroblasts, we used IMC to assess the abundance and localization of ACTA2 and VIM double-positive cells. While ECs within the glomeruli are VIM-positive and ACTA2-negative, we also identified a few cells within the glomeruli that are ACTA2/VIM double-positive. Though many cells were positive for either of each across the entire tissue section, there were no such double-positive cells outside of the glomeruli (Fig. 5g and Supplementary Fig. 7). Thus we would suggest that these three cells, co-expressing many genes specific to only these cells, are likely mesangial cells (CL_0000650).
Immune cells
The kidney is a highly vascularized tissue so we anticipated capturing immune cells of the peripheral blood. In addition, interstitial myeloid cells within the kidney - macrophages and dendritic cells - have been described37,38. Lymphocytes (T, NK, B and plasma), all presumed to be peripheral blood derived, were well represented in our data (65.6% of immune cells) and identified by classic markers of each cell type (clusters 7-9 and 22, Fig. 1b-c and 6)39. A cluster of 20 mast cells was also identified (cluster 15, Fig. 6) (CL_0000097). Two clusters of myeloid cells representing 32.9% of the immune cell population were identifiable based on the expression of CD68 (cluster 3 and 11, Fig. 1b and 6e)39.

(a) Heatmap showing markers of major immune cell populations. Cells are arranged as columns, rows are genes. Color scheme represents Z-score distribution from −2 (blue) to 2 (dark red). (b-f) Panel plots showing the expression of key marker genes for each major immune cell type. Expression is represented as log CPM, from 0 (grey) to 3 (orange) (g) Illustration of different cell subsets within the combined myeloid cell cluster.
To better characterize the myeloid lineage cells, we combined the two CD68+ clusters for re-analysis. Prior to this, it was apparent that a major contributor differentiating these two clusters was the expression of CD52, high in cluster 3 (and additionally expressed in the T/NK/B/mast cell clusters) and low in cluster 11. CD52 is a known marker of peripheral blood cells and, as a highly negatively charged molecule, speculated to function in inhibiting adhesion. It has also been described to be absent on tissue-resident T cells and DCs40,41. This suggested CD52+ cluster 3 represents monocytes of the peripheral blood and CD52- cluster 11, the interstitial myeloid cells. Subsequent analysis showed CD52 low/negative cells containing markers of interstitial macrophage and dendritic cells (DC) (Fig. 6e, g), specifically a sub-population marked by CD1C, CLEC10A and FCER1A39 which we define as CD1c DCs (CL_0002399), and another subset expressing high levels of the tissue-resident macrophage marker C1QA42. RNASE1 and SEPP1 also marked this C1QA+ population, and RGS1 more broadly the CD52 low/negative cells. Thus, within the myeloid compartment we define clusters of classical (CL_0000860) and non-classical monocytes (CL_0002396) in addition to interstitial macrophage and DCs (Fig. 6e, g) and provide evidence for the utility of CD52 in differentiating between peripheral blood and interstitial immune cells.
Receptor-ligand interactions
We explored potential communication axes between cell types by investigating the expression patterns of ligands and receptors in all the cell types identified in our data (Fig. 7a-b). While numerous ligand-receptor interactions could be discerned from our analysis, immune cells (myeloid lineage and T/NK/B lymphocytes) were the largest receivers of ligands, followed by ECs and intercalated (IC-A, IC-B) cells. On the contrary, PVALB+ DCT1 segment and ICA-2 (novel intercalated cells) were predominantly ligand presenters (Fig. 7c). Of particular interest are interactions between: (1) vSMC/pericyte and endothelial cells (PDGFRB-PDGFB)43; (2) DCT2-CNT-CD segments and ICs (KITLG-KIT)29; (3) podocytes and ECs (VEGFA - FLT1/KDR)44; and (4) IC-As and ECs (SLIT2-ROBO4) (Fig. 7a-h)45–47. Our analysis identified possible signaling axes that may be important for proper kidney function and potentially disrupted in kidney pathologies.
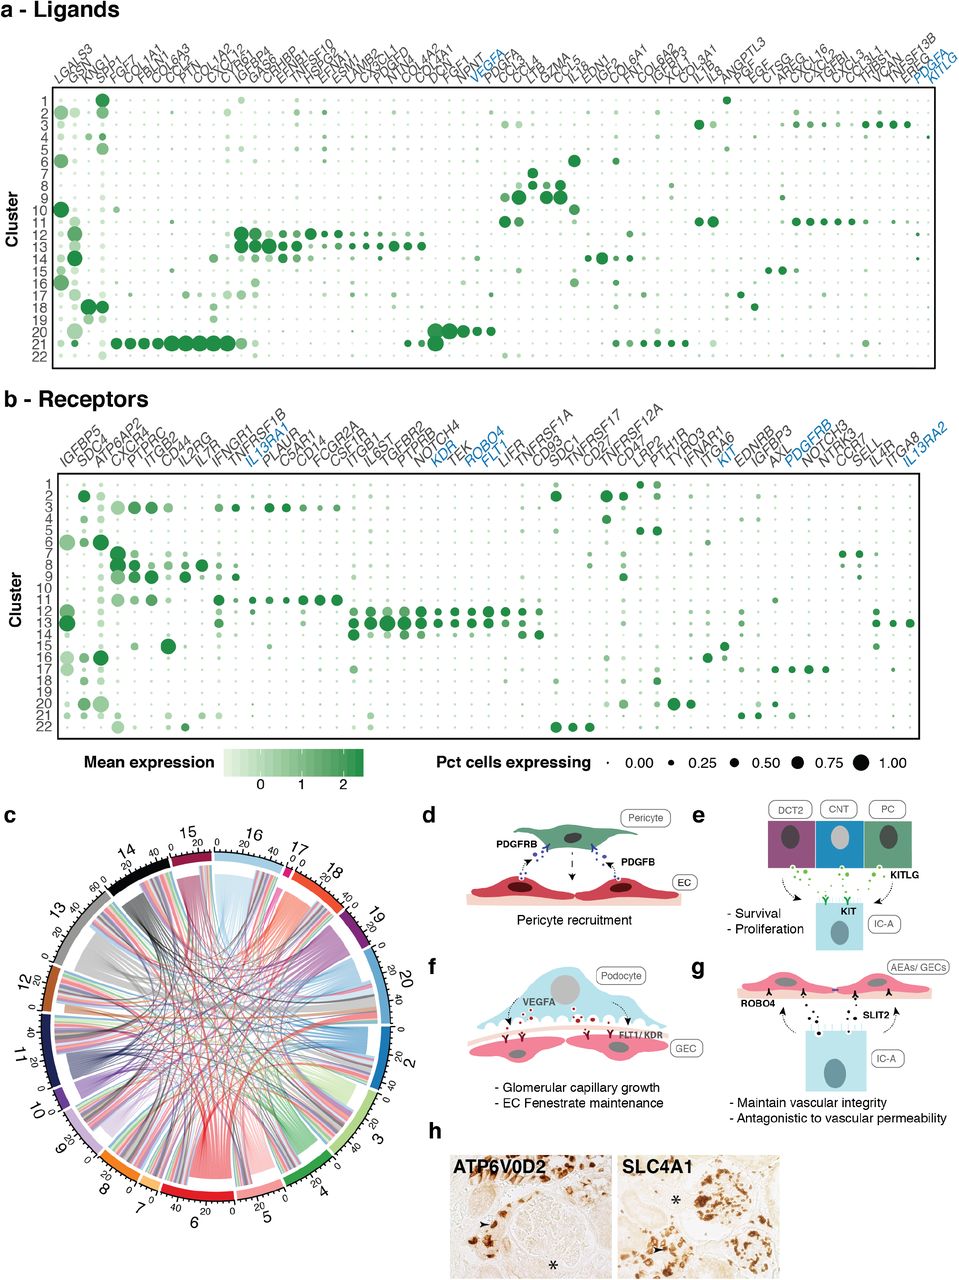
(a) Bubble plots showing the mean expression level of selected ligand and (b) receptor encoding genes across all clusters. Signaling molecules discussed in text are shown in blue. Size of dots represents percentage of cells expressing a particular maker and intensity of color indicates level of mean expression. Legends are shown below. (c) Circos plot depicts potential interactions between ligand and receptor pairs found in our dataset. Inner ring represents broadcasting ligands, outer ring represents presenting receptors. Numbers correspond to cluster numbers. Illustrations depicting potential signaling interactions between (d) pericytes and endothelial cells, (e) IC-A and DCT2, CNT and PCs, (f) podocytes and glomerular endothelial cells, (g) IC-A and glomerular/afferent-efferent arteriole endothelial cells. (h) IHC of pan-IC and IC-A markers showing presence of ICs in close proximity to AEAs. * indicates AEAs. Abbreviations: EC-endothelial cell; IC-A-intercalated cell type A; DCT2-distal convoluted tubule 2; CNT-connecting tubule; PC-principal cell; GEC-glomerular endothelial cell; AEAs-afferent-efferent afterioles; IHC-immuno histochemistry
Long non-coding RNAs
Long non-coding RNAs (lncRNA) display cell-type-specific expression and thus have utility in distinguishing cell types48. Our analysis uncovered cell-type specific expression of lncRNAs in ECs (AC011526.1/PCAT19), podocytes (LINC00839, RP11-550H2.2) and B cells (LINC00926)49. ICs expressed CTB27N1.1/LINC01187 (IC-A, IC-B) and PART1 (IC-A1/2), whereby PART1 has been shown to be upregulated in chromophobe renal cell carcinoma which originates from ICs50.
Intriguingly, the widely studied MALAT1 and NEAT1 were abundantly expressed in all clusters except distal tubule, PT and ICA-2 (Supplementary Fig. 6). Their distinct expression, or lack thereof, in specific cell-types argues for further investigation into their functions in the kidney.
Kidney disease genetic risk genes associated with distinct cell types
Numerous studies have identified causal genes and their variants associated with various kidney diseases10,11. We examined the expression patterns of causal genes involved in chronic kidney disease (CKD and estimated by serum creatinine, eGFRcrea), albuminuria, IgA nephropathy, nephrolithiasis and lupus nehpritis. Kidney disease-associated genes from GWAS were largely localized in proximal tubule, podocytes, endothelial and myeloid cells. Our analysis confirmed the cell type specific expression of CKD causal gene UMOD in TAL/DCT51, Idiopathic Membranous Nephropathy causal gene PLA2R1 in podocytes52 and eGFRcrea causal gene DACH1 in podocytes53. It also revealed the cell type specific expression of numerous other kidney disease associated genes which were previously unknown - NAT8 (CKD) in PT cells, IGFBP5 (eGFRcrea) in IC-A and ECs, CUBN (albuminuria) in PT cells, and NOTCH4 and DNASE1IL3 (lupus nephritis) in ECs (Fig. 8)10,11,54.

(a and b) Bubble plot showing the mean expression of genes associated with different kidney diseases identified in genome wide association studies (GWAS). (c) Bubble plot showing the mean expression of MHC type I and type II genes. Size of dots represents percentage of cells expressing a particular maker and intensity of color indicates level of mean expression. Legends are shown in panel (a). Abbreviations: eGFRcrea-estimated glomerular filtration rate creatinine; IMN-Idiopathic membranous nephropathy; IgAN-IgA nephropathy; MHC – Major histocompatibility complex.
An interesting side note on HLA molecules, included in this analysis, identified HLA class II molecules, generally abundant in professional antigen presenting cells, expressed on all ECs. In addition, MHC Class I molecules (HLA-A, HLA-B, HLA-C, B2M), which are believed to be expressed in all nucleated human cells, were strikingly low in PT, DCT1 and IC-A2 (Fig. 8c).
Discussion
We present an unbiased single cell analysis of the human kidney to define cell-type specific transcriptomes. Previous single cell transcriptome studies on kidney were mostly performed in mice and/or were focused on a specific kidney cell type (mesangial, podocytes, principal and intercalated cells)29,55–57. Our unbiased analysis has identified 27 different cell types including 17 non-immune and 10 immune cell types. We have confidently mapped the transcriptome of the nephron, collecting duct cell types and interstitial macrophages and DCs based on uniquely expressed markers. In addition, we describe cell type-specific expression of solute carriers, channels, transporters, receptors and ligands that will be useful to delineate the multitude of functions performed by the various kidney cells. We also identified new markers and lncRNAs uniquely expressed in specific cell types such as IC subtypes, the distal nephron, podocytes and endothelial cells.
Novel cell populations in the human kidney
We discerned the heterogeneity within various cell types, such as the intercalated (IC-A1, IC-A2 and IC-B) and endothelial (AVR, DVR and AEAs) cells. We identified a novel IC-A subtype (IC-A2) and a CLDN5+ endothelial population. The novel ICA-2 expresses PVALB, which functions to buffer Ca2+ and Mg2+ ions in the distal nephron. We postulate that since PVALB is well-known to mark the early DCT, the IC-A2 subtype likely resides in this segment. Although the IC-A2 subset was present in two different kidney samples, whether this cell type represents a transitional state present only under certain physiological conditions remains to be verified. CLDN5+ ECs have been described before in kidney, we show here that they segregate as a separate subtype of ECs. CLDN5 is a tight junction protein expressed in microvascular ECs forming endothelial barriers of lung, brain (blood-brain-barrier), retina, spinal cord and kidney, and decrease in its expression is associated with increase in paracellular permeability58–60. Although GECs are known to be fenestrated but lack PLVAP, we found PLVAP expression in a subset of these ECs along with CAV1 and AQP1, indicating that GECs use multiple modes of transcellular transport61.
Protective and survival signaling between the kidney cell types
In addition to cell type classification, we also investigated cell-to-cell communications. While PDGFB-mediated recruitment of pericytes to ECs is well known, KIT-KITLG signaling in ICs has only been recently described29,43. Chen et al (2017) described the expression of KIT receptor in IC-A, and IC-B (weakly) cells and its ligand, KITLG, in principal cells29. We detected KIT in IC-A but none in IC-B or novel IC-A2 cells, and KITLG was expressed in PCs as well as DCT2 (SLC12A3+) and CNT in human kidney. KITLG-KIT tyrosine kinase receptor signaling activates the MAPK, PI3K, JAK-STAT and PLC-PKC pathways. KIT signaling is therefore associated with cell proliferation, survival, adhesion and chemotaxis62,63. We hypothesize that the KITLG secreted by cells of these distal nephron, where IC-A are found interspersed, plays a role in their survival and proliferation.
Another notable interaction was among podocytes, ICs and ECs. VEGFA-FLT1/KDR signaling axis between podocyte and ECs is essential for glomerular capillary growth and maintenance of endothelial fenestrae44. On the other hand, SLIT2-ROBO4 function antagonistic to VEGF-mediated vascular permeability, whereby they upregulate CLDN5 and CDH5 in ECs, thus impeding paracellular transport and maintaining vascular integrity45. Intriguingly, IC-A cells expressed SLIT2, which encodes a secreted glycoprotein. We postulate that ECs in reasonable proximity to IC-As, such as AEAs will be subject to this restriction to vascular permeability. Indeed, our histology analysis shows the presence of ICs close to AEAs, indicating SLIT2-ROBO4 signaling may be responsible for CLDN5 induction in these ECs. Moreover, several studies have implicated a role for SLIT2-ROBO4 signaling in the regulation of vascular and renal injury mediated through infiltrating immune cells46,47. While ICs are known for their role in immune response against bacterial infection, SLIT2 expression by IC-A implicates these cells in a potentially new and alternative protective role in kidney injury24.
Unexpected expression of plasma protein encoding genes in proximal tubule cells
Interestingly, we found that PT cells expressed plasma protein encoding genes (ALB, RBP4, GC, and PROC), which are reported to be synthesized and secreted by the liver15–17. Urinary ALB and RBP4 are biomarkers of albuminuria and CKD (nephritis) and renal Fanconi syndrome, respectively10,17. The presence of albumin in the urine is an indication of glomerular and tubular injury owing to dysfunction in filtration. Likewise, elevated serum and urinary RBP4 levels are attributed to increased RBP4 synthesis in the liver as well as a failure in proper reabsorption of RBP4-retinol complex by PT cells64. Our observation of ALB and RBP4 expression in the PT cells raises important questions regarding the source of urinary ALB and RBP4, and perhaps indicates issues not only with reabsorption but also cellular damage of PT cells in kidney diseases. Expression of these plasma protein genes in the kidney warrants further investigation into its potential role as an alternative site for plasma protein production.
Dysfunction of endothelial cells in kidney pathologies
Our analyses suggest an underappreciated role for ECs in a wide range of kidney pathologies. Several of the genes specifically expressed in the ECs (i.e. GSN, DNASE1L3, IL13RA1, IL13RA2, TGFBR2) are associated with various kidney diseases. For instance, unique mutations within GSN lead to a kidney-specific form of gelsolin amyloidosis. A loss-of-function (LOF) variant in DNASE1L3 is a cause of a familial form of systemic lupus erythematosus (SLE) correlating with a high frequency of lupus nephritis54. Other LOF mutations in this gene have been associated with hypocomplementemic urticarial vasculitis syndrome (HUVS), which is partly characterized by glomerulonephritis65. IL13RA1 and IL13RA2 have been implicated in tissue fibrosis. IL13RA2 has been implicated in the induction of TGFB1-mediated fibrosis in colitis and pulmonary fibrosis66,67. The ligand, TGF-beta is known to strongly promote renal tubulointerstitial fibrosis. Interestingly, conditional ablation of TGFBR2 in mouse kidney interstitial cells, the cell type considered to be mediating fibrosis, did not reduce fibrosis in a kidney injury model68 suggesting an alternative cell type is involved. We hypothesize that TGF-beta induced fibrosis in the kidney intimately involves this TGFBR2high and IL13RA2+ DVR endothelial cell population. Thus, endothelium restricted expression for these genes implies a central role for the peritubular capillaries in the associated pathologies.
In summary, the detailed analyses of the kidney cell types that we present in this study will serve as an important resource that will allow for a comprehensive understanding of kidney function and specific dysfunction in kidney pathologies.
Materials and Methods
Procurement of kidney biopsies and FFPE sections
Freshly resected renal biopsies and corresponding FFPE sections were obtained from UConn Health Research Biorepository from de-identified consented patients (male and female, age – 62-66) undergoing kidney nephrectomy for clear cell renal cell carcinoma (ccRCC). These samples were determined not to be human subjects research by the JAX IRB (IRB Reference Number: 2017-019). Only biopsies from “normal” regions (assessed by pathologists) of the kidney were utilized in this study.
Tissue dissociation, Ab staining and FACS
Kidney tissue was processed by enzymatic dissociation with Collagenase IV (600U/mL) and DNAse (2ug/mL) for a maximum of 45min and neutralized in collection buffer (1% BSA, 10%FBS, 2mM EDTA in RPMI). Cells were spun down and treated with ACK lysis buffer (A1049201, GIBCO) for 3 min on ice and washed with collection buffer. Cells were then stained for Calcein AM (C3100MP) and DAPI (Lifetech D1306, 1ug/mL) and sorted by Fluoresence-Activated Cell sorting (FACS) to select only live cells for downstream single cell transcriptomic analyses.
Single cell RNA-sequencing
Sorted cells were washed once with 0.04% BSA in PBS and counted on Countess II automated cell counter (ThermoFisher). 12,200 cells were loaded per lane on the 10x Chromium platform and processed for cDNA synthesis and library preparation as per manufacturer’s protocol. Kidney 1 sample was processed using Chromium™ version 1 chemistry while Kidney 2 and Kidney 3 samples were processed by version 2 chemistry. cDNA and libraries were checked for quality on Agilent 4200 T apestation and quantified by KAPA qPCR before sequencing on a single lane of a HiSeq4000 (Illumina).
scRNA-seq analysis
Cellranger v1.3 was used to convert Illumina base call files to FASTQ files. These FASTQ files were aligned to the hg19 genome and transcriptome provided by 10X genomics. The gene vs cell count matrix from Cellranger was used for downstream analysis. Cells with less than 500 transcripts and genes with less than 2 counts in 3 cells were discarded. The top 1000 genes with the most variance were identified based on their mean expression in the population and dispersion (variance / mean expression). Genes were binned into 50 different bins based on their mean expression and dispersion scaled with respect to the median dispersion in each bin. These genes were used to reduce the dimensions of the dataset using Barnes Hut t-SNE using default parameters. Cells were clustered in t-distributed stochastic neighbor embedding (tSNE) space using density-based spatial clustering of applications with noise (DBSCAN). Marker genes were identified using area under a receiver operating characteristic curve (AUROC) analysis. All genes that are greater than 2-fold expressed in the cluster compared to the rest of the population were analyzed using AUROC. Genes that had greater than 85% classification score were defined as markers specific to the cell type. Kidney 1 data analysis was performed separately since it was processed by version 1 chemistry. We identified the same set of cell types and markers in the kidney sample 1 as kidney 2 and kidney 3 (Supplementary Fig. 8).
Ligand-receptor pair analysis
We used a list of receptors and ligand pairs from published databases69. Any ligand or receptor was classified as expressed if greater than 50% of the cells had non-zero counts within each cell type. To prevent spurious detection of ligand-receptor interactions due to extremely high or low cell numbers, we disregarded PT cells (cluster 1), podocytes (cluster 20), mesangial cells (cluster 21) and plasma cells (cluster 22). This is reflected in the interaction plot in Fig. 7c, which was rendered using the R package circlize.
Immunohistochemistry
FFPE sections of 5 micron thickness were obtained from UCONN biorepository. Sections were prewarmed on slide warmer for 10min at 55oC and de-paraffinized using Histoclear (HS-200, National diagnostics). Sections were then rehydrated through an ethanol gradient (100%, 95%, 90%, 70% for 3 min each) and rinsed once in water. Antigen retrieval was then performed either in alkaline (BSB 0030, BioSb) or R-universal buffer (AP0530-500, EMS) (121oC, 15min) in a TintoRetriever pressure cooker (BSB 7008). Immuno-staining was then performed using BioSB kit (Mouse/Rabbit PolyDetector Plus DAB HRP Brown Detection System, BSB 0257) as per manufacturer’s instructions with a minor change - primary Ab was incubated overnight at 4oC. List of antibodies used are provided in Supplementary Table 2.
Imaging Mass Cytometry
FFPE sections (5um thick) were stained with metal-tagged antibody cocktail as per the protocol described by Chang et al 2017, with some modifications70. Briefly, tissue sections were rehydrated as outlined above and heat-mediated antigen retrieval was performed in citrate buffer (BSB 0023) in the TintoRetriever pressure cooker (121oC, 7 min). Slides were then blocked for 45 mins at room temperature with PBS containing 5% FBS and 3% BSA. Following blocking, sections were incubated with a cocktail of metal-tagged antibodies (Supplementary Table 2) overnight at 4oC. Slides were then washed and stained with Iridium intercalator (201192B, Fluidigm) at a final concentration of 0.25uM for 30 min at RT. Slides were then washed with distilled water and air dried. The slide was then loaded on the Hyperion™ system (Fluidigm), regions of interest were identified and tissue ablation was performed. The resulting .mcd files were exported as .tiff through MCDViewer (Fluidigm).
Data availability
The datasets generated during and/or analysed during the current study are available in the GEO and SRA repository. These are currently embargoed until publication. SRA Study Accession ID: SRP126175, SRA Run Accession ID: SRR6348583, SRR6348584, SRR6348585, SRR6348586.
Code availability
All the code to process, analyze and generate figures will be made available on github as ipython notebooks: https://github.com/mohanbolisetty/scRNASeq-Kidney.
Author contributions
VS, MB, SS and PR conceived the study, analyzed data and wrote the manuscript. VS, MB, SS, SB and DR performed the experiments. MB performed all computational analyses. Project administration and funding acquisition: PR.
Additional information
Supplementary figures and supplementary table 1 are attached to this paper.
Acknowledgements
We thank Vinod Yadav and Krishna Karuturi for providing a curated ligand-receptor list, Lori Perpetua from UCONN Biorepository for assistance with samples, Fluidigm for contributing antibodies for IMC and IHC, Anthony Carcio from JAX FACS core facility. This work was supported by the JAX Scientific Services Innovation Fund and by laboratory startup funds to PR. All the authors read and approved the manuscript. All the authors declare no conflicts of financial interest.


