

ABSTRACT
MicroRNA-mediated (dys)regulation of gene expression has been implicated in many complex traits including Parkinson’s disease (PD). However, results of microRNA expression studies in PD have been inconclusive. To identify microRNAs that show consistent differential expression in PD, we performed a systematic literature search on microRNA expression studies in PD and extracted extensive data from all eligible publications. After stratification for source of tissue we performed p-value based-meta-analyses across microRNAs assessed in three or more independent datasets. Our literature search screened 459 publications and identified 34 datasets from 27 publications eligible for meta-analysis. On these, we performed 149 meta-analyses on microRNAs quantified in brain (n=124), blood (n=21), or cerebrospinal fluid (CSF) samples (n=4). We identified 15 significantly (Bonferroni-adjusted α=3.36×10⁻⁴) differentially expressed microRNAs in brain (n=4) and blood (n=11). Significant findings in brain were observed with hsa-miR-132-3p (p=6.37×10⁻⁵), hsa-miR-497-5p (p=1.35×10⁻⁴), hsa-miR-628-5p (p=1.67×10⁻⁴), and hsa-miR-133b (p=1.90×10⁻⁴). The most significant results in blood were observed with hsa-miR-221-3p (p=5.02×10⁻¹⁹), hsa-miR-15b-5p (p=2.49×10⁻¹²), and hsa-miR-185-5p (p=4.72×10⁻¹¹). No significant signals were found in CSF. Analyses of GWAS data for the target genes of the differentially expressed brain microRNAs showed significant association (α=9.40×10⁻⁵) of genetic variants in nine loci. Taken together, we identified several microRNAs that showed highly significant differential expression in PD blood and brain. Future studies may assess the possible role of the differentially expressed miRNAs in brain in pathogenesis and disease progression as well as the potential of the top microRNAs in blood as biomarkers for diagnosis, progression or prediction of PD.
INTRODUCTION
Parkinson’s disease (PD) is the second most common neurodegenerative disease affecting approximately 1% of people over the age of 60. The incidence of PD increases with age, and the disease thus poses a growing socio-economic burden on industrialized, aging populations (1). In the majority of cases, PD results from a combination of multiple genetic (2–4) and environmental as well as lifestyle factors (5,6). However, the currently known risk factors only explain a small fraction of the phenotypic variance of PD. Likewise, the progression of PD and its response to therapy represent multifactorial processes, which are currently only poorly understood (6).
It is likely that epigenetic mechanisms also contribute to PD development and progression (6,7). Epigenetics refers to mechanisms of gene expression regulation that are not mediated by the DNA sequence itself but rather by chemical or allosteric DNA modifications or by the action of regulatory non-coding RNAs. MicroRNAs (miRNAs) are small non-coding RNAs that serve as key posttranscriptional regulators of gene expression. They unfold their effects by sequence-mediated binding to messenger RNA molecules thereby decreasing translation of these transcripts (8). This mechanism has emerged as one essential factor for the correct development and function of a wide range of human tissues including the brain. In brain, miRNAs appear to play a role in essentially all processes related to neuronal function, including the development of neurodegenerative disorders such as PD (9–11). The prominent role that miRNAs may play for the integrity of the central nervous system is exemplified by experiments inducing a selective depletion of Dicer, the enzyme that cleaves precursor forms of miRNAs (pre-miRNAs) into mature miRNAs (12–14). Depletion of this protein in midbrain dopaminergic neurons in mice leads to neurodegeneration and locomotor symptoms mimicking PD in these animals (13). However, identifying the miRNAs playing the most important roles in PD development and progression still remains a challenge. In humans, several studies have reported on differential miRNA expression in brain tissue, cerebrospinal fluid (CSF) and blood-derived samples of PD patients compared to controls, but results have been largely inconclusive. This is in part due to the fact that only few miRNAs have been assessed and reported in more than one study, and that studies often analyze different types of tissues. In addition, sample sizes of most expression studies have often been comparatively small (Table 1). As a consequence, it has become exceedingly difficult to follow and interpret the often discrepant results.
Overview of published microRNA expression studies in Parkinson’s disease patients and controls
One way to address this challenge is to assess the cumulative evidence for differential miRNA expression profiles, e.g. by systematic meta-analyses combining all available published expression data in the PD field. Such approaches demonstrated their value in the context of genetic associations and of environmental risk factors in several common and complex (multifactorial) diseases including PD (e.g. ref. (3,5)). For gene expression studies, combining published data by meta-analysis is a particularly challenging task due to the non-standardized fashion that data are reported across publications. The aim of the current study was to overcome these difficulties and to identify the most consistently differentially expressed miRNAs in PD based on published evidence. To this end, we performed an extensive and systematic literature search to identify all relevant miRNA expression studies comparing PD cases versus controls and extracted data from all eligible papers using a standardized multi-stage protocol optimized for the extraction of expression data. Finally, we applied p-value based meta-analyses in order to identify miRNAs that are consistently differentially expressed in PD.
RESULTS
Our PubMed search on miRNA expression studies comparing PD patients versus controls yielded 459 publications, which were screened for eligibility of inclusion. A total of 42 publications were eligible for initial data extraction. After quality control, data from 34 independent datasets across 27 publications were subsequently included in the meta-analyses. Reasons for the exclusion of eligible datasets from meta-analysis are summarized in Figure 1 and Table 1.

Flowchart of literature search, data extraction, and analysis of miRNA expression data
MiRNA expression data included in the meta-analyses were derived from brain tissue, CSF, and/or blood-derived samples. Ten of the total of 34 datasets included in the meta-analysis were based on brain, 20 datasets on blood-derived samples, and four datasets on CSF. Only one of the included publications tested more than one tissue (blood and CSF (21)). Sampled brain regions of datasets included in the meta-analyses comprised substantia nigra/midbrain (n datasets=5), neocortex (n=4, comprising frontal, prefrontal, temporal, and anterior cingulate cortex), and amygdala (n=1; Table 1). The median number of study participants per dataset was 32 across all studies (interquartile range [IQR] 10-81, range 4-250) irrespective of the tissue analyzed. The median number of individuals was 10 (IQR 8-14, range 4-62) for brain tissue, 71 (IQR 35-113, range 13-250) for blood-derived tissue, and 93.5 (IQR 70-115, range 58-122) for analyses of CSF.
Across all 27 studies included in the analyses presented here, approximately half of the eligible studies (13/27, 48%) stated explicitly that they had performed age and sex matching in their study design. Furthermore, information on the age distribution in cases and controls was provided for 17 datasets (average difference across all 17 datasets: 4.7 years, Supplementary Table 1). Three studies indicated statistically significant differences in the age distribution between cases and controls. Similar observations were made for the reporting of sex matching (41% report sex matching, average difference between cases and controls: 7.9%; Supplementary Table 1).
Thirteen of all 27 studies used a targeted (“candidate miRNA”) approach to quantify miRNAs using RT-qPCR (n=11 studies), northern blotting (n=1), or a combination of methods (n=1). The remaining 14 studies applied a hypothesis-free (“mirRnome-wide”) screening approach using microarrays (n=2), next-generation sequencing (n=6), or TaqMan array micro RNA cards (n=6). The two studies using microarrays as an initial hypothesis-free approach applied targeted quantification methods for the top miRNAs in the same samples for validation.
The median number of miRNAs analyzed per study and included in the meta-analyses presented here was 4 (IQR 1.5-8) ranging from 1 to 123. Only four studies presented data on more than 100 miRNAs (Table 1). Overall, data for a total of 1,002 different miRNAs were reported across all studies, of which 136 had been assessed in at least three independent datasets in at least one tissue stratum and were thus eligible for meta-analysis (Supplementary Table 2). Another 348 miRNAs had been assessed in two studies in at least one tissue stratum, and the remaining 518 had been assessed in only a single study. Ten of the 136 miRNAs were meta-analyzed in both brain and blood tissue strata, one miRNA was meta-analyzed in brain and CSF, and one miRNA in all three tissues, overall resulting in 149 individual meta-analyses (Supplementary Table 2).
Meta-analysis results
One hundred twenty four meta-analyses were based on data collected in brain tissue, 21 in blood-derived tissue, and four in CSF samples. The median number of datasets included per meta-analysis across all miRNAs in brain, blood, and CSF was 3 (max. 4), 4 (max. 9), and 3 (max. 4), respectively. The median combined sample size across all miRNAs in brain, blood, and CSF was 88 (IQR 87-98), 476 (IQR 230-596), and 309 (IQR 309-323.5), respectively. On average, approximately equal numbers of cases and controls were included in each meta-analysis (Supplementary Table 2).
Four of the 124 miRNAs meta-analyzed in brain showed study-wide significant (α=3.36×10⁻⁴) differential expression in PD cases versus controls. Two miRNAs were up-regulated (hsa-miR-497-5p, p=1.35×10⁻⁴, hsa-miR-628-5p, p=1.67×10⁻⁴), while two (hsa-miR-132-3p, p=6.37×10⁻⁵, hsa-miR-133b, p=1.90×10⁻⁴) were downregulated in PD cases compared to controls (Table 2). In addition, 34 brain miRNAs showed nominally significant (α=0.05) differential expression (Supplementary Table 2); however, these results did not survive multiple testing correction (α=3.36×10⁻⁴). Sensitivity analyses on the prioritization for subsets of brain areas analyzed in the same samples showed that overall meta-analysis results were sufficiently robust regarding our prioritization procedure (Supplementary Table 3).
Significant meta-analysis results of differentially expressed miRNAs in brain and blood tissue of Parkinson’s disease patients and controls
Eleven out of 21 meta-analyzed miRNAs from blood-derived tissues showed study-wide significant (α=3.36×10⁻⁴) differential expression in PD cases versus controls with p-values ranging from 5.02×10⁻¹⁹ to 1.02×10⁻⁵. All eleven miRNAs were down-regulated in PD cases compared to controls (Table 2). The miRNA with the most statistically significant differential expression in blood was hsa-miR-221-3p (p=5.02×10⁻¹⁹). Four additional miRNAs showed nominally significant (α=0.05) differential expression (Supplementary Table 2), but did not survive multiple testing (α=3.36×10⁻⁴).
Of the four miRNAs meta-analyzed in CSF, none yielded significant results for differential expression in PD versus control individuals (Supplementary Table 2).
Interestingly, miRNAs hsa-miR-19b-3p, hsa-miR-185-5p, and hsa-miR-29a-3p showed at least nominally significant expression differences in both brain and blood. Hsa-miR-19b-3p and hsa-miR-185-5p were down-regulated in both brain (p= 7.29×10⁻⁴ and p=0.0034, respectively) and blood (p= 1.35×10⁻¹⁰ and p=4.72×10⁻¹¹, respectively) in PD versus controls. Hsa-miR-29a-3p was up-regulated in brain (p=0.0322) and down-regulated in blood (p=2.66×10⁻⁷; Supplementary Table 2).
Target gene analysis of top differentially expressed brain miRNAs
Based on published functional data available on miRTarBase (18) and on brain-specific HITS-CLIP data (19), all four top brain miRNAs target messenger RNAs from genes located in established PD risk loci or from causal PD genes (Figure 1, Supplementary Table 4). For instance, based on the available brain HITS-CLIP data, hsa-miR132-3p binds to the messenger RNAs of SNCA and of SCN3A, and hsa-miR-497-5p binds to the messenger RNA of CCNT2 (Supplementary Figure 1, Supplementary Table 4).
Considering all sets of genes targeted by any of the top four brain miRNAs, no set of targets showed significant enrichment (α=0.05) for genetic association with PD from GWAS data (Supplementary Table 5). However, the GWAS results of genetic variants mapping in target genes of the top brain miRNAs (after exclusion of the established risk loci already evaluated above) revealed nine additional loci that showed significant association with PD (α=9.40×10⁻⁵, Bonferroni-adjusted for the number of evaluated target genes [n=532], Supplementary Table 6).
Comparison of miRNAs featured in original publications versus meta-analysis results
Across all eligible studies a total of 62 different miRNAs were “featured” in the original publications, i.e. they were prominently highlighted as showing differential expression in PD patients versus controls in the abstract of the respective publication. Only 8 (~13%; hsa-miR-1-3p, hsa-miR-29c-3p, hsa-miR-30b-5p, hsa-miR-34b-3p, hsa-miR-133b, hsa-miR-195-5p, hsa-miR-205-5p, hsa-miR-214-3p) of these were featured in two studies, and 4 (~6%; hsa-miR-19b-3p, hsa-miR-24-3p, hsa-miR-29a-3p, hsa-miR-221-3p) in more than two studies. More than half of these featured miRNAs (35/62, 56%) were meta-analyzed in our study. Of note, twelve of these 35 miRNAs (~34%), indeed, showed study-wide significant association (α=3.36×10⁻⁴) in our meta-analyses, whilst an additional eight (~23%) showed nominally significant association (α=0.05). In contrast, nearly half (i.e. 15 of 35 miRNAs (43%)) that had been prominently highlighted in at least one publication did not show any significant results in our meta-analyses. In addition, and perhaps more importantly, miRNAs miR-497-5p and miR-628-5p, showing study-wide significant results in our brain-stratified meta-analyses, and hsa-miR-451a, showing study-wide significance in the blood-stratified meta-analyses, were not featured in any of the original studies.
Comparison of original versus replication evidence
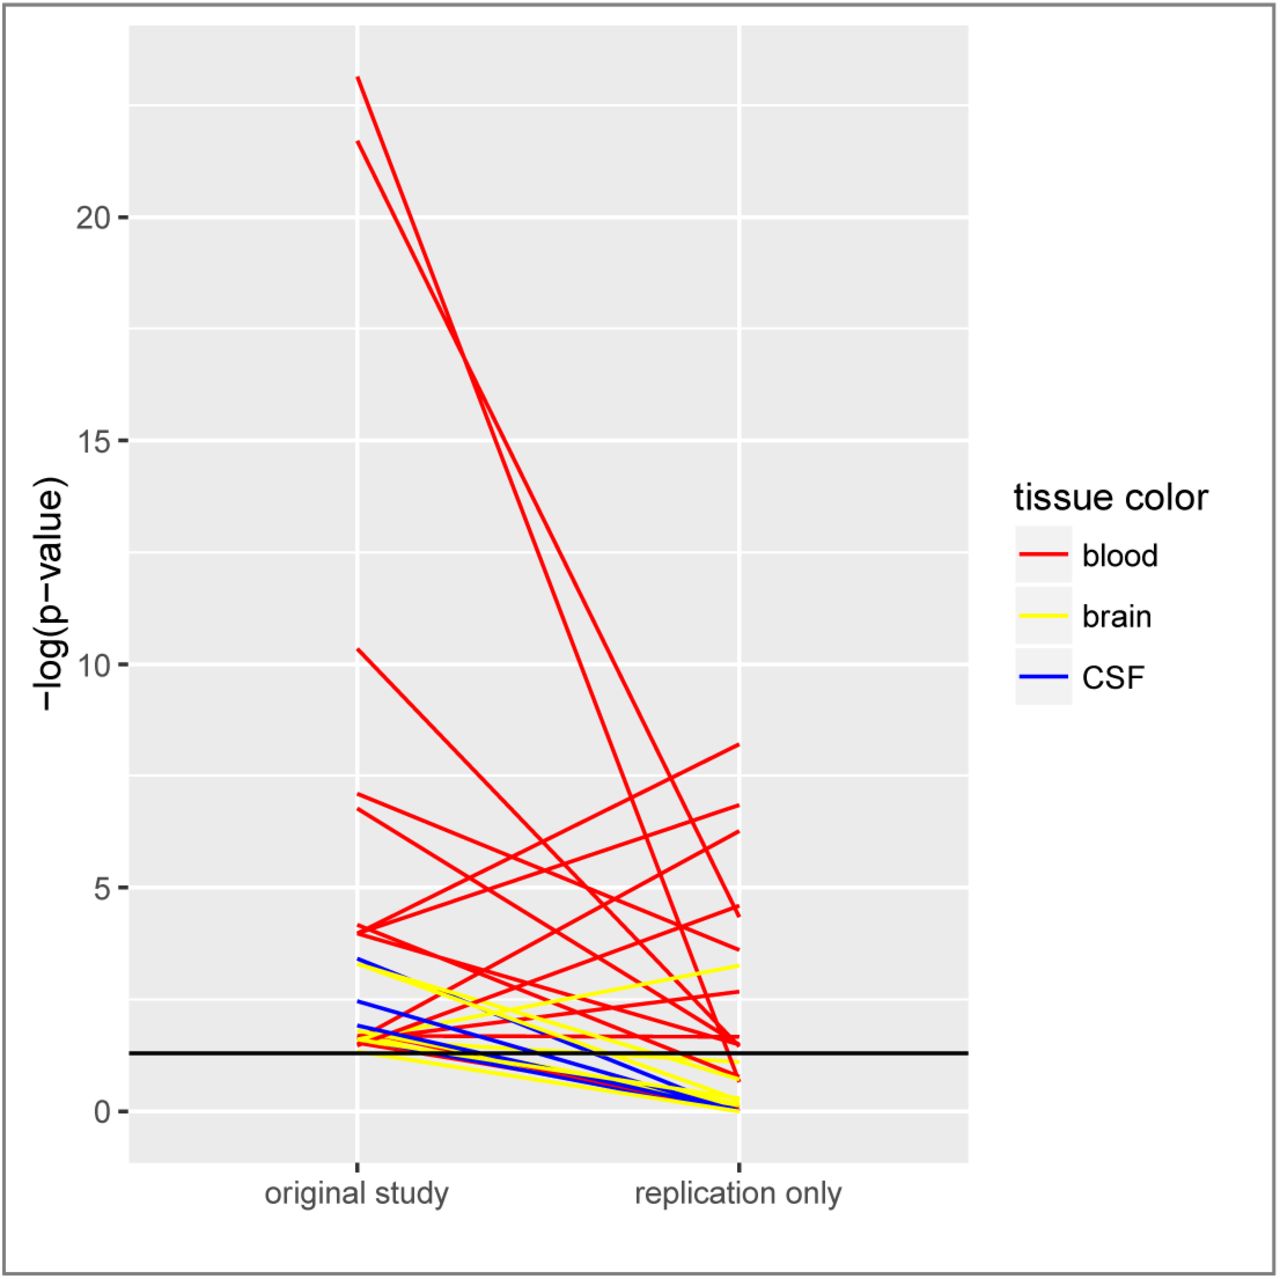
To further assess the reproducibility of significant miRNA expression results, we compared all at least nominally significant p-values from the original study with results from independent replication data only (replication data were combined by meta-analysis, where applicable; Figure 2). For 29 (19%) of all 149 meta-analyses, nominally significant (two-sided α=0.05) differential miRNA expression was recorded by us for the first study. Less than half of these results (n=12, 41%) were replicated with at least nominal significance (one-sided α=0.05) when all available independent replication data were combined, and nine of these 12 results that replicated also yielded study-wide significance (two-sided α=3.36×10⁻⁴) upon meta-analysis of all data (i.e., combining original and replication data). Interestingly, the failure of replication of original results was predominately observed in CSF and brain while most blood-based findings showed good evidence for replication (Figure 2).
Legend. This figure displays all at least nominally significant two-sided p-values of the respective original studies (data from independent datasets derived from the original study were combined by meta-analysis where applicable), and the corresponding (one-sided) p-value from all replication data only (combined by meta-analysis where applicable). Note that p-values from all other meta-analyses in this paper are two-sided; a one-sided p-value was chosen here to take into account the directions of effect in the replication data. Corresponding p-values of original and replication data are connected by a line (yellow line = brain-stratified results, red line = blood-stratified results, blue line = cerebrospinal fluid-stratified results). The y axis shows the negative log of the p-value, i.e. larger values indicate more significant results. The horizontal black line corresponds to a p-value of 0.05.
DISCUSSION
Following a systematic literature search and standardized data extraction, we analyzed data from all hitherto published eligible miRNA expression studies in PD patients versus controls. We identified 15 miRNAs that were significantly differentially expressed in brain or blood samples across at least three independent studies. To the best of our knowledge, our study represents the first quantitative assessment of published human miRNA expression data in Parkinson’s disease. Furthermore, we are not aware of any other neurodegenerative research field having applied a comparable approach to collate published miRNA expression results. Therefore, our study not only provides unique insights into the current knowledge of miRNA expression differences in PD but may also be taken as a model for performing equivalent analyses in other neurodegenerative diseases.
One of the strengths of this study is the increase in sample size (and thus power) by combining all available and eligible data into one statistical test. As outlined above, sample sizes of individual miRNA studies comparing human tissues in PD patients and controls are often small with a median sample size of only 32 per dataset. This is especially true for studies of brain datasets (median sample size=11). By meta-analysis, we were able to increase the sample size substantially (median sample size in brain-stratified meta-analysis=88). At the same time, by combining data from at least three independent studies, random as well as systematic errors occurring only in a single dataset will have a less pronounced impact on the resulting test statistic.
The majority of datasets (59%) included in our meta-analyses quantified miRNAs in blood-derived samples, and they were based on comparatively large sample sizes. Thus, the corresponding meta-analyses comprised the largest sample sizes of all three tissue strata (median n=476). While the second most commonly analyzed tissue across datasets was derived from post-mortem brains (in approximately one third of all eligible PD miRNA expression studies), the overall sample sizes were comparatively small (median n in the brain tissue-based meta-analyses=88). Therefore, most of the brain-stratified analyses presented here are underpowered to detect only modest changes in miRNA expression. At the same time, significant results need to be considered with caution. Thus, a substantial increase in sample size should be one of the major objectives in future small RNA expression studies focusing on brain tissue.
Comparisons of miRNAs featured in the original publications with those included in our meta-analyses and our assessment of the replication evidence for originally significant results revealed that the majority of miRNAs showing compelling results in the first study cannot be replicated in independent investigations and do not have statistical support for differential expression in our meta-analyses. Along these lines, qualitative reviews on the role of miRNAs in PD are largely based on a (subjective) selection of the literature that does not hold up to systematic meta-analyses. For instance, in five recent articles reviewing the role of miRNAs in PD based on human expression or on experimental data (four qualitative reviews (7,22–24) and one systematic review (25)), 190 miRNAs were highlighted as being at least potentially relevant in PD (Supplementary Table 7). Of these, human expression data were lacking or sparse for 117 (62%), i.e. they could not be meta-analyzed here. Among the remaining 73 miRNAs, 55% did not show any evidence for differential expression, and 27% did not reach study-wide significance but only nominal significance in our meta-analyses. In other words, only 13 (7%) of the total of 190 miRNAs highlighted in five recent reviews showed significant and consistent evidence for differential expression in PD. Furthermore, the two miRNAs hsa-miR-497-5p and hsa-miR-628-5p, which were study-wide significant in our meta-analyses, were not mentioned in any of the five reviews. These observations highlight the need for independent replication and validation of proposed miRNAs as well as for regular quantitative – rather than merely qualitative – assessments of the available (published) evidence in the literature.
Most of the differentially expressed miRNAs identified in our meta-analyses were based on blood expression data. While these results will likely not reveal novel insights into disease pathophysiology, as the neurodegenerative process takes place in brain, these miRNAs may still have the potential to serve as “classification markers” for (prevalent) PD. It should also be noted that gene expression is not only tissue-specific but also highly variable over time. Thus, differential expression of miRNAs in the currently available literature does not allow to draw conclusions on cause-effect relationships in PD, meaning that we cannot differentiate whether the expression differences of top miRNAs in PD patients vs. controls are the cause or the result of pathophysiological processes, disease progression and/or treatment effects. This is true for both blood and brain and for any investigation examining (prevalent) PD patients. In this context it is noteworthy that all eleven miRNAs in the blood-based results appear to be “downregulated” in PD cases as compared to controls. This may reflect changes in gene expression and/or cell compositions as a result of disease progression or perhaps most likely treatment effects. Further, in the brain-derived results, especially those from substantia nigra, it is also possible that differences in miRNA expression levels might only reflect the change of cellular composition in the diseased tissue, e.g. the loss of dopaminergic neurons in the course of the disease. As most studies normalize the results using general house-keeping genes, such effects will not necessarily be removed entirely. For the four top brain miRNAs in PD, two were down-regulated and two were upregulated, which does not allow to draw any further conclusion on the presence of such effects in the brain.
Unfortunately, the vast majority of publications do not provide any information on disease duration, severity, and treatment of patients prior to tissue donation, and, for bulk brain tissue, neuropathological progression markers. Thus, the impact of these factors on the respective miRNA expression results is impossible to assess adequately. Addressing this question would mean to perform sufficiently sized case-only studies that correlate disease progression markers/received therapeutic regimes with the expression of the top miRNAs. An effective way to avoid potential bias arising from the usage of bulk brain tissue is to perform single-cell experiments in cells of interest, e.g. dopaminergic neurons, in sufficient numbers of cells and PD patients and controls. However, while a meta-analysis has recently been published for messenger RNA-based transcriptomics studies applying laser capturing for single cell analysis in the substantia nigra (26), equivalent data for small RNAs are currently lacking. For instance, only three of the 42 PD miRNA expression studies identified in the literature search for this study have applied laser dissection of dopaminergic neurons in two independent datasets comprising eight PD patients and eight controls (27,28) and five PD patients and eight controls (29), respectively. While the later study suggested differences in miRNA expression of cases and controls between bulk tissue and single dopaminergic neurons, more data are needed to conclusively address this issue.
In addition, a study design that does not consider age and/or sex matching for cases and controls may produce biased gene expression results, which as a consequence would also have an impact on our meta-analyses. As described in the results section, the majority of datasets had comparable age and sex distributions of cases and controls. Notwithstanding we cannot exclude that missing or inappropriate age and/or sex matching has had an impact on some of our meta-analysis results. This highlights the need for a more consistent control of these variables in the study design and statistical analyses in future miRNA expression studies.
From a mechanistic perspective it is interesting that some of these miRNAs highlighted by our meta-analyses target messenger RNAs of genes that are central in PD pathophysiology. The most compelling finding relates to miRNA hsa-miR-132-3p targeting the messenger RNA of SNCA. This may point towards a direct role of some of the identified miRNAs in PD pathophysiology. On the other hand, as outlined in our enrichment analyses, there is no evidence for a general enrichment of significant signals in the PD GWAS data for targets of the top brain miRNAs. A more definite answer to the question whether and which of the top brain miRNAs highlighted by our meta-analyses are directly involved in PD pathophysiology can only be answered based on functional in vitro and in vivo studies with PD-specific read-outs.
In this study, we applied systematic p-value based meta-analyses to collate the available published data based on abstracted p-values and directions of effect. While this is an established method often applied in the GWAS field (17), an effect-size based meta-analysis would not only provide additional information such as the estimated magnitude of gene expression differences, but also allow quantification of the heterogeneity of estimated differences, and to perform additional analyses such as testing for small-study effects, which can be indicative of publication or selective reporting bias (30). The reason for the choice of the p-value based method was the lack of detailed and standardized reports of miRNA expression differences across publications. Specifically, one third of the studies included in the meta-analyses (i.e., 9 of 27), did not provide precise effect size estimates and variances. As we were not able to quantitatively assess in-between study heterogeneity, for study-wide significant miRNAs, we assessed the consistency of the effect directions of the individual datasets. Overall, the direction of differential expression across datasets was consistent for these miRNAs. The “outlying” datasets in the meta-analyses of hsa-miR-628-5p for brain, as well as hsa-miR-15b-5p and hsa-miR-181a-5p for blood have either a comparatively large p-value and/or tested a small number of samples explaining their modest impact on the overall meta-analysis result. Even more importantly, a proportion of publications (applicable to data from 9/27 publications and a total of 91/2059 data entries) did not report full p-values but reported them as “less than” or “greater than” a certain significance level. Here, we chose a rather conservative approach by also including such data in our analyses (see methods section). Furthermore, the quality of our analyses can, at best, only mirror the quality of the underlying publications from which data were extracted. We performed a range of quality control checks to detect inconsistencies within studies (e.g. regarding the nomenclature for the miRNAs, the suitability of the assays used for miRNA quantification, the number of tested individuals reported in different sections of a publication, etc.), but cannot exclude that all errors were detected by this procedure. However, we do not expect any systematic error arising from errors and mistakes that may have remained undetected in the original publications. Nevertheless, these observations clearly highlight the need for a standardized and more transparent reporting of applied methodology, statistics and results in miRNA expression studies (31).
One limitation in combining data from the published domain is the potential presence of publication bias and/or selective reporting bias. Due to the lack of consistently reported effect size estimates in a substantial part of eligible publications (see above), we were not able to assess potential hints for this bias quantitatively (e.g. by regression analyses (32)). To address this concern, we evaluated each publication for evidence that only a subset of the generated expression results were reported in detail (Supplementary Table 8). For two thirds of all publications (i.e., 18/27, 67%) we did not find evidence for selective reporting of generated expression results. Nine publications each of which tested more than >70 miRNAs in a single experiment had generated more data than provided in the publication. Only two of these studies provided the identifiers of the miRNAs for which detailed results were not provided. This list contained two of the eleven miRNAs differentially expressed in blood according to our meta-analyses (hsa-miR-185-5p, hsa-miR-181a-5p). Meta-analyses on other fields (e.g. cancer) of miRNA and other regulatory RNA associations have pointed out the surprisingly high proportion of reported statistically significant results, which may be an indication of excess significance due to selective reporting (33,34). This pattern was not as prominent in the studies that we analyzed, where 13 of the identified studies (Table 1) did not feature any particular miRNAs eventually. Nevertheless, we cannot exclude that selective reporting has inflated some of our meta-analysis results. Especially the blood-based meta-analysis results of hsa-miR-185-5p and hsa-miR-181a-5p need to be considered with caution and warrant independent replication.
Finally, one other limitation of our systematic review pertains to the fact that we meta-analyzed miRNA expression data only if sufficient expression results were available, which we defined a priori as data derived from at least three independent datasets, yielding a total of 149 meta-analyses across 136 miRNAs. For the vast majority (n=306) of the miRNAs analyzed in two datasets, one of dataset was comparatively large (n=62) (33), while the other was small (n=7-10). Therefore, a meta-analysis of these data would have merely mirrored the expression result of the large study and added little - if any - additional value. Again, this highlights the need for additional sufficiently sized expression studies in relevant tissue(s) to investigate the role of these miRNAs in PD.
In conclusion, by systematically combining data from all eligible miRNA expression studies published to date, we identified 15 miRNAs that were differentially expressed in PD patients and controls in brain or blood. Future studies will need to increase the sample size for miRNA-based studies on brain tissue. Our study is the first to compile published miRNA expression data in the field of neurodegenerative diseases in a systematic and standardized way. Thus, it may serve as a model for combining these data in other related fields.
METHODS
Literature search and eligibility criteria
The work-flow and data collection procedures applied in this study are similar to those for genetic association studies developed earlier by members of our group (3,15), adapted to the characteristics of gene expression studies. A systematic literature search for miRNA expression studies in PD was performed using NCBI’s PubMed database (http://www.pubmed.gov) and applying the search term “(microRNA OR miRNA OR miR* OR micro-RNA) AND Parkinson*”. In addition, bibliographies in relevant papers were screened. Citations were assessed for eligibility using the title, abstract, or the full text, as necessary. Only articles in English and published in peer-reviewed journals (last PubMed search date: July 1st, 2017) were considered. Original studies comparing the expression of miRNAs in patients with clinical and/or neuropathological diagnosis of PD and unaffected controls were included. Studies were included irrespective of patient treatment status. MiRNA expression studies on monogenic PD or PD families were excluded. For an overview of the literature search as well as the filtering procedure see Figure 1. A summary of case-control miRNA expression studies identified for PD and providing relevant data (i.e. p-value, direction of effect) can be found in Table 1.
Data extraction
Details extracted for each included study consisted of the first author name, year of publication, and the PubMed identifier, along with key study- and population-specific details (if provided), such as population and city of origin, number of cases, number of controls, tissue type(s) used (i.e., brain, blood, and/or CSF, and a more specific description for each tissue type, e.g. substantia nigra, frontal cortex, amygdala, etc., or whole blood, serum, PBMCs, etc.), experimental method(s) used for the miRNA quantification, identifiers of the miRNAs that were tested in the respective dataset, their expression in tissues of PD patients versus controls (i.e. up-or downregulation or no difference) and corresponding reported p-values. All data were entered into a local database, after which all entries were double-checked by an independent member of our group against the original publications.
For quality control, we assessed reported miRNAs for their inclusion in the miRBase database, version 21 (http://www.mirbase.org). MiRNA names corresponding to expired entries, non-human miRNA sequences, or non-miRNA sequences (e.g. fragments of vault RNA), which were not listed in miRBase, were excluded from the analysis. MiRNAs reported in the included studies were aligned to mature miRNA sequences according to miRBase. The same mature miRNA sequence reported with different miRNA names in different publications (applicable to 9/2059 entries) were subsumed under one common identifier. This concerned miRNAs hsa-miR-199a-3p/hsa-miR-199b-3p, hsa-miR-365a-3p/hsa-miR-365b-3p, hsa-miR-517a-3p/hsa-miR-517b-3p.
Data cleaning and reformatting
Data were analyzed after stratification for tissue categories “brain”, “blood”, and “CSF”. All data cleaning, e.g. the removal of data points using overlapping samples (see below), was performed for each stratum separately. Potential sample overlaps, i.e. investigations of the same miRNA in identical or overlapping datasets in the same tissue (i.e. brain, blood or CSF), for instance in two different publications, were systematically assessed. Overlap was determined based on the origin and descriptions of the datasets, overlapping coauthors and/or references to previous studies. In case of sample overlap, only the data entry from the largest dataset was retained while the other was excluded from further analysis. In some datasets (n=3), miRNAs were assessed in more than one brain tissue in the same (or largely overlapping) individuals. Here we chose only one brain tissue for inclusion in the meta-analysis. The first selection criterion was sample size, i.e. if the number of analyzed samples was substantially (i.e. at least 30%) larger in one brain tissue versus the other, we retained the larger sample and excluded the other. Otherwise the prioritization on which brain tissue to include was based on the PD Braak staging (16) in order to maximize power (i.e. assuming that brain regions affected earlier in the disease course will show more pronounced effects). That is, if several subtypes of brain tissue in the same sample were assessed, the tissue from the region affected earliest in the disease process was selected for inclusion. To assess potential bias introduced by this “prioritization” strategy, we performed sensitivity analyses by including data from “lower priority” regions. For the other tissue strata (blood-derived tissue and CSF), only one tissue subtype was assessed per study, thus prioritization was not applicable.
If a study reported several p-values for the same miRNA in the same samples based on different experimental or analytical methods (e.g. microarray versus RT-qPCR, different normalization approaches), we re-assessed whether one method was preferential to the other based on the information provided in the publication (e.g. higher accuracy/reliability). Whenever possible, the most accurate result was included, and other results were not considered further. If no decision could be reached based on the information provided in the publication, we chose a conservative approach and retained the largest p-value. In order to apply a p-value based meta-analysis approach (see below), “exact” p-values are required. For p-values reported with a reference to a predefined significance threshold only (applicable to data from 9/27 publications and a total of 91/2059 data entries), we used the following conservative conversions: “p ≥0.05” and “p ≥0.01” were converted to “p=0.5”, “p <0.05” to “p=0.025”, “p <0.01” to “p=0.005”, “p <0.001” to “p=0.0005”, “p <0.0001” to “p=0.00005”. In one instance, the p-value in an article appeared as “0.0000”; this was converted to “0.00005”.
Statistical analysis
Meta-analyses
Meta-analyses were performed using a customized R script (https://www.r-project.org; available upon request) applying a p-value based approach that takes into account sample size and direction of effect, as described previously for the meta-analysis of genetic association studies (17). This method allows to combine results even when effect size estimates and/or standard errors from individual studies are not available or are provided in different units (17). Briefly, the direction of effect and the p-value observed in each dataset were converted into a signed Z-score. Z-scores for each miRNA were then combined across datasets by calculating a weighted sum, with weights being proportional to the square root of the effective sample size for each dataset. As described previously (17) the effective sample size was defined as: 4/(1/Number of cases + 1/Number of controls). Significance was defined using conservative Bonferroni correction for multiple testing. This was based on the overall number of meta-analyses (n=149) performed across all three tissue strata (i.e., α=0.05/149=3.36×10−4).
MiRNA target gene analysis
In order to assess indirectly whether any of the significantly differentially expressed miRNAs in brain may be involved in PD pathogenesis, we tested for a potential enrichment of their target genes in results of the latest genome-wide association study (GWAS) in PD (2,3). To this end, summary statistics from 7,773,234 single-nucleotide polymorphisms (SNPs) were obtained from the PDGene database (www.pdgene.org) (3), and then analyzed using two different approaches for miRNA target site definition. Firstly, we downloaded human miRNAs and corresponding experimentally validated miRNA targets from the MiRTarBase database (v. 6.1; http://mirtarbase.mbc.nctu.edu.tw/) (18). Secondly, we used brain-specific miRNA - target gene interactions predicted with AGO2 HITS-CLIP miRNA data published by Boudreau et al. (19). To this end, we mapped Ensembl gene identifiers from the data of Boudreau et al (19) to EntrezGene identifiers based on Ensembl v. 87 (http://www.ensembl.org) using the Biomart tool. The corresponding gene sets from MiRTarBase and Bouddreau et al. (19) were analyzed with Pascal (20) based on default parameters and using 1000 Genomes samples (CEU) for assessment of linkage disequilibrium. Pascal combines SNP-based GWAS summary statistics to gene set scores and tests for enrichment of significant findings using χ2 test and an empirical method.
In addition, we evaluated which miRNAs that show significant differential expression in the brain based on our meta-analyses bind to messenger RNAs from all genes located in the established PD risk loci (2–4) (PD risk genes assigned for each locus according to Chang et al. (4)) and to the established causal PD genes LRRK2, SNCA, VPS35, PRKN, PINK1, and PARK7 (a.k.a. DJ1) (6).
Finally, we evaluated whether any individual SNP (apart from the established, i.e. genome-wide significant, risk SNPs) located in the miRNA target genes (± 10 kb) was significantly associated with PD in the PD GWAS data (see above) (2,3). Adjustment for multiple testing was performed using Bonferroni correction for the number of tested target genes for all top miRNAs (i.e., α=0.05/532= 9.40×10⁻⁵).
AUTHOR CONTRIBUTIONS
Study design: J.S., P.T., R.P., L.B., C.M.L., literature search and data extraction: J.S., P.T., I.O.G.I., V.D., statistical analyses/advice: J.S., I.W., H.B., J.P.I., C.M.L, writing of the manuscript: J.S., P.T., C.M.L., critical revision of the manuscript: all co-authors
DISCLOSURE DECLARATION
None of the authors reports any conflicts of interest.
DATA ACCESS
The full database will be made publicly available upon acceptance of this article.
ACKNOWLEGDMENTS
We thank Lukas Duchrow and Colin Schulz for excellent assistance in the bioinformatic analyses. We also thank Fabian Kilpert for help with the figures. C.M.L. and L.B. received funding from the German Research Foundation (DFG; FOR2488/1: GZ LI 2654/2-1 and BE 2287/5-1), the Possehl Foundation, the Renate Maaß Foundation, and the University of Luebeck (section of medicine, J21-2016). J.S. was supported by the MD thesis research scholarship “Exzellenzmedizin” of the University of Luebeck. I.W. was supported by the Peter und Traudl Engelhorn Foundation.
References


