

ABSTRACT
Autism spectrum disorders (ASD) are characterized by impairments in social communication and increased repetitive behaviors. ASD etiology is complex, involving multiple genetic and environmental risks. Epigenetic modifications are poised at the interface between genes and environment and are predicted to reveal insight into the gene networks, cell types, and developmental timing of ASD etiology. Here, whole-genome bisulfite sequencing (WGBS) was used to examine DNA methylation in ASD and control frontal cortex samples. Systems biology approaches were leveraged to integrate methylation differences with relevant genomic datasets, revealing ASD-specific differentially methylated regions (DMRs) are significantly enriched for known neuronal and microglial regulatory elements, including cell-type-specific enhancers and transcription factor binding sites. ASD DMRs were also significantly enriched for known ASD genetic risk factors, including both common inherited and rare de novo variants. Weighted gene co-expression network analysis (WGCNA) revealed enrichment of ASD DMRs within developmental expression modules of brain and isolated microglia. Microglial modules identified dysregulated genes in maternal immune activation models of ASD. Weighted gene body co-methylation network analysis revealed a module characterized by hypomethylation of clustered protocadherin genes. Together, these results demonstrate an epigenomic signature of ASD in frontal cortex shared with known genetic and immune etiological risk. Epigenomic insights into cell types and gene pathways will aid in defining therapeutic targets and early biomarkers at the interface of genetic and environmental ASD risk factors.
INTRODUCTION
Autism spectrum disorders (ASD) represent a diverse collection of neurodevelopmental disorders defined clinically by childhood onset of difficulties in social communication and restricted or repetitive behaviors. ASD severity can range from mild to severe and is often accompanied by co-morbidities including intellectual disability, catatonia, seizures, attention deficit hyperactivity disorder, and gastrointestinal dysfunction(American Psychiatric Association 2013). As the prevalence of ASD has increased in recent decades, there is an urgent need for understanding of the underlying biology to identify novel therapeutic strategies.
The etiology of ASD is complex and involves both genetic and environmental risk factors. The clinical diversity parallels the genetic complexity of the disorder, which includes hundreds of rare risk variants and potentially thousands of common variants(Sanders et al. 2015; The Autism Spectrum Disorders Working Group of The Psychiatric Genomics Consortium 2017; De La Torre-Ubieta et al. 2016). Recent exome sequencing approaches focused on identifying rare, highly penetrant, de novo mutations have identified a number of high confidence ASD genes with functions in neuronal synapses and transcriptional regulation(Sanders et al. 2015; Ben-David and Shifman 2012). A multitude of early-life environmental perturbations also increase the risk of ASD, including maternal immune activation and pollutant exposure during gestation(Lyall et al. 2014b). A combination of genetic and environmental risks is hypothesized to interact in the etiology of ASD(Vogel Ciernia and LaSalle 2016).
Disruption of epigenetic mechanisms regulating brain developmental processes has been proposed as a potential mechanism linking ASD environmental and genetic risk. For example, transcription, DNA methylation, and histone acetylation analyses(Gupta et al. 2014; Parikshak et al. 2016a; Sun et al. 2016; Ladd-Acosta et al. 2014; Nardone et al. 2014a, 2017) in postmortem ASD brain have consistently implicated gene pathways involved in synaptic development and immune function. However, most analyses of DNA methylation in ASD human brain have been limited to a small subset of the total CpG sites in the human genome (<2%)(Ladd-Acosta et al. 2014; Nardone et al. 2014b, 2017) or a specific genetic form of ASD(Dunaway et al. 2016). Consequently, we examined DNA methylation signatures across the entire human genome using unbiased whole-genome bisulfite sequencing (WGBS) of human prefrontal cortex from ASD and matched controls. We identified regions of differential methylation that were enriched for genetic risk factors for ASD and implicated in both synaptic and microglial function across brain development. Differential DNA methylation captures an epigenomic signature converging both environmental and genetic perturbations in brain development and suggests novel therapeutic pathways for treatment development.
RESULTS
Differentially methylated regions identified in ASD cortex overlap neuronal and microglial regulatory elements
To identify an epigenomic signature of ASD, the approach of WGBS was performed on postmortem brain. To avoid brain region-specific confounding variables, only brains for which frontal cortex, Brodmann area 9 (BA9) was available were used, including 16 ASD (n=12 M and 4 F) and 10 control (n=5 M and 5 F). Postmortem interval, age, or persistent organic pollutant presence as covariates did not result in any significant impact on global methylation levels. Furthermore, no differences in global methylation levels, coverage, or conversion efficiency were observed between groups (Table S1). Average methylation within 20 kb windows also showed a lack of large-scale methylation differences by either sex or ASD status, as expected(Dunaway et al. 2016) (Figure S1). In addition, no significant differences were observed by sex or ASD status in average methylation over several genomic features including CpG islands, gene bodies, or promoters (Figure S1). Cell type deconvolution with CIBERSORT(Newman et al. 2015) using cell type specific methylation data from sorted human glutamatergic neurons, GABAergic neurons, and glial cells(Kozlenkov et al. 2014) followed by repeated measures ANOVA did not reveal any significant cell type differences between groups (Figure S2, Table S2).

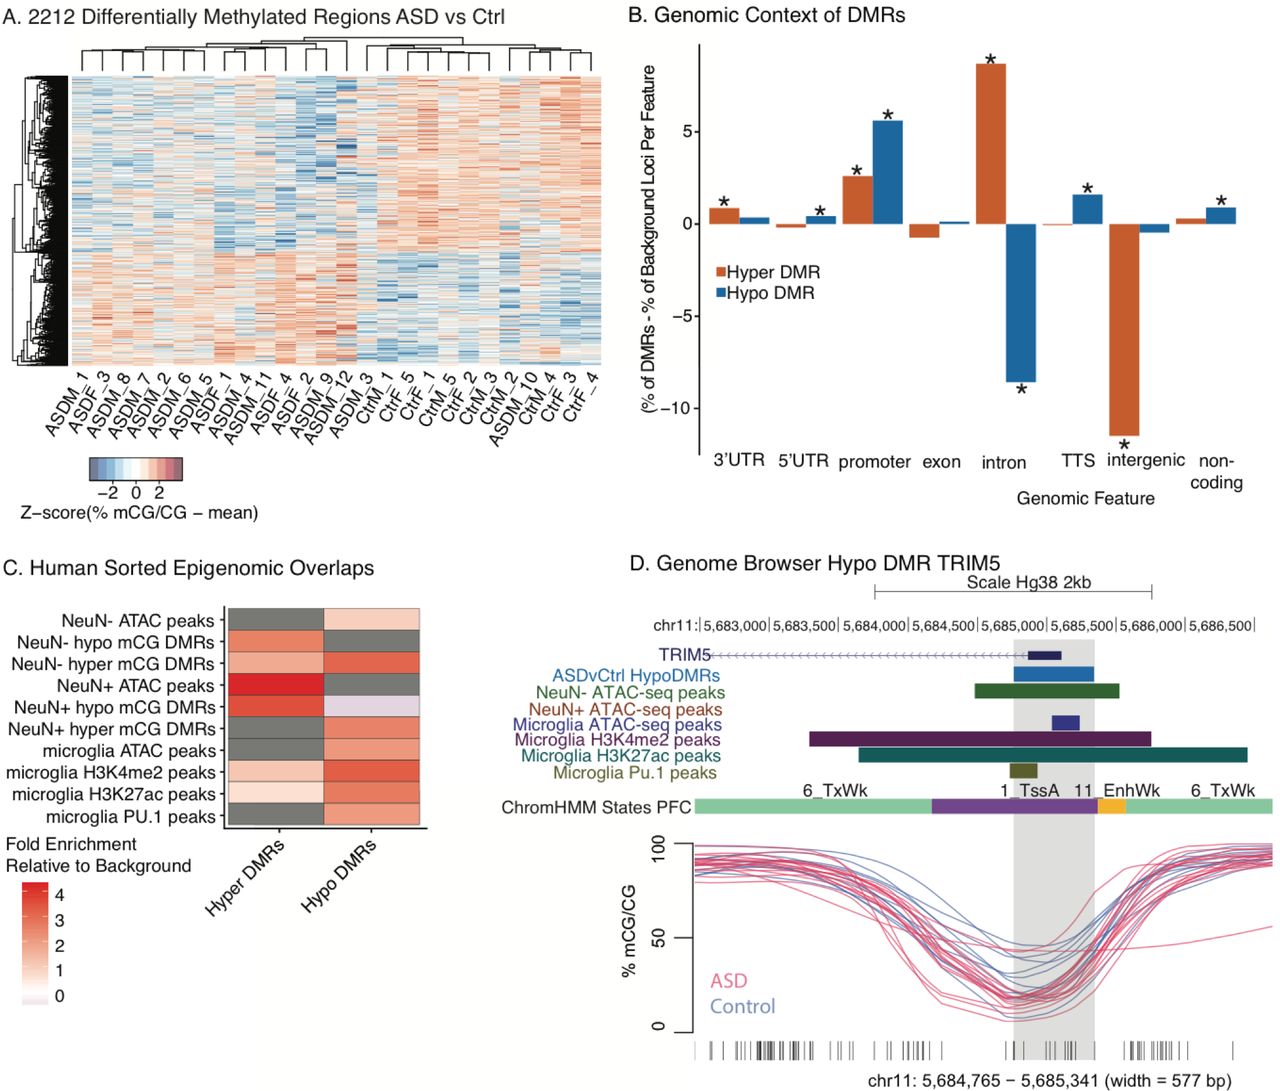
A. Heat map of scaled percent methylation values across DMRs identified between ASD and control BA9 cortical samples of both sexes (ASDM, ASDF, CtrM, CtrF). ASD DMRs were filtered to remove regions impacted by sex and classified as hypo-or hyper-methylated in ASD. B. DMR enrichment within genomic features relative to background loci (% of DMRs -% of background loci per feature). TTS, transcription termination site. *p< 0.05 FDR corrected two-tailed Fisher’s exact test. Table S4 includes statistics. C. Hyper DMRs were significantly enriched for regulatory regions active in NeuN+ neurons and Hypo DMRs were enriched for regions active in NeuN-non-neuronal, specifically microglial regulatory regions(Lister et al. 2013; Gosselin et al. 2017b; Fullard et al. 2017b). Color scale reflects fold enrichment relative to background regions for significant differences (p<0.05, two-tailed Fisher’s exact test with FDR correction), while grey represents non-significant differences. D. UCSC Genome Browser representation of a selected ASD Hypo DMR (light blue track and shaded region) overlapping the TRIM5 transcription start site and regions of ATAC-seq open chromatin peaks in NeuN-glial cells and microglia, but not NeuN+ neurons. The TRIM5 ASD DMR also overlaps regions of active histone (H3K4me2, H3K27ac) and PU.1 binding in microglia(Gosselin et al. 2017b). The lower panel shows smoothed methylation values for each individual ASD (red) and control (blue) sample.
2,212 differentially methylated regions (DMRs) ranging in size from 9 bp to 1.5 kb were identified after ANOVA-based filtering between ASD and control samples (Table S3), with 866 showing higher methylation levels in ASD (Hyper DMRs) and 1,346 showing lower levels in ASD (Hypo DMRs) (Figure 1A). Hierarchical clustering of average percent methylation within these DMRs demonstrated that the majority of samples cluster by ASD status (Figure 1A). Both Hyper and Hypo DMRs were significantly enriched within promoter regions compared to background loci (BG loci, defined in Methods). Hyper DMRs were significantly enriched within introns while Hypo DMRs showed significant intronic de-enrichment. Hyper DMRs were also significantly less likely to be found in intergenic regions compared to background (Figure 1B, Table S4). Gene Ontology (GO) and pathway enrichment analysis using GREAT(McLean et al. 2010) revealed significant enrichment of ASD DMRs for GO terms involved in regulation of immune function, transcription, and metabolism (Table 1 and Table S5). Enriched pathways included genes involved in circadian regulation, insulin/IGF1 signaling processes, and transcript elongation (Table S5). Together these analyses indicated that both neuronal and immune cell types, as well as whole organismal systems were altered in ASD DNA methylation patterns in brain.
GREAT uses both proximal and distal input genomic regions and their putative target genes to assign regions to functional annotations. Top enriched terms were ranked by binomial fold enrichment (observed / expected) and FDR corrected p-values for the binomial test over genomic regions are shown.
To further evaluate cell type specificity and regulatory functions of differentially methylated regions, locations of ASD DMRs were overlapped with chromatin states maps from human prefrontal cortex (PFC)(Roadmap Epigenomics et al. 2015; Ernst and Kellis 2013; Ernst et al. 2011), revealing enrichment for enhancer marks and promoter regions (Figure S3). ASD DMRs were then examined for differential regions of chromatin accessibility and methylation within NeuN+ neuronal compared to NeuN-non-neuronal (microglia, astrocytes, etc.) populations isolated from postmortem PFC(Lister et al. 2013; Fullard et al. 2017a) and regulatory regions identified from acutely isolated human brain microglia(Gosselin et al. 2017a) (Table S6). Hyper DMRs were most strongly enriched for regions with marks of active chromatin in NeuN+ neurons (Figure 1C). In contrast, Hypo DMRs showed strongest overlap with microglial regulatory marks(Gosselin et al. 2017a) (Figure 1C and D). At least some of these microglial regulatory elements may be impacted early in development, as both Hyper and Hypo DMRs showed enrichment for epigenomic regulatory regions (DNA methylation and H3K4me3) sensitive to changes in early brain development (Figure S3B). Furthermore, Hyper and Hypo DMRs overlapped regulatory regions active at specific timepoints in mouse microglial maturation(Matcovitch-Natan et al. 2016) and in DMRs identified in microglia from a mouse maternal allergic asthma model of ASD(Vogel Ciernia et al. 2017) (Figure S3C). Together these results provide evidence that both neurons and glia are epigenetically impacted in ASD cortex, and support the previous observation in transcriptome studies of decreased synaptic and increased microglial-related gene expression(Parikshak et al. 2016b; Gupta et al. 2014).
A direct comparison of the ASD DMRs to other identified epigenomic alterations in ASD brain(Dunaway et al. 2016; Sun et al. 2016; Nardone et al. 2017; Shulha et al. 2012) revealed significant enrichment for regions of differential methylation identified in 15q11.2-13.1 duplication syndrome (Dup15), a genetic form of ASD(Dunaway et al. 2016), but not the small (58) number of DMRs identified in a 450k array analysis of NeuN+ cells from idiopathic ASD brain(Nardone et al. 2017) (Figure S3D). ASD DMRs were enriched for regions showing altered H3K4me3 levels (Shulha et al. 2012) or altered H3K27ac (Sun et al. 2016) in ASD brain (Figure S3E).
ASD DMR associated genes are enriched for common and rare ASD genetic risks
To examine overlap between genetic risk factors and epigenetic signatures in ASD brain, DMRs were assigned to the closest gene (within the gene body or within +/−5kb of the gene start or end sites, see Methods and Figure S4A). The 866 Hyper DMRs were associated with 703 unique genes and the 1,346 Hyper DMRs with 1,078 unique genes (Table S7). Genes associated with ASD DMRs were significantly longer (bp) than genes associated with background loci or genes in the genome (Figure S4B), consistent with previous findings from ASD transcriptome studies(Gupta et al. 2014; Parikshak et al. 2016b). However, ASD DMRs showed significantly fewer gene body DMRs and increased flanking DMRs compared to BG Loci (Figure S4C), indicating that gene length bias is due to ASD DMRs impacting biologically relevant genes with increased length and not because they reside within gene bodies at a greater frequency than expected by chance.

A. ASD DMR associated genes significantly overlap with genes associated with ASD risk or ID risk. B. ASD DMR associated genes significantly overlap with genes showing altered gene expression in ASD brain. Table S8 contains all gene lists, citations and statistics. * FDR corrected p<0.05 two tailed Fisher’s exact test. SFARI: Simons Foundation Autism Research Initiative, LGD: likely gene disrupting mutation, ID: intellectual disability, ASD: autism spectrum disorder, pLI>0.9: probability of being loss-of-function >0.9 (top genes that are intolerant to human mutation), DE: differentially expressed, Dup15: Chromosome 15q11.2-q13.1 duplication syndrome.
We then overlapped the ASD DMR genes with identified genetic risk factors for ASD and intellectual disability (Figure 2A, Table S8). Gene lists associated with other non-ASD traits and disorders from the National Human Genome Research Institute and European Bioinformatics Institute GWAS Catalog(MacArthur et al. 2017) were used as a comparison (Table S8). A significant enrichment for both Hyper and Hypo methylated ASD DMRs with known risk genes was observed for both ASD and ID, with the highest enrichment for ASD SFARI strong candidates and ASD high confidence genes(Sanders et al. 2015). ASD DMR associated genes were also enriched for genes associated with ASD risk alleles identified by the ASD GWAS consortium at an uncorrected p-value of 0.05(The Autism Spectrum Disorders Working Group of The Psychiatric Genomics Consortium 2017). In comparison, the vast majority of GWAS targets for other disorders did not show significant enrichment (158/161 for HyperDMRs and 153/161 for HypoDMRs), with the exception of several immune disorders, cancer, and cholesterol (Table S8).
ASD DMR genes were then compared to gene expression studies conducted in ASD brain(Gupta et al. 2014; Parikshak et al. 2016b; Sun et al. 2016; Dunaway et al. 2016; Nardone et al. 2017). Both Hyper and Hypo methylated DMRs were enriched for genes showing differential expression in ASD cortex (Figure 2B and Table S8) as well as ASD differential gene expression network modules (Figures S4 and Table S8). Together these findings suggest that multiple forms of epigenetic regulation are disrupted at key regulatory regions in ASD brain. The regulatory alterations are associated with genes that also show altered expression and/or genetic risk, further suggesting that genetic risk and epigenetic alterations may converge on common downstream pathways and functions.
ASD DMRs overlap developmental gene expression modules
The gene ontologies and pathways identified by both genetic risk and ASD DMRs are critical for brain development. To identify specifically when ASD DMR genes are most transcriptionally active, we utilized weighted gene co-expression networks (WGCNA)(Langfelder and Horvath 2008) built from prefrontal cortex brain developmental stages using the human BrainSpan atlas(Miller et al. 2014) (Figure S6). Twelve modules were identified (Figure S5), four were significantly correlated (FDR p value <0.05), and two marginally correlated (FDR < 0.08) with developmental age (Figure 3 and Figure S5). Hyper DMR associated genes were enriched within cyan, midnightblue, and pink modules that were also significantly enriched for mutations associated with ASD genetic risk(Sanders et al. 2015; Iossifov et al. 2014), but largely not for genes associated with ID risk (Figure 3 and Table S9). All three modules associated with Hyper DMRs were enriched for GO terms involving neuronal development, including terms for synapse (cyan), nervous system development (midnightblue), and membrane part (pink) (Figure 3, Figure S5 and Table S19). The cyan and pink modules are also significantly positively correlated with developmental age and highly enriched in neurons, indicating that Hyper DMRs are associated with developmentally regulated genes that are critical for neuronal and synaptic circuit development (Figure S5, Table S9). All three Hyper DMR modules were also enriched for genes associated with increased acetylated regions in the ASD cortex as well as decreased expression (ASD<Ctrl) in Dup15 syndrome and idiopathic ASD brain (Figure 3B).
In contrast, Hypo DMR associated genes were only enriched in the blue module, enriched for multiple non-neuronal cell types including astrocytes, endothelial cells and microglia (Figure 3A and Table S9). This blue module was also enriched for GO terms related to immune function and marginally associated with developmental age with increasing expression late in gestation through adulthood (Figure 3A and Table S9). The Hypo DMR enriched blue module was also associated with increased expression in Dup15 cortex and idiopathic ASD cortex (Figure 3B). Together, these results demonstrate hyper-methylation of regions containing developmentally regulated neuronal synaptic genes, but hypo-methylation of gene regions related to immune function during brain development in ASD.
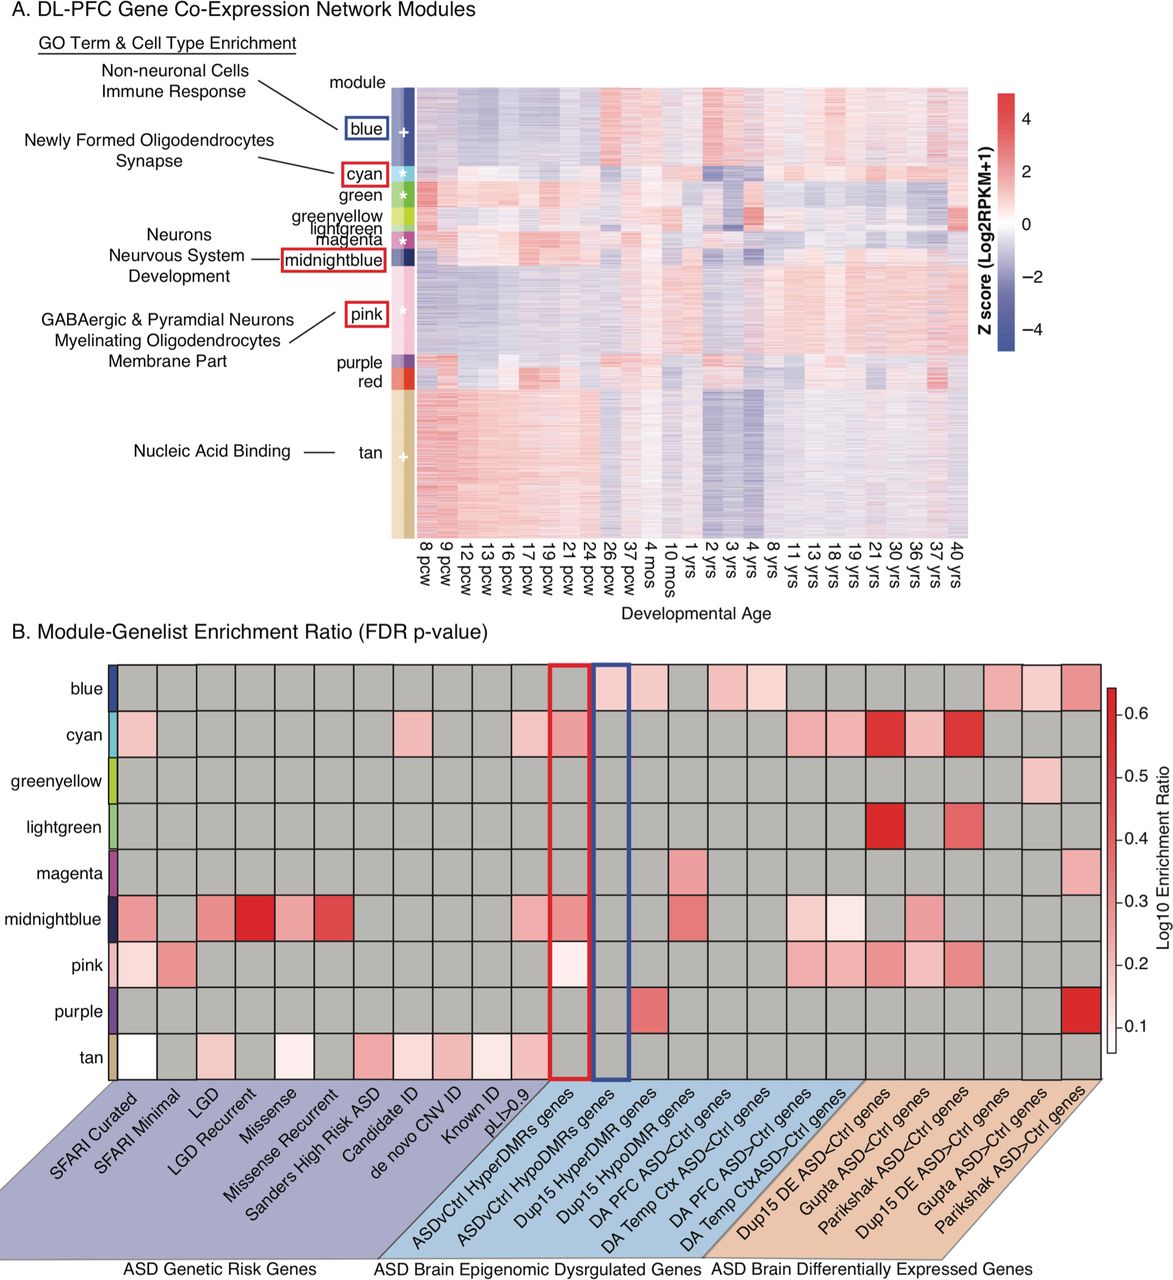
A. Gene expression within each module identified by WGCNA across human DL-PFC brain development. Data from BrainSpan(Miller et al. 2014). Modules with module epigengenes (ME) correlated with developmental age are denoted with * for FDR p<0.05 or + for FDR p<0.08. Modules with significant associations with ASD DMRs are boxed (red: Hyper ASD DMR, blue: Hypo ASD DMR). Modules relevant to ASD DMRs are labeled with cell type enrichment and/or their top enriched GO term (all enrichments are shown in Table S9). pcw: post-conception week. B. Fisher exact tests for gene list enrichment within each co-expression module was performed, with results summarized as a heat map of Log10 enrichment (grey, not significant), with all statistical results shown in Table S9. Gene lists are further described with citations in Table S8. Significant ASD DMR associated gene list enrichments are outlined in red for Hyper DMRs and blue for Hypo DMRs.
ASD DMRs overlap microglial genes critical for development and environmental responses
In order to better understand phenotypes associated with the immune signature in ASD brain, we explored the potential overlap of ASD DMR associated genes with several mouse microglial datasets. These included microglial developmentally expressed genes(Matcovitch-Natan et al. 2016; Hanamsagar et al. 2017) as well as genes misregulated in microglia isolated from both genetic and maternal immune challenge ASD models (Mecp2 mutation, MIA PolyI:C, MAA). We also compared ASD DMR genes to those altered in mouse microglia from germ free conditions, immune stimulation (LPS, primed, sensome) (Figure 4A-B and Table S10), or an Alzheimer’s model with known microglial involvement (DAM, disease associated microglia) (Figure S6). ASD DMR associated genes showed enrichment for the majority of microglial gene lists, indicating both microglial development and function are impacted by altered DNA methylation in ASD brain. To identify specifically when ASD DMR genes are most transcriptionally active in microglia, we performed WGCNA on a published RNAseq dataset(Hanamsagar et al. 2017) from microglia isolated from four developmental timepoints from both male and female mice (Figures S7 and Figure 4C). Co-expression modules were enriched for GO terms related to microglial function and development as well as differentially expressed genes from microglia studies examining inflammation, genetic mutations and microglial development (Figure 4D, Figure S7 and Table S10). ASD genetic risk mutations were predominantly enriched within the yellow module of postnatal day 14 microglial expressed genes. Yellow module microglial genes were predominantly nuclear, PU.1 targets, and misregulated in microglia from both MIA and DAM mouse models. In contrast, Hypo DMR associated genes identified in this study and in Dup15 syndrome were enriched for the blue module, characterized by embryonic and early postnatal microglial expression, nervous system development, and dysregulated in MIA microglia (Figure 4C-D). Together, these results indicate a genetic ASD risk within postnatally expressed microglial genes plus an epigenetic ASD signature over genes involved in microglia-neuron interactions early in microglial development. In support of this conclusion, the microglial genes identified in Figure 4A showed higher expression across human brain development than genes associated with background loci (Figure S7 and Table S11).

A. ASD DMR associated genes were significantly enriched for genes showing developmental regulation during microglial (MG) development from two independent mouse RNA-seq datasets(Matcovitch-Natan et al. 2016; Hanamsagar et al. 2017). All mouse genes were converted to Hg38 using BioMart. B. ASD DMR associated genes were also significantly enriched for genes regulated in microglia in response to maternal immune activation(Vogel Ciernia et al. 2017; Matcovitch-Natan et al. 2016; Mattei et al. 2017), MeCP2 mutation in heterozygous (MeCP2 het female(Zhao et al. 2017)), or hemizygous (MeCP2-/y(Cronk et al. 2015)) mice, germ free conditions(Erny et al. 2015), LPS versus saline injection (LPS vs SAL)(Hanamsagar et al. 2017; Holtman et al. 2015), primed microglia(Holtman et al. 2015), microglial sensome(Hickman et al. 2013), or the characterized targets of the microglial lineage determining transcription factor PU.1(Satoh et al. 2014). *FDR corrected p<0.05 two tailed Fisher’s exact test. C. Weighted Gene Co-Expression Network analysis (WGCNA) of microglial development in male and female mice (GEO GSE99622)(Hanamsagar et al. 2017). Normalized gene expression is shown for each identified module in WGCNA in Figure S9. The top enriched gene ontology term for each module is shown on the left. Enriched microglial gene lists are shown on the right (additional data in Table S10 and Figure S10). Modules with significant associations with ASD DMRs are boxed (blue: Hypo ASD DMR). *p<0.05 and +p<0.08 indicate module eigengenes correlated with developmental time (Table S10). E18: embryonic day 18, P4: postnatal day 4, P14: postnatal day 14, P60: postnatal day 60 (adult). D. Module-gene list enrichment by Fisher’s exact test, with log10 enrichment heat map for significant (FDR p<0.05) and grey for non-significant, for ASD genetic risk genes, ASD brain epigenomic dysregulated genes, and ASD brain differentially expressed genes. Gene lists and citations are provided in Table S8 and results of statistical tests are shown in Table S10.
ASD DMRs are enriched for transcription factor binding sites critical for neurons and microglia
To further evaluate the potential impact of altered DNA methylation on gene regulation, we examined both Hyper and Hypo ASD DMRs for known transcription factor binding motif enrichment compared to background loci using HOMER(Heinz et al. 2010). Hyper DMRs were enriched for seven unique transcription factor motifs, with highest enrichment for CTCF. Hypo DMRs were enriched for motifs belonging to several transcription factor families including STAT, GATA, and FRA (Figure 5A and Table S12). Transcription factor gene expression was compared across mouse cell types (Figure 5B and Figure S8), with a subset revealing preferential cell type specific expression patterns. For example, FOXA1 and FOXA2 both show the highest expression in dopaminergic neurons, while GATA3 is fairly specific for serotonergic and Reln-positive GABAergic neurons. Importantly, several ASD Hypo DMR-enriched transcription factors showed preferentially high expression in microglia, including NFKB, RUNX1, SPI1 (PU.1), IRF8, JUNB, and ATF3. When examined across human brain and mouse microglial development (Figure S8), many of the enriched transcription factors show preferential expression for specific developmental time windows. For example, SPI1 shows early expression during microglia colonization and differentiation in the brain and then a second peak during adulthood. Together, these results demonstrate the potential relevance of ASD DNA methylation in impacting transcription factor binding within specific cell types in the ASD brain, including several neuronal subtypes and microglia.

A. Transcription factors with significantly enriched motifs in Hyper and Hypo ASD DMRs are shown as colors by FDR adjusted log q values (white represents non-significant). B. Expression of enriched transcription factors (from A) across cell types (data from NeuroExpresso(Mancarci et al. 2017). Expression values shown as Z-scores (within row normalization) of log2(RPKM +1) values. Each transcription factor gene is also labeled with the type of enriched ASD DMR (Hyper or Hypo DMR). Table S12 includes results of statistical tests.
Gene body co-methylation network analysis reveals hypomethylation of protocadherin genes in ASD
Since levels of DNA methylation over gene bodies positively correlates with expression level(Kundaje et al. 2015), we utilized a modified version of WGCNA to identify modules of co-methylation across gene bodies based on similar approaches used to examine single CpG level methylation values from arrays(Horvath et al. 2012). After filtering, 43,444 gene bodies were included in a network using all 26 control and ASD WGBS samples (Figure 6A and Figure S9) and co-methylation module eigengenes were analyzed for association with ASD diagnosis and sex (Figure 6B and Table S13). Only one module (Grey60) showed a marginally significant (p<0.088) relationship to ASD and no modules were related to sex. This module was characterized by a set of hub genes found within the clustered protocadherin (PCDH) genes (Figure 6C and Figure S9). Gene body methylation levels of protocadherin genes within the Grey60 module were found to be significantly lower in ASD samples (Figure 6D and Table S13).
To further compare gene body co-methylation in ASD and control samples, we created separate networks for ASD and control samples (Figure S10 and Table S14) and examined module preservation between the two networks. The resulting 22 Control co-methylation modules and 10 ASD co-methylation modules showed positive correlations for gene body methylation and overall network connectivity (Figure S10). The correlation was higher for average methylation than connectivity, consistent with previous studies(Miller et al. 2010). To quantitatively assess module preservation, both the Median Rank and Z-Summary statistics were calculated for both ASD samples within Control network modules and vice versa (Figure S10). The resulting composite preservation measures indicate a high degree of preservation of all control samples within all identified ASD network modules (Figure S10, Table S14). In contrast, the ASD samples showed low preservation within the control modules, with fewer than half of the modules showing a moderate to high degree of preservation (Figure S10, TableS14), indicating that some of the control network-level gene regulation is lost in ASD. Fisher’s exact testing for all pairwise module overlaps indicated that two control modules (coral1 and mediumorchid, enriched for GO terms related to immune response and cell cycle) failed to overlap any of the identified ASD modules (Table S14). These results indicate an epigenomic signature of system-wide alterations of DNA methylation networks in ASD brain, with the major differences occurring over genes with functions in cell division and immune responses.

A. The Log2 transformed average mCG/CG methylation for each Ensemble gene (gene body defined as chromosome position from transcriptional start to end) was used as input to a weighted and signed correlation network and modules of co-methylation. B. Hierarchical clustering of module eigengenes (ME). MEs were examined for relation to diagnosis using a mixed model ANOVA with factors for diagnosis status and sex and a random effect of subject (Table S13). The module eigengene for the Grey60 co-methylation module was the only ME marginally related to diagnosis (main effect of diagnosis p=0.088). C. Average mCG/CG levels across the genebodies of genes within the Grey60 module identified in A and B. A cluster of protocadherin (PCDH) genes were identified within the co-methylation module as hub genes. This is further visualized below in the network model of the top 300 connections within the Grey60 module. Highly connected hub genes are highlighted in red (Table S13 contains gene lists). D. Methylation levels average in 50 bp bins across the median length of the gene body (6.4kb) for protocadherin (PCDH) genes within the Grey60 Module (upper panel). ASD samples consistently show lower levels of mCG/CG across the gene body as quantified in the lower boxplot. Each boxplot represents quartiles and individual data points are shown as overlay points colored by sex. *p<0.05 main effect of diagnosis, mixed model ANOVA (Table S13).
DISCUSSION
This unbiased genomic analysis of alterations in DNA methylation in ASD prefrontal cortex identified DMRs enriched for neuronal and glial regulatory regions associated with regulation of metabolic, transcriptional, and immune processes that were also highly enriched for genetic variants associated with ASD and ID. This is the first study to demonstrate overlap between epigenetic and genetic risk at a genome-wide level, an observation that has been previously seen at candidate gene loci MECP2 and OXTR(Nagarajan et al. 2008; Gregory et al. 2009). The regions of differential methylation in ASD indicate alterations in developmental gene expression across multiple cell types including neurons and microglia. Both ASD genetic mutations and genes associated with Hyper ASD DMRs were enriched within PFC gene expression modules involved in synaptic and neuronal maturation in brain development. In contrast, genes associated with Hypo ASD DMRs were enriched in immune related modules and showed enrichment for genes critical for microglial function and development. Together, these results show a clear epigenomic signature of the genetic, cellular, and developmental pathways impacted in ASD brain.
Our findings leverage previous transcriptional and epigenomic profiling in human ASD brain that have consistently revealed both synaptic and immune dysfunction(Gupta et al. 2014; Parikshak et al. 2016a; Sun et al. 2016; Nardone et al. 2014b, 2017; Dunaway et al. 2016). The hypo-methylation and increased expression of microglial genes is also consistent with alterations in microglia morphology and density(Morgan et al. 2010, 2012, 2014; Vargas et al. 2005; Tetreault et al. 2012) in a subset of postmortem ASD brains. Maternal immune activation and dysregulation during pregnancy is a risk factor for ASD(Atladottir et al. 2010a, 2010b; Zerbo et al. 2013; Lyall et al. 2014b, 2014a). Children with ASD often display a variety of immune related abnormalities including altered cytokine expression(Goines and Ashwood 2013) and changes in immune cell populations(Ashwood et al. 2011) suggesting a shared disruption in the development of the fetal immune system and brain. As the resident immune cells in the brain, microglia may be a common cell type impacted by diverse ASD etiologies because they serve as important sentinels responding to both genetic and environmental contributors to ASD pathogenesis.
Microglia may be appropriate targets of ASD therapy, since altered immune function may have profound impacts on neuronal development and brain function. In addition to constant monitoring for signs of infection, microglia modulate synaptic transmission by secretion of neurotrophins(Parkhurst et al. 2013), regulate synapse formation and elimination(Schafer et al. 2012; Zhan et al. 2014; Paolicelli et al. 2011; Tremblay et al. 2010), and control neuronal precursor levels(Cunningham et al. 2013). Microglia also respond to genetic abnormalities that impair neuronal function. For example, multiple studies in mouse Mecp2 mutant models of Rett syndrome show evidence of microglial activation and involvement in disease progression(Derecki et al. 2012; Cronk et al. 2015; Horiuchi et al. 2016). In addition, conditional deletion of CCCTC binding factor (CTCF) specifically in postnatal glutamatergic forebrain neurons in mice decreased neuronal dendritic spine density, and microglia in these animals adopt an abnormal morphology and up-regulate transcription of microglial inflammatory genes(Mcgill et al. 2017). Therefore, immune signatures observed across transcriptomic and epigenomic studies in human ASD brain may be partially driven by an immune response to abnormal neuronal processes that arise from genetic etiologies.
Altered DNA methylation at ASD DMRs may contribute to transcriptional dysregulation through altered transcription factor binding to enhancers and promoters in synaptic and immune pathways. Numerous transcription factors show methylation sensitivity(Yin et al. 2017; Zuo et al. 2017) including CTCF(Renda et al. 2007; Zuo et al. 2017), which was the most highly enriched transcription factor motif in ASD DMRs. CTCF acts as a genomic insulator and regulates genomic imprinting and chromatin architecture(Renda et al. 2007). CTCF is highly expressed in the brain, critical for early mouse development, and regulates neuronal diversity through stochastic expression of PCDH gene clusters(Hirayama et al. 2012). DNA methylation patterns at CTCF sites regulate DNA looping within the clustered PCDH genes(Guo et al. 2012; Golan-Mashiach et al. 2012), allowing individual neurons to express unique PCDH isoforms(Esumi et al. 2005; Kaneko et al. 2006; Toyoda et al. 2014). These unique molecular barcodes orchestrate neural circuit and synapse formation through the regulation of specific neuron-neuron and neuron-glia contacts(Molumby et al. 2016). Gene SNPs within the PCDH clusters have been associated with ASD(Anitha et al. 2013), so perhaps the interaction of genetic variants and DNA methylation in ASD brain may reflect dysregulated neuron-neuron and neuron-glia contacts.
One limitation of this work is the relatively small sample size due to poor region-matched availability of human brain samples and still relatively high cost of WGBS. However, this work is similar or larger in sample size than previous DNA methylation array studies when considering the evaluation of a single brain region. This study also specifically examined DNA methylation differences that were independent of sex, allowing for the identification of epigenomic signatures relevant to both male and female ASD cases. The average 3x WGBS genome coverage is not sufficient to identify single CpG methylation differences but does allow for identification of DMRs (Ziller et al. 2014), which represent biologically relevant regional methylation differences (Vogel Ciernia and LaSalle 2016). With the continued decrease in cost of sequencing technologies and increased brain bank advocacy, future work can more fully characterize additional ASD brain samples by WGBS with additional brain regions and cell type specific sorting.
In conclusion, findings from this study reveal a critical epigenomic signature in ASD frontal cortex that overlaps with known genetic and immune dysfunction in ASD. Integration with multiple data sources identified both neuronal and microglial cell types and pathways as potential relevant therapeutic avenues that may be common dysregulated mediators at the interface of ASD genetic and environmental risk factors.
METHODS
Sample Acquisition, DNA Isolation, and WGBS Library Preparation
Human cerebral cortex samples from Broadmann Area (BA) 9 were obtained from the National Institute of Child Health and Human Development (NICHD) Brain and Tissue Bank for Developmental Disorders at the University of Maryland. DNA was isolated using the QIAGEN Puregene kit (Qiagen, 158667) and WGBS libraries were prepared as described previously (Dunaway et al. 2016). Briefly, 5 μg of DNA was fragmented to ~300 bp using 28 cycles of 15 seconds on/15 seconds off on a Diagenode Bioruptor. DNA was end-repaired using 1× T4 DNA ligase buffer, 400 μM dNTPs, 15 U T4 DNA polymerase (NEB), and 50 U PNK (NEB) for 30 min at 20°C. After PCR purifying (Qiagen), adenine bases were appended to the ends using 1× NEB 2 buffer, 200 μM dATP, and 15 U Klenow Fragment (3′ to 5′ exo-, NEB) for 30 min at 37°C. After another DNA purification using the PCR MinElute kit (Qiagen), 3 μL of Illumina’s methylated sequencing adapters were ligated on using 1× ligase buffer and 5 μL Quick T4 DNA Ligase (NEB) for 30 min at room temperature. After a final PCR purification, 500 ng of library was bisulfite converted using Zymo’s EZ DNA Methylation-Direct kit according to the manufacturer’s instructions. The library was then amplified using 2.5 U PfuTurbo Cx Hotstart DNA Polymerase (Stratagene) for 12 cycles using Illumina’s standard amplification protocol. The library’s quality was assessed on a Bioanalyzer (Agilent) and sequenced (100 bp, single-ended) on an Illumina HiSeq 2000. Each biological sample was sequenced on a single lane, producing ~96 million reads on average (Table S1).
WGBS Sample Processing
Raw FASTQ files were filtered and trimmed to remove the adapters and ten bases before the adapters to remove biased hypomethylation contamination at 3′ adaptor ends (Hansen et al. 2012). Reads were then aligned to the human genome (Hg38) using BS-Seeker2 (Guo et al. 2013) and subsequent analysis was done with custom Perl and R scripts (Dunaway et al. 2016). Conversion efficiency was determined by analyzing methylation percentage of mitochondria DNA as it is expected to have no detectable levels of methylation (Hong et al. 2013).
Differentially Methylated Regions (DMRs)
DMRs were called for diagnosis (ASD versus Control) on all samples using the R packages DSS and bsseq (Feng et al. 2014; Hansen et al. 2012). DMRs were identified as sets of CpGs with at least one read coverage for all samples, a t-statistic greater than the critical value for alpha 0.05 and a gap between CpGs of less than 300 bases. To examine the impact of diagnosis independent of sex effects, we computed an ANOVA on mean %mCG/CG levels within each DMR with sex, diagnosis, and sex*diagnosis as factors. The DMRs were then filtered to include only those with a marginally significant or greater effect of diagnosis (p<0.1), non-significant main effect of sex (p>0.05), and a non-significant interaction (p>0.05). The resulting 2212 DMRs were used in all subsequent analysis. Background loci (839,118) were called using the same conditions but without any filters to identify all possible DMR locations based on CpG density and sample sequencing coverage.
Genes associated with DMRs (Hyper, Hypo or background loci) were found using bedtools closest function on all Hg38 Ensemble annotated genes and a subsequent filter for genes within +/− 5kb from the start or end of each DMR. With this approach a DMRs is first assigned to a gene if it overlaps the gene body. If a DMR does not overlap a gene body then it is assigned based on the closest gene (or genes in case of a tie) up or downstream, within the limit of 5kb. 44,379 unique genes were associated with background loci, 703 with Hyper DMRs and 1,078 with Hypo DMRs.
Principal Components Analysis (PCA)
PCA was performed on average methylation (%mG/CG) over 20kb windows across the genome using the prcomp and ggbiplot in R.
CIBERSORT Cell Type Deconvolution
Methylation levels from all BA9 cortex samples were extracted for CpGs showing unique cell type specific methylation levels among Glutamaterigc neurons, GABAergic neurons, and glial cells (186 CpG sites used with at least one read/CpG for all samples, Figures S2)(Kozlenkov et al. 2014). The 186 methylation values from Kozlenkov et al., 2014 (Table S2) were used as custom signature profile for input to CIBERSORT(Newman et al. 2015) (https://cibersort.stanford.edu). CIBERSORT estimated the relative levels of distinct cell types within each BA9 WGBS sample by comparing the methylation patterns of the same 186 CpGs between the samples and custom signature profile using machine learning linear support vector regression(Newman et al. 2015).
Average Methylation Analysis Over Genomic Features
Average methylation was calculated for specific genomic features across all features in the genome for each individual. Genebodies were defined from transcription start site to transcription end site by the Ensemble Hg38 annotation (http://www.ensembl.org/biomart). Promoters were taken from the Ensemble Hg38 promoters database (Zerbino et al. 2015) and CpG Islands were taken from the UCSC table browser for Hg38 (https://genome.ucsc.edu) (Karolchik et al. 2004). Average methylation levels and average sequencing coverage were analyzed using a mixed model ANOVA with main effects for diagnosis, genomic feature, and sex, the interaction between diagnosis and genomic feature, and the random effect of 1/sampleID. Posthoc comparisons were made with Benjamini-Hochberg corrected t-tests. Average methylation levels of genebody of PCDH genes within the grey60 module was performed similarly with a mixed model ANOVA for Diagnosis + Sex and a random effect of subject. Plots of average methylation across the genebody were made using Deeptools (Ramírez et al. 2016) compute matrix on averaged methylation files for ASD and Control samples (50bp bins) for the median PCDH genebody length (6400bp) and +/− 500bp up and downstream. Plots were generated using Deeptools Plotprofile.
GO Term and Pathway Enrichment
Gene Ontology (GO) term enrichment and pathway analysis was performed for DMRs using GREAT (McLean et al. 2010) with default settings for human. DMRs were lifted over to Hg19 and then used as input with the default association rule (5kb upstream, 1kb downstream, 1Mb max extension with curated regulatory domains included. The Region Based test with binomial FDR corrected (p<0.05) p-values were used to determine significant enrichment. GO term enrichments were further simplified using Revigo (Supek et al. 2011) trimming with default settings for human and for lists with greater then 10 enriched genes. Pre and post trimmed lists are given in Supplemental Table S5.
Region Overlap Enrichment and Datasets
Enrichment of DMRs within specific genomic contexts was performed using a modified package of LOLA (Sheffield and Bock 2015) with a two-tailed Fisher’s exact test with FDR correction to p<0.05 across all comparisons (see Table S6). Fold enrichment relative to background was calculated as the percent of ASD DMRs within the target regions minus the percent of background loci in the target regions divided by the percent of background loci in the target regions. Enrichments were filtered for changes in enrichment greater than 0.5 or less than −0.5. In all figures non-significant enrichments are shown in grey.
Chromatin states were taken from PFC from the ENCODE portal (Roadmap Epigenomics et al. 2015; Ernst and Kellis 2013; Ernst et al. 2011) (http://www.roadmapepigenomics.org/), DMRs from Dup15 brain samples were taken from (Dunaway et al. 2016), DMRs from ASD PFC from 450K array analysis were taken from (Nardone et al. 2017), histone H3K4me3 differential regions in ASD compared to control brains were taken from (Shulha et al. 2012), differential acetylation peaks from ASD brain were taken from (Sun et al. 2016), NeuN+ and NeuN-open chromatin regions in human PFC were taken from (Fullard et al. 2017a), Histone marks and PU1 ChIPseq from human microglia were taken from (Gosselin et al. 2017a), human PFC NeuN+ and – WGBS DMRs were taken from (Lister et al. 2013), pre versus postnatal DNA methylation data was taken from (Jaffe et al. 2015; Spiers et al. 2015), H3K4me3 across development was taken from (Shulha et al. 2013). Maternal Immune Activation WGBS microglial DMRs were taken from (Vogel Ciernia et al. 2017), and developmental microglial regulatory sites were taken from (Matcovitch-Natan et al. 2016). Human data in Hg19 or mouse data was transferred to Hg38 using LiftOver (Hinrichs et al. 2006).
Gene Overlap Enrichment and Datasets
Enrichment for DMR associated genes and previously published genelists was performed with the GeneOverlaps R package (Shen 2013) with a modification so that a two-tailed Fisher’s exact test was performed and all overlaps were FDR corrected to p<0.05. Gene lists were filtered to included only genes present in the background loci associated genes prior to statistical testing. All gene lists and citations are in Table S8.
Briefly, ASD and ID genetic risk genes were taken from SFARI (https://s1gene.sfari.org/autdb/GS_Statistics.do), and several recent exome sequencing studies (Iossifov et al. 2014; Sanders et al. 2015; Gilissen et al. 2014). pLI>0.9 genes were identified from the Exome Aggregation Consortium (Lek et al. 2016) as genes with a probability of loss of function mutation > 0.9 indicating that they are highly intolerant to genetic variation in the human population. Human ASD GWAS hits were taken from (The Autism Spectrum Disorders Working Group of The Psychiatric Genomics Consortium 2017) at an association p value < 0.05. Additional GWAS gene lists were taken from https://www.ebi.ac.uk/gwas. Lists of genes were taken from published datasets for Dup15 and Parikshak differentially expressed genes in ASD (Parikshak et al. 2016b), Gupta differentially expressed ASD genes (Gupta et al. 2014), genes associated with ASD DMRs (Nardone et al. 2017), differential methylation in Dup15 brain (Dunaway et al. 2016), and genes associated with peaks of differential H3K27 acetylation in ASD brain (Sun et al. 2016). Microglial gene lists were taken from several studies across different microglial isolation approaches and treatments (Keren-Shaul et al. 2017; Hanamsagar et al. 2017; Erny et al. 2015; Holtman et al. 2015; Vogel Ciernia et al. 2017; Zhao et al. 2017; Mattei et al. 2017; Cronk et al. 2015a; Matcovitch-Natan et al. 2016; Hickman et al. 2013). Genes with altered expression in offspring following maternal immune activation were also examined from whole brain (Garbett et al. 2012; Oskvig et al. 2012; Richetto et al. 2016).
Gene Expression Mapping
Normalized RPKM values for selected genes (DMR associated genes, microglial-DMR associated genes) were extracted from the human BrainSpan dataset (http://www.brainspan.org/rnaseq/) (Miller et al. 2014) and averaged (mean RPKM) for each individual. Timepoints were grouped by trimester and postnatal time blocks (first year, years 2-4, years 8-15, years 18-23, and over 30 years of age). Mean expression was then compared between genes associated with Hyper or Hypo DMRs and genes associated with background loci using a mixed model with factors for gene list identity, developmental age, and the interaction. Sex was included as a covariate and sample ID as a random effect. Benjamini-Hochberg corrected posthoc comparisons were used to compare Hyper and Hypo DMR associated gene expression to background loci associated gene expression for each developmental timepoint. A similar approach was taken for mapping transcription factor gene expression across cell type (Mancarci et al. 2017; Tasic et al. 2016) and microglial developmental datasets (Matcovitch-Natan et al. 2016; Hanamsagar et al. 2017).
Microglial Developmental Timecourse Gene Expression
Raw count data per transcript were downloaded from GEO GSE99622 (Hanamsagar et al. 2017). Two samples were excluded for low total read coverage < 200,000 total reads. The remaining samples were processed in EdgeR to counts per million (CPM) for differential analysis between timepoints and sexes with FDR corrected p-values to 0.05. FPKM values were also calculated by normalizing to gene length for WGCNA.
Weight Gene Co-Expression Analysis (WGCNA)
WGCNA was performed using the WGCNA R package (version 1.61 2017-08-05)(Langfelder and Horvath 2008, 2012). Reads per kilobase per million (RPKM) data were for dorsal lateral prefrontal cortex samples were taken from the human BrainSpan dataset (http://www.brainspan.org/rnaseq/) (Miller et al. 2014). FPKM values were calculated as described above for microglial development data with the exclusion of LPS treated samples (Hanamsagar et al. 2017), and mouse ensemble ids were converted into human using BioMart. Genes with zero variance in expression or a median absolute deviation of zero were removed from the analysis. Genes with a minimum RPKM of 0.25 or higher in at least one sample were kept for analysis for a total of 25,129 genes (unique Ensemble IDs) for BrainSpan and 12,597 for the microglia dataset (Hanamsagar et al. 2017). Values were transformed to Log2(RPKM+1) and clustered to visualize outliers. There were no outlier samples in the BrainSpan data but two samples were removed from the microglial development dataset due to poor clustering (Figure S9). A correlation matrix using biweight midcorrelation between all genes was then computed for all samples. An estimated soft thresholding power was used to derive a signed adjacency matrix with approximately scale-free topology (R^2 fit indices >.80) that was then transformed into a topological overlap matrix (TOM). The matrix 1-TOM was used as input to calculate co-expression modules with hierarchical clustering and a minimum module size of 200 genes. The resulting module eigengene were clustered based on their correlation and modules were merged at a cutheight of 0.25 (correlation of .75) to produce co-expression modules and one additional model with genes that did not show module membership (grey). Pearson’s correlation coefficients were used to calculate the correlation between sample traits and module membership. The expression profile of each module was further summarized by the module eigengene (ME), the first principle component of the module. Intramodule connectivity (kME) was calculated as the correlation between every gene in the module with the module ME. Overlap between module genes and gene lists for ASD genetic risk, ASD DMR associated genes, and ASD differentially expressed genes was calculated using the enrichmentAnalysis function in the anRichment R package (version 0.82-1). The background was set to the intersection between genes in the analysis and the organism database (org.Hs.eg.db_3.4.0) and a Fisher Exact test was conducted for each module-gene list pair and corrected to an FDR of p = 0.05. GO term enrichment was similarly calculated using enrichmentAnalysis with the current human GO term database.
Weight Genebody Co-Methylation Network Analysis
WGCMNA was performed using the WGCNA R package (version 1.61 2017-08-05) (Langfelder and Horvath 2008, 2012) on log2 transformed average mCG/CG values over genebodies for each gene in the Ensemble Hg38 annotation (TSS-TES). Genes were filtered to remove those with missing values, zero variance, zero median absolute deviation, or did not contain at least one sample with levels greater than 10%. The remaining 43,444 Ensemble Hg38 genebodies were used as input for building a network using all 26 samples. A biweight midcorrelation matrix was constructed for all genes and estimated soft thresholding power of 10 was used to derive a signed adjacency matrix with scale-free topology (R^2 fit indicies > .76). This matrix was then transformed into a topological overlap matrix (TOM), and the matrix 1-TOM was used as input to calculate genebody co-methylation modules with hierarchical clustering and a minimum module size of 50 genebodies. The expression profile of each module was further summarized by the module eigengene (ME), the first principle component of the module. The resulting module eigengenes were clustered based on their correlation and modules were merged at a cutheight of 0.25 (correlation of .75) to produce a total of 11 modules. Module eigengenes were related to ASD diagnosis and sex using a mixed model ANOVA with a random effect of subject.
Intramodule connectivity (kME) was calculated as the correlation between every genebody methylation in the module with the module ME. The top 10 genes ranked by kME were defined as hub genes for each module. Overlap between module genes and gene lists for ASD genetic risk, ASD DMR associated genes, and ASD differentially expressed genes was calculated using the enrichmentAnalysis function in the anRichment R package (version 0.82-1). The background was set to the intersection between genes in the analysis and the organism database (org.Hs.eg.db_3.4.0) and a Fisher Exact test was conducted for each module-gene list pair and corrected to an FDR of p = 0.05. GO term enrichment was similarly calculated using enrichmentAnalysis with the current human GO term database. Module visualization was performed using Visant software on the top 300 most connected genes in the module (ranked 1-TOM dissimilarity matrix) (Hu et al. 2013).
Stratified co-methylation analysis
In addition, separate networks were also constructed for only the ASD and only the Control Samples as described above but with a minimum module size of 200 genebodies. The resulting module eigengenes were clustered based on their correlation and modules were merged at a cutheight of 0.4 (correlation of .6) to produce a total of 22 modules in the Control network and 10 modules in the ASD network. Pearson’s correlation coefficients were used to calculate the correlation between sample traits and module membership for each network. A two-tailed Fisher’s exact test with FDR correction was used to make all pairwise overlap comparisons between ASD and Control network modules. The two networks were also compared to identify modules that were preserved between them using the preservation statistic Z-summary and Median Rank with permutation testing (n=100) (Oldham et al. 2006). The Z-summary measure takes into account the overlap in module membership, mean connectivity (density), and sum of the network connections (connectivity of modules). We used the recommended significance thresholds: Z-summary <2 implies no evidence for module preservation, 2> Z-summary <10 implies weak to moderate evidence, and Z-summary >10 implies strong evidence for module preservation (Oldham et al. 2006).
Transcription Factor Motif Enrichment
Hypergeometric Optimization of Motif EnRichment (HOMER) (Heinz et al. 2010) was used to identify significantly enriched motifs in both Hyper and Hypo DMRs relative to background loci. The findMotifsGenome.pl script was used with corrections for fragment size and CpG content (-chopify-cpg-size given). Available at http://homer.ucsd.edu/homer/
Statistics
Global mCG levels, coverage, age, PMI, read numbers, and conversion efficiency between ASD and control were assessed using a two-tailed t-test with welch correction. The impact of PMI, age, PCB, and PBDE on global methylation levels were assessed by one-way ANOVA with a main effect of diagnosis and covariates for each measure (Table S1). Cell type deconvolution was analyzed by two way repeated measures ANOVA with diagnosis, cell type, and diagnosis x cell type as factors and sex as a covariate.
DATA ACCESS
Previously published datasets for human ASD and Control BA9 samples are available at GEO GSE81541. The human BrainSpan Data is available at: (http://www.brainspan.org/rnaseq/) (Miller et al. 2014). Microglial developmental RNAseq data is available at GEO GSE99622 (Hanamsagar et al. 2017).
CODE AVAILABILITY
All analysis code is available on Githup at https://github.com/kwdunaway and https://github.com/aciernia and https://github.com/cemordaunt/DMRfinder.
AUTHOR CONTRIBUTIONS
A.V.C. designed the research approach, performed bioinformatic and statistical analysis, and wrote the manuscript. B.I.L. assisted with DMR calling and bioinformatic analysis. K.W.D. prepared sequencing libraries and initial bioinformatics processing. C.E.M. and R.L.C provided additional bioinformatics analysis. D.H.Y assisted with experimental design and manuscript preparation. J.M.L. assisted with research design, analysis and manuscript preparation. All authors read, edited and approved of the final manuscript.
DISCLOSURE DECLARATION
The authors have nothing to declare.
ACKNOWLEDGMENTS
This work was supported by the National Institutes of Health R01ES021707, R01NS081913, IDDRC U54 HD079125, and a NARSAD Young Investigator Award foundation (AVC). This work used the Vincent J. Coates Genomics Sequencing Laboratory at UC Berkeley, supported by NIH S10 OD018174 Instrumentation Grant.


