

ABSTRACT
Facioscapulohumeral Muscular Dystrophy (FSHD) is a common adult muscular dystrophy in which the muscles of the face, shoulder blades and upper arms are among the most affected. FSHD is the only disease in which “junk” DNA is reactivated to cause disease, and the only known repeat array-related disease where fewer repeats cause disease. More than 95% of FSHD cases are associated with copy number loss of a 3.3kb tandem repeat (D4Z4 repeat) at the subtelomeric chromosomal region 4q35, of which the pathogenic allele contains less than 10 repeats and has a specific genomic configuration called 4qA. Currently, genetic diagnosis of FSHD requires pulsed-field gel electrophoresis followed by Southern blot, which is labor-intensive, semi-quantitative and requires long turnaround time. Here, we developed a novel approach for genetic diagnosis of FSHD, by leveraging Bionano Saphyr single-molecule optical mapping platform. Using a bioinformatics pipeline developed for this assay, we found that the method gives direct quantitative measurement of repeat numbers, can differentiate 4q35 and the highly paralogous 10q26 regions, can determine the 4qA/4qB allelic configuration, and can quantitate levels of post-zygotic mosaicism. We evaluated this approach on 5 patients (including two with post-zygotic mosaicism) and 2 patients (including one with post-zygotic mosaicism) from two separate cohorts, and had complete concordance with Southern blots, but with improved quantification of repeat numbers resolved between haplotypes. We concluded that single-molecule optical mapping is a viable approach for molecular diagnosis of FSHD and may be applied in clinical diagnostic settings once more validations are performed.
INTRODUCTION
Facioscapulohumeral Muscular Dystrophy (FSHD) is a genetic disorder mainly affecting skeletal muscle. The disease progresses in a distinctive pattern and distribution. Clinical symptoms usually appear during the second decade. Weakness begins in the face, shoulders and upper arms, then followed by distal lower extremities, pelvic girdle and abdominal muscles. The symptoms often show marked asymmetry [1]. Several other, extra-muscular manifestations are also frequently observed in FSHD, with a high frequency of hearing loss (∼75% patients) and retinal telangiectasia (60% patients) [2], as well as defects in the central nervous system such as severe intellectual disability and epilepsy [3]. FSHD is the third most common form of muscular dystrophy and affects approximately 1 in 20,000 individuals worldwide [4]. A significant variability in clinical expression is often observed, even among affected family members.
Two genetic subtypes of FSHD have been identified. The classical form, FSHD1, accounts for 95% of patients and is associated with a polymorphic macrosatellite repeat array on chromosome 4q35. The 3.3kb repeat unit is referred to as D4Z4, and patients typically carry 1-10 repeats, whereas non-affected individuals possess 11-150 repeats. Another D4Z4 repeat array on chromosome 10q26 exhibits almost complete sequence identity (∼99%) to the 4q35 array [5, 6]. Each D4Z4 repeat unit has a complex sequence structure, with several GC-rich repeat sequences and an open reading frame containing two homeobox sequences designated as DUX4 (double homeobox 4) [7, 8]. Both the 4q35 and 10q26 D4Z4 repeat arrays are highly polymorphic and exhibit extensive size variation in the normal population, but only the 4q35 repeats are associated with FSHD. A polymorphic segment of 10 kb directly distal to D4Z4 on 4q35 was identified [9], with two alleles as 4qA and 4qB, and only the 4qA allele is pathogenic for FSHD [10]. DUX4 transcripts within D4Z4 are efficiently polyadenylated and are more stable when expressed from 4qA background, suggesting that FSHD1 arises through a toxic gain of function attributable to the stabilized distal DUX4 transcript [11]. A less common form, FSHD2, accounts for 5% of patients and is associated with the SMCHD1 (Structural Maintenance of Chromosomes Hinge Domain 1) gene on chromosome 18p11.32. In FSHD2, patients harboring mutation in SMCHD1 have a profound hypomethylation of chromosomes 4 and 10, allowing chromosome 4 to express the toxic DUX4 transcript. Aberrant DUX4 expression triggers a deregulation cascade inhibiting muscle differentiation, sensitizing cells to oxidative stress, and inducing immune responses and muscle atrophy [12]. A unifying pathogenic hypothesis for FSHD emerged with the recognition that the FSHD-permissive 4qA haplotype corresponds to a polyadenylation signal that stabilizes the DUX4 mRNA, allowing the toxic protein DUX4 to be expressed [12].
Molecular diagnosis of FSHD is complicated by the relatively large size (∼3.3kb) and variable number of repeat units, the presence of homologous polymorphic repeat arrays on both chromosomes 4 and 10, as well as the frequent exchanges between these chromosomal regions. A Southern blot-based method, a BglII-BlnI dosage test, was developed to improve the sensitivity of conventional Southern blot for molecular diagnosis of FSHD [13]. The method was improved later using restriction enzyme Xap1 which complements Bln1, as the former uniquely digests repeat units derived from chromosome 4 and the latter uniquely digests those derived from chromosome 10 [14]. After these developments, Southern blot could be used as a successful molecular diagnosis test of FSHD. However, the limitations of this method are evident: First of all, Southern blot needs four separate enzyme/probe combinations and a large amount of fresh DNA. The patients are often asked to go to the genetic testing agency and draw the blood sample on site, which is inconvenient. Nowadays, prenatal diagnosis is broadly available to test inherited genetic disorders, yet it is still problematic for FSHD, due to the need to get enough DNA for Southern blot test by chorionic villus sampling or amniocentesis. Secondly, due to complexity of gene defects, Southern blot designed for FSHD is a strenuous and time-consuming procedure. Lastly, the determination of the length of the macrosatellite repeats is semi-quantitative by pulsed-field gel electrophoresis. Clinicians and researchers cannot obtain accurate counts of the contracted sequence, thus hindering precise genetic diagnosis of the disease as well as the research into the pathophysiology of the disease and the development of potential therapeutic strategies. More importantly, this procedure may miss post-zygotic mosaicism in some patients with FSHD, especially when present in low fractions.
In the current study, we aim to leverage a single-molecule optical mapping approach to develop a new method to diagnose FSHD due to repeat contraction. Several key challenges that we need to address are the differentiation of 4qA alleles with 4qB alleles, the differentiation of 4q35 and 10q26 regions, the accurate quantification of repeat numbers, and the ability to detect low levels of mosaicism. With the large size of DNA fragments (hundreds of kilobases to over one megabases) that are assayed by the optical mapping approach, these challenges can be addressed, and we demonstrated a few successful applications of the approach by analyzing clinical samples from multiple institutions.
RESULTS
Optical mapping on long DNA molecules can differentiate paralogous genomic regions
Optical mapping [15] is a technique for constructing ordered, genome-wide, high-resolution restriction maps from single, stained molecules of DNA, called “optical maps”. In the current study, we applied a high-throughput platform, the Bionano Saphyr Genome Mapping platform, to perform optical mapping on high molecular weight (>150kb) DNA molecules. Briefly, first, a nicking endonuclease creates a single-strand nick in the long DNA molecules at a specific recognition site, wherever it occurs in the genome. Next, fluorescently labeled nucleotides are incorporated and single-strand nicks are repaired with a polymerase and ligase. The labeled DNA molecules are then stretched into linear form, and moved through the Saphyr Chip’s Nanochannels electrophoretically. The nanofluidic environment allows molecules to move through hundreds of thousands of parallel Nanochannels simultaneously, while the high-resolution Saphyr camera images them. The fluorescent labels in each DNA molecules and their relative distances thus form unique signature patterns spanning long distance and enable mapping of each molecule to the reference genome, when a sufficient number of labels (typically >10) are present in the DNA molecule.
Multiple complex segmental duplications are present in 10q26 and 4q35 chromosome regions, complicating the genome mapping of DNA molecules originating from these regions. To illustrate this, we plotted the three pairs of segmental duplications that contain the D4Z4 repeat units (DUX gene clusters) (Figure 1), including one cluster in 4q35 and two clusters in 10q26. Only the cluster in 4q35 are related to the development of FSHD, when there is a contraction of copy number of the D4Z4 repeat units in this cluster. Furthermore, a polymorphic segment of 10 kb directly distal to D4Z4 on 4q35 carry two different allelic configurations in the population, commonly referred to as 4qA and 4qB, and only the 4qA allele is pathogenic for FSHD [10]. Therefore, successful molecular diagnosis of FSHD requires accurate quantification of D4Z4 repeats within the 4q35 region, and the differentiation of the 4qA and 4qB alleles.
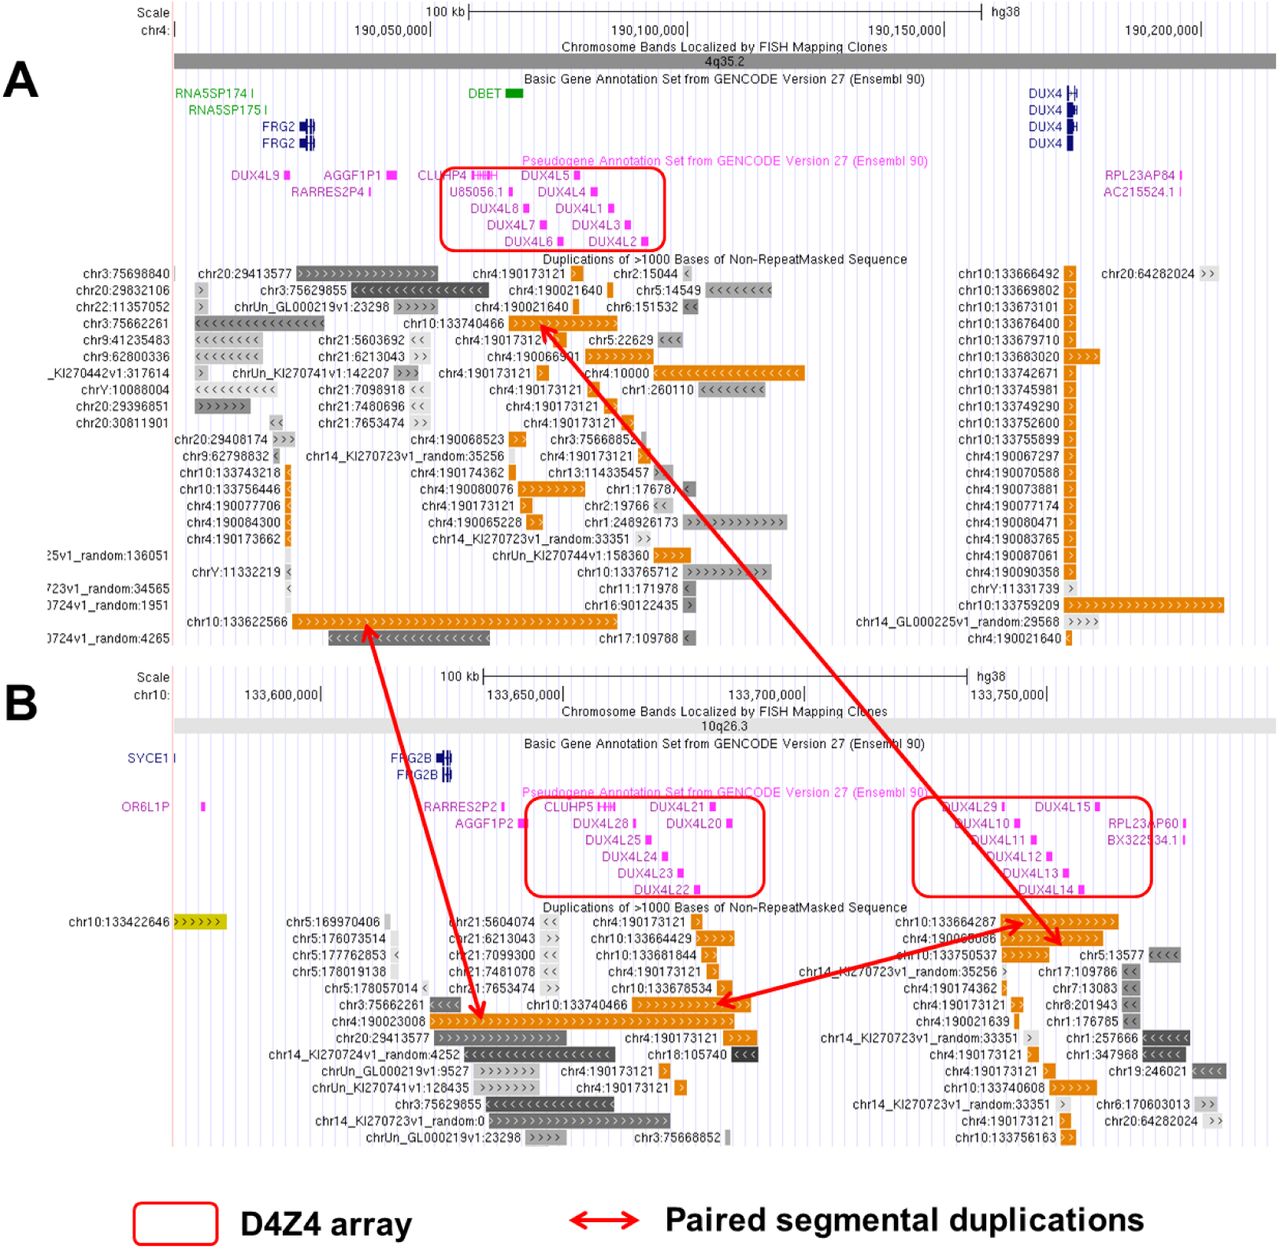
An overview of the genomic architecture of segmental duplications at the chromosome 4q35 (panel A) and 10q26 (panel B) regions. In the GRCh38 reference genome, 4q35 carries one D4Z4 array (8 D4Z4 repeat units), while 10q26 carries two D4Z4 arrays (each with 7 D4Z4 repeat units). The 63kb segmental duplication in 4q35 (chr4:190023009-190086241) has high sequence identity with the corresponding region in 10q26 (chr10:133622567-133685491), and contains the D4Z4 array spanning ∼26kb as shown in red boxes. The three arrows point to three pairs of segmental duplications.
Determining D4Z4 repeat copy number on 4q35 by Nb.BssSI enzyme labeling
We initially selected the Nb.BssSI restriction enzyme for the study, since each D4Z4 unit contains a recognition site for this enzyme, as previously suggested [16]. Through the analysis of fluorescence labels generated by in silico digestions with the Nb.BssSI enzyme, we have identified the regions of label similarity and dissimilarity between the paralogous genomic regions on chromosome 4q35 and 10q26 (Figure 2). Our computational analysis showed that when a DNA molecule is long enough to stretch out into the region of dissimilarity (Figure 2, blue box), we can tell whether the molecule originates from 4q35 versus 10q26. Furthermore, based on the presence or absence of one additional label ∼1.8kb distal to the last label in the D4Z4 repeat regions, we can determine the allelic configuration to be 4qA or 4qB (Figure 2A). These observations form the basis of our experimental and computational approaches to quantify the number of D4Z4 repeats in 4q35 and the determination of 4qA/4qB configurations.

Illustration of the region with label dissimilarity between 10q26 and 4q35 (blue box) adjacent to the region of similarity (green box). By using fragments that spans the region of dissimilarity, we can confidently separate fragments originating from 10q26, 4q35 or those that are undetermined (uninformative). (A) and (B) represent labels generated by the Nb.BssSI and Nt.BspQI enzymes, respectively. Although the reference genome GRCh38 contains two labels (repeat unit #2 and #5) within the D4Z4 repeat region for the Nt.BspQI enzyme (red box), we rarely observe them in real data, possibly due to the inclusion of a very rare allele in the GRCh38 or due to errors in genome assembly.
We evaluated this approach on five patients who were well characterized clinically (Table 1). All of them had a positive diagnosis of FSHD through Southern blot (Figure 3 and Supplementary Figure 1), and two of them (ID: P04 and P05) were known to carry post-zygotic mosaicism. Two of the patients had relatively mild myopathic change based on electromyography, and their creatine kinase (CK) values were in normal range. Two other patients had myopathic change, and their CK values were elevated significantly, including one patient who had no family history of FSHD. One additional patient had normal electromyography and normal CK values, but was affected with FSHD with a relatively late onset at age 31. This patient had a family history of FSHD and had mosaic repeat numbers.
A list of patients and control subjects assayed in the current study. More detailed description of clinical phenotypes can be found in Supplementary Table 1. EMG: Electromyography, CK: creatine kinase.

Representative examples of molecular diagnosis of FSHD by Southern blot. The full results for each patient is available in Supplementary Figure 1. E/H and p13E-11: Double digested with EcoRI/HindIII and then labeled with probe p13E-11, and all the 4q and 10q segments are illustrated. E/B and p13E-11: Double digested with EcoRI/BlnI and then labeled with probe p13E-11, and the 10q segments are digested so only 4q segments are illustrated. H and 4qA: digested with HindIII and then labeled with probe 4qA, and the 4qA alleles are illustrated. H and 4qB: digested with HindIII and then labeled with probe 4qB, and the 4qB alleles are illustrated. The star “*” denotes pathogenic allele with <10 repeat units and with a 4qA configuration. The plus sign “+” denotes somatic mosaic allele.
The analysis of mapped reads confirmed the presence of contracted alleles in all five patients (Table 1). We stress here that the optical mapping experiments on this cohort were performed in a separate institution from where Southern blots were performed and without knowledge of results from Southern blots, yet the final results were consistent. We illustrate a representative example in Figure 4, where the presence of fluorescence labels can be easily and directly visualized and counted in the Bionano Access browser. Additional results on other patients were presented in Supplementary Figure 2. Although some enzymatic labels appear to be missing given the imperfect labeling efficiency of the enzyme, it is possible to computationally predict the missing labels based on distances between neighboring labels representing D4Z4 repeats. When multiple reads are piled at the same locus, each read will be assigned an estimated repeat count, and a peak-finding algorithm was used to identify the presence of two peaks (3 repeats and 28 repeats both in 4qA configuration) in the patient, representing the repeat counts for two alleles, respectively.

Determination of D4Z4 copy number in a patient with FSHD (ID: P02), labelled by the Nb.BssSI enzyme. The reference genome GRCh38 (light green bar) contains eight D4Z4 repeats. Each Bionano read (light blue bar) contains multiple labeling enzyme recognition sites at the D4Z4 region, shown as red vertical labels (those that can be aligned to GRCh38) or black vertical labels (those that cannot be aligned to GRCh38) that are ∼3,300bp apart. The patient had 3 repeats (A) and 28 repeats (B) in two alleles, respectively, and both alleles have the 4qA configuration, reflected as an extra black label ∼1, 759bp distal to the last D4Z4 label.
In addition to quantifying the D4Z4 repeat numbers on 4q35, we next examined whether our methods can detect the presence of post-zygotic mosaicism on 4q35, since two patients were suspected to carry mosaicism from Southern blot, albeit being semi-quantitative. We illustrate a representative example in Figure 5, where the presence of fluorescence labels can be directly visualized and counted in the Bionano Access browser, for a patient with 3, 19 and 23 repeats and the number of supporting reads as 18 (20%), 42 (46.7%) and 60 (33.3%), respectively. We acknowledge that the read counts may be biased by the length of the reads and by the performance of the alignment algorithm. Since the three alleles were in 4qA, 4qB and 4qA configurations, respectively, we speculate that the allele with 3 repeats was due to a post-zygotic contraction of D4Z4 repeat units from the allele with 23 repeats, resulting in disease manifestation. Altogether, these results demonstrated that our method is sensitive to infer and quantify post-zygotic mosaicism, potentially facilitating the precise diagnosis of a fraction of patients who may be difficult to be characterized by Southern blots.
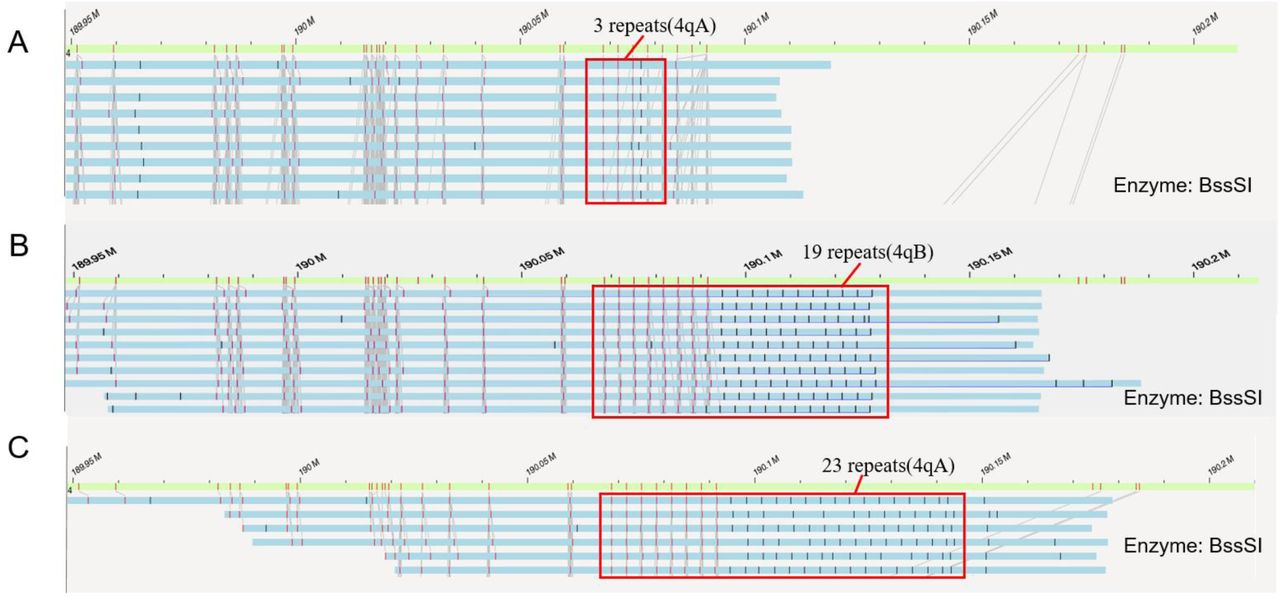
Detection of post-zygotic mosaicism in a patient (ID=P04) with 3 (A), 19 (B) and 23 (C) repeats in the D4Z4 repeat region, with 4qA, 4qB and 4qA configuration, respectively. There are 18 (20%), 42 (46.7%) and 30 (33.3%) reads that support the three alleles, but only a fraction of reads are shown in the figure.
Determining D4Z4 repeat copy number on 4q35 by Nt.BspQI enzyme labelling
Most published studies and ongoing human genetics studies use this enzyme to label DNA molecules on the Bionano Irys or Saphyr platform, partly due to its robustness and high sensitivity to recognize DNA motifs. Therefore, it would be ideal to develop methods that can utilize information on this enzyme as well, to determine the copy number of D4Z4 repeat units. Our in silico digestion analysis on the reference genome GRCh38 demonstrated that it is possible to differentiate reads originating from 4q35 and 10q26 (Figure 2B). Although the reference genome GRCh38 contains two labels (chr4:190070830 and chr4:190080713 within repeat unit #2 and #5, respectively) within the D4Z4 repeat region for the Nt.BspQI enzyme, we rarely observe them in real data, possibly due to the inclusion of a very rare allele in the GRCh38 or due to genome assembly errors in GRCh38. Therefore, enzymatic labels within the D4Z4 repeat region themselves are not sufficient to differentiate 4q35 from 10q26. Instead, based on recognition sites surrounding the D4Z4 repeat array, it is possible to infer the length of the D4Z4 array purely based on the distance between flanking regions with fluorescence labels (Figure 2B). Additionally, although the human reference genome GRCh38 only contains sequences for the 4qB configuration in the D4Z4 array, our empirical analysis and previous report [16] demonstrated that the 4qA/4qB allele type of the repeat units can be confidently assigned by the presence of a 5-label or 3-label array distal to the D4Z4 repeat array.
To illustrate this, we additionally performed optical mapping on selected patients using the Nt.BspQI enzyme. We present a representative example in Figure 6, where the distance between two flanking segments of the D4Z4 clusters can be used to quantify the number of repeats. Additional results on other patients were presented in Supplementary Figure 2. Unlike our analysis using the Nb.BssSI enzyme, we can assign a quantitative (floating-point) copy number to each DNA molecules that spans the region of dissimilarity. The information from all reads can be compiled together to reach an estimate of the copy numbers for both alleles (4 and 22 repeats, respectively), and our results were completely consistent with the results obtained from the Nb.BssSI enzyme.

Determination of D4Z4 copy number in a patient with FSHD (ID=P01), labelled by the Nt.BspQI enzyme. The number of repeats need to be calculated from the distance between two adjacent labels. The mean and standard deviation of the repeat number estimates from all reads were calculated. The patient has 4 repeats with 4qA configuration and 22 repeats with 4qB configuration in the two alleles, respectively.
Additional validation on a second patient cohort and a control cohort
To further validate the method in diagnostic testing settings, we analyzed a second cohort of two patients suspected to have FSHD, from two separate institutions. These patients all had typical clinical manifestations consistent with FSHD (Table 1). However, they were not previously subject to any diagnostic testing of FSHD. We performed the genetic analysis on the Bionano Saphyr single-molecule optical mapping platform as the only molecular diagnosis. We obtained positive results on both patients, and found that one patient (ID=P06) had post-zygotic mosaicism with 2, 15 and 27 repeats (Figure 7). We generated this result using the Nb.BssSI enzyme and validated it using the Nt.BspQI enzyme. Since the allele with 15 and 27 repeats had 4qB and 4qA configuration, respectively, we can further infer that the post-zygotic contraction of D4Z4 repeats occurred on the allele with 27 repeats in 4qA configuration, which represented a dramatic decrease of D4Z4 copy number on this allele.

Determination of somatic mosaicism by Nb.BssSI (A/B/C) and Nt.BspQI (D/E/F) enzymes on a patient with 2, 15 and 27 repeats (ID=P06). For both enzymes, our computational pipeline accurately identified the presence of somatic contraction, and determined that the contraction occurs on the parental allele carrying the 4qA configuration.
Finally, we evaluated our approach on two control subjects without FSHD and without a family history of FSHD. We also downloaded publicly available Bionano genome mapping data sets on the NA12878 subject (ID=C01). The results from both the Nb.BssSI enzyme and Nt.BspQI enzyme were largely consistent with each other for all three subjects (Table 1), suggesting that the method can work on health human populations with larger number of D4Z4 repeat units. Nevertheless, we caution that the method may be less effective for human subjects carrying >50 D4Z4 repeat units, given the size limitations of typical DNA extraction and optical mapping experiments (for example, a total of 50 D4Z4 repeat units already account for 165kb length by themselves). Due to the inability of Southern blot to accurately assay copy numbers for relatively long D4Z4 repeat regions, we do not yet have an estimate from large-scale population-wide data on the prevalence of D4Z4 repeat units that are larger than 50 copies. However, from our empirical data and the analysis on subjects in Table 1, it is reasonable to speculate that the vast majority of alleles in human populations carry less than 50 repeat units.
DISCUSSION
In this study, we evaluated the clinical validity of using Nanochannel-based optical mapping to perform molecular diagnosis of FSHD. We demonstrated that this method can accurately quantify the number of repeats, can differentiate the DNA fragments from 4q35 and 10q26, and can quantify the mosaic levels of repeats when one allele has a post-zygotic contraction of D4Z4 repeat units. We concluded that optical mapping is a viable approach for molecular diagnosis of FSHD and may be applied in clinical diagnostic settings once more validations are performed in the future.
Compared to conventional optical mapping approaches, the Nanochannel-based optical mapping has several clear advantages. First, by stretching the DNA molecules as linear molecules and going through massively parallel Nanochannels, the resolution and throughput are much higher than conventional optical mapping approaches that spread labelled DNA molecules on glass slides in semi-controlled fashion. In our study, we can show that through Nb.BssSI enzyme labeling, the exact copy number can be visually discerned directly from the Bionano traces, serving as a visual confirmation of the high resolution of the technology.
A second advantage of the single-molecule optical mapping approach over conventional approaches is the flexibility to switch to different enzymes to allow detection of different patterns. In our study, we demonstrated that Nb.BssSI enzyme is a preferred choice for FSHD since an enzyme recognition site is directly located within the D4Z4 repeat unit. However, this enzyme is less commonly used in Bionano mapping experiments, compared to the “default” Nt.BspQI enzyme for Bionano mapping studies. Therefore, we also developed methods to quantify the repeat number with the Nt.BspQI enzyme labeling, by measuring the distance between the flanking markers. Our analysis on selected samples who were subject to both enzymes demonstrated high levels of concordance between estimates inferred from both enzymes. With the recent introduction of Direct Label and Stain (DLS) chemistry to label DNAs rather than conventional labeling approach using nicking enzymes, the resolution and signal-to-noise ratio of this method are expected to improve significantly in the future. With longer DNA molecules being imaged in the future, D4Z4 repeat copy numbers larger than 50 may be easily spanned and measured.
Another advantage of the Saphyr platform is that in addition to quantifying the copy number of D4Z4 repeat units, it will also enable the de novo assembly of a human genome and the genome-wide identification structural variants [17]. Therefore, unlike conventional approaches such as Southern blots that target towards this particular genomic region, optical mapping can serve a dual purpose of identifying structural variants that may be relevant to the phenotypic presentations in the patient, especially when FSHD diagnostic testing yields negative results.
There are several modifications to our current protocol that may be implemented in the future to further improve the diagnostic accuracy and sensitivity. First, all analysis on our data sets was based on either the Nb.BssSI or the Nt.BspQI enzyme. We have demonstrated that the results on the Nb.BssSI and Nt.BspQI enzymes were consistent on the samples used in our study, despite the use of different algorithms for repeat quantification. Therefore, it is conceivable to design an improved mapping approach where two enzymes are both included in the study yet with different fluorescence colors, to improve the analysis of DNA molecules by combining results from both enzymes. This method improves the resolution but may also serve as a cross-validation of two complementary approaches in addressing this diagnostic challenge. Additionally, we used relatively straightforward computational approaches to infer repeat counts from data derived from both enzymes, and demonstrated that they work well. However, additional improvements to the algorithms are possible in the future, through the incorporation of prior information (such as the prior distribution of copy numbers and prior frequency of 4qA/4qB alleles) and the use of more formal probability models.
There are several limitations of the approach that we wish to discuss here. First, our study focused on the molecular diagnosis of patients with FSHD, and only included a very small number of unaffected control subjects. Currently the average length of reads from the Saphyr platform is about 350kb, even though the DNA molecules that were assayed in our study can range from 100kb to over 1Mb. An unaffected individual may carry 11-150 repeat units, resulting in the D4Z4 array size of 33 to 450kb. For individuals carrying over 300kb regions, the number of reads that covers the entire region may be quite limited, so the effective coverage will be much less than the default coverage (which is usually ∼100X per flowcell). This is not a problem for diagnosing FSHD per se, since <10 repeats are pathogenic, but it may pose a problem for population-scale analysis of D4Z4 repeats since it gives an upper bound of the number of repeats that can be detected by the platform. Once we obtain population-scale data, we will come back to this question and assess how this will impact data analysis. Additionally, previous studies showed that the presence of somatic mosaicism for a rearrangement of D4Z4 was found in as much as 3% of the general population using Southern blots [18]; once we have large-scale data from the general population in the future, we can re-evaluate this estimate with more quantitative characterization, to assess the threshold for the fraction of cells carrying repeat contraction to show a clinical manifestation. Furthermore, mitotic interchromosomal gene conversion or translocation between fully homologous 4-type repeat arrays may be a major mechanism for FSHD mutations [18], yet available data are limited to address this hypothesis. With population-scale data on the general population in the future, we may be able to evaluate this hypothesis by comparing 4q and 10q on two sets of homologous chromosomes on subjects carrying mosaicism.
Another limitation of our study is that with the exception of patient P02 and P03 (offspring and mother), we were not able to obtain parental data for patients under the study. As previously reviewed [19], several studies demonstrated that de novo repeat contraction may account for a surprisingly high percentage of FSHD patients (10%-33%) [20, 21], and this high incidence can be partly explained by the presence of parental mosaicism for 4q short alleles that has been reported in 19% of de novo cases [22, 23]. Among the three patients with post-zygotic mosaicism in our study (P04, P05 and P06), one of them (P05) had a family history of FSHD and a relatively late onset at age 31. Detailed examination of medical records showed that P05 was a female patient who was referred to the clinic due to mild symptoms and due to a confirmed diagnosis of an offspring with early-onset FSHD. Note that we were unable to determine the genetic origin of the pathogenic mutation in P05 due to the lack of parental data; similarly, we were unable to determine whether the contracted repeat number differs between P05 and her offspring as the offspring did not consent in this study. Nevertheless, this case represented an interesting example where post-zygotic mosaicism was inferred in a patient suspected to carry germline mosaicism, corroborating previous reports that a substantial fraction of mosaic parents with germline mosaicism in oogenesis may have been overlooked [23]. As repeat contraction may occur very early in embryonic development for a fraction of asymptomatic parents with affected children, improved understanding of the co-existence of low levels of germline and somatic mosaicism in parental genomes may have important implications for genetic counseling, especially with respect to recurrent risk estimation [24, 25]. Future studies that include parental data regardless of whether parents were affected with FSHD can help further clarify this question, and help characterize the existence [20, 26] or absence [27, 28] of genetic anticipation in FSHD.
Another limitation of the current study is that we used blood samples for molecular diagnosis, rather than muscle biopsy from affected areas. However, in practice, obtaining sufficient amounts of DNA with high integrity may be more difficult on muscle biopsy, therefore limiting our ability to compare results between blood and tissues in the current study. It is conceivable that somatic contractions that are only present in affected areas/tissues may not be detectable in blood samples, and can result in false negative results. Similarly, analyzing two separate samples from the same subject can help identify false positive calls, especially for low levels of mosaicism. Nevertheless, given that the disease manifestation of FSHD involves multiple areas (such as face, shoulder blades and upper arms) in our patient cohorts, and that we did not observe asymmetric involvement of affected areas, the disease causal mutations are more likely to be inherited, germline de novo or post-zygotic mutations during early embryogenesis, rather than somatic mutations in muscle tissues in specific areas.
In conclusion, we established the technical feasibility of using Bionano Genomics’s Saphyr platform to perform molecular diagnosis of FSHD, and discussed a number of advantages, limitations and possible modifications that may improve the detection accuracy and reliability. With the ever decreasing cost of performing genome mapping on the single-molecule optical mapping platform, and the recent introduction of Direct Label and Stain technology, we expect that this method may be widely applied in research and clinical settings of FSHD, and may potentially expedite the genetic studies on this devastating disease. Lastly, this study may serve as a model, which demonstrated how the workflow can be applied to other rare diseases involving complex genomic structural changes.
MATERIALS AND METHODS
Sample selection
The study was approved by the Institutional Review Board of the Peking Union Medical College of the Chinese Academy of Medical Sciences. Our primary patient cohort consists of five patients, including two from the same family (P02 and P03). Four of the patients have a family history of FSHD, but one patient (P04) is sporadic (Table 1). All the patients had a molecular diagnosis of FSHD by Southern blots, and two of the patients were suspected to carry mosaicism based on Southern blots, though the exact fraction and the parental origin of the chromosome with post-zygotic contraction cannot be determined. We stress here that the Southern blot and optical mapping on this cohort were blindly performed in two separate institutions without information from each other, yet the final results are consistent. Our second patient cohort consists of two patients suspected to have FSHD, but without a prior molecular diagnosis. Additionally, existing data on two unaffected adult subjects without FSHD, as well as the publicly available data on NA12878, were included in the study as negative controls.
Southern blot and PFGE-based DNA analysis
We followed previously published protocols for Southern blot [10, 29]. All diagnostic testing by Southern blots were performed at the Department of Neurology, First Affiliated Hospital of the Fujian Medical University. For each sample, one portion of DNA samples was double digested with EcoRI/HindIII and with EcoRI/BlnI, yet another portion of DNA samples was digested only with HindIII. Then the digested DNA was separated by pulsed field gel electrophoresis (PFGE). After electrophoresis, the DNA was transferred to a Nytran XL membrane and hybridized with the probes p13E-11, 4qA, 4qB, respectively. Finally, the blots were exposed to obtain images for further manual analysis of repeat numbers.
High molecular weight (HMW) DNA isolation for optical mapping
Fresh blood samples were collected in EDTA stabilized anti-coagulative tube, adequately mixed and stored at 4°C promptly. Samples that cannot be processed within 5 days after collection were stored at - 80°C. HMW DNA was extracted from either 1 ml frozen or fresh blood, following manufacturer’s guidelines (Bionano Prep Blood DNA Isolation Protocol, Bionano Genomics, #30033) with slight modifications. Briefly, red blood cells were lysed by RBC lysis solution (Qiagen) and white blood cells (WBC) left were pelleted. After centrifugation, WBC were re-suspended in cell buffer (Bionano) and embedded into 2% agarose plugs (CHEF Genomic DNA Plug Kit, Bio-Rad) to avoid fragmentation of long DNA molecules, during the overnight lysis at 50 °C in lysis buffer (Bionano Genomics, USA) with Puregene Proteinase K (Qiagen). The volume ratio (v/v) of WBC and agarose were 2:1,4:1,8:1 and 16:1, in order to obtain DNA with proper concentration. The agarose plugs were washed with Tris-EDTA buffer the following day and digested at 43 °C with GELase™ Agarose Gel-Digesting Prep (2 unit/µl, Thermo Fisher) for 50 min. Extracted HMW DNA was purified via drop dialysis using Millipore membrane filters (EMD Millipore, USA) placed on Tris-EDTA buffer for 3 hours.
DNA quantification was carried out using Qubit dsDNA assay BR kits with a Qubit 2.0 Fluorometer (ThermoFisher Scientific). The integrity of HMW DNA was detected by pulsed-field gel electrophoresis (Pippin Pulse, Sage Science). Only the DNA samples with concentration between 30-100ng/ul and sufficient molecular mass were used in the following DNA labeling experiment.
DNA labeling and chip loading
The DNA labeling experiment (also referred to as “NLRS”) consists of four sequential steps (Nick, Label, Repair and Stain), and was performed strictly following manufacturer’s guidelines (Bionano Prep™ Labeling - NLRS Protocol, Bionano Genomics, #30024). In short, 300 ng of purified HMW DNA was nicked by nicking endonucleases Nb.BssSI (New England BioLabs) in 10X Buffer 3.1 (Bionano Genomics) at 37 °C for 2 hours. Using Taq polymerase (New England BioLabs), the nicked DNA was labeled at 72 °C for 1 hour by fluorophore-labeled nucleotides mixed in 10X Labeling mix (Bionano Genomics). In the third step, labeled DNA was repaired with Taq ligase (NEB) at 37 °C for 30 min to restore integrated double strands DNA. In the last step, the DNA backbone was stained overnight in a dark environment at 4 °C for visualization and size identification. DNA quantification was carried out using Qubit dsDNA assay HS kits with a Qubit 2.0 Fluorometer (ThermoFisher Scientific) and only DNA samples with concentration between 4-10ng/ul were chosen to be loaded in the next step.
Labeled DNA was loaded on the Saphyr chip and pushed by low-voltage electric field into pillar region and Nanochannel in the Bionano Saphyr instrument. After the mapping procedure begins, the fluorescently labeled DNA molecules were imaged by the Saphyr instrument. Generally, after 24-36 hour, each sample can generate 320-480 Gbp data for each flowcell, which was used for further data analysis.
Data pre-processing and alignment
The raw output files from the Bionano Saphyr mapping platform were in BNX formats. Each file contained molecule and label information and quality scores per channel identified during a Bionano run. Where necessary, for each subject, we combined several BNX files into one BNX file. We next performed a basic filtering of the BNX file using all default parameters suitable for human genome, including the 150kb length cutoff and the label SNR filter. To assess the quality of each of the Bionano runs, we performed Molecular Quality Report using default parameters and examined the results by comparing to manufacturer recommended values. Additional details can be found at https://bionanogenomics.com/wp-content/uploads/2017/05/30175-Rev-A-Bionano-Molecule-Quality-Report-Guidelines.pdf.
For each enzyme, we performed in silico digestion of the human reference genome (GRCh38) to generate the reference map for that particular enzyme (that is, the reference CMAP file). We then mapped the BNX files to the reference CMAP file, using the Bionano Solve (version 3.1), accessed from https://bionanogenomics.com/support/software-downloads/. Slight modifications were made to the source code align_bnx_to_cmap.py to change all the hard-coded path name in the software. The results include three file types: xmap, r.cmap and q.cmap. They represent the alignment file, the reference label file and the query label file, respectively. A custom script was developed to extract specific regions of alignments from whole-genome mapping to speed up subsequent data analysis and visualization.
Determination of repeat copy number and 4qA/4qB configuration by Nb.BssSI enzyme
We developed a simple yet effective approach for quantifying repeat units and determining 4qA/4qB configurations using Nb.BssSI-based labels. Through the analysis of an empirical mapping data set on human samples, which was already normalized through a scaling factor to account for the variation of DNA migration rates during Bionano data acquisition, we calculated that the length of D4Z4 repeat unit (hereafter referred to as r) is 3299.4bp ± 144.00bp, the length of 4qA (hereafter referred to as q) is 1758.79bp ±61.15bp and the distance to the first label immediately after 4qA (hereafter referred to as s) is 7889.79bp ± 240.93bp. These observations suggest that the three measures (r, q, s) are quite distinct from each other and their variances are small enough so that they can be easily differentiated in real data. Based on these empirical observations, we set a coefficient of variation (hereafter referred to as t) upper bound of 0.05, which is a measure of relative variability as the ratio of the standard deviation to the mean (the empirical observations had t values of 0.044, 0.035 and 0.031 for the three measures, respectively).
Our algorithm accounts for the relatively high error rates in the label data. Based on technical documentation from Bionano (https://bionanogenomics.com/wp-content/uploads/2017/05/30175-Rev-A-Bionano-Molecule-Quality-Report-Guidelines.pdf), the percentage of unaligned labels in molecules relative to number of labels in molecules and the percentage of unaligned reference labels relative to number of reference labels are generally less than 15% and 21%, respectively, for a mapping data set with reasonable quality. Our algorithm first examines reads that are mapped to the 4q35 target region (Figure 2) with sufficient number of labels in the “region of dissimilarity” to ensure that the reads originate from 4q35 rather than 10q26. For each read, we denote the position of the first label within D4Z4 region as l1 for simplicity, and all following labels as l2, l3 up to ln (the last label in the read). We then calculate a distance vector between all adjacent labels as d = [d1, d2, d3, …, dn−1] = [l2 − l1, l3 − l2, l4 − l3, …, ln − ln−1]. Based on each di (1≤ i ≤ n-1) in the vector, we classify each label into one of five categories of events: (1) one additional D4Z4 repeat, when r(1 − t) ≤ di ≤ r(1 + t); (2) one or two false negative labels (that is, expected label is missing from reads), when r(1 + t) > di ≤ 3r(1 + t); (3) one or two false positive labels (that is, extra label is present in reads), when r(1 − t) > di+di+1 ≤ r(1 + t) for one extra label, or when r(1 − t) > di+di+1+di+2 ≤ r(1 + t) for two extra labels; (4) 4qA is encountered, when q(1 − t) ≤ di ≤ q(1 + t) and when s(1 − t) ≤ di+1 ≤ s(1 + t); (5) a label outside of D4Z4 repeat region is encountered, or an exception is encountered when the first four criteria are not met. Optionally, the prior probability for the five events can be determined from genome-wide estimate of false positive and false negative rates when mapping all reads to the reference genome GRCh38, to assign reads into the five categories based on posterior probability. When more than one consecutive category 5 events are encountered, the label counting for this read ends and the number of estimated repeat counts is recorded. For each sample, the results for all reads are then tallied in a histogram. A peak-calling algorithm is used to classify one peak (homozygous, which is rare), two peaks (heterozygous) or three peaks (post-zygotic mosaicism), and quantify the number of repeat units corresponding to each peak. We also note that although we have not encountered this situation in practice, it is possible that all reads spanning this region have only category 5 events, when the patient carries zero copies of D4Z4 repeat units in both alleles.
Determination of repeat copy number and 4qA/4qB configuration by Nt.BspQI enzyme
Although less straightforward, we also developed a simple yet effective approach for quantifying repeat units and determining 4qA/4qB configurations using Nt.BspQI-based labels. Based on the published sequence of D4Z4 (GenBank: D38024.1) [30], we determined the position of D4Z4 repeat units on 4q35 in the human reference genome GRCh38 as shown below (we note that a previous study [16] incorrectly determined repeat units in GRCh38). However, with one possible exception, analysis of a large number of real data sets failed to detect Nt.BspQI labels in repeat unit #2 and #5, suggesting that GRCh38 may have included a very rare allele or may contain assembly errors in this region.
Based on in silico enzyme digestion of GRCh38 by the Nt.BspQI enzyme, we found that there is a restriction enzyme recognition site 7,271bp upstream of the first D4Z4 repeat unit in GRCh38 (CMAP coordinate as chr4: 190058870), and that there is another restriction enzyme recognition site 7,860bp downstream of the last D4Z4 repeat unit in GRCh38 (CMAP coordinate as chr4: 190100364). Therefore, when we can anchor a read to the two enzyme recognition sites, we can calculate the distance between two labels as x, and estimate the number of D4Z4 repeat units as y=(x-7271-7860)/3300. Unlike our analysis on Nb.BssSI, the estimate y here is a floating point value rather than an integer. When multiple reads are mapped to the same region, we can calculate the value of y to yield a best estimate of the number of repeat units. As previously discussed [16], based on empirical evidence, the 4qA and 4qB configuration can be differentiated by the presence of five labels (4qA) or three labels (4qB) downstream of D4Z4 repeat region.
Visualization and manual examination of results
We used the Bionano Access software for visualization of genome mapping and manual examination of results. The software was obtained from https://bionanogenomics.com/support-page/bionano-access/. It is a node.js web application that can communicate with a remote server, but can also run in standalone mode to perform visualization of results.
We extracted a subset of reads that mapped to 4q35 and 10q26 regions and performed manual examination of their alignment. The results are generally consistent with computational results, further suggesting that the method is highly reliable.
COMPETING INTERESTS
P.L., F.L., F.Y., J.Z. and D.W. are employees and K.W. is consultant of Grandomics Biosciences.
FUNDING
This study is in part supported by the CAMS Innovation Fund for Medical Sciences (CIFMS), Project number 2016-I2M-1-002.
ACKNOWLEDGMENTS
We thank the patients with FSHD who participated in this study to develop novel diagnostic tests using genomic technologies. We also thank the genetic counselors and clinical geneticists who interviewed the patients and collected samples. This study was partially supported by institutional resources at the Peking Union Medical College of the Chinese Academy of Medical Sciences.
REFERENCES


