

Abstract
The uncommonness of gallbladder cancer has contributed to the generally poor understanding of the disease, with scant reports restricted to advance-stage tumors. Here, using an integrated analysis of whole exome and phospho-proteome, we show recurrent activating ERBB2 and KRAS somatic mutations are present in 6 and 3 of 44 early-stage rare gallbladder tumors, respectively. In vitro and in vivo cell-based and biochemical assays reveal an essential role of ErbB pathway activation for the survival of gallbladder cells. Interestingly, the genetic and pharmacological dependencies of gallbladder cells are dependent on the KRAS mutant allele status, reminiscent of the clinical algorithm commonly practiced to opt for anti-EGFR treatment in colorectal cancer. In overall, we present the first evidence that the presence of KRAS (G12V), but not KRAS (G13D) mutation, may preclude gallbladder cancer patients to respond to anti-EGFR treatment, leading to an early adoption of an approved treatment regimen for gallbladder cancer patients.
Introduction
Genomically matched therapies targeting activated tyrosine kinases have shown promise across multiple cancer types (Krause & Van Etten, 2005). The success of tyrosine kinase inhibitors (TKIs) such as imatinib, a BCR-ABL fusion protein inhibitor (Druker et al, 2001); vemurafenib, a RAF inhibitor (Flaherty et al, 2010); lapatinib, an inhibitor of ERBB2 (Rusnak et al, 2001); erlotinib and crizotinib, inhibitors of EGFR and ALK, respectively (Christensen et al, 2007; Paez et al, 2004); and, others have provided a powerful validation for precision cancer medicine. Although these treatments offer great promise, selective genomic profiling of tumors tend to impede broader implementation of genome-based cancer care (McGranahan & Swanton, 2015). For example, an inadequacy to account for multiple relevant genetic alterations likely resulted in comparable outcomes in a recently performed randomized trial where multiple cancer type patients were profiled for selected driver alterations and randomized to receive genomically-matched versus conventional therapy (Le Tourneau et al, 2014). Such important clinical studies underscore the need for convergence of information for multiple genetic alterations to ensure success of future clinical trial designs, with specific emphasis for consideration of co-occurring alterations that could potentially render tumors unlikely to benefit from genomically-matched treatments. Some prototypical examples include KRAS, NRAS, and BRAF mutations in colorectal cancers or secondary EGFR mutations in lung cancer against anti-EGFR targeted therapies (De Roock et al, 2010b).
The EGFR family of receptor tyrosine kinases (RTK) consists of EGFR, HER2, HER3 and HER4 (human EGFR-related-2, -3, and -4). A ligand-bound EGFR family member forms a homo- or hetero-dimer to activate the PI3K-AKT-mTOR or RAS-RAF-MAPK downstream signaling pathway to evade apoptosis and enhance cell proliferation (Garner et al, 2013). Interestingly, of all EGFR family members, HER2 lacks a ligand binding domain and forms preferred partner for other members to heterodimerize even in the absence of ligand (Spivak-Kroizman et al, 1992). Deregulation of EGFR family RTK-signaling network endows tumor cells with attributes to sustain their malignant behavior and survival, as is frequently observed in breast cancer, lung cancer, pancreatic cancer, head and neck cancer and colorectal cancer (Tebbutt et al, 2013). Interfering with the EGFR pathway thus forms the basis for the development of targeted anticancer therapies such as RTK-targeted antibodies (Cetuximab and Herceptin) and small-molecule inhibitors of RTK kinase (Erlotinib, Lapatinib, Afatinib, etc.) that have shown dramatic clinical response (Tebbutt et al, 2013). In such responses, however, co-occurrence of a KRAS mutation – a downstream component of the pathway-preclude patients from anti-EGFR treatment in colorectal cancer, wherein KRAS codon 12, but not codon 13 mutations are associated with poor outcomes (Yoon et al, 2014), underscoring their prognostic impact.
Gallbladder cancer, the most common malignancy of biliary tract, is a rare form of cancer in the world where chemotherapy and other palliative treatments have little effect on overall survival of patients (Rakic et al, 2014). The poor understanding of gallbladder cancer due to its uncommonness in the western world but high prevalence in Chile and the Indian subcontinent lends itself to the need for further research (Barreto et al, 2014). While the 5-year survival rate of an early stage T1 gallbladder carcinoma is nearly 100%, it signficantly decreases as the disease progresses, with less than 15% for T3/T4 advanced stage tumors(Zhu et al, 2010). A hope for longer term survival has specifically been promising for an early stage T2 carcinomas with an intermediate 5-year suvival (Miller & Jarnagin, 2008). Literature suggests HER2 overexpression in 12–15 % of advanced stage gallbladder cancers with a favorable response to HER2 directed therapy (Javle et al, 2015). Moreover, three recent studies analyzed whole exome sequence of advanced stage gallbladder tumors with consistent findings (Barreto et al, 2014; Jiao et al, 2013; Nakamura et al, 2015). In order to understand the landscape of somatic alterations among a clinically distinct early staged pT1/pT2 gallbladder cancer patients, we performed whole exome sequencing of 17 early staged tumor-normal paired gallbladder samples, 5 gallbladder cancer cell lines followed by validation in 27 additional tumor samples. Here, we report novel somatic mutations of ERBB2 in gallbladder cancer, and its therapeutic implication in presence and absence of KRAS (G12V) and (G13D) mutations.
Results
Integrated genomics and proteomics approach identify aberrant alterations in members of the EGFR family in gallbladder cancer
We performed whole-exome sequencing on paired tumor and germline DNA samples from 17 patients with gallbladder cancer and 5 gallbladder cancer cell lines (Supplementary Table S1 and S2). We achieved >100-fold mean sequence coverage of targeted exonic regions. The average non-synonymous mutation rate was found to be 7.7 mutations per megabase (Supplementary Table S3), which is significantly higher than as reported for other populations (Li et al, 2014). The nucleotide mutation pattern was observed to be enriched for C>T transition followed by A>G transition (Supplementary Figure S1), consistent with previous reports (Li et al, 2014). A total of 5060 somatic variants found across 17 tumors consisted of 3239 missense, 1449 silent, 131 nonsense, 135 indels and 106 splice site mutations. Somatic mutations in genes previously reported to be altered in gallbladder cancer, including recurrent mutations in TP53 (35.2%), ERBB2, SF3B1, ATM and AKAP11 at 17.6% each were found to be mutated at comparable frequencies (Li et al, 2014) (Figure 1A and Supplementary Table S3). For validation of a few TP53, ERBB2, ERBB3, SMAD4 and CTNNB1 mutations, sanger-based sequencing were carried out in a subset of patients (Supplementary Figure S2). Among set novel alterations, we observed significant somatic mutations in chromatin modifier genes such as SF3B1, ATRX, CREBBP and EZH2 that are known to play a significant role in other cancer types (Yoshida & Ogawa, 2014). In addition, we also found two tumor samples that harbored known activating kinase domain mutations in ERBB2, (V777L) and (I767M) (Bose et al, 2013); while two samples harbored EGFR (I1005V) and ERBB3 (R112H) mutation (Supplementary Table S4). We identified 5 more samples with ERBB2 mutations harboring (V777L) mutations in an additional set of 27 gallbladder cancer samples (Figure 1B). Interestingly, copy number analysis using cghMCR software identified EGFR amplification with a highest Segment Gain Or Loss (SGOL) score of 18 (Figure 1A), as reported earlier (Javle et al, 2015). In overall, we observed genomic amplification in EGFR, CDK4, MDM4, CCND1, CCNE1, MYC, STK11 and BRD3, and deletion in FHIT, SMAD4, TRIM33 and APC.
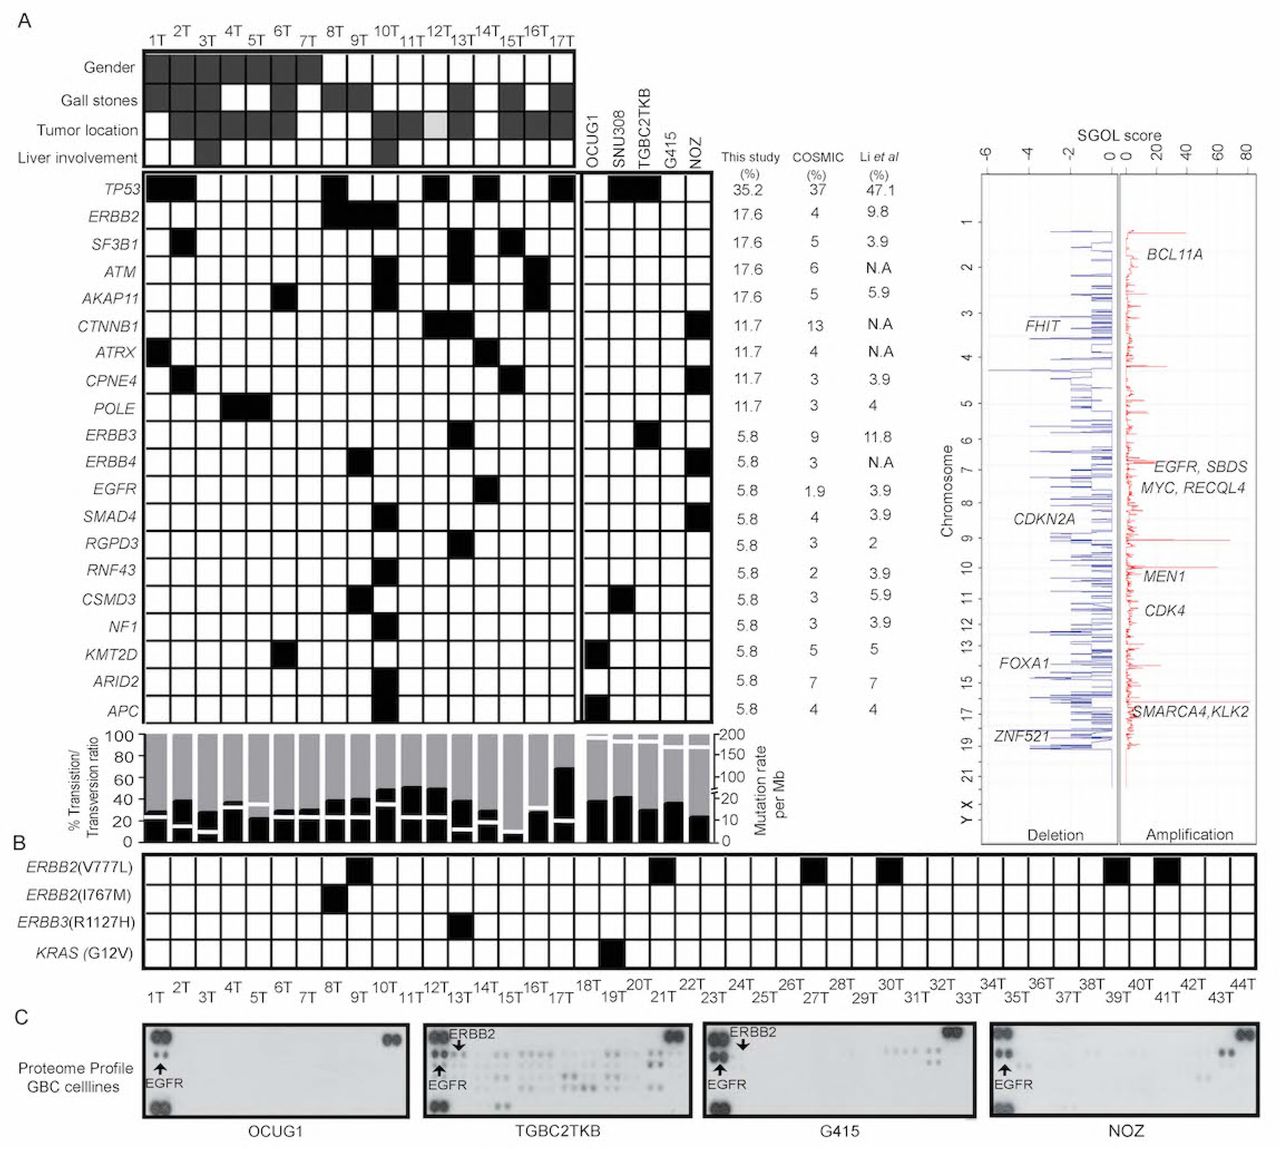
A) The heat map represents somatic mutation landscape in gallbladder cancer patients (n=17) and primary tumor derived cancer cell lines (n=5) using whole exome sequencing. Clinicopathological features such as gender, gallstones, tumor location and liver involvement are shown for each patient. The grey solid boxes denote females, presence of gallstone, tumor location (neck) and positive for liver involvement. The white box denotes males, absence of gallstones, tumor location (body) and negative for liver involvement. The genes are arranged in the decreasing order of their frequency. Black solid box indicates the presence of mutation in the heatmap. Mutation frequencies of the genes mentioned are shown in this study, COSMIC-GBC and Li et. al study. The transition to transversion ratio is shown in percentage for each patient indicated by different shades (Black denotes transversion and grey denotes transition). Somatic mutation rate/30Mb is derived from whole exome sequencing data is indicated by white line. Overall copy number changes derived from whole exome sequencing data. The horizontal-axis is represented by a score of segment gain or segment loss (SGOL score) while the vertical-axis represents the chromosomal positions. Copy number gain is indicated by red with positive SGOL score while copy number loss is indicated by blue with a negative SGOL score. Representative cancer-associated genes are annotated in their respective amplified/deleted regions. B) Schematic representation of ERBB family mutation validation by Sanger sequencing in an additional set of 27 samples. Solid box indicate presence for mutation in the respective samples, white boxes indicates no event. C) RTK array analysis of gallbladder cancer cells (OCUG1, TGBC2TKB, G415, and NOZ) for 10 minutes exposure of blot is shown. Each RTK is spotted in duplicate and the pair of dots in each corner of the membrane corresponds to positive and negative control. Tyrosine phosphorylation of EGFR (ERBB1) and ERBB2 were observed consistently, indicated by arrow.
Next, to correlate differential activation of signaling molecules with their genomic alterations, we performed phospho-proteomic profile of four gallbladder cell lines for 49 receptor tyrosine kinases using a phospho-RTK array. Consistent with whole exome findings, we observed varying levels of EGFR and ERBB2 constitutive phosphorylation in all gallbladder cancer cell lines based on their phospho-proteome (Figure 1C) and follow up validation by western blot analysis (Supplementary Figure S3A). Interestingly, the whole exome data analysis and Sanger sequencing based validation also revealed that 1 of 44 gall bladder patients and NOZ cells harbor KRAS (G12V) mutation; G415 cells harbor KRAS (G13D) mutant allele; while OCUG1 and SNU308 cells were wild type for KRAS (Figure 1B; Supplementary Figure S2). These four cell lines thus represent diverse gallbladder cancer sub-classes based on their KRAS mutant allele status (Li et al, 2014). Of note, KRAS mutations are known to predict plural clinical outcome in response to EGFR inhibitors in colorectal and lung cancer along with other mutations (Supplementary Table S4) (Choughule et al, 2014).
ERBB2 and EGFR are essential for gallbladder cancer cells not harboring KRAS G12V mutant allele
To determine the significance of EGFR and ERBB2 constitutive phosphorylation and KRAS mutant alleles in gallbladder cancer cells, we set out to establish whether expression of ERBB2 is required for gallbladder tumor cell survival. We tested a series of five shRNA constructs in three gallbladder tumor cell lines expressing ERBB2 with wild type KRAS in OCUG1 cells, along with G415 and NOZ cells harboring the KRAS (G13D) and KRAS (G12V) mutant alleles, respectively. We identified three shRNA constructs that efficiently knocked down expression of ERBB2 and inhibited the constitutive phosphorylation of MAPK in OCUG1 and G415 cells but not in NOZ cells (Figure 2A), consistent with drug sensitive outcome described in colorectal cancer wherein cells harboring wild type KRAS or mutant KRAS (G13D) allele are sensitive to EGFR inhibitor but not those harboring mutant KRAS (G12V) mutant allele (Osumi et al, 2015). This suggests that KRAS (G13D) but not KRAS (G12V) still requires upstream EGFR signaling in gallbladder cancer cells, similar to as established in colorectal cancer(Kumar et al, 2014). Next, we used these cells to demonstrate that knockdown of ERBB2 inhibited anchorage-independent growth, cell survival, cell invasion and migration efficiently in OCUG1 and G415 cells but not in NOZ cells (Figure 2B-E). Furthermore, as unlike other EGFR family members, ERBB2 does not require ligand binding for dimerization but can be activated by heterodimerization (Linggi & Carpenter, 2006), we asked if EGFR mediates the activation of downstream signalling pathways. We performed co-immunoprecipitation of EGFR and ERBB2 to establish that ERBB2 interacts with EGFR in gallbladder cells (Supplementary Figure S3B), possibly similar to ERBB3 as shown earlier in gallbladder cells (Li et al, 2014). Moreover to test if ERBB2 requires EGFR also for sustained signaling and transforming potential, we knocked down the expression of EGFR in OCUG1 and G415 cells. The knockdown of EGFR inhibited anchorage-independent growth, cell survival, cell invasion and migration in OCUG1 but not in G415 cells, similar to ERBB2 knockdown (Supplementary Figure S4). Taken together, this suggests that ERBB2 requires EGFR or other members of the family possibly to dimerize for activation, such that down-regulation of EGFR and potentially other members suppress the functionality of ERBB2, as has been previously reported in breast cancer (Zhou & Agazie, 2012).

A) Western blot analysis with 5 shRNA constructs used to knock down ERBB2 expression were packaged into lentivirus and used to infect OCUG1, G415, and NOZ cells. Anti-ERBB2 immunoblot shows that hairpins 3 and 5 efficiently and consistently knock down endogenous ERBB2 expression across all cells (A upper panel) with concomitant decrease in downstream signaling as assessed by anti-phospho-MAPK immunoblot in OCUG1 and G415 cells but not in NOZ cells that harbor a constitutivelyactive KRAS (G12V) mutation (A lower panel). Actin is included as a loading control. Scr, scrambled hairpin and untransfected cells (UT) used as a negative control. Knockdown of ERBB2 expression with shRNA inhibits; invasion characteristics as assessed by matrigel assay (B); anchorage-independent growth as shown by soft agar assay(C) and, migration as assessed by scratch assay (D) of OCUG1 (with wild type KRAS) and G415 (with KRAS (G13D)) cells but not NOZ gallbladder cancer cell lines that harbor an activating KRAS (G12V) mutation. The graph on the right panel represents percent inhibition normalized to scrambled (Scr) control cells. Similarly, knockdown of ERBB2 expression with shRNA inhibits percent growth as determined by MTT assay with bar graph plotted with readings obtained on day 4 relative to day 1 for OCUG1, G415, and NOZ cells (E) for each shRNA construct and normalized to scrambled control cells. Representative plates from three independent experiments are presented. Colonies were photographed and quantitated after 2 weeks for soft agar assay (Magnification: ×10); 1 day for invasion; and 20 h for migration assay. *P<0.05.
Gallbladder cancer cells not harboring KRAS (G12V) mutant allele are sensitive to irreversible EGFR inhibitors in vitro and in vivo
Next, we investigated whether inhibition of kinase activity of EGFR family receptor tyrosine kinases would be effective against gallbladder cancer cell lines. Treatment of the OCUG1 and G415 cells with BIBW-2992 (Li et al, 2008), but not reversible EGFR inhibitor gefitinib (data not shown), similarly abolished phosphorylation of MAPK in OCUG1 cells, which was constitutively phosphorylated in the untreated gallbladder cell lines compared to the NOZ cells and resulted in a marked decrease in migration, invasion, colony formation in soft agar and cell survival in liquid culture, with IC50s of 0.8 uM in OCUG1 and 2.0 uM in G415 cells, whereas no effect was observed on NOZ cells harboring KRAS (G12V) mutant allele (Figure 3A-E). Furthermore, when injected subcutaneously into NOD/SCID mice, 13 of 13 mice injected with G415 cells formed tumors ∼13 days post injection; 10 of 10 mice injected with NOZ cells ∼6 days of post injection; while none of 10 mice injected with OCUG1 cells formed tumors uptill 2 months post injection of cells (Supplementary Table S8). When the tumors reached ∼100-150mm3, tumors were treated orally with 15mg/Kg irreversibile EGFR inhibitor Afatinib- or vehicle for a period of 15 days. Consistent with in vitro data, tumors treated with Afatinib slowed or reversed their growth compared to vehicle in G415 xenografts (n=7) but not in NOZ (n=6) xenografts. The overall effect on tumor burden in vehicle-treated versus Afatinib-treated mice were 5.7-folds lower in G415 xenografts, while no significant differences were observed in in NOZ xenografts(Figure 4A and B). This reduction in tumor size in G415 xenografts was paralleled by reduction in the amounts of phospho-ERK1/2 by immuno-histochemical analyses (Figure 4C-D, lower panel) of explanted tumors, further validating our in vitro findings (Figure 3A).

A) Treatment of OCUG1, G415 and NOZ gallbladder cancer cells for 10-12 hrs with 0-10 µM covalent EGFR inhibitor BIBW-2992 inhibits both basal and ligand-induced (5-min stimulation with 20 ng/ml EGF) EGFR and ERBB2 phosphorylation, as evident from immunblotting with anti-phospho antibodies specifically recognising EGFR (pY1068) and ERBB2 (pY1248). However, EGFR inhibitor BIBW-2992 inhibits MAPK activation as determined by pMAPK p42/p44 (Thr202/Thr204) antibody, a downstream effector component of EGFR- and ERBB2-dependent signalling pathways in OCUG1 (with wild type KRAS) and G415 (with KRAS (G13D)) cells but not in NOZ gallbladder cancer cell lines that harbor an activating KRAS (G12V) mutation. Actin was used as a loading control. Treatment with the indicated concentrations of EGFR inhibitor BIBW-2992 inhibited soft agar colony formation (B); invasion (C); and, migration (D) by the OCUG1, G415 but not NOZ gallbladder cancer cell lines with hyper phosphorylated ERBB2. *P<0.05 vs control. Representative plates from three independent experiments are presented. Colonies were photographed and quantitated after 2 weeks for soft agar assay (Magnification: ×10); 1 day for invasion; and 20 h for migration assay. Quantification of effects of BIBW-2992 for assays is indicated in the form of bar graph.
D) Gallbladder cancer cell line MTT survival assays performed after 72h treatment with BIBW-2992 in 6 replicates is shown. IC50s are indicated in form of table as determined by nonlinear regression with Prism GraphPad software.

A) G415 and NOZ xenografts developed in NOD-SCID mice were subjected to afatinib (15mg/kg) or vehicle treatment for a period of 15 days. The plot shows the tumor volume (mm3) during the course of drug treatment indicating reduction of tumor volume in afatinib treated G415 xenografts. B) CT scan and PET imaging by F18-FDG uptake is shown for vehicle and afatinib treated xenografts. The gradient color code is shown for uptake of F18-FDG with red indicating maximum uptake C) Immunoblot analysis of phosphorylation of MAPK (pERK1/2, ERK1) is shown for vehicle(-) and afatinib(+) treated xenografts. Actin is used as the loading control. D) Immuno-histochemical staining of pERK1/2, ERK1 is shown for vehicle(-) and afatinib(+) treated xenografts.
Clinical correlation of TP53 and EGFR family mutations in early stage gallbladder cancer patients
In overall, the patient cohort represents a good subset of fairly early stage disease who received experienced and good quality radical surgery in a tertiary referral center. The Kaplan-Meier survival analysis with respect to TP53 mutation status revealed an overall survival of 40 months (n=6; 95% CI: 34.1-70.7) compared to 52 months (n=11; HR: 0.8, 95% CI: 1.1-4.4 P= 0.799) among patients with wild type TP53 (Supplementary figure 5A). Thus, the overall survival of patients with mutations decreased as compared to patients with wild type TP53. This observation is consistent with previous reports wherein TP53 mutations are associated are known to be associated with worse prognosis in various cancer types (Kandioler-Eckersberger et al, 2000). Interestingly, overall survival with respect to EGFR family mutation status was 65 months (n=9; 95% CI: 49.5-.82.1) compared to 54 months (n=35; 95% CI: 42.1-65.2) among patients with wild type EGFR family genes (Supplementary figure 5B; Supplementary table S5).
Discussion
This study represents the first genomic landscape of an early-stage gallbladder cancer that reveals somatic mutations in TP53, ERBB2, ATM, AKAP11, SMAD4 and CTNNB1 similar to as reported in advance-stage gallbladder tumors. Our mutation pattern analysis revealed an enrichment for C>T transition followed by A>G transition, a signature which suggests an underlying chronic inflammation leading to GC to AT polyclonal transition (Yanagisawa et al, 2010), as reported earlier (Iyer et al, 2016). We also observed significant somatic mutations in chromatin modifier genes such as SF3B1, ATRX, CREBBP and EZH2 that have not been reported earlier in gallbladder cancer, indicating potential therapeutic options. Analyzing the potential effects of somatic alterations on survival of gallbladder cancer patients, we observed a trend among patients with wild type TP53 to survive longer than patients with TP53 mutations, which is known to predict failure of chemotherapy in several cancer types (Petitjean et al, 2007) and is consistent with previous reports observed in gallbladder cancer (Doval et al, 2014).
Additionally, consistent with a recent report that described alterations in ERBB2 and ERBB3 at a frequency of 9.8% and 11.8% respectively among Chinese gallbladder cancer (Li et al, 2014), we found recurrent activating ERBB2 (V777L) mutation in 6 of 44 gallbladder cancer samples with an overall mutation frequency of 13%, in addition to ERBB3 (R112H) and EGFR (I1005V) mutation occurring at 2%, each in our sample set. The (V777L) alteration has been shown to be sensitive to lapatinib in biliary tract cancer, breast cancer cell lines and other isogenic systems overexpressing the alteration (Bose et al, 2013; Javle et al, 2015). Functional studies performed using gallbladder cell lines establish that ERBB2 and EGFR are essential for the survival of gallbladder cancer cells. Given that ERBB2 lacks the ligand binding domain, the co-immunoprecipitation experiments suggest that ERBB2 dimerize with EGFR, and possibly with other members, to constitutively activate the pathway. Interestingly, genetic or pharmacological ablation of ERBB2 and EGFR function, using EGFR small-molecule irreversible inhibitor BIBW-2992, diminishes the survival, anchorage-independent growth, migration and invasion characteristics of gallbladder cancer cell lines, suggesting members of the EGFR family as an effective therapeutic target. Furthermore, while KRAS mutations in gallbladder cancer have been reported to occur at a frequency from 3% to 30 % (Muller et al, 2014), some co-occuring with activating ERBB3 mutation, we observed KRAS (G12V) and (G13D) mutation in 1 of 44 primary gallbladder tumors and 2 of 5 gallbladder cancer cell lines that are known to be associated with differential clinical outcome in response to anti-EGFR therapy in colorectal cancer (De Roock et al, 2010a; Li et al, 2015). The biological characteristics of KRAS mutation is known to vary by cancer types as those found in pancreatic and non-small cell lung cancers are predominantly at codon 12, while in colorectal and gallbladder mutations appears to be in codon 12 and codon 13 (Prior et al, 2012). Moreover, clinical response among patients along with invitro and invivo studies with isogenic colon cell line indicate KRAS (G13D) mutation as sensitive but (G12V) as resistant to anti-EGFR therapy suggesting codon 13 mutations are still dependent on inductive upstream EGFR signaling and exhibit weaker in vitro transforming activity than codon 12 mutations (De Roock et al, 2010a).
In summary, besides suggesting adoption of anti-EGFR therapy as a therapeutic option in early-stage gallbladder cancer based on ERBB2 alteration, we present the first evidence that presence of KRAS (G12V) but not KRAS (G13D) mutation may preclude such patients to respond to the treatment, similar to the clinical algorithm commonly practiced based on EGFR alteration in colorectal cancer. As low prevalence rate of the disease, target accrual in clinical trials has been a bottleneck in gallbladder cancer, this study forms the basis to include gallbladder patients for an anti-EGFR therapy under basket clinical trials such as the NCI–Molecular Analysis for Therapy Choice (NCI-MATCH) trials that are genomically matched (Do et al, 2015).
Materials and Methods
Patient Information
A total of 27 fresh frozen samples (10 tumor-normal paired and 7 orphan tumors) were utilized for whole exome sequencing. An additional set of 27 FFPE samples were utilized as a validation set. Tumor-normal paired samples were collected at Tata Memorial Hospital and Advanced Centre for Treatment, Research and Education in Cancer (ACTREC), Mumbai. Sample set and (ACTREC-TMC) Internal Review Board (IRB) -- IRB Project Number # 104--approved study protocols. Formalin-fixed paraffin-embedded tissue blocks were collected from the tissue repository of Tata memorial hospital (TMH-TTR) in compliance with the guidelines. These tissues were examined for tumor content and the tumor content was in the range of 40-90%. Patient samples and characteristics are provided in the Supplementary Table S1 and S5.
DNA extraction
Genomic DNA was extracted from fresh frozen samples by using Qiagen Blood and Cell culture DNA kit. The extracted DNA yield and quality were assessed using Nanodrop ND2000 (Thermo scientific). The extracted DNA (about 1µg) from the fresh-frozen tissue specimens were sent to Genotypic Technology Pvt Ltd, Bangalore for exome sequencing. Genomic DNA from FFPE blocks was extracted using Qiagen QiAmp DNA FFPE Tissue kit as per manufacturer instructions. The extracted DNA yield and quality were assessed using Nanodrop ND2000 (Thermo scientific). These samples were further checked for integrity by PCR amplification of GAPDH (96bp). These samples were used for extended Sanger validation of identified variants in exome sequencing.
Exome analysis pipeline and somatic mutation calling
The variant analysis was performed as described previously (Chandrani et al, 2017; Upadhyay et al, 2016a). MutSigCV v2.0 (Lawrence et al, 2013) and IntOgen (Gonzalez-Perez et al, 2013) were used for identification of the significantly mutated gene and p value ≤0.05 was considered as the threshold for significance. The variants were excluded if they were present in exclusively in dbSNP, TMC-SNPdb or both. Also, we removed variants that were identified in all three databases – COSMIC (v68) (Forbes et al, 2008), dbSNP (v142) (Sherry et al, 2001) and TMC-SNPdb database (Upadhyay et al, 2016a). The annotated cancer-associated variants were annotated using Oncotator (v1.1.6.0) (Ramos et al, 2015) and restricted our further analysis to only coding variants. Intogen (https://www.intogen.org/search) was used to calculate the significance of frequently mutated gene in our cohort. Since our dataset was inherently not suitable for above tools due to limited number of tumor samples (n=17), we have also performed extensive functional prediction tool based analysis for non-synonymous variants using nine different tools as described earlier (Chandrani et al, 2017). Total number of identified somatic substitutions in exome sequencing was extracted from MutSigCV output and was processed to calculate the number and frequency distribution of various transitions and transversions.
Exome sequencing capture, library construction, and sequencing
Exome capture and sequencing were performed as described previously (Upadhyay et al, 2016b). Briefly, Agilent Sure select in-solution (low-input capture-500ng) were used to capture ∼62Mb region of human genome comprising of ∼201,121 exons representing ∼20,974 gene sequences, including 5’UTR, 3’UTR, microRNAs and other non-coding RNA. Sequencing was run with 150bp paired end reads to achieve coverage of 100X and was performed according to Illumina standard protocol.
Copy number analysis from Exome sequencing data
Control-FREEC (Boeva et al, 2012) was used for copy number analysis from BAM files of variant calling analysis. Genes with Segments-of-Gain-Or-Loss (SGOL) score ≥4 were defined as amplified genes and ≤-2 as deleted genes by cghMCR package of R (http://bioconductor.org/packages/release-/bioc/html/cghMCR.html). The validation of somatic copy number changes was performed as described previously (Upadhyay et al, 2016b).
Cell culture and reagents
Human GBC cell lines (OCUG1, SNU308, TGBC2TKB, NOZ, and G415) obtained as a kind gift from Dr. Akhilesh Pandey (IOB, Bangalore) were cultured in DMEM media containing 10% FBS, 100 units/ml penicillin, and 100mg/ml streptomycin and amphotericin. All cell lines were incubated at 37°C with 5% CO2. The cell lines were authenticated by DNA short tandem repeat (STR) profiling using Promega Geneprint 10 system in conjunction with GeneMarker HID software tool. All cell lines were made mycoplasma free if necessary with EZKill Mycoplasma removal reagent (HiMedia).
Soft Agar assay
All experiments were performed in triplicates as described earlier (Chandrani et al, 2015). Briefly, anchorage-independent growth was assessed for the knockdown clones of ERBB2 and EGFR along with respective scrambled control. About 1ml of 2X DMEM supplemented with 20% FBS containing (1ml of 1.6% agar) to obtain 0.8% agar was added to the six well plate as bottom agar and was allowed to solidify. Next, 5 * 103 cells were supplemented with 1ml of 2X DMEM containing 0.8% agar to obtain 0.4% agar and were added to the bottom agar as top agar. The cells were incubated for 2 weeks at 37°C and 5% CO2. Colonies were counted under a microscope with a magnification of 10X.
Virus production
293FT cells were seeded in 6 well plates one day before transfection and each of the lentiviral constructs along with packaging plasmids-pPAX helper vector and pVSVG were transfected using Lipofectamine 3000 reagent (Invitrogen) as per manufacturer’s protocol. The viral soup was collected 48 and 72 hrs post transfection, passed through the 0.45µM filter and stored at 4°C. Respective cells for transduction were seeded one day before infection in a six-well plate and allowed to grow to reach 50-60% confluency. One ml of the virus soup (1:1 dilution) and 8ug/ml of polybrene (Sigma) was added to cells and incubated for six hours. Cells were selected with puromycin (Sigma) (2µg/ml) selection for 2 days as further described earlier (Upadhyay et al, 2016b).
Growth Curve
Growth curve assay was performed on a 24 well plate format with a cell density of 20000cells/well. Cell growth was assessed post 48hr and 96hr by counting the cells using a hemocytometer and was recorded. Cell proliferation was calculated as percentage proliferation normalized to scrambled control. All the experiments were performed in triplicates.
MTT assay
1000 cells per well were seeded in 96 well plate followed by incubation with the drug for 72 hours and six replicate per concentration and subsequently incubated with MTT (0.5 mg/ml) for 4 hours and then MTT assay was performed and data was acquired at 570nm using Microplate reader. Percentage cell viability was calculated against vehicle treated.
Western blotting
Cells were lysed in RIPA buffer and protein concentration was estimated using BCA (MP Biomedical) method. 50 μg protein was separated on 10% SDS-PAGE gel, the transfer was verified using Ponceau S (Sigma), transferred to nitrocellulose membrane and blocked in Tris-buffered saline containing 5% BSA (Sigma) and 0.05% Tween-20(Sigma). The primary antibody against Total HER2 (sc-33684 Dilution 1:500), Total EGFR (1005) (sc-03 Dilution 1:500), Total ERK2(C-14) (sc-154 Dilution 1:500) and β-Actin(I-19)-R (sc-1616-R Dilution 1:3000) were obtained from Santa Cruz biotechnology. The primary antibodies Phospho-HER2 (Tyr1248) (AP0152 Dilution 1:500) from Abclonal and Phospho-p44/42 (T202/Y204) MAPK (#4370) Dilution 1:1000), Phospho-EGFR (Y1068) (#2234 Dilution 1:500) were obtained from Cell signaling technology respectively. Thiazolyl blue tetrazolium bromide (MTT, TC191) was obtained from Hi-Media.
Receptor tyrosine kinase proteome array
The relative amount of 49 tyrosine kinases were evaluated using Proteome Profiler Human Phospho-RTK array kit (ARY001B – Proteome Profiler, R&D systems) and the protocols were followed as per manufacturer’s recommendation. Briefly, cells were harvested, washed with 1X PBS and lysed after which 400µg of protein was mixed with a buffer and incubated with pre-blocked nitrocellulose membrane at 4°C. Subsequently, the membranes were probed using detection antibodies and probed using streptavidin-HRP, after which signals were developed using the chemi-reagents provided with the kit. The Pixel density of each spot in the array in duplicate was quantified using Image J macro-Protein array analyzer plug in. The average pixel density of the duplicate spots for each of the kinases was subtracted from the negative density and was plotted, as detailed earlier (Godbole et al, 2017).
Invasion assay
Invasion ability of the cells was assessed in Transwell system using cell culture inserts for 24 well plates with 8µm pores (BD Biosciences, NJ). The upper side of the cell culture insert was coated with Matrigel (BD Biosciences, San Jose, CA). GBC cells were seeded at a density of 2 * 104 on the upper side of the coated Matrigel in presence of serum free DMEM. Complete DMEM media with 10% FBS was added to the lower side of the insert and were incubated at 37°C in 5% CO2 incubator for 12-14hrs. Post incubation the non-migratory cells on the lower side of the cell culture insert were removed using a cotton swab. The transwell chambers were fixed and stained with 0.1% crystal violet. The invasion ability was estimated by counting the cells that have migrated to the lower side of the cell culture insert. Cells in visual field with a magnification of 20X were counted in each Transwell chamber in triplicates.
Wound healing assay
Confluent monolayers in 6 well plate are subjected to scratch with a sterile pipette tip. After this, cells are washed with 1X PBS to remove debris and subsequently incubated with media. Cell migration at the wound surface was measured during a period of 20h under an inverted microscope. The quantification of cell migration was done using Cell Profiler(Carpenter et al, 2006) wound healing pipeline for three independent wounds in 3 independent experiments.
Immunohistochemistry
Immuno-histochemical analysis was done using the standard protocol of Vectastatin Universal kit. Briefly, antigen retrieval was performed by incubating the slides in pre-heated citrate buffer (pH 6) using a pressure cooker for 10 minutes. The slides were allowed to cool at room temperature before rinsing with TBST (Tris-Buffered saline-Tween 20(1%). The endogenous peroxidase activity was blocked by incubating the slides in 3% hydrogen peroxide. The slides were blocked by horse serum for 1hour before incubating with the primary antibody (HER2 DAKO A0485, Phospho-p44/42 (T202/Y204) MAPK #4370, Total ERK2(C-14) sc-154) for overnight at 4°C in moist chamber. Post incubation the slides were rinsed with TBST and incubated with universal secondary antibody (Vectastatin). The chromogenic reaction was performed using 3’-3’-diaminobenzidine chromogen solution for 5 minutes which results in brown signal. The slides are rinsed in deionized water and counterstained with hemotoxylin. Finally, the slides are dehydrated and mounted with a mounting medium and cover slip.
Co-immunopreciptation assay
For immunoprecipitation, cells were harvested in NP-40 lysis buffer (50mM Tris pH7.4, 150mM NaCl, 0.5% NP-40, 1mM EDTA along with protease and phosphatase inhibitors), Protein lysate supernatant were combined with the anti-EGFR antibody and incubated overnight on a rotator at 4°C. Protein G-Sepharose beads (50µl) were added to the cell lysates the next day and were on a rotator at 4°C for 4 hours. The Protein G-Sepharose beads were isolated by centrifugation at 2000g for 2 minutes. Further, these beads were washed three times with NP-40 lysis buffer and heated for 10 minutes at 100 °C in loading buffer. Samples were run on SDS-PAGE and then probed by immunoblot for HER2.
In vivo study
Five to six week old female NOD-SCID mice were injected subcutaneously with 3*106 cells/ml in 100-200 µl PBS G415 (N=13), NOZ (N=10) and OCUG1(N=10). After injecting the cells, the size of the resulting tumors was determined every third day using calipers. Afatinib inhibitor was administered to the randomized group of mice by oral gavage at 15mg/kg body weight along with vehicle control (1% Tween 80) for a period of 15 days after the tumor volume has reached between 100-150 mm3. micro PET-CT scan was performed at the end of drug treatment. The tumor volume was calculated using the formula – (Width2 * Length) /2. After 15 days, the mice were euthanized with CO2. Tumor were excised and tissues were stored for molecular and histopathological analysis.
Statistical analysis
Prism software (GraphPad) was used to analyze proliferation and drug sensitivity of cells to inhibitors, and to determine the statistical significance of differences between the groups by applying an unpaired Student’s t test. P values < 0.05 were considered significant. The Kaplan-Meier estimation of patient survival and correlation analysis were assessed using R packages survival (http://cran.r-project.org/package=survival), and IBM SPSS v20.
Author contributions
P.I., and A.D. designed research. P.I., M.R., P.C., N.G., B.D., S.S., R.P., R.T., B. M., and B.S. performed research. S.G.B., V.C., A.C., M.R.R., K.P., S.D. and S.V.S. contributed reagents and samples. P.I., M.R., P.C. N.G., A.J., H.K., P. Chau., A.I., and A.D. analyzed data. P.I. and A.D. wrote the paper.
Conflict of Interest
The authors declare no potential conflict of interests
The Paper Explained
Problem
Are there somatic alterations that might serve as promising therapeutic targets in early-stage gallbladder tumors?
Results
Findings from this study implicate ERBB2 as an important therapeutic target in early stage gallbladder cancer. We also present the first evidence that the presence of KRAS (G12V), but not KRAS (G13D) mutation, may preclude gallbladder cancer patients to respond to anti-EGFR treatment.
Impact
This study could lead to the adoption of an approved clinical algorithm, commonly practiced to opt for anti-EGFR treatment in colorectal cancer, to treat gallbladder cancer patients.
Acknowledgements
All members of the Dutt laboratory for critically reviewing the manuscript. Priyanka Bagayatkar and Vaishakhi Trivedi for KRAS sequencing. Medgenome Labs Pvt. Ltd for whole exome sequencing services. We thank Dr. Harsha Gowda and Dr. Akhilesh Pandey, IOB Bangalore for sharing the gallbladder cancer cell lines; the BTIS facility, funded by the Department of Biotechnology (DBT), Govt. of India, at ACTREC; and, the in-house Genomics facility for Sanger Sequencing at ACTREC. A.D. is supported by an Intermediate Fellowship from the Wellcome Trust/DBT India Alliance (IA/I/11/2500278). P.I. is supported by a Senior Research Fellowship from ACTREC. The funders had no role in study design, data collection and analysis, decision to publish or preparation of the manuscript
Footnotes
↵* Equal contribution
References and Citations


