

Abstract
The loss of imprinting of MEST has been linked to certain types of cancer by promoter switching. However, MEST-mediated regulation of tumorigenicity and metastasis are yet to be understood. Herein, we reported that MEST is a key regulator of IL-6/JAK/STAT3/Twist-1 signal pathway-mediated tumor metastasis. Enhanced MEST expression is significantly associated with pathogenesis of breast cancer patients. Also, MEST induces metastatic potential of breast cancer through induction of the EMT-TFs-mediated EMT program. Moreover, MEST leads to Twist-1 induction by STAT3 activation and subsequently enables the induction of activation of the EMT program via the induction of STAT3 nuclear translocation. Furthermore, the c-terminal region of MEST was essential for STAT3 activation via the induction of JAK2/STAT3 complex formation. Finally, MEST significantly increases the breast cancer’s ability to metastasize from the mammary gland to the lung. These observations suggest that MEST is a promising target for intervention to prevent tumor metastasis.
Introduction
Mesoderm specific transcript (MEST) has been shown to maternally imprint on parthenogenetic embryos, and only the paternally inherited allele is preferentially expressed in the placenta of humans. Additionally, MEST expressed in extraembryonic tissues during development is paternally transmitted, and the offspring exhibits severe intrauterine growth retardation after a null allele, suggesting that MEST may play a role in development (Lefebvre et al, 1997; Mayer et al, 2000). Moreover, the MEST gene mapped to chromosome 7q32 and has homologous sequences on the short arm of human chromosomes 3 and 5 (Riesewijk et al, 1997). Furthermore, MEST is thought to encode a protein with homology to the alpha/beta-hydrolase superfamily, but the precise function has not been identified (Kosaki et al, 2000; Riesewijk et al, 1997).
Recently, several studies have described the frequent loss of imprinting of MEST, which has been linked to certain types of cancer. In choriocarcinoma, trophoblast tumors, breast cancer, lung adenocarcinomas, uterine leiomyoma, colon cancer, human adult blood lymphocytes, and lymphoblastoid cell lines, MEST is expressed from both the paternal allele and the maternal allele via promoter switching from isoform 1 to isoform 2 of MEST (Kosaki et al, 2000; Mayer et al, 2000; Moon et al, 2010; Nakanishi et al, 2004; Nishihara et al, 2000; Pedersen et al, 1999). Although MEST is expressed in many tumors by promoter switching, it is currently unclear how MEST regulates tumorigenicity and metastasis of the tumor. Moreover, the signaling mechanism that induces and maintains tumorigenicity and tumor metastasis by MEST has remained unclear.
In this report, we first identified a new network involved in tumor metastasis and EMT that regulates and coordinates MEST. We found that a high level of MEST expression is significantly correlated with pathogenesis in breast cancer patients and that MEST acts as a key regulator of tumor metastasis through IL-6/JAK/STAT3/Twist-1 signal pathway-mediated EMT induction and may regulate the maintenance of the CSC state.
Results
Elevated MEST expression in human breast tumors and cells
Although there have been previous studies showing that the loss of MEST imprinting is linked to certain types of cancer by promotor switching, the expression patterns of MEST have not been well characterized in human breast cancer tissues. To evaluate its potential involvement and role in breast cancer, we first examined human tumor specimens to determine whether MEST expression was associated with certain pathological phenotypes in clinical breast tumor samples. Strikingly, the level of expression of MEST determined by quantitative RT-PCR was significantly enhanced in 16 out of 17 tumor tissues of breast cancer patients (94%) compared to those in corresponding patient-matched normal tissue samples (Figure 1A). Based on these observations, we next examined MEST expression in a panel of established tumorigenic or metastatic mouse and human breast cancer cells. MEST was highly expressed in tumorigenic and metastatic human breast cancer cells compared to the level in human mammary epithelial cells (HMLE) and nontumorigenic MCF10A cells. Nine of the eleven metastatic breast cancer cells expressed MEST protein, whereas only two of the four non-metastatic breast cancer cells expressed MEST protein. Additionally, we found that MEST expression was up-regulated in 4T1 cells, the most aggressive of the three mouse mammary tumor cells and the only one capable of forming macroscopic lung metastases (Figures 1B and S1). These observations suggested that MEST is often induced during tumor progression. Next, MEST expression was evaluated by immunohistochemistry analysis in a series of 59 human tumor tissues of breast cancer patients, and a significant correlation was found between MEST expression and pathological phenotypes. Normal breast tissue samples exhibited low expression of MEST. However, elevated MEST expression was detected in the infiltrating ductal (IDC) and metastatic breast carcinoma samples (Figure 1C).

(A) The expression of the mRNA encoding MEST in 17 samples of individual human breast cancer patient relative to that of the healthy tissue, as determined by quantitative RT-PCR. The 18S mRNA level was used to normalize the variability in template loading. P < 0.05, t-test. (B) Western blot analysis of MEST expression in tumorigenic and metastatic human or mouse breast cancer cells. β-actin was used as a loading control. (C) Representative immunohistochemical images of MEST staining in normal human breast tissue, infiltrating duct carcinoma (IDC), and metastatic breast carcinoma (magnification: 200×). (D) Box-and-whisker (Tukey) plots are shown for the expression of MEST in 2,137 human breast cancer patients by subtypes of breast cancer. The MEST level was extracted from the METABRIC dataset and averaged for each tumor. P < 0.0001, ANOVA. (E) Box-and-whisker (Tukey) plots are shown for the expression of MEST on the grade of 2,137 human breast cancer patients. (F) Box-and-whisker (Tukey) plots are shown for the expression of MEST on the stage of 2,137 human breast cancer patients. P < 0.0001, ANOVA. (G) Box-and-whisker (Tukey) plots are shown for the expression of MEST on triple negative or other biomarkers from 2,137 human breast cancer patients. P < 0.0001, t-test. (H) Box-and-whisker (Tukey) plots are shown for the expression of MEST on ERα negative or ERα positive samples from 2,137 human breast cancer patients. The MEST level from Figure 1D, 1E, 1F, 1G, and 1H was extracted from the METABRIC dataset and averaged for each tumor. Points below and above the whiskers are drawn as individual dots. P < 0.05, t-test. (I) Kaplan-Meier survival plot of low and high MEST expression on the METABRIC data set. Patients were divided into high- and low-MEST expressers, and their survivals were compared. The P value was calculated by a log-rank test (P < 0.05).
To further examine the relationship between MEST expression and breast cancer progression, we investigated the clinical relevance using MEST publicly available gene expression microarray datasets of breast cancer patients from 2,137 breast cancer patients in the METABRIC dataset and 855 breast cancer patients from the UNC dataset (GSE26338) (Curtis et al, 2012; Harrell et al, 2012). Consistent with the above observations, MEST expression was significantly higher in all breast cancer subtypes compared to normal breast tissues and strongly correlated with breast cancer subtypes (Figures 1D and S2A). Specifically, the level of MEST expression was significantly higher in both basal-like and claudin-low breast cancer subtypes, and moreover, MEST expression was correlated with the grade and stage of breast cancer patients (Figures 1E, 1F, S2B, and 2C). Furthermore, MEST expression was significantly upregulated in triple-negative breast cancer (TNBC) relative to the luminal and HER2-positive markers in these independent datasets (Figures 1G and S2D), and in particular, MEST expression was strongly correlated with ER-α expression (Figures 1H and S1E). This finding is consistent with features of the basal-like and claudin-low breast cancer subtypes, which are known to be closely correlated with the subset of receptor-negative breast cancers.
In a recent discovery, basal-like and claudin-low breast cancer subtypes have been linked with resistance to chemotherapy, acquisition of stem cell characteristics, metastasis, and poor survival (Hennessy et al, 2009). For these reasons, we performed clinical prediction analyses on the breast tumors in the METABRIC dataset and UNC dataset. As a result, it seems that a high level of MEST expression could be a good predictor of poor clinical outcome. Those patients whose tumors exhibited high levels of MEST expression showed a significantly poorer survival outcome than those with tumors that exhibited low levels of MEST expression, which correlated with the metastatic free survival status in the UNC dataset (Figures 1I and S2F). Our observations indicated that MEST might play an important role in the metastatic dissemination of breast cancer.
MEST enhances tumorigenicity and metastatic potential of breast cancer
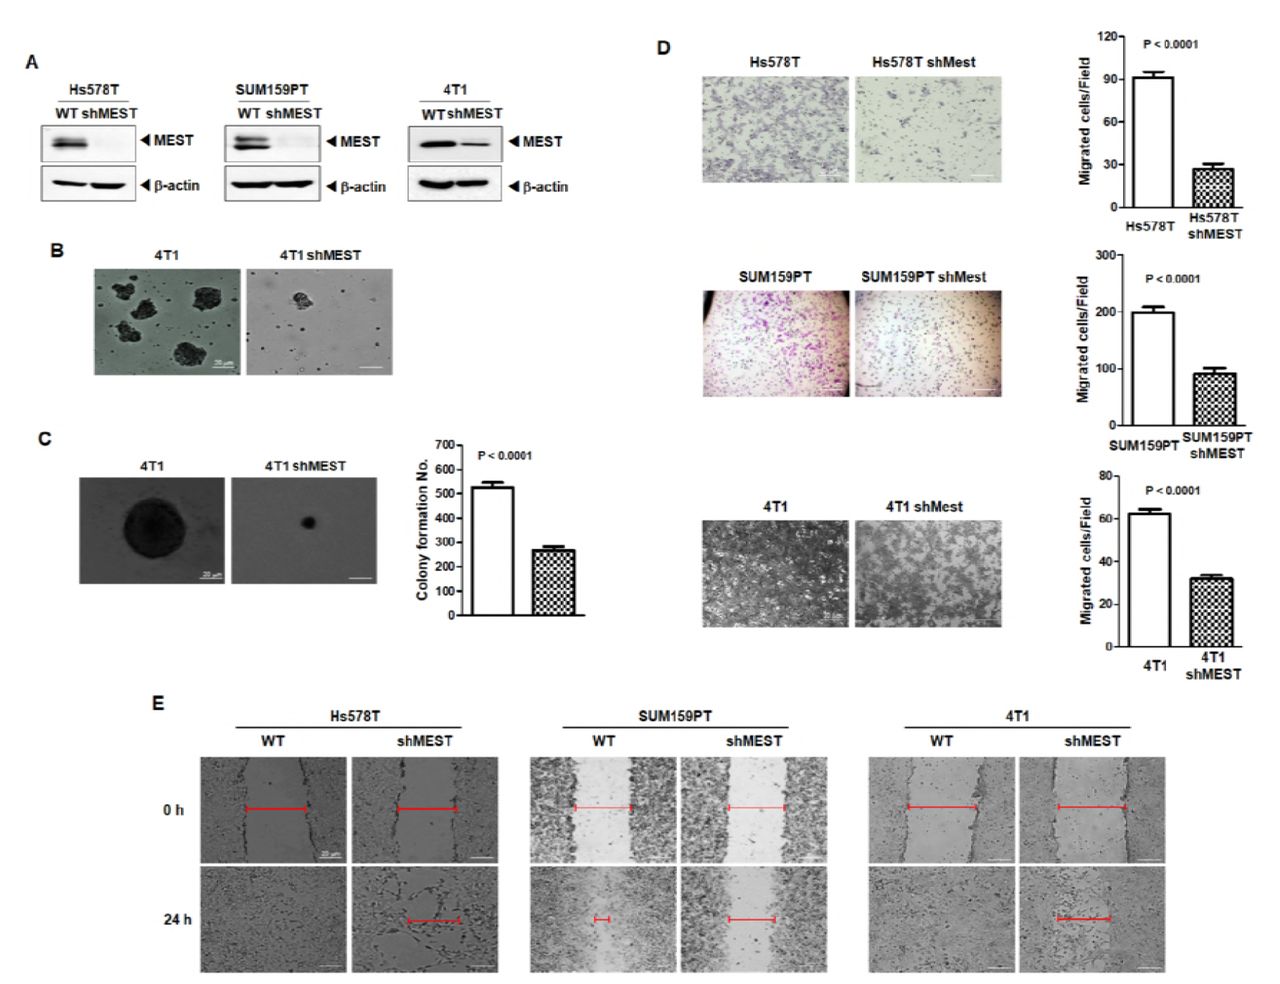
The invasion-metastasis cascade is driven by the acquisition of anchorage independence, gain of motility, invasion in and out of circulation, and colonization of distant organs (Fidler, 2003; Hanahan & Weinberg, 2011; Valastyan & Weinberg, 2011). Based on the above observation, we speculated that MEST might contribute to tumorigenicity and the metastasis process of breast cancer. To test this notion, we first selected highly metastatic Hs578T, SUM159PT, and 4T1 cells and engineered stably expressing MEST-shRNAs into the cell lines. As shown in Figure 2A, MEST-shRNA suppressed the expression of endogenous MEST by 80% (Figure 2A).

(A) Western blot analysis of MEST expression in Hs578T, SUM159PT, and 4T1 control-shRNA or MEST-shRNA cells. β-actin was used as a loading control. (B) Formation of spheroid colonies of 4T1 control-shRNA or MEST-shRNA cells. Spheroid colonies in suspension were then photographed at 200× magnification. (C) The soft agar colony-forming assay of the 4T1 control-shRNA or MEST-shRNA cells (n=3). P < 0.0001, t-test. (D) The migration assay of in Hs578T, SUM159PT, and 4T1 control-shRNA or MEST-shRNA cells (n=3). P < 0.0001, t-test. (E) Wound healing assay of Hs578T, SUM159PT, and 4T1 control-shRNA or MEST-shRNA cells. Wound closures were photographed at 0 and 24 hrs after wounding.
By an anoikis assay measuring the anchorage-independent survival (Jin et al, 2010), we examined the clonal formation abilities of 4T1 control-shRNA and 4T1 MEST-shRNA cells in suspension. To accomplish this, we used cell culture dishes to determine if 4T1 control-shRNA and 4T1 MEST-shRNA cells could not attach. Under these conditions, 4T1 control-shRNA cells proliferated as large spheroid aggregates in suspension, whereas 4T1 MEST-shRNA cells exhibited a significantly lower survival outcome in suspension (Figure 2B).
We next examined whether the loss of MEST affected the colony forming ability of 4T1 cells. 4T1 control-shRNA cells exhibited almost 2-fold higher colony-forming activity compared to the 4T1 MEST-shRNA cells (Figure 2C). To test for other functional hallmarks of metastatic potential and mesenchymal/CSC state, we conducted cell motility and wound healing assays. Hs578T, SUM159PT, 4T1 control-shRNA, and MCF10A-MEST overexpressing cells had significantly increased cell migration, whereas MEST-shRNA cells and MCF10A control cells inhibited the migration of breast cancer cells, indicating that the increased cell migration was correlated with the level of MEST expression (Figures 2D, 2E and S3). These findings suggest that MEST accelerates the secondary tumor forming ability to distant organ sites.
MEST regulates the invasion-metastasis cascade through induction of a Twist-mediated EMT program
Since the epithelial-mesenchymal transition (EMT) broadly regulates invasion and metastasis by acquiring cellular traits associated with high-grade malignancy (Hanahan & Weinberg, 2011; Valastyan & Weinberg, 2011), and induction of the EMT program has been strongly associated with the acquisition of self-renewal traits (Mani et al, 2008; Scheel et al, 2011), we speculated that the acquisition of tumorigenic and metastatic potential by MEST expression might depend on induction of the EMT program. To address the issue, we examined whether the expression of MEST regulates an EMT program in breast cancer cells. Specifically, compared to the level of expression in Hs578T, SUM159PT, and 4T1 control-shRNA cells, the cell lines expressing MEST-shRNA exhibited increased expression of E-cadherin protein and significant decreases in N-cadherin, fibronectin, and vimentin expression (Figure 3A). Moreover, quantitative RT-PCR analyses revealed that the expression of E-cadherin in Hs578T, SUM159PT, and 4T1 control-shRNA cells was strongly decreased, compared to the level of expression in Hs578T, SUM159PT, and 4T1 MEST-shRNA cells, while the expression levels of mRNAs encoding mesenchymal markers were markedly increased, which correlated with protein levels (Figure S4A).

(A) Western blot analysis of the expression of E-cadherin, N-cadherin, fibronectin, and vimentin proteins in Hs578T, SUM159PT, and 4T1 control-shRNA or MEST-shRNA cells. β-actin was used as a loading control. (B) Western blot (Left) and RT-PCR (Right) analysis of the expression of CAR, caludin3, occludin, E-cadherin, α-catenin, N-cadherin, fibronectin, and β-catenin proteins in MCF10A control or MCF10A-MEST cells. GAPDH and β-actin were used as a loading control. (C) Immunofluorescence images of E-cadherin and N-cadherin in Hs578T, SUM159PT, and 4T1 control-shRNA or MEST-shRNA cells. The red or green signal represents staining of the corresponding protein, while the blue signal represents DAPI staining. (D) Immunofluorescence images of V5, E-cadherin, β-catenin, fibronectin, α-catenin, and N-cadherin in MCF10A control or MCF10A-MEST cells. The red signal represents the staining of the corresponding protein, while the blue signal represents DAPI staining.
To further assess whether MCF10A-overexpressing MEST cells retain the gene expression profiles observed in highly metastatic breast cancer cells that passed through EMT, we examined the expression profile of multiple EMT-associated proteins. We found the expression levels of epithelial and mesenchymal markers in MCF10A-MEST cells were similar with those in Hs578T, SUM159PT, and 4T1 control-shRNA cells. Specifically, relative to levels in the MCF10A control cells, MCF10A-MEST cells exhibited a significant increase in the expression of E-cadherin, or α-catenin protein, and decreases in the expression of N-cadherin, fibronectin, β-catenin and vimentin proteins (Figure 3B). Moreover, RT-PCR and quantitative RT-PCR analyses revealed that the mRNA expression levels of the epithelial markers CAR, Claudin3, Occludin and E-cadherin (~50-fold) in MCF10A-MEST cells were strongly decreased, while the mRNA expression levels of mesenchymal markers were significantly increased, specifically N-cadherin (~330-fold), Vimentin (~10-fold), and Fibronectin (~116-fold) (Figures 3B and S4B).
We also performed immunostaining to further determine whether MEST expression induced the EMT program. The immunostaining intensity of epithelial or mesenchymal markers in Hs578T, SUM159PT, and 4T1 control-shRNA cells corresponded to the level of protein and mRNA expression in the cells (Figure 3C). Upon MEST knockdown, the expression of E-cadherin was greatly enhanced, while the expression of mesenchymal markers, such as N-cadherin, was significantly decreased, indicating that the depletion of MEST prevents the conversion of mesenchymal traits on epithelial cells. In addition, the immunostaining analysis revealed that the expression levels of E-cadherin and α-catenin in the MCF10A-MEST cells were significantly decreased, while N-cadherin, fibronectin, and β-catenin expression levels were markedly increased (Figure 3D), compared to the expression level in MCF10A control cells.
During the process of tumor metastasis, a set of pleiotropically acting transcription factors, including Goosecoid, Foxc1, Foxc2, Slug, SIP1, Twist-1, and Twist-2, orchestrate the EMT program and related migratory processes. Additionally, these pleiotropically acting transcription factors are expressed in various combinations in a number of malignant tumor types (Hanahan & Weinberg, 2011; Mani et al, 2008). These recent studies and the above observation led us to speculate that MEST might contribute to the induction of EMT via the upregulation of transcriptional regulators. To test this possibility, we examined the expression of a set of pleiotropically acting transcription factors. There was a considerable increase in the expression of EMT-inducing transcription factors, specifically Goosecoid, Foxc1, Foxc2, and Twist-1, in Hs578T, SUM159PT, and 4T1 control-shRNA cells but not Slug, SIP1, and Twist-2, compared to the expression in Hs578T, SUM159PT, and 4T1 MEST-shRNA cells (Figure 4A). The difference was also confirmed by quantitative RT-PCR. MCF10A-MEST cells overexpressed the EMT-inducing transcription factors, such as Foxc1 (16-fold), Foxc2 (50-fold), and Twist-1 (15-fold), but not Slug, SIP1, and Twist-2 (Figure S5A), compared to the MCF10A control cells. These data indicate that the overexpression of MEST upregulates the expression of multiple genes in EMT-induced cells and MEST may be a key mediator of twist gene trans-activation, resulting in the loss of epithelial characteristics and the gain of mesenchymal properties.

(A) The relative expression levels of mRNA encoding Goosecoid, Foxc-1, Foxc-2, Slug, SIP-1, Twist-1, and Twist-2 in Hs578T, SUM159PT, and 4T1 control-shRNA or MEST-shRNA cells, as determined by quantitative RT-PCR. 18S was used as a loading control. P < 0.05, t-test. (B) Immunofluorescence images of Twist-1 in Hs578T, SUM159PT, and 4T1 control-shRNA or MEST-shRNA cells. The green signal represents the staining of the corresponding protein, while the blue signal represents DAPI staining. (C) The relative expression levels of mRNA encoding Twist-1 in Hs578T, SUM159PT, and 4T1 control-shRNA or MEST-shRNA cells, as determined by quantitative RT-PCR. 18S was used as a loading control. P < 0.05, t-test. (D) Promoter activity of Twist-1 gene in Hs578T, SUM159PT, and 4T1 control-shRNA or MEST-shRNA cells were measured by the Luciferase reporter assay. Each bar represents the mean ± SEM of three experiments. P < 0.0001, t-test.
Because MEST more significantly regulates Twist-1 expression compared to other EMT-inducing transcription factors (Figure 4A), we initially focused on the upregulation of Twist-1 by MEST expression. Immunofluorescence studies confirmed that Twist in Hs578T, SUM159PT, 4T1 control-shRNA cells, and MCF10A-MEST cells was expressed primarily as a nuclear form of Twist (Figures 4B and S5B). The intensity of overlap between Twist immunofluorescence and DAPI significantly decreased in MEST knockdown cells and MCF10A control cells, compared to those in Hs578T, SUM159PT, 4T1 control-shRNA cells, and MCF10A-MEST cells. To test the possibility of the role of MEST in Twist regulation at the transcriptional level, a quantitative RT-PCR analysis and Twist promoter activity assay were carried out in the control and MEST knockdown cells. Accumulation of twist mRNA was diminished in MEST knockdown cells (Figure 4C) and a significant reduction of Twist promoter activity was also observed in MEST knockdown cells (Figure 4D). Collectively, these data imply that MEST is a positive mediator of twist gene trans-activation, resulting in the loss of epithelial characteristics and the gain of mesenchymal properties.
MEST upregulates Twist-1 expression through activation of STAT3
Although gene ontology (GO) analysis from the UniProtKB/Swiss-Prot database proposed that MEST localizes to the endoplasmic reticulum (ER), MEST has not been shown to localize to or be associated with organelles and specialized subcellular compartments. Since subcellular localization is important for functionality, we examined the subcellular localization of MEST. It was found that the majority of MEST protein was present in the membrane fraction, including the plasma/ER/Golgi/mitochondrial membranes, and a small fraction of MEST protein was found in the nucleus where the Twist protein was primarily located. It is worth noting that cytokeratin 18 expression is well-known as a luminal epithelial marker and was markedly increased in the SUM159PT-shMEST cells compared to the control-shRNA cells (Figures S6A and S6B). This result supports that MEST regulates the invasion-metastasis cascade through induction of the Twist-mediated EMT program. However, the distinction in the subcellular localization of MEST and Twist led us to hypothesize that MEST might play a role as a linker or scaffold protein having characteristics of both nuclear and cytoplasmic signaling molecules. Recently, Cheng et al. (Cheng et al, 2008) demonstrated that the active form of STAT3 was able to directly bind to the Twist promoter and promote its transcriptional activity. These observations led us to speculate that MEST might be involved in the regulation of STAT3 activation and that it was functionally linked to the regulation of Twist-1. To test the effect of MEST in STAT3 activation, we initially examined whether knockdown of MEST in the Hs578T, SUM159PT, and 4T1 cells affected both the total and active forms of STAT3 protein. We found that STAT3 activation, as well as Twist-1 expression, was markedly decreased in the Hs578T, SUM159PT, and 4T1-shMEST cells relative to its control-shRNA cells; however, STAT3 expression was not affected in the knockdown of MEST. Moreover, the levels of phosphorylated and total Jak2 were not altered upon MEST knockdown (Figure 5A). In addition, similar results were obtained with MCF10A-MEST cells. STAT3 phosphorylation and Twist-1 expression were significantly increased, but JAK2 phosphorylation, total JAK2, and STAT3 expression were not changed (Figure S6C).

(A) Western blot analysis of the expression of phospho-JAK2, JAK2, phospho-STAT3, STAT3, and Twist-1 proteins in Hs578T, SUM159PT, and 4T1 control-shRNA or MEST-shRNA cells. β-actin was used as a loading control. (B) Western blot analysis of the expression of phospho-JAK2, JAK2, phospho-STAT3, STAT3, and Twist-1 proteins in Hs578T, SUM159PT, and 4T1 control-shRNA or MEST-shRNA cells treated with or without 20 ng/ml IL-6. β-actin was used as a loading control. (C) Western blot analysis of the expression of phospho-STAT3 and STAT3 proteins in Hs578T, SUM159PT, and 4T1 control-shRNA or MEST-shRNA cells after nuclear fractionation. Lamin B1 was used as a nuclear loading control. (D) Immunofluorescence images of phospho-STAT3 and STAT3 in Hs578T, SUM159PT, and 4T1 control-shRNA or MEST-shRNA cells. The green signal represents the staining of the corresponding protein, while the blue signal represents DAPI staining.
Since Jak2 expression and activation were similar between control and MEST knockdown cells, we examined whether there was any difference in terms of ligand-induced Jak2-STAT3 activation between the control and MEST knockdown cells or the levels of Twist were affected by ligand-induced STAT3 activation in MEST knockdown cells. To test this notion, we assessed the expression level and activation of JAK2 of Hs578T, SUM159PT, and 4T1control-shRNA and MEST-shRNA cells with IL-6 activation. Interestingly, there was no difference in the expression or activation of JAK2 between the control and MEST knockdown cell and no difference in STAT3 expression after stimulation with or without IL-6. However, IL-6-induced STAT3 activation was markedly reduced in MEST knockdown cells, relative to the control shRNA cells, which was strongly correlated with the level of Twist-1 expression (Figure 5B).
Since activated STAT3 can translocate into the nucleus and act as a transcription factor, we consequently tested whether MEST could modulate IL-6-dependent subcellular localization of STAT3. In Hs578T, SUM159PT, and 4T1control-shRNA cells, we observed an increase in the nuclear translocation and nuclear expression of STAT3 and phospho-STAT3 with or without IL-6 treatment, compared to those in MEST-shRNA cells (Figures 5C and 5D). These results suggest that treatment of IL-6 could induce STAT3 phosphorylation in control cells; however, the loss of MEST seemed to have inhibitory effects on STAT3 phosphorylation after IL-6 treatment. Taken together, these observations indicate that MEST regulates expression of Twist, an EMT transcription factor, possibly mediated through JAK2 activation-independent STAT3 activation.
Although we did not find a decrease in total STAT3 levels in MEST knockdown cells, we sought to test the possibility of a regulatory role of MEST in STAT3 activation at the transcriptional level. The STAT3 mRNA expression and STAT3 promoter activity were not affected by IL-6 treatment in both the control and MEST knockdown cells (Figures S7A and S7B), indicating that MEST-mediated STAT3 activation is not transcriptionally regulated.
MEST induces STAT3 activation through MEST-STAT3 complex formation
To test the regulatory role of MEST in STAT3 activation, we attempted to determine whether MEST regulates STAT3 activation through MEST-STAT3 complex formation by investigating the complex formation of MEST and STAT3 endogenously. An interaction between these two proteins was readily detected. Reciprocal immunoprecipitation using STAT3 antibody confirmed the presence of the MEST-STAT3 complex at the endogenous level (Figure 6A). Moreover, MEST directly interacts with STAT3 under physiological conditions (Figure 6B). To identify the STAT3 functional domain responsible for its interaction with MEST, we used a series of deletion constructs of STAT3. A STAT3 mutant containing the N-terminal domain (NTD: protein interaction domain) interacted with MEST, whereas MEST did not interact with SH2 or the transactivation domain of STAT3 (Figures 6C and S8A). MEST protein is annotated as a putative multi-pass membrane protein by sequence prediction (Figure 6D). To identify the MEST functional regions responsible for its interaction with STAT3, we used a deletion construct of MESTΔC and full-length MEST. Full-length MEST interacts with STAT3, whereas MESTΔC with a C-terminal deletion after the 287th amino acid did not interact with STAT3 (Figure 6D).

(A) Identification of the complex formation of endogenous MEST/STAT3 in MBA-MB-231 and Hs578T cells. (B) Western blot analysis of the whole-cell lysates and immunoprecipitates derived from HEK293 cells transfected with the V5-MEST and Flag-STAT3 constructs, as indicated. (C) Identification of the STAT3 region that interacted with MEST. Western blot analysis of whole-cell lysates and immunoprecipitates derived from 293T cells transfected with V5-MEST, Flag-STAT3 wild and the STAT3 deletion construct (STAT3 mt) as indicated. (D) Western blot analysis of the whole-cell lysates and immunoprecipitates derived from 293T cells transfected with the V5-MEST, V5-MESTΔC, and Flag-STAT3 constructs, as indicated. (E) Western blot analysis of the expression of phospho-STAT3 and STAT3 proteins in Hs578T, SUM159PT, and 4T1 MEST-shRNA cells after transient transfection of MEST or MESTΔC constructs. β-actin was used as a loading control. (F) Western blot analysis of whole-cell lysates and immunoprecipitates derived from 293T cells after transfection of JAK2, STAT3, or MEST constructs. β-actin was used as a loading control. (G) Identification of the complex formation of endogenous JAK2/STAT3 in HS578T and Hs578T, SUM159PT cells or MEST-shRNA cells. (H) Western blot analysis of whole-cell lysates and immunoprecipitates derived from 293T cells after transfection of JAK2, STAT3, MEST or MESTΔC constructs. β-actin was used as a loading control.
Based on the above observation, we speculated that MESTΔC might contribute to activation of STAT3. To test this notion, we assessed STAT3 expression and STAT3 activation in MEST knockdown cells after transient transfection of MEST or MESTΔC. Compared to those in the MEST knockdown cells expressing the control or MESTΔC, the introduction of MEST to the MEST knockdown cells showed significantly increased activation and expression of STAT3 or Twist-1 (Figures 6E and S8B). These results indicated that the C-terminal region (amino acid 287-335) of MEST is essential for STAT3 activation.
Next, we attempted to determine whether MEST regulates JAK2/STAT3 complex formation through the interaction of MEST and STAT3. Interestingly, MEST induces JAK2/STAT3 complex formation (Figures 6F and 6G). To identify the MEST functional region responsible for the induction of JAK2/STAT3 complex formation, we tested JAK2/STAT3 complex formation by MEST and MESTΔC. JAK2/STAT3 complex formation by MESTΔC still remained, but the level of JAK2/STAT3 interaction was significantly decreased relative that of MEST (Figure 6H). These findings suggest that MEST is essential for the induction of JAK2/STAT3 complex formation.
MEST expression significantly increases metastasis in vivo
To determine whether MEST knockdown affected the ability of 4T1 cells to metastasize, 4T1 control-shRNA or MEST-shRNA cells were injected into the tail vein of BALB/c mice, and their lungs were examined for metastases 29 days after injection. The 4T1 MEST-shRNA cells strongly reduced the number of metastatic nodules relative to the 4T1 control-shRNA cells (Figure 7A). Additionally, a few metastatic nodules in the lungs of mice carrying MEST-shRNA cells retained MEST expression, but MEST expression in the lungs of mice with MEST-shRNA cells was greatly reduced relative to the lungs of mice carrying control-shRNA cells (Figures 7B and 7D). Moreover, histological analyses confirmed that the number of micrometastatic lesions was drastically reduced in the lungs of mice with 4T1 MEST-shRNA cells (Figure 7C).

(A) Lung metastasis by 4T1 control-shRNA or 4T1 MEST-shRNA cells. The total numbers of lung metastatic nodules from each mouse harboring 4T1 tumors expressing control-shRNA or MEST-shRNA were counted using a dissection scope (n = 6 mice/group). P < 0.05, ANOVA. (B) Representative images of the lungs from the mice harboring 4T1 control-shRNA or 4T1 MEST-shRNA cells for 30 days after implantation of mouse mammary fat pads of mice. (C) Representative H&E staining in the sections of the lungs from Figure 7B. N, Normal lung tissue; M, metastatic nodule. (D) Western blot analysis of MEST, phospho-STAT3, STAT3, and Twist-1 in tumor cells recovered from the lungs of individual mice expressing either 4T1 control-shRNA or 4T1 MEST-shRNA. β-actin was used as a loading control. (E) Quantitative RT-PCR of Twist-1 in tumor cells recovered from the lungs of individual mice expressing either 4T1 control-shRNA or 4T1 MEST-shRNA. 18S mRNA was used as a loading control. P < 0.001, t-test.
We speculated that the presence of small numbers of nodules in the lungs of mice carrying 4T1 MEST-shRNA cells was caused by incomplete knockdown of MEST. To test this notion, we examined the level of MEST expression in the lungs of mice carrying 4T1 control-shRNA or MEST-shRNA cells. MEST expression in the lungs of mice with 4T1 MEST-shRNA cells was significantly lower than that of the 4T1 control-shRNA cells. Moreover, STAT3 activation and Twist-1 expression was markedly reduced in the lungs of mice with 4T1 MEST-shRNA cells relative to that of 4T1 control-shRNA cells (Figure 7D). Furthermore, quantitative RT-PCR analysis of Twist-1 revealed reduced expression in the lungs of mice injected with 4T1 MEST-shRNA cells compared to their control counterparts (Figure 7E). These results indicated that expression of MEST is required for the full metastatic ability of highly metastatic 4T1 breast cancer cells.
Discussion
Although MEST expression has been identified in breast cancer by its promoter switching, it is unclear whether MEST is oncogenic and what is the function of MEST is in the tumorigenicity and metastasis of breast cancer. In this study, we found that MEST is frequently overexpressed in highly metastatic human and mouse breast cancer cells and clinical breast tumor samples relative to normal epithelial cells and tissue. Moreover, MEST expression was significantly associated with the subtypes, grade, stage, and triple-negative phenotype of breast cancer patients. Our observations are consistent with other previous studies, which showed that Slug, HOXB13, HER2/neu, TrkA, TrkC, Foxc2, and Goosecoid, which promote metastatic behaviors and poor prognosis in breast cancer, are already overexpressed in breast cancer patients and breast cancer cells before the appearance of the malignant tumor phenotype (Hartwell et al, 2006; Kim et al, 2013a; Kim et al, 2013b; Ma et al, 2003; Mani et al, 2007). In addition, our results suggest that MEST expression may correlate with the characteristics of metastatic breast cancer.
Metastatic breast cancer is an aggressive, chemoresistant tumor and forms a distinct subtype that is closely related to a receptor-negative breast cancer, such as basal and claudin-low cells characterized by increased motility, poor survival outcome, and the resistance of apoptosis (Hennessy et al, 2009). In our results, suppression of MEST in highly metastatic breast cancer cells results in increased anoikis and the loss of motility and invasion potential. These observations indicate that high MEST expression enables breast cancer to acquire cellular traits associated with high-grade malignancy.
Recent studies demonstrated that metastatic breast cancer is closely linked to the EMT program. Metastatic breast cancer has an enriched EMT core signature that is associated with invasion, migration, resistance to chemotherapy, as well as the acquisition of mesenchymal and cancer stem cell (CSC) traits. In response to the EMT program, EMT-inducing transcription factors are induced that orchestrate the EMT program (Hanahan & Weinberg, 2011; Mani et al, 2008; Scheel et al, 2011; Taube et al, 2010). In our present work, high MEST expression induces the EMT program. MEST expression significantly reduced the expression of epithelial markers (E-cadherin, α-catenin, CAR, claudin3, and occludin) and increased the expression of mesenchymal markers (N-cadherin, fibronectin, β-catenin and vimentin). Moreover, MEST expression increased the expression levels of EMT-inducing transcription factors, such as Goosecoid, Foxc1, Foxc2, and Twist-1, which correlates strongly with the poor survival of breast cancer. Our observations suggest that MEST expression is critical to EMT induction through EMT-inducing transcription factors and governs the conversion to a high degree of plasticity.
The IL-6/JAK2/STAT3 pathway induces mesenchymal/CSC traits via the induction of Twist-1, an EMT-inducing transcription factor, and resistance to chemotherapy (Creighton et al, 2009; Frank et al, 2010; Li et al, 2008; Liu & Wicha, 2010; Marotta et al, 2011; Rosen & Jordan, 2009). The molecular mechanisms of MEST-mediated IL-6/JAK2/STAT3 modulation in breast cancer are unclear, and none of the findings reported to date hinted at a link between MEST expression and IL-6/JAK2/STAT3 modulation. We found that upregulation of Twist-1 expression and the activation of the IL-6/JAK2/STAT3 pathway through MEST-STAT3 complex formation induced tumorigenicity and metastatic potential of breast cancer.
STAT3 activation by IL-6 leads to CSC self-renewal traits, induction of EMT, and cell transformation of a number of oncogenes (Buettner et al, 2002; Haura et al, 2005; Levy & Darnell, 2002). Additionally, Twist-1 is the master regulator of embryonic morphogenesis, playing a key role in metastasis, acquisition of CSC traits and the induction of EMT in breast cancer (Ansieau et al, 2008; Kwok et al, 2005; Ohuchida et al, 2007; Raval et al, 2005; Valsesia-Wittmann et al, 2004; Yang et al, 2004; Zhang et al, 2008; Zhang et al, 2007). Our studies further uncovered MEST function as a key regulator of Twist-1 expression via the activation of IL-6/JAK2/STAT3 signaling. In the presence of IL-6, the induction of STAT3 nuclear translocation by MEST promotes EMT through the increased expression of Twist-1.
In previous studies, MEST has been shown to possess a putative alpha/beta-hydrolase domain (Kosaki et al, 2000; Riesewijk et al, 1997). However, the function of MEST has not been adequately explored. Additionally, MEST protein may have a putative multi-pass membrane protein according to gene ontology (GO). In our hands, the MESTΔC deletion mutant containing amino acids 1 ~ 286 did not interact with STAT3 and lead to STAT3 deactivation. In addition, MEST regulates JAK2/STAT3 complex formation through the interaction of MEST and STAT3. Moreover, high MEST expression promotes the metastasis of breast cancer in vivo.
Overall, we first identified a new molecular and functional network present in cancer metastasis that regulates and coordinates MEST. These results suggest that MEST seems to represent a new potential target for improving the treatment efficacy of metastatic cancer and the development of novel anticancer therapeutics.
Methods
Cell Lines and Cell Culture
Mouse (67NR, 4T07, and 4T1) and human breast cancer cells (MCF10A, MCF7, T47D, BT474, ZR75B, MDA-MB435, MDA-MB-468, SK-BR-3, BT549, Hs578T, and MDA-MB-231) and 293T cells obtained from American Type Culture Collection (Manassas, VA, USA); SUM149PT and SUM159PTPT breast cells were obtained from Dr. Stephen Ethier (Kramanos Institute) and were maintained as described previously (Fillmore & Kuperwasser, 2008; Yang et al, 2004). HMLE were obtained from Dr. Robert A. Weinberg (Massachusetts Institute of Technology) and maintained as described previously (Scheel et al, 2011). Human IL-6 were purchased from PeproTech.
Human breast tumor samples
RNA from normal and tumorous human breast samples was obtained from the Gangnam Severance Hospital after approval (IRB approval number: 3-2011-0191) as previously described (Kim et al, 2015).
Plasmids and viral production
pLKO.1 lentiviral plasmids encoding shRNAs targeting the MEST gene were obtained from Sigma-Aldrich (SHCLNG-NM_002402 and SHCLNG-NM_008590). Hs578T, SUM 159, and 4T1 cells were selected for 15 days with 1 mg/ml puromycin after infection with lentivirus as previously described (Kim et al, 2015). The cDNA encoding human MEST was subcloned into pEF6/V5-His-TOPO and plenti6.3/V5-TOPO vectors, respectively (Invitrogen). The cDNA encoding MESTΔC was produced via amplification of residues 1-286 of MEST using primers (Table S1). STAT3 deletion constructs(Kwon et al, 2008) were provided by (Young-Yun, Kong, Korea Advanced Institute of Science and Technology, Taejon, Korea).
Antibodies, Western blotting, immunoprecipitation, and immunofluorescence
We performed Western blotting, immunoprecipitation, and immunofluorescence analysis as previously described (Jin et al, 2010). Antibodies were obtained from the following sources: Anti-MEST (SAB2501254) and anti-Flag (F3165) were from Sigma-Aldrich; anti-V5 (R960-CUS) was from Invitrogen; anti-JAK2 (ab108596), anti-Twist-1 (ab50887), anti-phosphoserine/threonine (ab17464), and anti-phosphotyrosine (ab10321) were from Abcam; anti-STAT3 (9139), anti-phospho-STAT3 (4113), and anti-phospho-JAK2 (3771) were from Cell Signaling Technology; and anti-E-cadherin (610405), anti-fibronectin (610078), anti-N-cadherin (610920), anti-alpha-catenin (610194), anti-vimentin (550513) and anti-beta-catenin (610154) were from BD Phamingen™.
Luciferase reporter assay
Cells that were 50% confluent in 12-well dishes were transfected using Lipofectamine 2000 (Invitrogen). A total of 0.5 μg STAT3 or Twist-1 reporter gene constructs and 0.5 μg of pCMV-β-gal were co-transfected per well. The cell extracts were prepared 48 hrs after transfection, and the luciferase activity was quantified using the Enhanced Luciferase Assay Kit (BD Biosciences). All experiments were performed in triplicate.
Soft agar assays, wound healing assays, anchorage-independent cell growth, RT-PCR, and Matrigel invasion assays
All the assays were performed as previously described (Jin et al, 2010; Kim et al, 2015). For anchorage-independent cell growth and soft agar assays, 1 × 10³ cells were seeded into 6 well cell culture plates. For the wound healing assay, 1 × 10⁶ cells were seeded into 6 well cell culture plates. For the invasion assay, 1 × 10⁴ cells were seeded into BD Matrigel invasion chambers with 8 μm pores (Corning, 62405-744). Additionally, the primer sequences used to amplify the genes are listed in the supplemental experimental procedures (Table S1).
RNA preparation and Quantitative RT-PCR
Total RNA was isolated using RNeasy Mini Kits (Qiagen) according to the manufacturer’s instructions and reverse transcribed with hexa-nucleotide mix (Roche). The resulting cDNA was subjected to PCR using the SYBR-Green Master PCR mix and the Taqman master PCR mix (Applied Biosystems) in triplicate. PCR and data collection were performed using the 7900HT Fast Real-Time PCR System (Applied Biosystems). All quantitations were normalized to the 18S RNA endogenous control. Specific Human MEST (Hs00853380_g1), Mouse MEST (Mm00485003_m1), mouse 18S (Mm04277571_S1), and human 18S (Hs99999901_s1) quantitative probes for Taqman RT-PCR were obtained from Applied Biosystems.
Animal studies
Animal studies were performed as previously described (Kim et al, 2015). For extravasation studies, 4T1 control-shRNA or MEST-shRNA cells (1 × 10⁶ cells) were injected into the tail vein of female BALB/c mice (7 weeks old, n = 7) and handled in compliance with protocols approved by the Institutional Animal Care and Use Committee (IACUC) of Gachon University (Approval No. LCDI-2010-0074). After 29 days, the lungs were excised, fixed in 10% formalin, paraffin embedded and sectioned for analysis.
Microarray data analysis
MEST expression signatures in 2,136 breast cancer patients of the METABRIC dataset (Curtis et al, 2012) and 855 breast cancer patients of the UNC dataset (GSE26338) (Harrell et al, 2012) were extracted and averaged, and then in silico analysis was performed. The boxplot graphs and Kaplan-Meier survival analysis were plotted with gene expression using GraphPad Prism v 5.0 (GraphPad Software, Inc.). P < 0.0001 was considered statistically significant.
Statistical analysis
Data are expressed as the means ± SEM. Statistical analyses of the data were conducted via the Student’s t test (two-tailed) and ANOVA. Differences were considered statistically significant at P < 0.05, P < 0.001, or P < 0.0001.
Author Contributions
M.S.K., S.K.K., and W.J. designed research; M.S.K., H.S.L, Y.J.K., and D.Y.L. performed research; M.S.K., S.K.K., and W.J. analyzed data; and S.K.K and W.J. wrote the main manuscript text.
Conflict of Interest
The authors declare no competing financial interests.
Acknowledgements
This work was supported by a National Research Foundation of Korea grant (NRF-2010-0002525, NRF-2012R1A2A2A01002728 to W. J. and 2015R1D1A1A01059406 to MS, K). This research was a part of the project entitled ‘Development of Biomedical materials based on marine proteins’, funded by the Ministry of Oceans and Fisheries, Korea.
References


