

Abstract
As the nervous system develops, changes take place across multiple levels of organization. Cellular and circuit properties often mature gradually, while emergent properties of network dynamics can change abruptly. Here, we use mathematical models, supported by experimental measurements, to investigate a sudden transition in the spontaneous activity of the rodent visual cortex from an oscillatory regime to a stable asynchronous state that prepares the developing system for vision. In particular, we explore the possible role played by data-constrained changes in the amplitude and timing of inhibition. To this end, we extend the standard Wilson and Cowan model to take into account the relative timescale and rate of the population response for inhibitory and excitatory neurons. We show that the progressive sharpening of inhibitory neuron population responses during development is crucial in determining network dynamics. In particular, we show that a gradual change in the ratio of excitatory to inhibitory response time-scales drives a bifurcation of the network activity regime, namely a sudden transition from high-amplitude oscillations to an active non-oscillatory state. Thus a gradual speed-up of the inhibitory transmission onset alone can account for the sudden and sharp modification of thalamocortical activities observed experimentally. Our results show that sudden functional changes in the neural network responses during development do not necessitate dramatic changes in the underlying cell and synaptic properties: rather slow developmental changes in cells electrophysiology and transmission can drive rapid switches in cortical dynamics associated to the onset of functional sensory responses.
Introduction
The maturation of thalamocortical activity patterns occurs through a number of transitions which reflect the progression of circuits through configurations specialized for developmental roles such as synaptic plasticity, amplification, and conservation of energy [1–5]. While the developmental trajectories of a large number of cellular, synaptic and circuit properties have been well described, how maturation of these cellular parameters leads to changes in the emergent collective activity patterns remains to be established. Of particular interest is an apparent disconnect between the microscopic circuit properties, which tend to gradually progress from immature to adult levels [6–8], and the macroscopic patterns of activity, whose transitions can be abrupt [9–12]. An important question in development is whether such sudden “switches” in network dynamics during development result from a dramatic change in the electrophysiological properties of cells, through a combinatorial effect of graded microscopic changes, or because of a non-linear relationship between macroscopic activity and a particular, deterministic synaptic or circuit element. Establishing the relationship between cellular/synaptic maturation and the emergence of new activity patterns is thus a critical component for improving our understanding of how neural circuitry is formed normally and becomes functional, but also to predicting how neurological disorders, which often incur subtle cellular and synaptic changes, can have outsize effects during the important developmental epochs when synapses and circuits are forming [13, 14].
Delineating how slow developmental changes at the microscopic scale relate to the fast, macroscopic transitions is a challenge for experimental approaches. Inhibiting even those processes deemed non-essential can have significant effects on the network dynamics, making it particularly challenging to disentangle the respective roles of the many developmental processes in the rapid functional transitions. This is where modelling and mathematical analysis becomes essential.
Here we apply an analytic approach to test the hypothesis that gradual maturation of inhibitory synaptic timescales can account for the most dramatic developmental transition in the spontaneous background activity in cortex: the rapid emergence of the bi-stable thalamocortical network activity [15]. In rat visual cortex, this ‘switch’ in thalamocortical network dynamics affects both spontaneous as well as light-evoked activity. It consists of a massive reduction in total excitability of the network as the systems shifts from a developmental-plasticity mode, into a linear sensory coding mode correlated with the emergence of the ability for the animal to cortically process visual stimuli, all in under 24 hours.
Day-by-day measurements in somatosensory and visual cortex reveal a number of synaptic and circuit changes that might contribute to this switch in cortical activity. These include a rapid increase in feedforward inhibition triggered in both cortex and thalamus [16–19], as well as more gradual increases in total inhibitory and excitatory synaptic amplitudes, increasing inhibitory effect due to reduction in the reversal potential for chloride [20, 21], changes in interneuron circuitry [22, 23], patterning of thalamic firing [17, 24, 25], reduction of action potential threshold [11], and changing glutamatergic receptor composition [26], among others.
Because of the critical role of inhibitory interneurons in determining the network properties of adult thalamocortical circuits, particularly the relevant network phenomena of oscillatory synchronization and bi-stability [27], we explored the hypothesis that the observed changes in inhibitory synaptic activity could be a likely determinant of rapid emergence of functional visual circuits. To develop a model in which the changing inhibitory and excitatory strength and delay (two critical observed evolutions) on network activity is amenable to analysis, we deploy a variation of the Wilson and Cowan (WC) model [28], in which the ratio of excitatory to inhibitory current amplitudes as well as relative timing can be varied independently to determine their combined potential roles in the evolution of cortical activity. In particular, we are interested in determining how the parameters of inhibitory strength and amplitude interact to produce bifurcations in the response properties of the system that might explain the sudden transition in cortical network dynamics before eye-opening.
The paper is organized as follows: first we review key experimental observations that serve as a foundation of our computational study, and that it must capture. We then introduce our extension of the WC firing-rate model, and identify key parameters that will serve in the analysis, notably, the ratio in the excitatory-to-inhibitory onset time-scales, the ratio of the excitation-to-inhibition strength and the amplitude of the external stimulus. This model being developed, we then carry out an extensive codimension-one and -two bifurcation analysis of the model, identify the critical changes in the dynamics of the system upon variation of the key parameters. By using these results we are able to identify a particular parameter evolution that accurately reproduces the transition in network activity that has been experimentally reported.
Our results strengthens the hypothesis that dramatic changes in the activity of neural networks during development do not require similarly sharp changes in the cells’ properties. It also suggests that, in the precise case of the rat’s visual cortex, a speed-up in the time-scale of the inhibitory neuronal response onset can account for multiple key observations on cortical activity throughout development, including the sudden switch from oscillatory to an active stable network behavior similar to that observed in vivo.
Results
In all species and systems examined, sensory thalamocortex development can be broadly divided into two periods, which we refer to as ‘early’ and ‘late’, that determine the spontaneous and evoked network dynamics [15, 29, 30]. The division between these epochs occurs before the onset of active sensory experience: birth for auditory, somatosensory and visual systems in humans, eye-opening in the rodent visual system, whisking in rat somatosensory cortex [9, 12, 31]. In rats, where the activity has been examined locally in primary sensory cortex with high developmental resolution, the switch between early and late periods is extremely rapid, and occurs in rat visual cortex within 12 hours [9, 18]. Early activity differs qualitatively from late by almost every characteristic of spontaneous and evoked activity. The most easily measured and dramatic difference is in sensory responsiveness. In somatosensory, visual and auditory cortex brief (< 100 ms) sensory stimulation evokes complex, large-amplitude responses consisting of multiple slow-waves that group higher-frequency oscillations lasting from 500ms - 2s [5]. This oscillatory bursting is the result of hyper-excitability in the thalamocortical loop, not the sense organ [17, 18, 32]. Spontaneous activity during the early period consists is composed of bursts of nested slow and fast oscillation that resemble sensory evoked activity. This resemblance occurs because at these ages spontaneous activity in thalamocortex is driven almost entirely by spontaneous bursts occurring in the sense organ. Unlike the adult, intact early thalamocortical circuits generate little spontaneous activity on their own. As a result, they are quiet until triggered by input to thalamus and spend much of their time in an extended silent state. Using the visual thalamocortex as our base, we model the thalamocortical dynamics observed during ‘spontaneous’ activity. In visual cortex and thalamus during the first two post-natal weeks, almost all activation occurs as a result of waves of spontaneous retinal activity that last between 1 and 10 seconds [13, 29, 33]. Extracellular recordings in rats and mice reveal that that these waves result in 6-20Hz thalamocortical oscillations that synchronize firing within cortex [9, 34, 35]. The period of oscillation decreases with age [36] (Fig. 1A). In vivo whole-cell recordings at these ages reveal that activation is unstable and the network does not produce an ‘active’ state, defined as a stable depolarized state, continuous during wakefulness, or alternating with down-states during sleep (Fig. 1). As a result the network is not bistable, as in the adult. The change to adult-like network dynamics occurs as a rapid switch between P11 and P12 [9, 16](Fig. 1). From this day whole cell currents show prominent bistability and stable depolarization during wakefulness. Extracellular recordings no longer reveal a prominent peak in spectral power during wakefulness, also indicating prominent asynchronous state [36, 37]. Measurements of sensory responsiveness indicate a shift from a non-linear ‘bursting’ regime to a graded, linear regime simultaneous with the switch from unstable/oscillatory to stable membrane currents [9]. Together these observations show a thalamocortical network that maintains basic parameters of non-linear dynamics, membrane potential instability and oscillation generation while evolving the period of oscillation. The maturation of these early dynamics to adult-like networks occurs as sudden transitions in the network dynamics leading to an adult-like linear processing regime, asynchronous network activity and stable depolarization during activation. As measured in somatosensory and visual cortex, the synaptic changes most closely associated with this developmental switch are an increase in the amplitude of synaptic inhibition and a decrease in its delay [16, 18].

A. Spectral analysis of local field potentials and whole-cell membrane dynamics reveals robust oscillatory behavior in early developing TC that increases in frequency but decreases in amplitude. Transition to an adult-like pattern of broad-band 1/f frequency noise occurs as fast “switch” between P11 and P12. Above and below color spectrogram are shown representative whole-cell currents at P7 (top) and P13 (bottom). The young cell has prominent 8Hz oscillations in membrane potential, while the older cell activity is dominated by stable depolarization referred to as an “up” or “active” state. Color graph in center shows representative spectrograms of layer 4 LFP for each of the indicated ages. Spectra are normalized to mean power and the 1/f noise is removed by subtraction. Thus the flat spectra P12-17 shows no frequencies with large violations of the 1/f noise that dominates neuronal activity, while the sharp peak at particular frequencies 5-25 Hz in younger animals indicates the dominance of spontaneous activity at these ages by oscillations previously referred to as “spindle-burst” activity. Data are novel analysis derived from animals first reported in [16, 33]. B-C. Whole-cell voltage clamp in vivo shows changes in inhibitory currents are strongly correlated with maturation of network dynamics. B. Representative neurons at two ages showing mean evoked inhibitory (GABA) and excitatory (Glutamate) currents. Inhibitory currents at young ages are smaller and delayed relative to excitatory currents. C. Development of evoked inhibitory delay (left) and amplitude (right) in visual cortex. Delay is measured as difference between excitatory and inhibitory current onset. Amplitude as ratio between the peak of each current. Data are reproduced from [16].
Such measurements of feed-foreward inhibition in cortex suggest that changes in the timing and strength of inhibition are important, but they reflect only a limited population of total inhibition, the limited measurements of which [16] suggest develops more gradually. We therefore take these limited measurements of inhibitory and excitatory synaptic currents as starting point to examine timing and power of inhibition during thalamocortical network development.
The mathematical model
In order to minimally account for the rapid ‘developmental switch’ in cortical dynamics we described above, we consider a reduced system with one excitatory and one inhibitory population. Undoubtedly, a complete realistic scenario would need to consider multiple neural subpopulations with different connectivity and synaptic time constants for all possible cells. However, this would preclude the realistic possibility to identify potential key mechanisms driving the switch or to carry out analysis of the model dynamics. In this study our goal is to use a simplified analytical model thought to capture many critical features of cortical network dynamics to test the hypothesis that the key changes in network activity, both abrupt and gradual, observed during development could be accounted for by gradual maturation of inhibitory synaptic currents.
We thus adapted a Wilson-Cowan (WC) model, which considers instantaneous synaptic responses to stimuli followed by an exponential decay (possibly after a delay), in order to allow us to study independently the effects of excitatory and inhibitory synaptic delay, rise times, as well as decay times. In order to better fit the shape of the evoked inhibitory and excitatory currents (Fig. 1B), the WC model was extended to in include double exponential kernels for the excitatory and the inhibitory synapses. Mathematically, the first order dynamical system of the standard WC became a second-order dynamical system for which responses to impulses are double-exponentials with a prescribed amplitude, rise and decay time. This simple modification of the standard WC model allows for the expression of rich dynamical behaviors comparable to the electrophysiological observations, and allows for full analysis of this dynamical system.
The model is introduced in detail in the next section, followed by a bifurcation analysis in codimension-one and -two revealing the respective roles of delay and amplitude in the qualitative responses of the network; a more extensive study is done in the Supplementary Material, where we study the bifurcations as various other parameters of the model vary. This dissection of the dynamics of the system allows us to propose an age-dependent variation of the key parameters consistent with the data of Fig. 1, robust to noisy perturbations, and that closely reproduces the qualitative properties of the visual cortex dynamics through the developmental switch.
Wilson-Cowan model with double exponential synapses
To model synaptic dynamics with non-zero rise (τ1) and decay (τ2) times1 of the responses to an impulse, we consider that each populations respond to inputs through second-order differential equations of the type:
 where x′ (resp. x′′) denotes the first (resp. second) derivative in time of x and f(t) the input to the system (see SI text for more detail). Following the standard approach introduced by Wilson and Cowan [28], we model (uE, uI) the proportions of cells that are firing at time t in the excitatory (E) and inhibitory (I) populations in response to external input and their interactions. Each population is assumed to satisfy an equation of type (1), with respective rise and decay times
  and
and  , yielding the system of differential equations:
 where the input to population E/I possibly induces an activation to the fraction of quiescent cells (1 − uE/I) with a maximal rate fE/I, and according to a sigmoidal transform SE/I of the total current received. The sigmoids associated to each population may have distinct thresholds θE/I and distinct slopes aE/I, but are assumed to have the same functional form: SE(·) = S(aE, θE, ·) and SI (·) = S(aI, θI, ·) with

The total input received by a population E/I is given by the sum of the external current IE/I and the input of other cells, proportional to the fraction of firing cells in both populations, and weighted by synaptic coefficients (Jij)(i,j)∈{E,I}, that depend both on the level of connectivity between populations (i, j) and on the average amplitude of the post-synaptic currents.
We now perform changes of timescales and parameters to reduce the system to a small set of independent parameter. First, we notice that our model involves 4 different time constants  . By a simple change of time, considering time for instance in units of
  , the system becomes equivalent to a reduced system depending on three dimensionless ratios:

The coefficients λE and λI determine mainly the slope of the decay of the double-exponential synaptic responses. The parameter κ instead can be interpreted as (proportional to) the ratio between the onset time of the inhibitory current with respect to the excitatory one. In fact, it can be shown (see Suppl. Mat.) that the peaks of the impulse responses of the excitatory and inhibitory synapses (the onset times) can be expressed as:
 with
with  . Equivalently, by reintroducing the standard time units, one has
  and
and  . Therefore, in the case λE = λI one obtains that indeed
  . In other words, under this condition κ gives the ratio of the relative onset-speed of the inhibition and the excitation. From the experimental data of Fig. 1, we see that the inhibition onset delay decreases (or speed increases) relative to the onset of the excitatory synaptic currents, hence we expect that the value of the parameter κ decreases during cortex development. Therefore we will focus our analysis on the role this relative E-I time-scale ratio plays during the development.
Moreover, the system depends upon two amplitude parameters fE and fI. To simplify further the model and keep only the most relevant parameters, we express the variables uE and uI in units of the total current received by the excitatory population in response to a Dirac impulse stimulation (the surface AE under the synaptic impulse response), leaving only the ratio between that quantity and the total current received by population I (the corresponding surface AI), as a free parameter, denoted α = AI/AE, and given, in terms of the original parameters of the model, by the expression (see the Supplementary Material):

In other words, for any choice of the time constants, we trade the ratio fI/fE with the more interpretable parameter α. Heuristically, when α < 1, the total current that would be received by the inhibitory population in response to a pulse of current is smaller than the total current received by the excitatory population in the same situation.
Therefore, without loss of generality, the original system of Eq. 2 reduces, in these units, to the system:
 where the derivatives are now taken with respect to the dimensionless time variable
  .
.
Developmentally-driven bifurcations in network dynamics
We are now in a position to investigate the impact of the electrophysiological modifications taking place during development on the network dynamics. To this purpose, we characterize the dynamics of Eq. 6, wit a particular focus on the presence of attractors (fixed points or periodic orbits) and their stability as a function of the value of the parameters altered throughout development. Stable attractors indeed determine the observable dynamics in our network. Bifurcations, associated in the number of attractors, their type and their stability may indeed underly the rapid switch in cortical activity and response seen experimentally. For simplicity and for the sake of considering a small amount of independent relevant parameters, we will assume in the following that inhibitory and excitatory input to be proportional: II = rIE. We then study the system dynamics in these regimes as the parameters κ, α and IE are varied as observed experimentally during the transition.
The key parameters we shall investigate are the following:
κ, which controls the onset delay of the inhibitory population relative to the excitatory population;
α, corresponding to the relative strength of inhibition as compared to the excitation, and
IE, accounting for the level of external input to the excitatory population, also controlling the input to the inhibitory cells under the current assumptions. This parameter and its impact on networks dynamics is less understood during this period of development, and we explore its impact here in our model.
Other parameters were set as in standard references [28]. In particular, we fixed
aE = 1.3, θE = 4, aI = 2 and θI = 3.7. The connectivities have been fixed to JEE = 16,
JII = −3, JEI = −JIE = 10. Here, we use the convention that II = rIE with r = 0.5 fixed and λE = λI = 0.8. In the Supplementary Information we show that other choices of r, λE, λI and J’s do not qualitatively affect the dynamics of the system in the (α, κ, IE) space.
Having set the fixed-parameter values as described in the previous paragraph, we can develop values for κ, α and IE that reproduce the network dynamics and synaptic currents observed at early and late stages (Fig. 2B-C).

(A) Two populations of neurons, one excitatory (blue) and one inhibitory (red) in interaction (coupling coefficients JEE, JEI, JIE, JII) and receiving external inputs, respectively IE and II. Insets display the typical double exponential responses to impulses for each population (arbitrary units), with identical peak amplitudes and respective onset delays τoE and τoI. (B) Numerical simulations of the model, with Gaussian noise stimulus, at P7 (top) and P13 (bottom). In these graphs is represented the proportion of active excitatory neurons as function of time: at P7, the network displays an oscillatory behavior at 8Hz; while at P13, the activity shows a noisy stationary behavior, both being comparable to the in vivo recordings (Fig. 1). (C) Excitatory (blue) and inhibitory (red) synaptic currents in response to a brief impulse, in arbitrary units, with the convention that the total excitatory transmitted current (area under the curve) is normalized to 1.
Codimension-one and -two bifurcation analyses
The second-order synapses endow the system with a rich dynamics, including multiple states qualitatively similar to those observed experimentally. This section elucidates this dependence in the parameters: we characterize here the behaviors of the system as a function of the parameters and identify those where transitions occur computing the bifurcations of the underlying vector field.
In Fig. 3, we start by investigating how the system we develop responds to changes in the external input parameter IE (panels L1 and L2), inhibitory timescale κ (L3-L4) and amplitude of the inhibitory currents α (L5-L6), in each case for two choices of the other parameters. We find that, consistent with the experimental observation, our system features:
Stationary states, where the E and I population activity levels depend on the value of the parameters. In particular they increase for larges levels of input IE, and smaller inhibition parametrized by α. These stationary states can be further differentiated as:
”Up states”, where both E and I populations show a relatively high constant level of activity, similar to patterns of brain activity in the awake adult.
”Down states”, where both E and I populations show a relatively low constant level of activity akin to the inactive periods during early development.
In Fig. 3 we distinguish between up and down states only when both solutions are present (irrespectively of their stability) for a given choice of the parameters (green and yellow regions in Fig. 3, panels L1, L2, L3). For clarity, when there is only one stable high-activity state is present, we call it a “unique up state” (white region in Fig. 3, panels L1, L2, L5 and L6).
Oscillatory states where the E/I populations are activated rhythmically (pink region in Fig 3), reproducing to the periods of activation during early development, and observed for intermediate values of input or inhibition amplitude (panels L1, L5 and L6) or slow inhibition (panel L4).

In all panels are depicted the value of the excitatory activity uE associated with equilibria and periodic orbits (in that case, maximal and minimal values are plotted) as a function of one given parameter. L1-L2 show the influence of IE for fixed α = 1 and κ = 3 (L1) or κ = 0.5 (L2). L3-L4 elucidate the influence of κ with α = 1 and IE = 0.75 (L3) or IE = 1.5 (L4). L5-L6 characterize the influence of α, with IE = 1.5 and κ = 4 (L5) or κ = 1.5 (L6). Regions are colored according to the type of stable solutions. We distinguish between up and down states when more than one solution is present for a given choice of the parameters, while we call it unique up state, when only one (stable) constant solution is present
Interestingly, these states need not be exclusive. Thus we characterize regions of their coexistence. Above we cited regions of the state-space where the up and the down states co-exist and are stable (green regions in Fig. 3, panels L2, L3). These are evocative of the behaviors observed in the adult brain during sleep or low visual input situations. In addition, we observe regions where down-states and oscillations co-exist and are are stable, in a small (orange) region in Fig. 3 panel L3.
Delineating the regions where these attractors are stable are codimension-one bifurcations, that are depicted as circles in Fig. 3. We found the following bifurcations:
Appearance or disappearance of stationary states are associated with saddle-node bifurcations (or Limit Points, LP, blue circles Fig. 3). We distinguish two types of saddle-node bifurcations: those yielding one stable and one saddle equilibria (circles filled in blue), versus those yielding two unstable equilibria (circles filled in white, associated with the emergence of one repelling and one saddle equilibria). Bifurcation labels: LP: Limit point, H: Hopf, SH: Saddle homoclinic, SNH: Saddle node homoclinic, LPC: Limit point of cycles. Solid (dashed) black lines represent stable (unstable) solutions for uE. Maximal and minimal uE along cycles are depicted in cyan (solid: stable, dashed: unstable limit cycles).
Emergence of oscillatory behaviors is related to the presence of Hopf bifurcations (green circles labeled H in Fig. 3. Locally, Hopf bifurcations give rise to periodic orbits that are either stable or not and we have identified each case (we speak, respectively, of super- or sub-critical Hopf bifurcations, and depicted those with green- or white-filled circles).
The periodic orbits also undergo bifurcations that affect network behavior: they may disappear through homoclinic bifurcations (red points, labeled SNH when corresponding to Saddle-Node Homoclinic, of SH when corresponding to Saddle-Homoclinic) at which point of branch of periodic orbit collides with a branch of fixed points (either a saddle-node point or a saddle equilibrium), and subsequently disappears. We also observed the presence of folds of limit cycles (or limit points of cycles, LPC, in magenta), particularly important in the presence of sub-critical Hopf bifurcations since they result in the presence of stable, large amplitude cycle.
In addition to these observations, Fig. 3 highlights the fact that the location and the mere presence of the above-described bifurcations may fluctuate as a function of the other parameters. We elucidate these dependences in Fig. 4 by computing the codimension-two bifurcation diagrams of the system as inhibitory timescale and external current (κ and IE, panel A) or inhibitory timescale and inhibitory currents amplitude (κ and α, panel B) are varied together. In these codimension-two diagrams, because of the structural stability of bifurcations, the codimension-one bifurcation points found yield curves in the two-parameter plane, with singularities at isolated codimension-two bifurcation points. Codimension-one diagrams depicted in Fig. 3 correspond to sections of codimension-two diagrams, and we indicated the location of these sections in Fig. 4. In both panels, we observe the presence of two such points:

(A) elucidates the transitions as a function of input and inhibitory timescales (IE, κ) for fixed α = 1; (B) characterizes the transitions occurring as amplitude and timescale of inhibition (α, κ) are varied, for fixed IE = 1.5. Color-code and notations as in Fig. 3. Codimension-two bifurcations: BT: Bogdanov-Takens, GH: Generalized Hopf (Bautin). Solid and dotted blue (resp. green) lines represents respectively stable or unstable limit points (resp. Hopf bifurcations). Sections corresponding to the different panels of Fig. 3 are depicted with dotted black lines.
A Bogdanov-Takens bifurcation (black circle labeled BT Fig. 4(A)). At this point, the Hopf bifurcation meets tangentially the saddle-node bifurcation curve and disappears, explaining in particular the transition between panels L1 (no Hopf bifurcation, on one side of the BT bifurcation) and L2 (on the other side of the BT bifurcation). The universal unfolding of the Bogdanov-Takens bifurcation is associated with the presence of a saddle-homoclinic bifurcation, SH curve, along which the periodic orbit disappears colliding with a saddle fixed point. We have computed numerically this curve (depicted in red in Fig. 4), and found that this curve collides with the saddle-node bifurcation associated with the emergence of down-states, at which point it turns into a saddle-node homoclinic bifurcation (namely, instead of colliding with a saddle fixed point, the family of periodic orbits now collides with a saddle-node bifurcation point). From the point of view of the observed behaviors, this transition has no visible impact. This curve accounts for the presence of SNH and SH points in Fig. 3, panels L1 and L3.
Bautin bifurcation points (Generalized Hopf, black circle labeled GH, 1 point in panel A, 2 in B), where the Hopf bifurcation switches from super- to sub-critical, underpinning the variety of types of Hopf bifurcations observed in Fig. 3, particularly between panels L5 and L6. The universal unfolding of the Bautin bifurcation is associated with the presence of a fold of limit cycles (or Limit Point of Cycles, LPC, depicted in magenta), that was already identified in panels L1 and L5 and which appear clearly, in Fig. 4, to be those sections intersecting the LPC lines.
Model validation and interpretations
Experiments showed that up- and down-states, as well as large amplitude oscillations, arise at distinct phases of development corresponding to distinct input levels and synaptic current profiles. Our model indeed displays dynamics that are compatible with those observed experimentally, depending on the values of the external input as well as the relative onset delays and amplitudes of the recurrent inhibitory and excitatory currents.
In particular, at early developmental stages (P5-P10), inhibitory currents show a larger onset delay than the excitatory currents, which in terms of the model parameters correspond to large values of κ. In this case, the model displays a oscillating activity switching regularly between periods of high and low firing rates for intermediate values of thalamic or cortical input IE. For relatively low or high inputs, the system stabilizes to either the down- or the up-state respectively, consistent with panel L1 of Fig. 3. This typical profile is clearly set apart from dynamics associated with parameters corresponding to later developmental stages. At these later stages, synaptic integration matures and becomes faster, while the ratio between the inhibitory and excitatory timescales decreases. In our notation, this corresponds to smaller values of the parameter κ. In Fig. 3(L2) we show such a case, where the system has transitioned to a completely distinct regime, where depending on the external input the up and/or the down state are the only stable solutions, and an intermediate oscillatory regime is absent.
The model further allows to us to follow the evolution in the dynamics as we modulate the inhibitory current onset delay, or in other words, continuously change the parameter κ, as shown in Fig. 3(L3-L4) for a choice of low and high value of excitatory input IE respectively. These codimension-one diagrams in fact, clearly show the importance of of κ in determining the dynamical state. For IE smaller than the value associated with the saddle-node bifurcation, the dynamics display bistability between up-states and down states. Increasing κ induces an oscillatory instability of the up-state (through the super-critical Hopf bifurcation). This leads to a relatively narrow bistable regime between oscillations around the up-state and a down-state. The up-state oscillations soon disappear through a saddle-homoclinic bifurcation, so that for relatively large values of κ, the down-state as the unique stable attractor for low IE. In contrast, for IE larger that the value associated with the saddle-node bifurcation, the system displays a unique equilibrium, associated with up-states, for low values of κ. This state loses stability through a super-critical Hopf bifurcation (for IE smaller than the value associated to the codimension-two Bautin bifurcation observed in Fig. 4(A), sub-critical otherwise). Hence the system shows periodic dynamics between up- and down-states for larger values of κ e.g. for slower inhibition onset. In other words, as the inhibition onset speeds up, the network dynamics pass through bifurcations that bring it from an oscillatory regime with relatively low oscillation frequencies and large amplitudes to a regime with a stable active constant activity state, that we can interpret as an up-state. Indeed, as we can see in the codimension-two bifurcation diagrams Fig 4(A), for any given value of the external input IE, there exists a critical value κc(IE) at which the system undergoes a bifurcation towards either a unique up-state regime (white region) or a bistable regime (green region). A similar transition is observed experimentally around P11-P12, characterized by a swtich from an oscillatory to a prominent up-state of activity. For κ < κc(IE), the bifurcation diagrams Fig. 4(A) and and Fig. 3(L2) show indeed that the system tends to settle into the active stationary state regime, except for small values of the thalamic or cortical input IE for which this up-state may co-exist with a down-state. Interestingly, we notice that the value of the input IE associated with the saddle-node bifurcation (blue line in Fig.4) is independent of κ, indicating that the emergence of the down-state arises at levels of thalamic or cortical input that are independent of the inhibitory/excitatory currents onset delay ratio. In other words, the down-state may be observed at any stage of inhibitory maturation given that the feedforward input is sufficiently low.
Moreover, we observed in the experimental data of Fig. 1 that the relative amplitudes of the inhibitory synaptic inputs with respect to the excitatory ones (parametrized by α in the model) increase during development. In the model, we observed (Fig. 4(B)) that, for input levels associated with oscillations at α = 1, the curve of Hopf bifurcations in the (α, κ) plane is convex, so that increasing or decreasing the relative amplitude of inhibitory currents α, or simply decreasing the relative inhibitory onset delay κ beyond a critical value, yields a switch to non-oscillatory regimes similar to the adult network responses. We note that, although the interval of values of α associated with oscillatory behaviors shrinks as κ decreases (as clearly visible in Fig. 3 (L5, L6)), the choice of α = 1 to compute Fig. 4(A) is generic, as any value between about 1 and 7 would have given qualitatively identical results.
We further note that for κ large, the Hopf bifurcations are sub-critical. While this does not affect the presence of periodic orbits (because of the limit points of cycles evidenced), it will affect the finer structure of how the network transitions to oscillations. In that regime, contrasting with the progressive disappearance of oscillations typical of super-critical Hopf bifurcations, we would observe that large-amplitude oscillations disappear suddenly as they reach the limit point of cycles. Moreover, near this region, we may have a coexistence between the stable oscillations and stable (up- or down-) constant states, which, in the presence of noise, may generate inverse stochastic resonance.
Developmental parametric trajectories and switch
The presence of the bifurcations described in the previous sections shows that, in a physiological situation where network parameters show a gradual and smooth variation, sudden and dramatic changes in the network dynamics (a switch) may arise. In particular, consistent with the experimental evidence, as soon as the global input increases, or inhibitory onset delay decreases, or inhibitory current amplitude increases beyond some critical levels, an oscillatory network will suddenly switch to an constant activity state. In this section, we delineate more precisely the possible parameters trajectories that, in addition to this qualitative consistency, shows a quantitative agreement with the observed changes in oscillation frequency at the switch. More precisely, we investigate if our minimal model can, in addition, reproduce the increase in oscillatory frequency observed experimentally in Fig. 1(A) approaching the switch.
A robust measurement of this acceleration was obtained by deriving the power-spectrum of the recorded activity. To directly compare model dynamics to the experimental measurements, we compute the fast Fourier transform of the solutions to Eq. 6 within the range of parameters covered by the above bifurcation analysis, and report in Fig. 5 the two relevant quantities associated: peak frequency and amplitude. In these diagrams, the region of oscillations, delineated in Fig. 4 by the Hopf bifurcation and limit points of cycles, clearly stands out. Furthermore, we observe that a significant and monotonic increase in the oscillation frequency occurs in the vicinity of the supercritical Hopf bifurcation. In the parameter planes (κ, IE) and (κ, α), the portion of the Hopf bifurcation line associated with this acceleration of the oscillation frequency forms a smooth curve relatively flat in κ, suggesting that the onset delay between the inhibitory and the excitatory current responses is crucial for the phenomenology observed experimentally throughout the developmental switch period.

Panels A and B refer to (IE, κ) phase space with α = 1, while panels C and D to (α, κ) phase space with IE = 1.5. In panels A and C the frequency is expressed in Hz, after fixing  (thus, the excitatory onset delay has the reasonable value of τoE ~ 4.5 ms), while in panels B and D the amplitude values correspond to the difference between the maximum and the minimum of the oscillation in the excitatory population activity.
In detail, while changes in IE or α could also underpin a sudden switch between an oscillatory state and an constant activity state, the telltale frequency acceleration near the transition specifically points towards a decrease of the relative inhibitory current onset delay κ. Moreover, since in the phase space, the oscillation frequency increase (just before the switch) happens only near the Hopf bifurcation line, our model predicts that the corresponding oscillatory amplitude should progressively decrease, and not suddenly drop as it would be the case if the switch occurred at crossing the fold of limit cycles or the homoclinic bifurcation.

Top: a realistic variation of inhibitory onset delay κ and amplitude α relative to the excitatory ones throughout the developmental switch period. Bottom: Spectrogram of the solutions of Eq. 6 with IE = 1.5 and  , computed as the fast-Fourier transform of the excitatory activity uE; same calculation and representation as used in the experimental data of Fig. 1(A).
Following our analysis we can now propose a specific developmental variation of the parameters that reproduces accurately changes in both the macroscopic dynamics and the spectrogram seen in the experiments (see Fig.1C). In order to follow the observed data, we constrained qualitatively the inhibitory timescale to decrease and the synaptic amplitude to increase with the developmental stage as seen in data. We fixed the excitatory time constant to a realistic value of  . We proposed the age-dependent parametric trajectories depicted in Fig. 6 (top), and obtained an accurate match with the experimental data: a sudden switch, at age P12, between an oscillatory states and a quasi-constant activity, together with a clear increase in oscillations frequency at approaching the switch. Strikingly, the simple phenomenological model we developed to account for the qualitative biological observations not only reproduces global observations but also shows a very good quantitative agreement with the experimental observations. Actually, we observed that the range of frequencies obtained in numerical simulations of the model naturally matches quantitatively the experimental data, arguing that these observed behaviors are robust and do not depend sensitively on the fine parameters of the system. In particular, we note that
 varies during development. Then, since oscillation frequencies in our model are inversely proportional to
  , the frequencies may change accordingly, but the qualitative picture obtained will persist. We note that such a detailed study would require more experimental data than available at this date and we consider it to be an interesting avenue for future research.
Robustness to noise
The above results were obtained in a deterministic system, which allowed us to use bifurcation theory to show sudden transitions in the network responses as a function of the excitation/inhibition time-scale ratio and input level. However, in physiological situations, neural populations show highly fluctuating activity due to multiple sources of noise (e.g. channel noise or synaptic noise resulting from the intense bombardment of neurons from other brain areas) [38]. The role of noise in dynamical systems has been the topic of intense study [39, 40]. In general, large amounts of noise generally overwhelm the dynamics, while small noise produces weak perturbations of the deterministic trajectories away from instabilities. In the vicinity of bifurcations, even small amounts of noise may significantly modify the deterministic dynamics [39, 41, 42]. Because of the importance of bifurcations in the switch, we investigate in this section the role of noise on the dynamics of Eq. 6. We assume that the various sources of noise result in random fluctuations of the current received by each population around their average value IE0 and II0 = rIE0, and model the current received by each population by the Ornstein Uhlenbeck processes:
 where
where  and
and  are standard Wiener processes and η is a non-negative parameter quantifying the level of noise (we consider that η is dimensionless, by associating the corresponding units on the Wiener process). We computed the solutions of the system and derived the statistics of the solutions for various level of noise. The average amplitude of the variations in time of the solutions as a function of the excitatory input IE0 and excitation/inhibition timescale ratio κ is depicted in Figure 7 for various values of η and fixed r = 0.5. Away from the bifurcation lines, the impact of moderate noise is reasonably negligible, and the noisy system behaves as its deterministic counterpart, as we can see in Fig. 2B, where at P7 (before the switch) the oscillating regime displays minor perturbations from the deterministic (η = 0.3, κ = 3, α = 1.3, IE = 1.5), and similarly the stationary up-state at P13 (after the switch) is only perturbed (η = 0.3 κ = 2, α = 1, IE = 1.5). Near transitions, we observe two effects that have a moderate, yet visible effect, on the precise parameters associated to a switch. In particular, we observe that all transition lines tend to be shifted by the presence of noise, enlarging the parameter region associated with oscillations. This effect is likely due to stochastic resonance effects in the vicinity of heteroclinic cycles or folds of limit cycles, while in the vicinity of the supercritical Hopf bifurcation, coherence resonance effects due to the interaction of noise with the complex eigenvalues of that equilibrium (see [39]).
We thus conclude that despite a slight quantitative shift of the parameter values associated with the switch, the qualitative behavior of the noisy system remains fully consistent with the experimental observations. Indeed, a decrease in the timescale ratio κ, possibly associated with an increase in the input, yields a transition from oscillating solutions to a stationary activity level associated with linear responses to input, which ensures that the proposed mechanism underlying the switch is robust in the presence of noise.

We consider the effects of Gaussian noise on the statistics of Fig. 5, namely the difference between the maximum and the minimum values of the excitatory activity uE, in the (IE0, κ) phase space. The codimension 1 and 2 bifurcations of the noiseless case are indicated, following the same notation as in the Fig. 4.
Discussion
During thalamocortical development, several aspects of network activity undergo dramatic changes at all scales, from microscopic to macroscopic, during spontaneous activity as well as in response to external stimuli. In this paper we studied the possibility that some of these changes happen in a continuous smooth way at the level of single neurons while giving rise to abrupt transitions in the global network dynamics. In particular, we focused on one specific phenomenon, the sharp switch occurring in the rodent visual cortex spontaneous activity, which goes from a regime with 5-20 Hz oscillations, called ‘spindle-burst’ or ‘delta-brush’ oscillations, in response to network input in the immature brain (P5 - P11 in rats) to an asynchronous irregular firing after maturation (after P12). In order to catch the crucial mechanism inducing such a transition, we developed a new version of the standard Wilson-Cowan model for excitatory and inhibitory populations activities, enriched with double-exponential synapses, allowing us to introduce new features of the developing neurons related to the relative time-scales of their responses to stimuli. These timescales indeed appear particularly prominent, as inhibitory and excitatory cells display a significant gradual maturation of the profile of the synaptic responses to current pulses throughout the switch.
The Wilson-Cowan approach has been extensively studied in the case of mature cortical network, and one of its major advantages is its simplicity yet ability to accurately reproduce observed behaviors. Indeed, only few biologically-related parameters define the model, a massive simplification compared with more biologically accurate models, and if, on one hand, this obscures a direct relationship with experimental measurements, it provides a direct understanding of the main rate-based mechanisms underlying the global dynamics of the system. In [43] for example, another version of the Wilson-Cowan model, enhanced by short-term plasticity, has been used to address another aspects of the development, namely the emergence of sparse coding. In this work, we have shown that the decay of the inhibitory currents timescale compared to excitation explains the main features of the developmental switch observed experimentally. Mathematically, when the ratio between the two onset delays decreases, the dynamics of the system crosses a Hopf bifurcation arising where excitatory and inhibitory delays are of the same order of magnitude. Moreover, the model constrains directly the possible changes in electrophysiolocal parameters consistent with the experimental observations. In particular, we showed that the acceleration of the oscillatory pattern and decay of their amplitude occurring experimentally before the switch predicts specific changes in timescale ratios and amplitudes, namely a decay of timescale ratio of inhibitory vs excitatory currents and an increase in the relative inhibitory current amplitude compared to excitation, two key phenomena observed during developments. Other variations of the electrophysiological parameters may lead to a switch or not, and in the case of the presence of a switch, would yield distinct hallmarks.
To exhibit this result, we provided an extensive numerical analysis of the codimension-one and -two bifurcations occurring as a function of the onset delay of inhibition in combination with the other natural parameters (particularly, the ratio of the excitatory and inhibitory synaptic currents amplitudes and the external input), and found indeed that the smooth variations in the synaptic integrations and levels of input naturally led, from an initial synchronous state, to a constant activity regime. Moreover, to recover the typical acceleration of the oscillations near the switch, we suggested that the key parameter in the switch is the decay of the amplitude ratio, and predicted a decay of the oscillation amplitude at the switch associated.
Because of the natural biological fluctuations of the parameters, it is a complex task to assess whether changes in the electrophysiological parameters are sudden or continuous. We argue that our mathematical model and analysis is valid in both cases: indeed, had our system not displayed a bifurcation upon changes in the timescale ratios, even a sharp variation of the delay ratios would not have yielded a change in the qualitative dynamics of the system.
From the biological viewpoint, this result suggests that the transition is intrinsically related to the fact that the inhibitory timescale decays by a larger fraction than the excitatory one. Indeed, a decay of the timescale ratio indicates that, if we denote  and
and  the synaptic timescales of the E/I populations before and after the switch, decreasing ratios readily imply

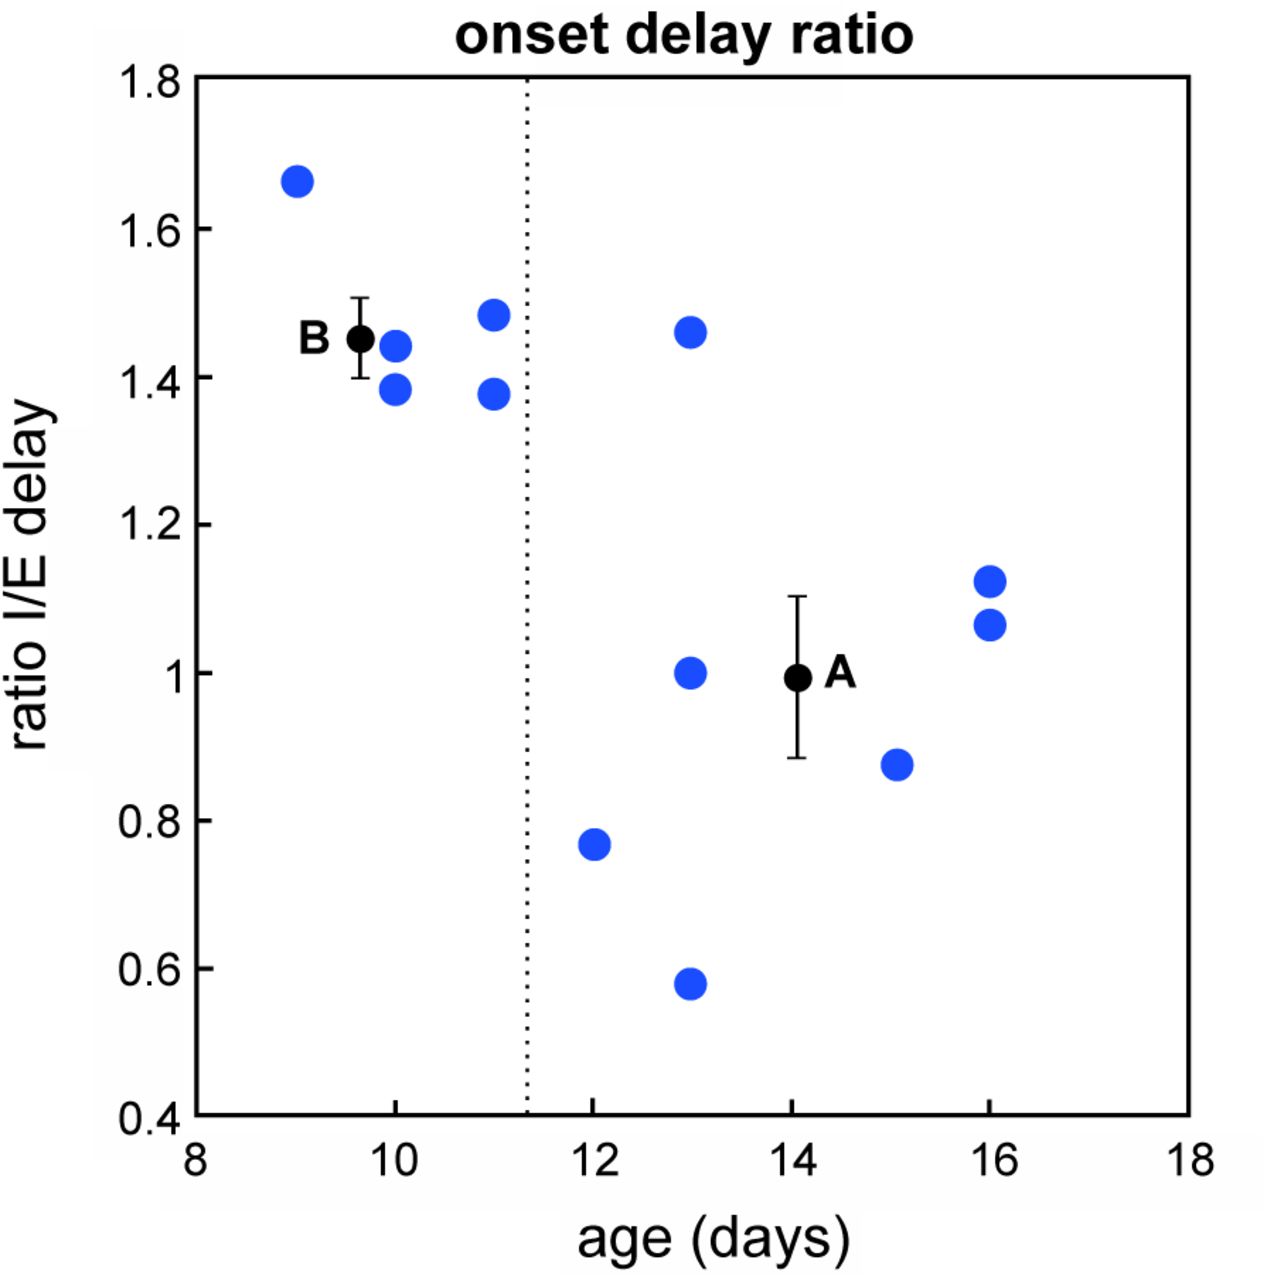
Notice that this is a stronger condition than  already observed in Fig. 1(C). Going back to experimental data, we actually observe such behavior (Fig.8), that we can quantify as κb = 1.47 ± 0.05 and κa = 0.98 ± 0.11 (mean ± standard error). One-tail Welch’s t-test confirms that κb > κa, p-value: p = 0.001. However, due to the limited number of points, more data need to be collected specifically for this purpose in order to have more robust results and properly test this prediction and also resolve the fine evolution of the ratio as a function of age.
Blue points represent the experimental data of Fig. 1(C) expressed in terms of ratio between inhibitory and excitatory currents onset delays. The dashed line indicates the moment of the observed developmental switch, between P11 and P12. Black points and error bars represent the mean values and standard error for the points before (B) and after (A) the transition.
This paper, initially aimed at accounting for a qualitative change in the dynamics of cortical networks when inhibition becomes faster, caught not only the main features observed experimentally, but also the order of magnitude of the frequency and amplitude trajectories of the native oscillations without need for fine-tuning. The exact quantitative results however vary upon changes in parameters values; in particular, if the existence of immature oscillations only depends on the ratio between the inhibitory and excitatory onset delays, the frequency of those oscillations is proportional to the absolute value of those delays. In our final quantitative simulations, we focused on a case where the excitatory current delay is kept fixed; further studies based on new experimental measurements could allow consideration in more detail the role of the absolute excitatory delay and its developmental dynamics.
Our simple model can be improved in several directions. First our model does not distinguish distinct neural populations and the variety of their timescales and evolutions within the thalamocortical loop. A direct perspective would be to make the model more precise by including various populations and changes in their timescales and relative impact. In particular, the early thalamocortical oscillations described in Fig. 1 involve the thalamus, itself showing an oscillatory activity at the same frequency as cortex, and in that view cortico-thalamic feedback is a potentially critical component of these oscillations [17]. The current model of early oscillation generation in visual cortex we developed suggests that unpatterned, noisy input (roughly IE/II in the model) from retina provides the drive, and thalamus and cortex as a whole oscillate in response. This reproduces accurately the fact that both thalamus and cortex switch to asynchronous/tonic patterns of firing after the switch, and both are the sites of reduced delay and increased amplitude of inhibition. The value of the present results lies in showing that recurrent networks of excitatory and inhibitory neurons can be made to undergo developmental transitions similar to those observed in vivo, in response to similar changes in the electrophysiological parameters. Future studies will reveal the circuit specifics of these networks during development.
We should also emphasize that our extension of the Wilson-Cowan model to investigate temporal dynamics of inhibition has implications and applications beyond development. Disruption of inhibition, particularly mediated by fast-spiking parvalbumin neurons, has been implicated in an number of neuro-developmental disorders [44, 45]. These include multiple mouse models of autism and schizophrenia. While to our knowledge, direct measurement of inhibitory delay have not been published, reduced drive [46] or density of fast-spiking parvalbumin neurons should result in net slowing of inhibitory rise times as represented within our model. The bifurcations of this model show that even small changes in delay can result in significant changes in the oscillatory dynamics, that might inform processing deficits observed in these conditions.
Materials and Methods
Mathematical and Computational methods
The full mathematical framework is provided in the reference [28] and in the main text, while more details can be found in SI text. The bifurcation analysis have been performed using XPPAUT [47] and Matcont (in Matlab environment) [48]. The results shown in Fig. 2B, Fig. 5, Fig. 6 and Fig. 7, are based on numerical simulation where the Eqs. 6 have been implemented in Matlab and Python codes with the Euler method. In particular, for each set of parameters, we simulated 1 second of dynamics, while frequencies (by FFT analysis) and amplitudes of the oscillations have been calculated only on the last 500 ms, to avoid the initial transient. Moreover, for the cases with noise, for each set of parameters we run 10 different simulations, and shown the mean for the amplitudes of the oscillations in Fig. 7.
Author Contributions
A.R., J.T. and B.G. designed the model, performed the mathematical and numerical analysis and wrote the paper. M.C. designed and performed experiments, analyzed experimental data and wrote the paper.
Acknowledgments
MTC is supported by The National Eye Institute (EY022730). A.R., J.T. and B.G. acknowledge funding from ANR-10-IDEX-0001-02 PSL*. BSG was partially funded by ANR-10-LABX-0087 IEC. This study was performed as a part of the Basic Research Program at the National Research University Higher School of Economics (HSE) supported by the Russian Academic Excellence Project ‘5-100’
Footnotes
↵1 Notice that the two equations are completely symmetric under the exchange of τ1 and τ2; we choose by convention τ1 > τ2.
References


