

Summary
Pancreatic ductal adenocarcinoma (PDAC) is a devastating disease lacking effective therapies. A major hallmark of PDAC is desmoplasia, characterized by the expansion of cancer-associated fibroblasts (CAFs) and their extracellular matrix, creating a unique microenvironment that limits blood-supplied nutrition and is highly immunosuppressive. Here, we uncovered the upregulation of NetrinG1 (NetG1) in CAFs and its binding partner NetrinG1 ligand (NGL-1) in PDAC cells and patient tissue samples. Using a three-dimensional culturing system, we observed that the NetG1/NGL-1 axis controls key pro-tumorigenic features of CAFs and PDAC cells, in cell autonomous and reciprocal manners. Results were confirmed in vivo using patient tissues and in a murine PDAC model in which NGL-1 ablation in PDAC cells significantly halted tumor growth. Thus, this study identifies two potential targets for PDAC, both tumoral and microenvironmental.
Significance PDAC has a 5-year survival rate of ~8% and lacks effective therapeutics. Therefore, it is of paramount importance to identify new targets and discern their functional roles. Using patient tissue and data, three-dimensional co-culturing in vitro assays, and orthotopic murine models, we identified NetG1 and NGL-1 as major promoters of PDAC tumorigenesis. NetG1+ CAFs supported PDAC survival, through NetG1/NGL-1 mediated nutritional supply, dependent on glutamate metabolism. NetG1+ CAFs were intrinsically immunosuppressive and inhibited NK cell mediated killing of PDAC cells. NGL-1 controlled tumor cell fitness in vitro and in vivo, likely through metabolic communication with CAFs. Overall, we identified two putative targets in different cellular compartments in PDAC and disrupting solely one arm of the NetG1/NGL-1 axis significantly stunted tumorigenesis.
Introduction
Pancreatic cancer is projected to become the 2nd leading cause of cancer related deaths by 2030 (Rahib et al., 2014), due to its abysmal 5 year survival rate of ~8% (Siegel et al., 2018). The most common form of pancreatic cancer is pancreatic adenocarcinoma (PDAC), and it has a number of characteristics that contribute to the poor patient prognosis. PDAC patients usually present no obvious symptoms until advanced stages of the disease (Ryan et al., 2014), where about 20% of patients are eligible for surgical interventions (Hidalgo, 2010). Further, PDAC treatment is often refractory and renders the poor observed patient outcome. Clearly, there is an urgent need to develop new diagnostic and better therapeutic approaches.
PDAC has a unique tumor microenvironment that consists of a fibrous expansion reaction known as desmoplasia. This process is characterized by the expansion of cancer associated fibroblasts (CAFs) and their deposition of an abundant extracellular matrix (ECM) (Rybinski et al., 2014). Studies have demonstrated that CAFs limit the efficacy of chemotherapies (Chan et al., 2016; McCarroll et al., 2014; Olive et al., 2009), promote PDAC progression (Djurec et al., 2018; Hwang et al., 2008), and correlate with poor prognosis (Erkan et al., 2008). Interestingly, while there is a clear role for CAFs in facilitating PDAC progression, there is also evidence that CAFs can be tumor restrictive, as complete ablation of fibroblasts from the tumor microenvironment accelerated PDAC metastasis and reduced survival (Özdemir BC, 2014; Rhim et al., 2014). Thus, the role of CAFs in PDAC development is incompletely understood.
Another feature of the PDAC microenvironment is a lack of angiogenesis. The dense network of CAFs and ECM generate substantial interstitial pressure that contributes to the collapse of blood vessels (Provenzano et al., 2012), resulting in a nutrient deprived (Kamphorst et al., 2015) and hypoxic microenvironment (Erkan et al., 2016). Further, Kras driven cancers like PDAC, where ~90% of tumors have mutant Kras, have been shown to become “addicted” to exogenous sources of glutamine as a main carbon supply (Ying et al., 2012). As such, PDAC cells have been shown to exploit metabolites to fuel the TCA cycle, promoting their growth and survival (Jin et al., 2016; Seo et al., 2016; Son et al., 2013). So, the question becomes; where do PDAC cells obtain these key nutrients in an environment devoid of functional blood vessels? CAFs have emerged as a potential source of nutrients for PDAC cells, and recent work in the field has begun to illustrate the importance of CAF-PDAC interactions in the progression of PDAC tumors (von Ahrens et al., 2017), with a special emphasis on CAF driven metabolic support (Lyssiotis and Kimmelman, 2017). Accordingly, CAF derived exosomes containing TCA cycle metabolites, as well as CAF secreted alanine, have been shown to support PDAC growth and survival (Sousa et al., 2016; Zhao et al., 2016). Thus, further exploration of these mechanisms, aiming to disrupt tumor-stromal crosstalk, is warranted.
One final hallmark of the PDAC microenvironment is extreme immunosuppression and lack of anti-tumor immunity (Fu et al., 2018). Because of the significant desmoplasia associated with PDAC, CAFs are at the center of the immunosuppressive microenvironment (Harper and Sainson, 2014). CAFs exert their immunosuppressive effects through direct modulation of immune cell function through cytokine secretion (Wu et al., 2017), exclusion of anti-tumor immune cells from the tumor (Ene-Obong et al., 2013), or recruitment of immunosuppressive immune cells to the tumor (Kumar et al., 2017). Consequently, PDAC is considered a “cold” tumor; lacking substantial cytotoxic T-cell accumulation (Basso et al., 2014), and this is true in spontaneous mouse models of PDAC as well (Clark et al., 2007). Intriguingly, there has been substantial work done in the past few years linking metabolism to immune cell function (Buck et al., 2017; Kouidhi et al., 2018). Anti-tumor immune cells rely on a constant supply of nutrients to perform their functions. In the cancer context, key metabolites—glucose, arginine, glutamine, and tryptophan—are depleted, with a concomitant increase of immunosuppressive waste products, such as lactate, inhibiting anti-tumor immune cell function (Buck et al., 2017; Gardiner and Finlay, 2017; Renner et al., 2017). The immunosuppressive environment created by CAFs, combined with the nutrient poor milieu, create a hostile environment that inhibits cytotoxic immune cell function in PDAC. Means to simultaneously revert these linked features of the PDAC microenvironment would be extremely beneficial therapeutically.
Taking into consideration these hallmarks of PDAC, in this study, we sought to better understand the major cell type present in PDAC tumors, CAFs, and how they contribute to tumorigenesis. Comparing patient matched normal pancreatic stellate cells (i.e. normal fibroblasts) and CAFs, we uncovered up-regulation of the glutamatergic pre-synaptic protein, Netrin-G1 (NetG1) (Nakashiba et al., 2000; Song et al., 2013), in CAFs. Surprisingly, we also found up-regulation of Netrin-G1 Ligand (NGL-1), the post-synaptic binding partner of NetG1 (Lin et al., 2003) in PDAC cells. Importantly, staining of human tumor tissue revealed that NetG1 expression in CAFs correlated with our established pro-tumor CAF phenotype (Franco-Barraza et al., 2017). We demonstrated that the NetG1/NGL-1 axis stimulates CAF-PDAC cell interactions, facilitates nutrient flow from CAFs to PDAC cells, and prevents anti-tumor NK cells from killing PDAC cells. Ablation of NetG1 in CAFs reduced the survival benefits bestowed upon PDAC cells by altering glutamine/glutamate metabolism in CAFs. Moreover, NetG1 knockout in CAFs dramatically inhibited their production of immunosuppressive cytokines, allowing for partial activation of NK cells and elimination of tumor cells in vitro. Finally, in orthotopic mouse models, deletion of NGL-1 in murine PDAC cells resulted in lower tumor incidence and stunted tumor growth in vivo. Our findings unveil a previously undiscovered axis in PDAC that define tumor cell autonomous and non-autonomous roles for NetG1/NGL-1 in tumor development, as well as offer a novel stromal target aiming to reverse the tumor promoting effects of CAFs in the PDAC microenvironment.
Results
Netrin G1 is upregulated in CAFs, and its binding partner NGL-1 is overexpressed in tumor cells
To gain insight into the mechanism by which pancreatic stellate cells (PSCs) are activated into cancer associated fibroblasts (CAFs), we performed a microarray comparing two sets of patient matched PSCs and CAFs. Interestingly, we observed upregulation of several neural/brain related genes in CAFs, including Netrin G1 (NetG1), a synapse stabilizing protein involved in axonal communication (Fig 1A). NetG1 is present on pre-synaptic neurons, and it stabilizes excitatory glutamatergic synapses by interacting with its only known binding partner on post-synaptic cells, Netrin G1 Ligand (NGL-1) (Lin et al., 2003; Song et al., 2013). This finding suggested that NetG1 might play a role in the tumor microenvironment, orchestrating communication between CAFs and tumor cells. In fact, NetG1 was among the top 38 differentially regulated genes between PSCs and CAFs and its upregulation in CAFs was confirmed by western blotting, comparing 4 PSCs and 5 CAFs (2.5 fold increase) (Fig 1B). Due to NetG1’s known role in brain cell-cell communication (Nakashiba et al., 2000), we questioned if PDAC cells expressed NGL-1, the binding partner of NetG1. We probed NGL-1 expression in an isogenic cell model engineered to introduce progressive mutations into immortalized human pancreatic epithelial cells (termed “hTERT”) which included transformation of hTERT cells by inactivating p53 and Rb to create the “E6/E7” cell line, and introduction of oncogenic KrasG12D to produce the “KRAS” cell line (Campbell et al., 2007). NGL-1 was weakly expressed in hTERT cells, but was highly expressed in the tumorigenic KRAS cells (Fig 1C). NGL-1 expression was also confirmed in the PDAC cell line PANC-1 (Sup Fig 1I), as well as in all 5 additional patient derived PDAC cell lines tested (Fig 1D). Collectively, the data demonstrate the NetG1 is upregulated in CAFs and that NGL-1 is upregulated in PDAC cells.

A. Representative mRNA expression of NetG1 in normal PSCs and CAFs from a single patient cultured in 3D. B. Representative western blot of NetG1 illustrating consistent expression of the protein throughout 6 days of 3D ECM. H3 was used as a loading control. C. Generation of two human NetG1 KO CAF clones, using CRISPR/Cas9, as shown in the western blot. H3 was used as a loading control. Cell line containing vector targeting GFP was used as control D. (LEFT) Representative images of α-smooth muscle actin (α-SMA) IF, with the quantification (intensity) displayed in the graph (RIGHT). E. ECM orientation, as indicated by fibronectin (FN) IF and pseudocolored to highlight fiber orientation using OrientationJ from ImageJ. Color bar: color coded angle orientation showing green color was used for normalized mode angle fibers. FN fibers within 15 degrees of the mode angle were scored as an indicator of ECM orientation and were graphed on the right. F. Quantification of active integrin α5β1; IF intensity, detected using the SNAKA51 antibody in CON or in NetG1 KO CAFs. G. Quantification of phospho-FAK397 IF intensity in CON or in NetG1 KO CAFs. H. Validation of CRISPR/Cas9 mediated NGL-1 KO in KRAS cells, as shown in the representative western blot. GAPDH was used as a loading control. Cell lines containing vector targeting GFP were used as control. I. Validation of CRISPR/Cas9 mediated KO of NGL-1 in PANC-1 cells, as shown in the representative western blot. H3 was used as a loading control. Cell lines containing vector targeting GFP were used as control. T-test, ** p< 0.01; *** p< 0.001; **** p< 0.0001.

A. Heat map of a microarray analysis comparing two primary patient matched normal pancreatic stellate cells (Normal PSC; N1 and N2) and cancer associated fibroblasts (CAFs; T1 and T2), cultured in 3D. Red corresponds to upregulated and green to downregulated genes. B. Representative western blot comparing NetG1 expression in 4 PSCs and 5 CAFs obtained from PDAC patients, with the respective quantifications normalized to GAPDH and mean PSC expression. GAPDH was used as the loading control. Expression values are summarized in the graph to the right. C. Representative western blot comparing NGL-1 expression in an isogenic cell line of human pancreatic epithelial cells with progressive mutations, simulating different stages of pancreatic cancer. hTERT = immortalized epithelia; E6/E7 = Rb and P53 inactivated hTERT cells; KRAS = E6/E7 cells with KRASG12D. H3 was used as a loading control. D. Representative western blot comparing NGL-1 expression in cell lines derived from PDAC PDX models. H3 was used as a loading control. E. Quantification of human stromal NetG1 and p-FAK expressions (Integrated Intensity) comparing 4 normal pancreata and 15 PDAC patient tissue samples, using the SMI approach and SMIA software. F. Linear regression analysis performed on SMIA outputs of 15 patient tumor tissues. Note the strong correlation between stromal pFAK and stromal NetG1 expression (LEFT), and a weak correlation between tumoral NGL-1 expression and stromal NetG1 expression (RIGHT). N= 4 normal tissues; 15 PDAC tissues. G. Representative images of normal, NetG1/pFAK low, and NetG1/pFAK high patient tumor tissue depicting a triple overlay of threshold generated masks corresponding epithelium (pancytokeratin; orange), fibroblastic stroma (vimentin; cyan) and nuclei (magenta). Images below correspond to monochromatic images generated from SMIA, showing pixels positive for stromal pFAK and NetG1. Bar represents 50 μM. Student’s T-Test for (E).
NetG1 is expressed in the stroma of patient tumor tissue
To assess the clinical relevance of NetG1/NGL-1, we performed our previously established Simultaneous Multichannel Immunofluorescence (SMI) (Franco-Barraza et al., 2017) on 4 normal and 15 tumor pancreatic tissue samples to discern NetG1 and NGL-1 expression patterns in distinct subsets of cells within the microenvironment. We found that there was a trend that NetG1 was upregulated in the mesenchymal stromal compartment (cytokeratin/Epcam negative, Vimentin positive areas) in tumor tissue compared to patient matched normal tissue (Fig 1E), confirming our observations in vitro. Moreover, we observed that stromal pFAK expression also showed a trend towards increased expression in tumor tissue compared to normal tissue, in line with our established pro-tumor CAF signature (Franco-Barraza et al., 2017). We also observed a strong correlation between stromal NetG1 expression and stromal pFAK expression in tumor tissue (R2 = 0.9008) (Fig 1E), with representative examples of stromal co-expression in normal and tumor tissue (tumor low: NetG1/pFAK low; tumor high: NetG1/pFAK high) (Fig 1F). Lastly, we observed a weak correlation between stromal NetG1 expression and tumoral NGL-1 expression in tumor tissue (R2 = 0.2682) (Fig 1G), suggesting that simply having ectopic expression of NetG1 and NGL-1 may be more important than the levels of these proteins in the tumor. Overall, NetG1 was upregulated in tumor tissue compared to normal pancreatic tissue and correlated with the reported CAF phenotype that was associated with fast PDAC recurrence.
Ablation of NetG1 does not influence extracellular matrix production by CAFs, but reverses pro-tumorigenic CAF features
We next sought to understand the function of NetG1 in CAFs, using our well-established cell-derived extracellular matrix (ECM) based 3D culturing system for fibroblasts (Amatangelo et al., 2005; Cukierman et al., 2001). Briefly, CAFs produce ECM for five days in the presence of ascorbic acid. The resulting cultures are either probed at this point for phenotypic characterization or cells are removed from their newly generated ECMs, which then serve as substrates for ECM-supported cell culturing (3D), using cells known to inhabit the tumor microenvironment. We employed both approaches in this study, and all experiments were performed in 3D unless otherwise noted. In order to characterize NetG1 expression during ECM production, we chose one of our patient-derived CAF lines, in which NetG1 was upregulated at the mRNA and protein levels compared to normal PSCs (Sup Fig 1A). Next, we followed NetG1 expression during ECM production in vitro, a major function of CAFs in the in vivo tumor microenvironment. NetG1 expression was maintained throughout ECM production (Sup Fig 1B). To better understand the functional role of NetG1, we performed CRISPR mediated deletion of NetG1 in CAFs (Sup Fig 1C) and assessed their desmoplastic phenotype during ECM production, according to our previous study (Franco-Barraza et al., 2017). Interestingly, NetG1 knockout (KO) CAFs did not have an altered ECM production and topography, as determined by fibronectin (FN) alignment and levels/localization of alpha smooth muscle actin, a marker of fibroblast activation (Sup Fig 1D-E). However, NetG1 KO CAFs displayed reduced levels of active α5β1 integrin and tyrosine 397 phosphorylated focal adhesion kinase (pFAK), indicative of a CAF phenotype that correlated with long recurrence following surgery in PDAC patients (Franco-Barraza et al., 2017) (Fig Sup 1F-G) (Fig 1E-F). Thus, deletion of NetG1 does not alter the alignment of the CAF generated ECM, but reverses known pro-tumor CAF markers.
NetG1, but not NGL-1, increase heterotypic cell contacts between CAFs and PDAC cells
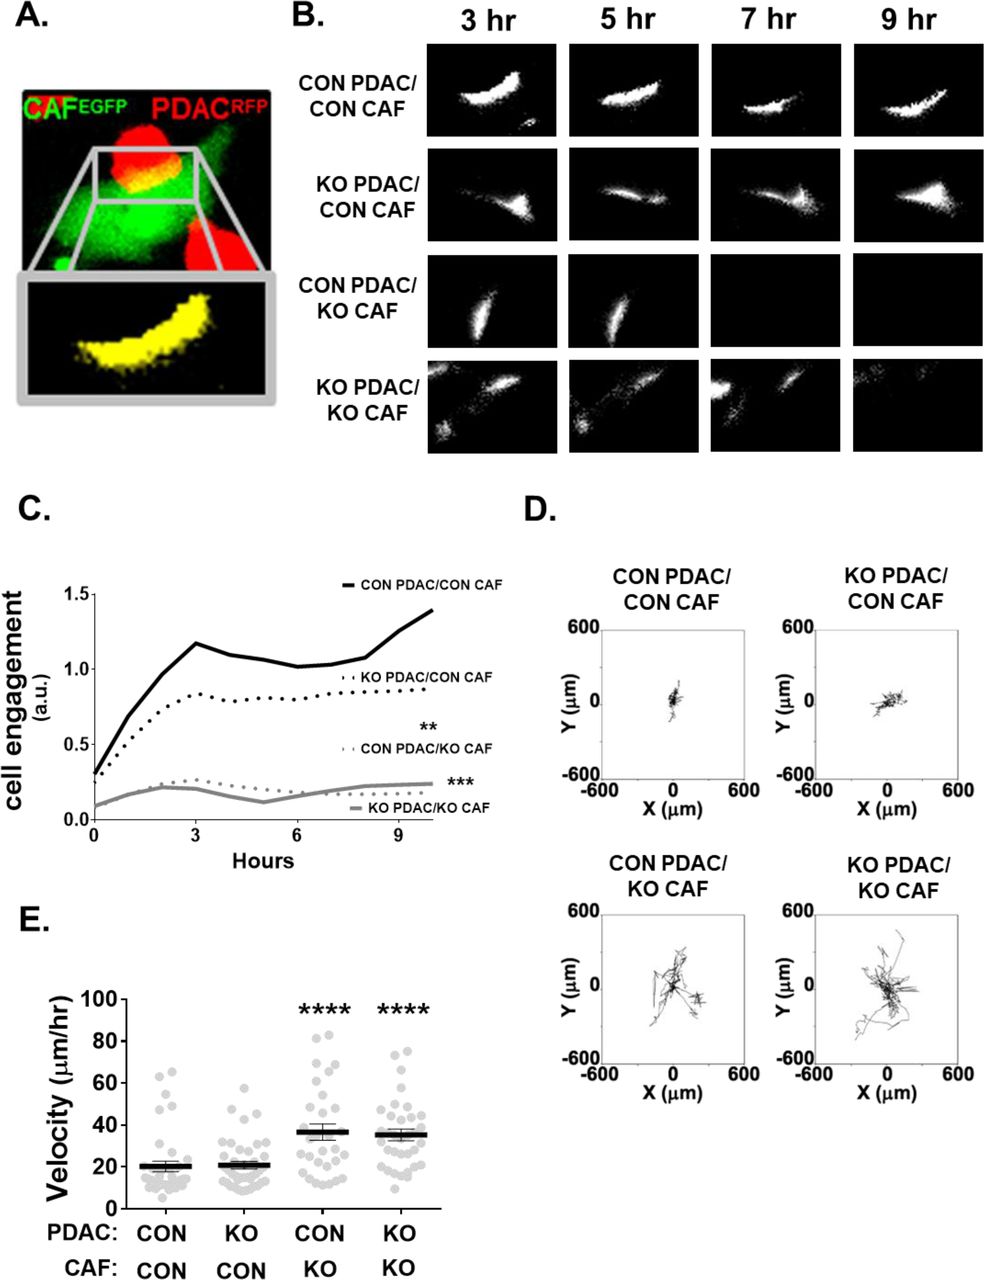
Because of NetG1’s known role in cell-cell adhesion in the brain, namely through its binding partner NGL-1, we decided to also knockout NGL-1 in PDAC cells (Sup Fig 1H-I) to test the potential function of NetG1/NGL-1 in CAF-PDAC cell-cell interactions. Interestingly, ablation of NetG1 in CAFs reduced cell engagement with CON or NGL-1 KO PDAC cells by 72% and 79%, respectively (Sup Fig 2A-C). Accordingly, CON or NGL-1 KO PDAC cells had increased motility (81% and 74%, respectively) when co-cultured with NetG1 KO CAFs in 3D (Sup Fig 2D-E). Unexpectedly, deletion of NGL-1 from PDAC cells was not sufficient to alter PDAC-CAF cell engagement or PDAC motility, signifying that NetG1 in CAFs is the driver of PDAC-CAF heterotypic interactions and that there may be a redundant mechanism controlling PDAC-CAF engagement in the absence of NGL-1 in PDAC cells.

A cell engagement assay was undertaken by co-culturing 2x10⁴ CON or NGL-1 KO PDAC cells (RFP+) in 3D with 2x10⁴ CON or NetG1 KO CAFs (GFP+) for 24 hours, and areas of cell engagement were measured. A. Example of the type of areas analyzed in the cell engagement assay. Note the yellow area in the top panel (representing the engagement area), with the zoomed in region of the yellow in the panel below. B. Representative images of the areas of cell engagement for each co-culture condition, over the time span of the assay. C. Quantification of cell engagement areas during 10 hours of engagement. D. Cell invasion (i.e., through 3D ECMs) assay was performed by co-culturing RFP+ CON or NGL-1 KO PDAC cells (2x10⁴) with GFP+ CON or NetG1 KO CAFs (2x10⁴) for 24 hours; time lapse videos measured PDAC cell movement over that timespan. Shown are all motility tracks of PDAC cells, invading through ECMs, that were acquired from each co-culture experimental condition. E. Velocity of PDAC cells from (D) shown in μm/hour units. * compared to CON PDAC/ CON CAF group. One-way ANOVA, Dunnett’s multiple comparison test ** p< 0.01; *** p< 0.001; **** p< 0.0001.
CAFs transfer material to PDAC cells, in a NetG1/NGL-1 dependent manner
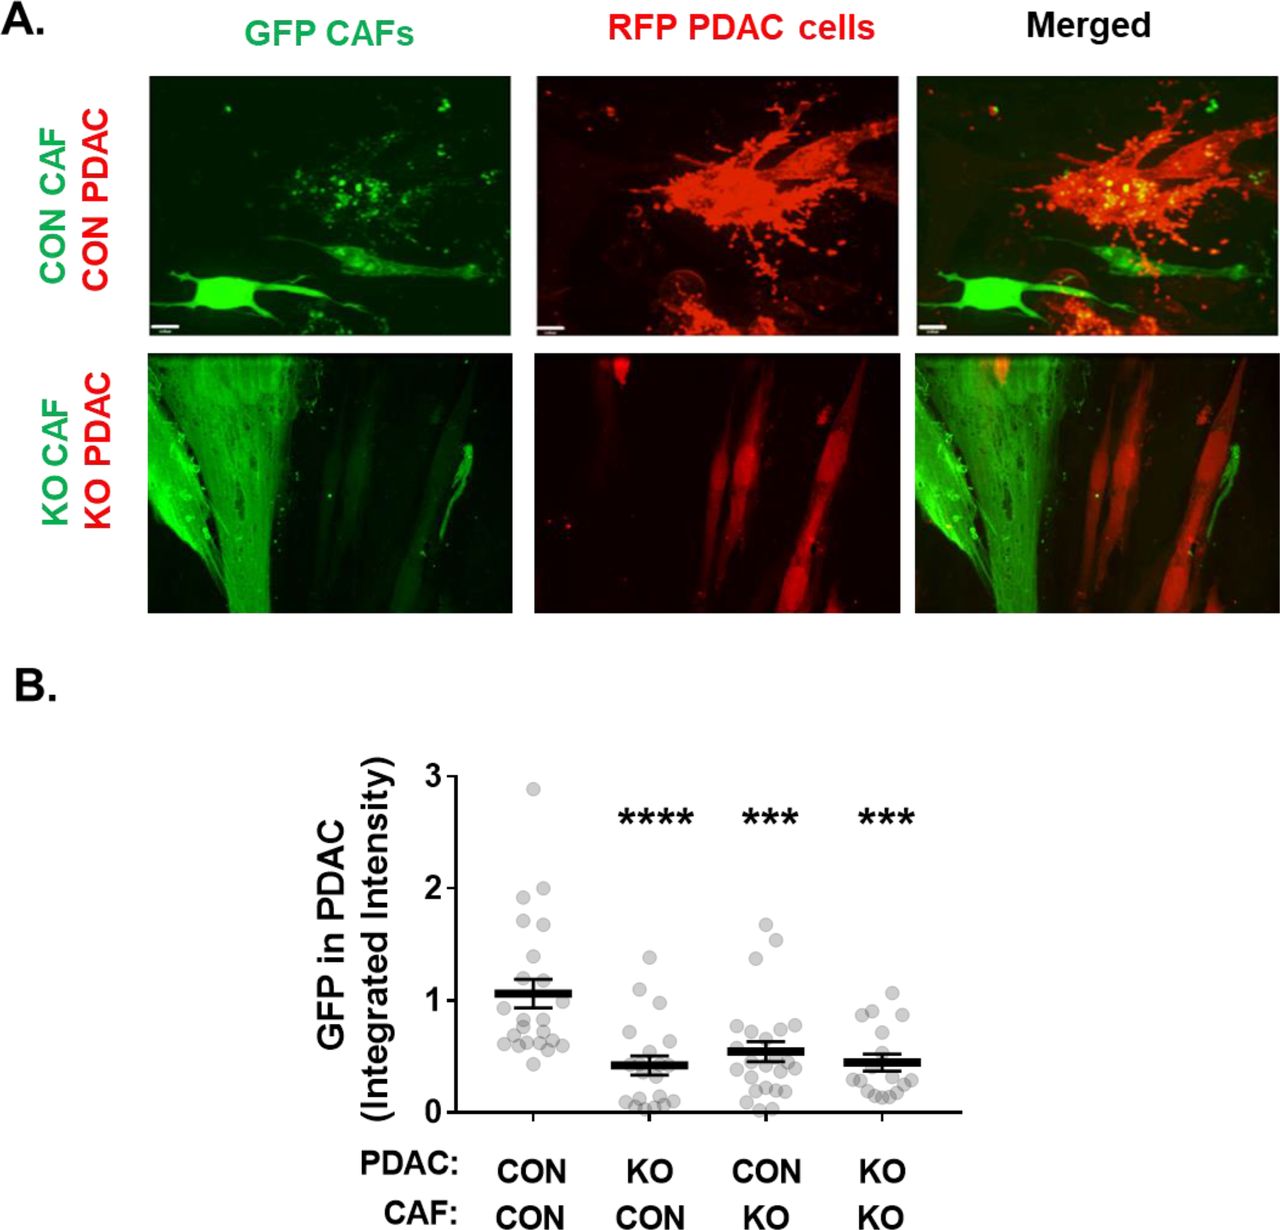
Because NetG1 in CAFs mediated PDAC-CAF interactions, we questioned if there was a further functional consequence of the increased heterotypic cell-cell interactions observed during coculture. Since PDAC cells have the ability to use any extracellular macromolecule (lipids, amino acids, carbohydrates) as a source of energy (Kamphorst et al., 2015; Muranen et al., 2017), and receive nutrients from CAFs (Sousa et al., 2016; Zhao et al., 2016), we hypothesized that CAFs may provide resources to PDAC cells in a NetG1 dependent manner. To test this, we engineered CAFs (CON or NetG1 KO) to express green fluorescent protein (GFP) and PDAC cells (CON or NGL-1 KO) to express mCherry, a red fluorescent protein (RFP), and followed the exchange of GFP and RFP. Indeed, after 36 hours of co-culture, GFP was detected intracellularly in PDAC cells (Fig 2A-B), demonstrating that PDAC cells received CAF derived material. Knockout of NetG1 in CAFs, or NGL-1 in PDAC cells, resulted in a 49%-61% reduction in GFP transfer to PDAC cells, compared to CON PDAC/CON CAF group (Fig 2A-B). Therefore, while NGL-1 was dispensable for CAF-PDAC engagement, both NGL-1 and NetG1 were necessary for the ability of PDAC to receive material from CAFs, and for CAFs to provide material to PDAC, respectively.

A. Representative images from a 36 hour 3D co-culture of GFP labeled CON or NetG1 KO CAFs (2x10⁴) with RFP labeled CON or NGL-1 KO PDAC cells (2x10⁴), in SF media. Note the yellow color inside of RFP+ PDAC cells in the CON/CON condition, indicative of PDAC intracellular GFP (Merged). B. Quantification of the amount of GFP+ PDAC cells, calculated as integrated GFP fluorescence intensity, from the 36 hour material transfer assay in (A), relative to the CON CAF/CON PDAC co-culture condition. N = 3 independent experiments with a minimum of 7 images per condition. One-Way ANOVA, Dunnett’s multiple comparison test. ***p<0.001; ****p<0.0001.
NetG1/NGL-1 Axis Protects PDAC cells from death under nutrient restriction
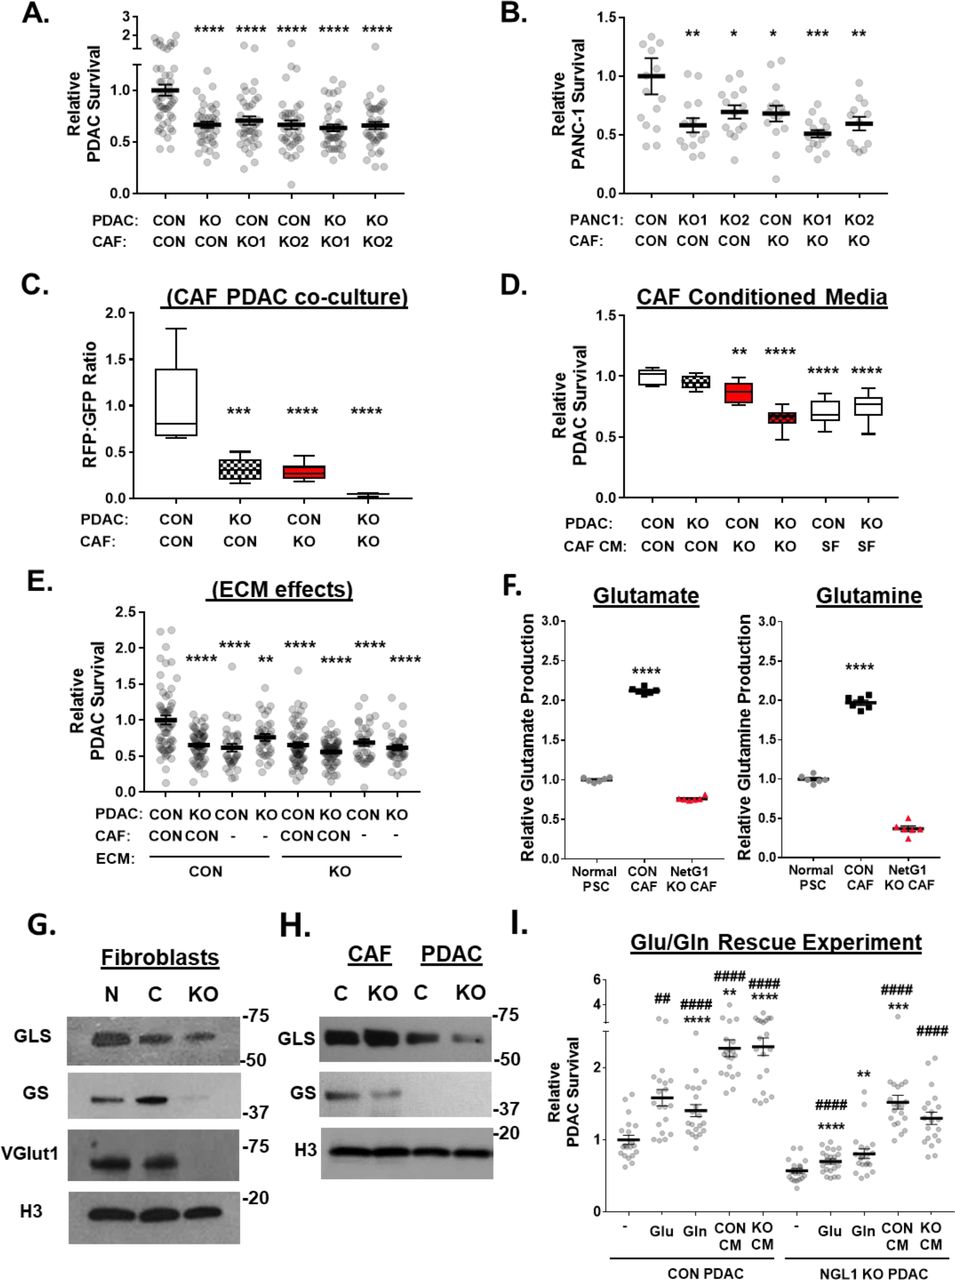
The fact that the PDAC microenvironment is devoid of an obvious nutritional supply for cancer cells, combined with the ability of CAFs to transfer material in a NetG1/NGL-1 dependent manner (Fig 2), led us to hypothesize that CAFs serve as a critical nutrient conduit and could rescue PDAC cells from nutrient deprivation. To this end, we co-cultured GFP+ CAFs with RFP+ PDAC cells in 3D under serum free conditions and measured the survival of RFP+ PDAC cells over a 4 day time span. We observed that disruption of the NetG1/NGL-1 axis, by deletion of either NetG1 in CAFs or NGL-1 in PDAC cells, resulted in 30-37% decrease in PDAC (KRAS) cell survival, compared to CON PDAC/CON CAF group (Fig 3A). These results were replicated using the pancreatic cancer cell line PANC-1 as well, with a 40-59% reduction in PANC-1 survival compared to CON/CON group (Fig 3B). Interestingly, in CON PDAC/CON CAF cocultures, CAF numbers declined while PDAC cells were maintained, as indicated by the PDAC:CAF ratios (Fig 3C). Conversely, when NetG1 or NGL-1 was ablated, PDAC cells survived less, while CAFs persisted in greater numbers (68-96% ratio decrease), suggesting that CAFs sacrifice themselves for the benefit of PDAC cells, in a NetG1/NGL-1 dependent manner. To determine if direct physical contact between CAFs and PDAC cells is important for survival, PDAC cells were cultured in 3D with conditioned media (CM) obtained from CON or NetG1 KO CAFs and compared to serum free media alone. We found that NetG1 KO CAF CM was 13-35% less efficient at rescuing PDAC cell survival when compared to CON CAF CM (Fig 3D). To further assess the effect of NetG1 on the microenvironment generated by CAFs, we performed survival assays using CON and NetG1 KO ECMs. Compared to co-cultures in the CON CAF ECM, PDAC cells grown in NetG1 KO CAF ECM had a 33-45% decrease in survival, independent of NGL-1 status in the PDAC cells, suggesting that the microenvironment generated by NetG1 KO CAFs is less supportive of tumor survival (Fig 3E). Collectively, these results suggest that both direct physical contact with CAFs, and the factors secreted by CAFs, including their CM and ECM, support PDAC survival in a NetG1/NGL-1 dependent fashion.

A. GFP+ CON or NetG1 KO CAFs (2x10⁴) (2 clones, KO1 and KO2) were co-cultured in 3D with RFP+ CON or NGL-1 KO PDAC cells (2x10⁴) in the absence of serum for 4 days followed by cell survival assessments. B. Same assay as in (A), but with RFP+ CON or NGL-1 KO PANC-1 cells. C. Quantification of the ratio of Red PDAC cells: Green CAFs from an independent set of survival experiments performed with one clone of the NGL-1 KO PDAC cells, depicting a shift from PDAC survival to CAF survival. All groups were compared to CON PDAC/CON CAF condition. D. RFP+ CON or NGL-1 KO PDAC cells (2x10⁴) were co-cultured in 3D with CM from CON or NetG1 KO CAFs or in serum free (SF) media, and PDAC survival was measured after 4 days. E. Effect of different environments (ECMs) on PDAC survival, compared to CON PDAC/CON CAF cultured in CON ECM. RFP+ CON or NGL-1 KO PDAC cells (2x10⁴) were cultured with GFP+ CON CAFs (2x10⁴) for 4 days in either CON or NetG1 KO CAF ECMs (i.e. 3D environment). Note that NetG1 ECMs were significantly less supportive of PDAC survival, when comparing CON PDAC/CON CAF cultured on CON ECMs. F. Relative glutamate and glutamine levels in the CM of normal PSCs and CON or NetG1 KO CAFs. N= 6 biological replicates, all groups were compared to normal PSC condition. G. Representative western blots of glutaminase (GLS), glutamine synthetase (GS) and vesicular glutamate transporter 1 (VGlut1) in normal PSCs (N), control CAFs (C) and NetG1 KO CAFs (KO). H3 was used as a loading control. H. Representative western blots of GLS and GS in control CAFs (C) and NetG1 KO CAFs (KO) in comparison to CON and NGL-1 KO PDAC cells. H3 was used as a loading control. I. RFP+ CON or NGL-1 KO PDAC cells (2x10⁴) were cultured alone in 3D under serum and glutamine deprivation (-). Graph depicts relative PDAC survival after exposure to media alone, Glu, Gln or CAF CM. Treatment groups consisted of glutamate (Glu; 150 μM) and glutamine (Gln; 5 μM) addbacks to determine if those amino acids alone could rescue PDAC cell survival in the absence of CAFs. CM from CON or NetG1 KO CAFs was used as a positive control for rescue. Note how amino acids alone partially rescue CON PDAC but not NGL-1 KO PDAC cells, which also benefit from CM media to a lesser extent than their CON counterparts. * compared to CON PDAC SF; # compared to KO PDAC SF. For all graphs: One-Way ANOVA, Dunnett’s multiple comparison test. *p<0.05, **p<0.01, ***p<0.001; ****p<0.0001.
Alterations in Glutamate/Glutamine recycling in CAFs have a functional consequence on PDAC survival
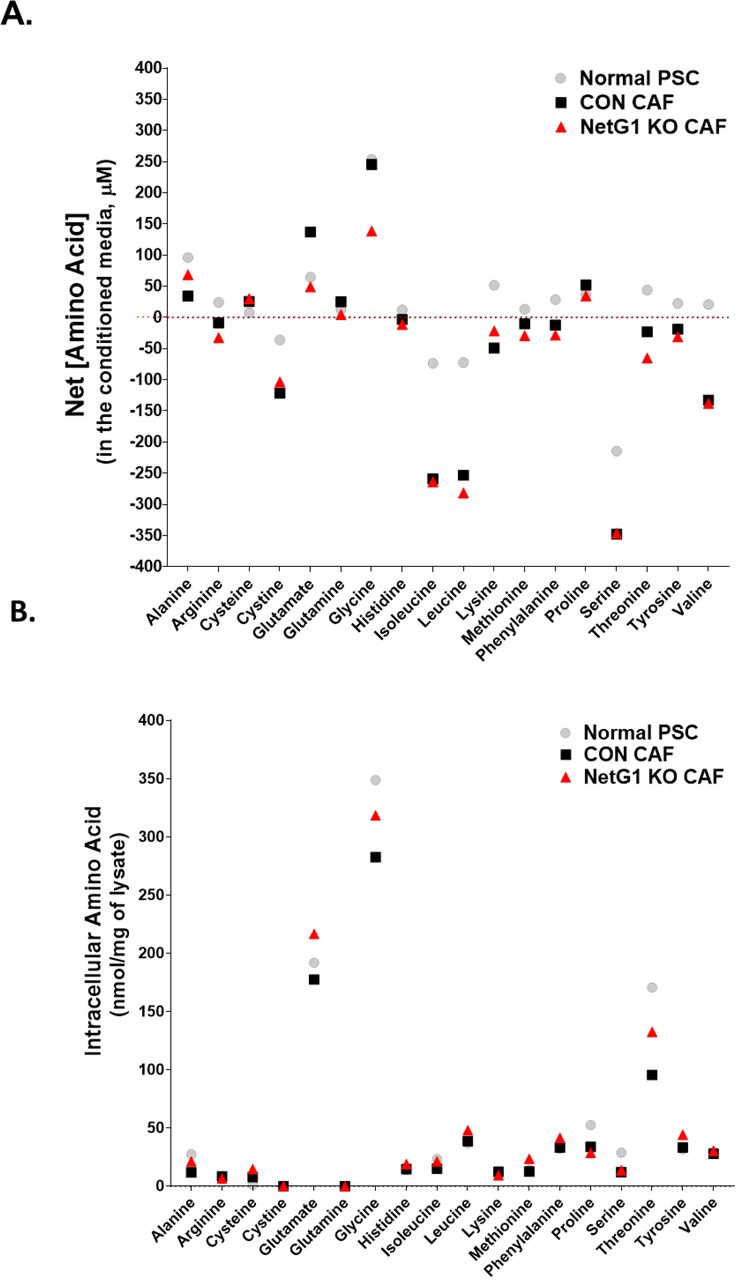
We observed that CON CAFs supported PDAC survival in the absence of serum and this effect could be significantly reduced when NetG1 was deleted in CAFs. In an effort to gain insight into key factors that could be supporting PDAC survival under nutritional deprivation, we performed an amino acid screen using normal PSCs, CON CAFs, and NetG1 KO CAFs, during ECM production (Sup Fig 3, Tables 1-3). The greatest net change in amino acid production and secretion between normal PSCs and CAFs was found to be in glutamate and glutamine, as CAFs secreted 2-fold more of these amino acids (Fig 3F). These results are in line with recent studies suggest that glutaminolysis, the catabolism of glutamate, plays a major role in PDAC and other cancers and that this could potentially be a targetable metabolic pathway for the treatment of PDAC (Jin et al., 2016; Son et al., 2013; Xiang et al., 2015; Yang et al., 2016). However, what was not expected was that NetG1 KO CAF CM contained 64% less glutamate and 81% less glutamine, compared to CON CAFs (Fig 3F). Thus, we decided to explore the expression levels of enzymes related to glutamine/glutamate cycling.

Normal PSCs, CON CAFs, and NetG1 KO CAFs were grown in 3D for 5 days and then the media was replaced with serum and glutamine free media for 2 days to allow conditioning of the media. After 2 days, conditioned media and lysates were separately collected and amino acids were detected using a BioChrom 30 analyzer. A. Graph displaying the mean concentration (μM) of each amino acid queried in the screen and detected in the conditioned media from each cell type. Red line indicates a concentration of 0 μM. B. Graph displaying the mean concentration normalized to total lysate protein concentration (nmol amino acid/mg lysate) for each amino acid detected in the lysate of each cell type. Note that the conditioned media is measured as a net gain, as concentrations of amino acids in the blank media were known and subtracted from the concentrations after conditioning. For lysate measurements, there were no preconditioning subtractions. Grey circle = normal PSC; Black square = CON CAF; Red triangle = NetG1 KO CAF. N= 6 biological replicates.
Concentration of amino acids in conditioned media and lysate of Normal PSCs
Concentration of amino acids in conditioned media and lysate of CON CAFs.
Concentration of amino acids in conditioned media and lysate of NetG1 KO CAFs.
In glutaminolysis, two of the major enzymes responsible for recycling glutamate and glutamine are glutaminase (GLS) and glutamine synthetase (GS), respectively. GLS has two major isoforms, GLS1 and GLS2, each with a major splice variant as well. GLS converts glutamine into glutamate and ammonia. GS, on the other hand, converts ammonia and glutamate into glutamine. Because of the clear differences in glutamate and glutamine levels upon NetG1 KO in CAFs, we explored if GLS and GS protein levels were altered in CAFs. We detected expression of GLS1 and GS in normal PSCs and CAFs (Fig 3G). While GLS levels were similar between all fibroblasts, GS was significantly reduced in NetG1 KO CAFs, suggesting that NetG1 KO CAFs are compromised in their ability to produce glutamine from glutamate. Interestingly, NetG1 KO CAFs had essentially undetectable levels of vesicular glutamate transporter 1 (VGlut1), a major protein responsible for loading presynaptic vesicles with glutamate during neuronal communication (Liguz-Lecznar and Skangiel-Kramska, 2007) (Fig 3G). Thus, while CON and NetG1 KO CAFs expressed similar levels of GLS, NetG1 KO CAFs lacked VGlut1 and had decreased levels of GS, which could account for the reduced amounts of glutamine produced and glutamate released by NetG1 KO CAFs. PDAC cells expressed lower levels GS than CAFs, while maintaining GLS expression (Fig 3G). Interestingly, knockout of NGL-1 in PDAC cells resulted in a reduction in GLS protein levels, suggesting an even greater metabolic dependence on CAFs or extracellular nutrients than CON PDAC cells. To test if glutamine and glutamate play a direct role in fostering PDAC survival under nutrient restricted conditions, we cultured RFP+ CON or NGL-1 KO PDAC cells alone in media lacking glutamine, glutamate, and serum and queried whether add back of glutamine or glutamate, at levels produced by CON CAFs (25 μM and 150 μM respectively), could restore PDAC survival. Indeed, glutamine and glutamate partially rescued CON PDAC survival, although not in NGL-1 KO PDAC cells (Fig 3H). CM from CON CAFs rescued PDAC cells to the highest degree, with a 2.3 and 1.5 fold increases in survival for CON and NGL-1 KO PDAC cells relative to the depleted media condition. Similarly, NetG1 KO CAF CM rescued CON and NGL-1 KO PDAC survival by 2.3 fold and 1.3 fold, respectively, signifying that in serum free/glutamine free conditions, NGL-1 status on PDAC cells dictated survival. Collectively, these results suggest that glutamine and glutamate derived from CAFs help support PDAC survival in the nutrient deprived microenvironment, and that this support depends on NetG1 expression in CAFs. Additionally, NGL-1 expression in PDAC cells appears to be critical for the uptake of extracellular factors, such as glutamine and glutamate. Thus, modulation of the NetG1/NGL-1 axis disrupts the flux of glutamine and glutamate from CAFs to tumor cells, affecting their survival.
NGL-1 status on PDAC cells determines mode of cell death under nutritional stress
We observed that PDAC cells had decreased survival in co-culture with CAFs when the NetG1/NGL-1 axis was disrupted under stressful growth conditions (Fig 3). To question how PDAC cells were dying under metabolically stressful conditions, PDAC cells were pre-treated for 24 hours with vehicle (DMSO), apoptosis inhibitor (Zvad), necroptosis inhibitor GSK’872, or Zvad/GSK’872 combination. CON or NGL-1KO PDAC cells were then plated alone, or with CON or NetG1 KO CAFs, in 3D with serum free media. CON PDAC cells cultured alone were protected from apoptosis, as Zvad reduced cell death by 41%, while there was a more modest effect on NGL-1 KO PDAC cells, as death was reduced by 17%, compared to their DMSO controls (Sup Fig 4A). Inhibiting necroptosis had a minor effect in blocking cell death in CON PDAC cells, while being ineffective in NGL-1 KO PDAC cells. Intriguingly, when CON PDAC cells were co-cultured with CON or NetG1 KO CAFs, Zvad treatment actually increased PDAC cell death 3.5-fold and 1.8 fold compared to DMSO controls, in contrast to culturing alone (Sup Fig 4B). Treatment with GSK or both inhibitors in combination reverted the increase in cell death, suggesting that Zvad drove CON PDAC cells towards necroptotic cell death. Conversely, NGL-1 KO PDAC cells were protected from apoptosis and not necroptosis, as only Zvad or combination was effective at preventing cell death (Sup Fig 4B). Consistent with earlier cell survival assays (Fig 3), PDAC cells cultured with NetG1 KO CAFs experienced a higher amount of death (3-fold and 3.2 fold, CON PDAC and NGL-1 KO PDAC, respectively). Overall, the data indicate that disruption of heterotypic interactions mediated by NetG1/NGL-1, caused an increase in cell death, with the expression of NGL-1 in PDAC determining the mode of cell death under serum starved conditions.

RFP+ CON or NGL-1 KO PDAC cells (2x10⁴) were pretreated for 16 hours with DMSO control, Zvad (20 μm; pan caspase inhibitor), or GSK872’ (2.5 μM; RIPK3 necroptosis inhibitor) and then co-cultured in 3D with GFP+ CON or NetG1 KO CAFs (2x10⁴) for 48 hours, and the number of RFP+/Sytox Blue+ PDAC cells was quantified, indicative of cell death. A. Quantification of cell death of CON or NGL-1 KO PDAC cells cultured in 3D alone, in response to vehicle control (DMSO) vs. listed assorted cell death inhibitor treatments. Results were normalized to the control PDAC cells cultured in media complemented with DMSO. B. Quantification of cell death of CON or NGL-1 KO PDAC cells during co-culture conditions with CON or NetG1 KO CAFs, using inhibitors of cell death as above. Results are normalized to the CON CAF/CON PDAC cells cultured in media complemented with DMSO. One-way ANOVA, Dunnett’s multiple comparison test, ** p< 0.01; *** p< 0.001; **** p< 0.0001.
Knockout of NetG1 in CAFs reverts their immunosuppressive phenotype and permits NK cell anti-tumor function
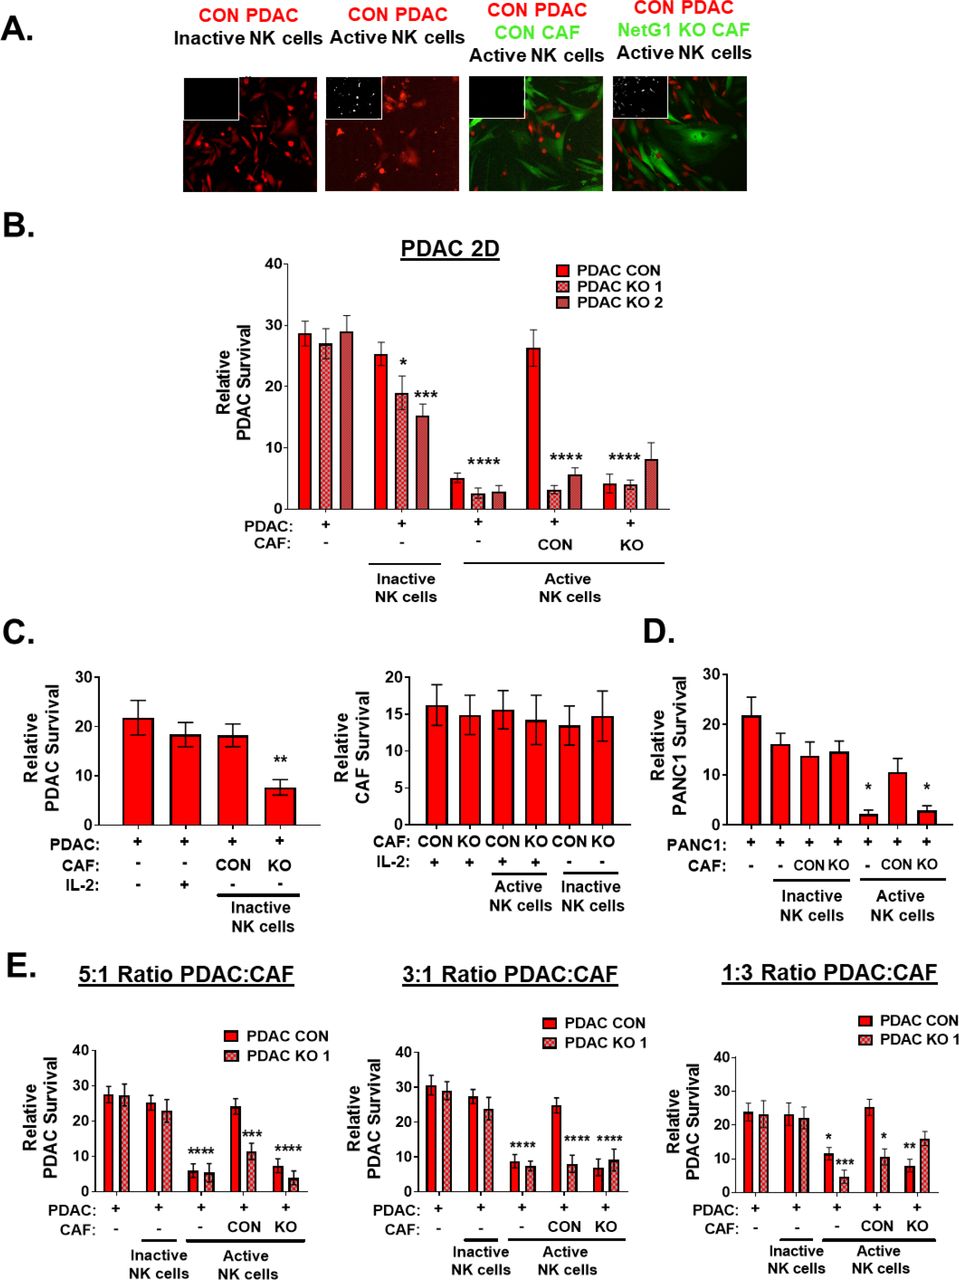
Thus far, we noticed that NetG1 expression in CAFs was critical for their pro-tumor functions, including modulation of CAF-PDAC interactions that resulted in a metabolic transfer of energy to PDAC cells, partially through a supply of glutamate and glutamine. This led us to question if NetG1 expression was a functional mediator of immunosuppression, another key feature of CAFs pro-tumorigenic effects in cancer. To explore the immunosuppressive profile of CAFs, we performed both traditional and multiplex (U-Plex) ELISAs to develop a cytokine profile that could define the immunosuppressive milieu that CAFs generate. We found that CON CAFs produce increased levels of GM-CSF (6.3 fold), IL-1β (1.5 fold), IL-8 (3.8 fold), CCL20/MIP3α (14.4 fold), and TGF-β (2.3 fold) compared to normal PSCs (Fig 4A). Strikingly, ablation of NetG1 in CAFs significantly decreased protein levels of GM-CSF (40.6 fold), IL-1β (5.2 fold), IL-8 (13.3), CCL20/MIP3α (80 fold), IL-6 (1.4 fold), and TGF-β (1.5 fold) compared to CON CAFs, with all cytokines except TGF-β dropping below normal PSC levels. On the other hand, expression of IL-2, IL-12 p70, IL-10, IFN-γ, TNF-α, and IFN-β were all below the limit of detection in all three fibroblasts (data not shown). Interestingly, we observed that IL-15 protein levels, one of the most potent NK cell activators, was up-regulated in both CON and NetG1 KO CAFs compared to normal PSCs (4 and 2.9 fold, respectively). This led us to postulate that NetG1 KO CAFs may generate a microenvironment that was not as immunosuppressive as CON CAFs, which could allow anti-tumor NK cells to more effectively kill PDAC cells. To test this, we first assayed the activation of an NK cell line, NK92, in our 3D in vitro culturing system. We performed direct cocultures of IL-2 activated NK cells with CON or NetG1 KO CAFs (CC) or in their corresponding conditioned media (CM) and measured the percentage of Granzyme B and IFNγ positive NK cells. After IL-2 treatment alone, 68.5% and 72.3% of the NK cells became positive for IFNγ and Granzyme B (i.e. activated), respectively (Fig 4B). Conversely, direct co-culture of activated NK cells with CON CAFs (CC) or with CON CAF CM abolished NK cell activation marker expression, illustrating the potent immunosuppressive potential of CON CAFs. NetG1 KO CAFs, however, were less immunosuppressive, as 12-23% of NK cells maintained IFNγ or Granzyme B expression. This result is consistent with the decreased levels of immunosuppressive cytokines generated by the NetG1 KO CAFs (Fig 4A). A similar experiment was performed using primary NK cells isolated from healthy donor blood, with IL-2/IL-12 stimulation used to induce activation, and IFNγ and CD69 were used as markers of NK cell activation. As with NK92 cells, we observed that while CM from CON CAFs inactivates primary NK cells in a dose dependent manner, NetG1 KO CAF CM was significantly less immunosuppressive at the same doses (Fig 4C). We next tested if the activity of NK92 cells correlated with their functional ability to kill PDAC cells. To this end, we performed a control experiment co-culturing inactive and active NK cells with CON or NGL-1 KO PDAC cells. Accordingly, active NK cells were 2.2-3.2 fold more effective in killing both CON and NGL-1 KO PDAC cells than inactive NK cells, independent of PDAC NGL-1 expression (Fig 4D). To probe how CAFs effect the ability of NK cells to kill PDAC cells, we co-cultured CON or NetG1 KO CAFs with CON or NGL-1 KO PDAC cells in the presence of inactive or active NK cells. We anticipated that CON CAFs would protect PDAC cells better against NK cell induced death, based on their immunosuppressive cytokine profile (Fig 4A) and inhibitory capacity on NK cell activation (Fig 4B). Indeed, active NK92 cells were prevented from killing PDAC cells in the presence of CON CAFs, and this protection was decreased by 38-58% when cultured with NetG1 KO CAFs (Fig 4E). Intriguingly, even when inactive NK cells were in the presence of NetG1 KO CAFs, they were 79-100% more effective at eliminating PDAC cells compared to co-culture with CON CAFs, suggesting that NetG1 KO CAFs could partially activate NK92 cells.

A. Quantification of U-Plex (multiplex ELISA; GM-CSF, IL-1β, CCL20, IL-6, IL-8) and traditional ELISAs (IL-15, TGF-β) of assorted cytokines with immunomodulatory or immunoattractive potentials, detected in the CM of normal PSCs, CON CAFs, or NetG1 KO CAFs, growing in 3D alone. N= 6 biological replicates. * compared to normal PSCs. B. Quantification of the % of NK92 cells positive for markers of activation (IFNγ and Granzyme B) determined by flow cytometry after IL-2 pre-activated NK92 cells (8x10⁴) were in direct co-culture (CC) with CON or NetG1 KO CAFs (2x10⁴) or treated with their conditioned media (CM) for 16 hours. * compared to CON CAF CC. C. Primary NK cells (105) were isolated from healthy donors, pre-activated with IL-2/IL-12, subjected to co-culture with CM from CON or NetG1 KO CAFs for 16 hours, and their activation status was determined by flow cytometry, using IFNγ and CD69 as markers. Expression of markers was normalized to the positive control (IL-2 alone). * comparison between the CON and KO at each % of CM. D. RFP+ CON or NGL-1 KO PDAC cells (2x10⁴) were co-cultured in 3D with inactive or active NK92 cells (8x10⁴) for 48 hours and PDAC cell survival was imaged (left) and quantified (right). * compared to CON with active NK cells. E. RFP+ CON or NGL-1 KO PDAC cells (2x10⁴) were co-cultured in 3D with GFP+ CON or NetG1 KO CAFs (2x10⁴) and with inactive or active NK92 cells (8x10⁴) for 48 hours and PDAC survival was imaged (left) and quantified (right). * compared to CON PDAC/CON CAF with active NK cells. (D) and (E) were normalized to CON PDAC/CON CAF with active NK cells. T-test or One-Way ANOVA, Dunnett’s multiple comparison test. *p<0.05, **p<0.01, ***p<0.001; ****p<0.0001.
The NK92 killing assay was replicated in 2D culturing conditions with the PDAC cells and PANC-1 cells, and the results were very similar to 3D conditions, as the KO of NetG1 in CAFs resulted in a significant decrease in CON PDAC and CON PANC-1 survival against NK cell induced death compared to CON CAF conditions (6.4 and 3.6 fold, respectively) (Sup Fig 5A-D). Interestingly, in 2D conditions, NGL-1 KO cells survived less (5.7-8.2 fold) when co-cultured with either CON or NetG1 KO CAFs, suggesting that NetG1/NGL-1 cell-cell contacts were important for protection against NK cell induced death. To mimic different tumor cell type compositions, we co-cultured various ratios of PDAC cells to CAFs (5:1, 3:1, 1:3) and performed the NK cell killing assay. As the number of CAFs increased, PDAC cell survival increased, indicating a direct effect of CAF numbers on NK cell killing function (Sup Fig 5E).

2D NK cell assay: RFP+ CON or NGL-1 KO PDAC cells were co-cultured 1:1 with inactive or activated NK92 cells (8x10⁴) alone, or with GFP+ CON and NetG1 KO CAFs for 8 hours. PDAC cell survival was assessed. A. Representative images of PDAC cells (red) and CAFs (green) from the various assay conditions. White insert in the top left-hand corner shows dead cell channel, marked by Sytox blue. B. Quantification of the 2D NK cell killing assay in (A). * compared to CON PDAC/CON CAF cultured with active NK92 cells. C. Quantification of the control conditions used in the experiment performed in (A). * compared to CON PDAC/CON CAF cultured with active NK92 cells. D. The same NK cell assay performed in (A), but with PANC-1 cells instead of KRAS (PDAC) cells. * compared to CON PANC-1/CON CAF cultured with active NK92 cells. E. The NK cell killing assay was performed as in (A), but with the indicated ratios of PDAC:CAF (5:1, 3:1, 1:3). * compared to CON PDAC/CON CAF cultured with active NK92 cells, for each ratio. Graphs show mean quantification and standard errors of the three independent experiments. One-way ANOVA, Dunnett’s multiple comparison test, * p<0.05; ** p<0.01; *** p<0.001; **** p<0.0001.
Overall, NetG1 expression in CAFs creates an immunosuppressive microenvironment that inactivates NK cells and protects PDAC cells from NK cell mediated death. Loss of NetG1 expression in CAFs partially reverts the immunosuppressive capacity of CAFs, allowing NK cells to maintain their activity and eliminate PDAC cells. Moreover, the microenvironment created by CAFs (ECM) plays an important role in the support of PDAC survival, highlighting the differential effects of 2D culture vs. 3D culture.
IL-15 expression maintains functionality of NK cells in NetG1 KO CAF microenvironment
While deletion of NetG1 in CAFs led to a decrease in the expression of immunosuppressive cytokines, IL-15 levels remained significantly higher than that of normal PSCs (Fig 4A). We hypothesized that the downregulation of immunosuppressive cytokines, coupled to the maintenance of IL-15 expression, was partially responsible for the observed anti-tumor phenotype of the NetG1 KO CAFs. Thus, we repeated the NK cell killing assay in 2D and 3D, co-culturing CON or NetG1 KO CAFs with CON or KO PDAC cells, in the presence of a neutralizing IL-15 antibody or IgG isotype control. Indeed, neutralization of IL-15 resulted in a 2.4 and 1.4 fold (2D and 3D, respectively) increase in PDAC survival compared to IgG treated conditions, suggesting that IL-15 was partially responsible for the anti-tumor microenvironment created by NetG1 KO CAFs (Fig 5 A-B).

A. NK cell killing assay in 2D, where RFP+ CON or NGL-1 KO PDAC cells (2x10⁴) were co-cultured with CON or NetG1 KO CAFs (2x10⁴) and active NK92 cells (8x10⁴) for 6 hours in the presence of isotype control IgG or IL-15 neutralizing antibody. Graphs depict PDAC survival, relative to the CON CAF/CON PDAC condition treated with IgG (dotted red line). B. Same assay as in (A), but the co-culture is performed in 3D for 48 hours C. IL-2 pre-activated NK92 cells (8x10⁴) were cultured in the absence or presence of glutamate (50 nM, 50 μM, 150 μM) in suspension overnight, and NK92 cell activation (% IFNγ positive cells) was quantified. * compared to inactive NK92 cells with 0 mM Glu. D. NK92 cells (8x10⁴) were added to a 3D co-culture of RFP+ CON or NGL-1 KO PDAC cells (2x10⁴) with CON or NetG1 KO CAFs (2x10⁴) in the absence or presence of glutamate (150 uM), and PDAC survival was measured after 48 hours. Results are normalized to the CON CAF/CON PDAC condition exposed to inactive NK cells without glutamate. One-Way ANOVA, Dunnett’s multiple comparison test. *p<0.05, **p<0.01, ****p<0.0001.
Glutamate addback confers immunosuppressive properties to NetG1 KO CAFs
Due to the difference in the production of glutamate detected between CON CAFs and NetG1 KO CAFs (Fig 3F), combined with the emerging role that metabolites play in modulating immune function (Buck et al., 2017; Gardiner and Finlay, 2017; Renner et al., 2017), we next explored the effect of glutamate on NK cell activation and anti-tumor function. Addition of glutamate at CON CAF levels (150 μM) or NetG1 KO CAF levels (50 μM) to IL-2 activated NK92 cells had a minimal effect on NK cell activation, as determined by the % IFNγ positive cells (Fig 5C), demonstrating that glutamate alone does not impart an immunosuppressive effect on NK cells. We then postulated that perhaps CAF derived glutamate metabolites (i.e. CAF processing of glutamate) could suppress NK cell killing ability, as it is known that the glutamate metabolite γ-aminobutyric acid (GABA) has potent immunosuppressive properties (Jin et al., 2013). Therefore, we performed the NK92 cell killing assay in all co-culture combinations of CAFs and PDAC cells, in the background of either 0 μM or 150 μM glutamate. As in Fig 4E, in control conditions with no glutamate added, CON CAFs protected both CON or KO PDAC cells 52-65% better than NetG1 KO CAFs (Fig 5D). On the other hand, when 150 μM was introduced into the media, PDAC cell survival was rescued to control levels, indicating that NetG1 KO CAFs may still have some of the machinery required to convert exogenous glutamate into immunosuppressive metabolites. Finally, addition of glutamate had no effect on PDAC survival when CAFs were absent from the co-culture, in line with the findings from Fig 5C that glutamate alone did not suppress NK92 cell activation in response to IL-2. Thus, we propose that CAFs are immunosuppressive not only through the release of cytokines, but also through glutamate-dependent metabolism.
Loss of NGL-1 from murine PDAC cells severely stunts tumorigenesis in vivo
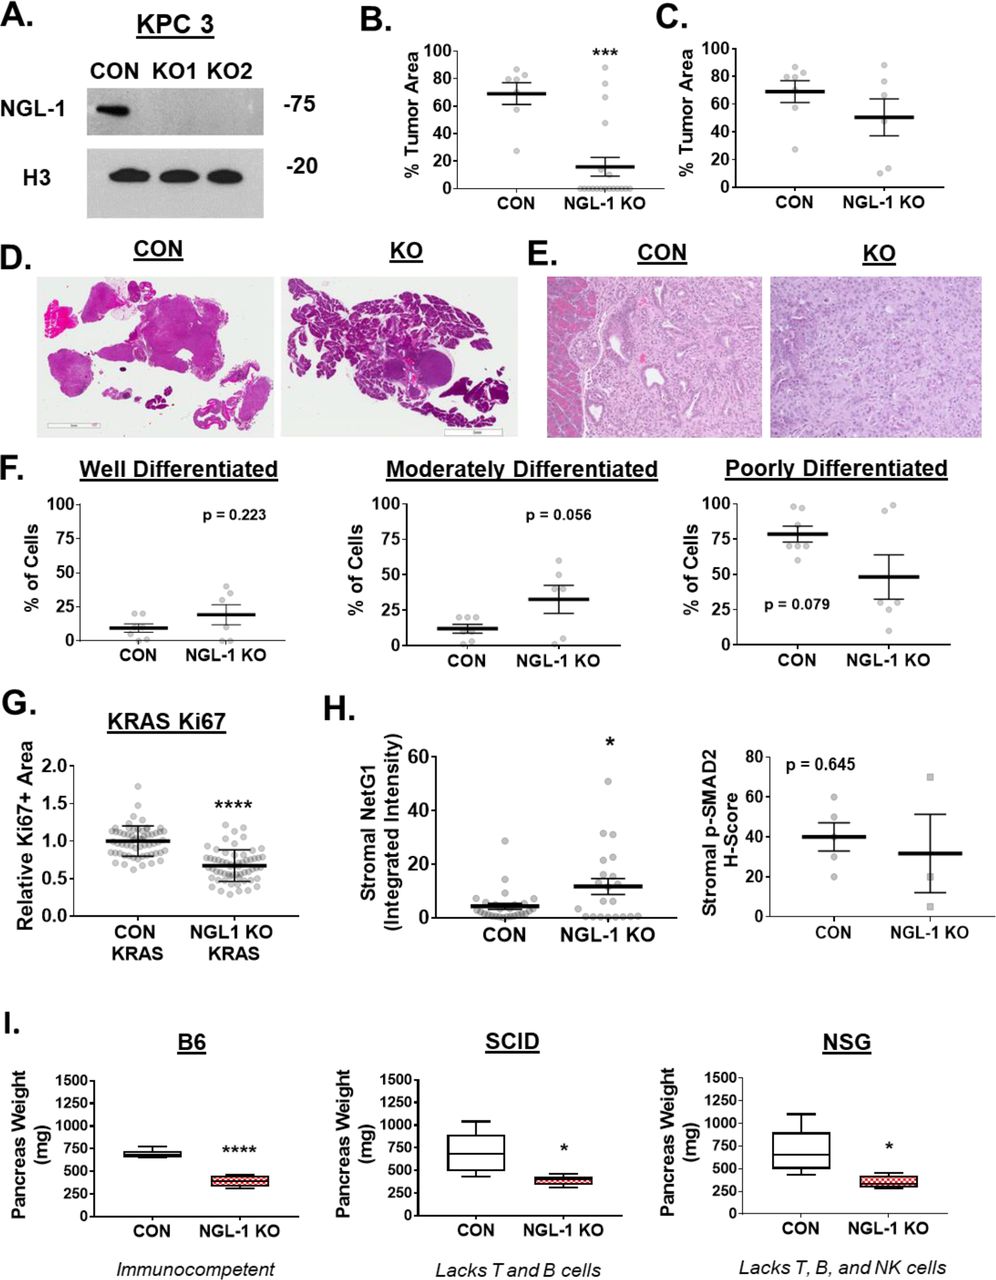
With the promising data in vitro, we decided to directly test whether disruption of NetG1/NGL-1 axis would prevent/delay tumor progression in vivo. First, we explored NetG1 expression in the stroma of LSL-KrasG12D/+; Pdx1-Cre (KC) mice, which readily develop precancerous lesions known as PanINs (Pancreatic Intraepithelial Neoplasia) and eventually full blown invasive PDAC (Hingorani et al., 2003). We observed that as the KC mice age and develop PanINs, stromal (Vimentin+/EpCAM and Cytokeratin-) NetG1 expression was detected in pancreatic tissue as early as 12 weeks and at 16 weeks (Fig 6A). Moreover, we generated two murine PDAC cell lines, isolated from the more aggressive KPC model (LSL-KRASG12D, LSL-TP53-/-, PDX1-Cre) (Hingorani et al., 2005), one with low NGL-1 expression with an average survival time of 7.5 weeks after orthotopic injection into C57BL/6 mice (KPC4B; not shown), and one with high expression of NGL-1 with an average survival time of 3.5 weeks after orthotopic injection (KPC3; not shown) (Fig 6B). This indicated that mice with pancreatic lesions may have the NetG1/NGL-1 axis intact, with stromal expression of NetG1 and tumoral expression of NGL-1. Based on the in vitro and human data, we hypothesized that the NetG1/NGL-1 axis would be critical for tumorigenesis. Therefore, using CRISPR/Cas9, we generated two NGL-1 KO murine PDAC cell lines and one control line from the aggressive KPC3 cells (Sup Fig 6A) and injected them orthotopically into C57BL/6 mice (CON, KO1, KO2). After 3.5 weeks, all mice were sacrificed and tumorigenesis was gauged using multiple parameters. First, mice injected with CON KPC3 cells (CON group) had a tumor incidence of 100% (7/7) with a mean pancreas weight of 1371 ± 262.1 mg, while the groups injected with NGL-1 KO1 and KO2 KPC3 cells (NGL-1 KO group) had an incidence of 22.2% (2/9) and 40% (4/10) with a mean pancreas weight of 174.4 ± 45.3 mg and 311 ± 81.5 mg, respectively (Fig 6C). In addition, representative MRI images of the pancreas reveal the expansion of the pancreas in CON group over 3 weeks, while the pancreas from the NGL-1 KO group seemingly remains a normal size over that time span (Fig 6D). Analyzing the pancreatic tissue further, 69% of CON group pancreata were composed of tumor areas, while 16% of NGL-1 KO group pancreata contained tumor cells (Sup Fig 6B). Because only 6 animals developed tumors between the two groups injected with NGL-1 KO clones, we performed the following analyses pooling both NGL-1 KO groups. Of the 6 pancreata that presented tumors in the KO groups, 51% of the area was considered tumor, compared to the 69% in the CON group (Sup Fig 6B-D). Moreover, tumors from KO group had a trend towards being more differentiated than those from the CON group (p = 0.079), as 79% of the cells from CON tumors were classified as poorly differentiated, while only 48% of the cells from KO tumors could be classified as poorly differentiated (Sup Fig 6E-F), indicative of less aggressive tumors overall. Consequently, NGL-1 KO tumors also proliferated slower, as measured by Ki67 staining, and had higher rates of apoptosis, as measured by TUNEL staining (Fig 6E). These results were in line with less Ki67 staining in human NGL-1 KO PDAC cells compared to CON PDAC cells in vitro (Sup Fig 6G). Unexpectedly, analysis of the stroma of 5 CON tumors and 3 NGL-1 KO tumors revealed that stromal NetG1 actually increased in NGL-1 KO tumors compared to CON tumors, suggesting a compensatory stromal reaction that may have supported tumor growth in the 6 KO mice (out of 19 injected) (Sup Fig 6H). Conversely, p-SMAD2 expression (correlates with pro-tumor stroma) remained unchanged between tumor groups (Sup Fig 6H). Nevertheless, because the tumor incidence was significantly lower in the mice that received NGL-1 KO cells, we postulated that disruption of the interaction between tumoral NGL-1 and stromal NetG1 would be mediated mostly through a reduction in stromal metabolic support for tumor cells, or increased immunosuppression. In order to evaluate the impact of the immune system, orthotopic injections of CON or NGL-1 KO KPC3 cells into SCID (lacks T and B cells) and Nod SCID Gamma (NSG; lacks T, B, and NK cells) were performed and compared to C57BL/6 mice. All animals injected with CON cells presented heavier pancreata than those injected with NGL-1 KO cells, independently of the immune backgrounds (Sup Fig 6I). These results reinforce the idea that when NGL-1 is lacking in tumor cells, and the NetG1+ stroma remains intact, the likely cause for stunted tumorigenesis in this context is due to two factors: 1.) lack of CAF derived metabolic support of PDAC cells; 2.) cell intrinsic effects on the tumor cells without NGL-1 expression (slower proliferation, less uptake of nutrients). Therefore, inhibition of one arm of the NetG1/NGL-1 axis was sufficient to dramatically impede tumor initiation and progression.

A. Western blot of NGL-1, demonstrating knockout in two independent clones of KPC3 murine PDAC cells. H3 was used as a loading control. B. Quantification of the % area that tumor cells occupy in the pancreata of mice injected with CON KPC3 or NGL-1 KO KPC3 cells (pooled KO mice together). C. Same quantification as in (B), but only considering the pancreata that had histological evidence of tumor cells (CON, N = 7; NGL-1 KO, N = 6). D. Representative images of the total pancreas quantified in (C) E. Representative images (20x) of the pancreatic tissue from CON or NGL-1 KO injected mice, demonstrating morphology indicative of differentiation status of tumor cells. F. Quantification of the differentiation status of tumors within the pancreatic tissue that formed tumors (CON, N = 7; KO, N = 6), as measured by % cells that were classified as well differentiated, moderately differentiated, or poorly differentiated by a blinded pathologist. G. Quantification of the relative Ki67 staining in CON KRAS and NGL-1 KO KRAS grown in 3D in CON CAF ECMs. H. Quantification (integrated intensity) of stromal NetG1, pFAK and p-smad2, in 5 murine CON and 3 NGL-1 KO tumor tissues, as determined by SMIA. I. Graphs display the pancreas weights of B6, SCID (lacks T and B cells), or NSG (lacks T, B, and NK cells) mice (n=5, for each cell type, in each background) injected with 106 CON KPC3 or NGL-1 KO #2 cells. Animals were sacrificed after 3.5 weeks and pancreas weight (mg) was assessed. T-Test, * p<0.05; *** p<0.001; **** p<0.0001.

A. SMI was conducted on murine pancreatic tissue from wild type C57BL/B6 (normal) or KC mice (12 weeks or 16 weeks old). (TOP Panel) Epithelium (orange), stroma (cyan), and nuclei (purple) were stained and used as “masks” to query stromal expression of NetG1 (white, BOTTOM Panel). Cyan boxes are stromal regions that were expanded in the panel below to demonstrate NetG1 staining in the stroma at different stages of disease progression. B. Representative western blot of NGL-1 in two different murine PDAC cell line clones derived from KPC mice (4B and 3). H3 was used as a loading control. Note the time for tumor progression in weeks listed above the lanes. C. C57BL/6 mice were injected orthotopically with CON or NGL-1 KO KPC3 cells (106) and mice were sacrificed after 3.5 weeks. Graph depicting quantification of the weight of pancreata from each mouse group. Red numbers above the bars represent tumor incidence over total mice for each group. Images below display representative pancreata from each condition. D. Representative MRI images for pancreata injected with CON or NGL-1 KO cells, taken at 1, 2, and 3 weeks after injection. Yellow outline marks the pancreas in each image. E. (LEFT) Representative images of Ki67 (Red) and TUNEL (green) staining of tumors that developed from mice injected with CON KPC3 or NGL-1 KO KPC3 cells. Nuclei is stained by DAPI (blue). (RIGHT) Quantification of Ki67 or TUNEL staining (integrated intensity), relative to the control PDAC group. N= 7 CON and 6 pooled KO tumors. One-Way ANOVA, Dunnett’s multiple comparison test. *p<0.05, **p<0.01, ****p<0.0001.
Discussion
The present study has uncovered two previously unknown targets for the potential treatment of pancreatic cancer: the neural synaptic stabilizing proteins NetG1 and NGL-1. Here, we demonstrated the up-regulation of these proteins in different cell compartments in patient tissue, as well as their importance in governing key hallmarks of PDAC in vitro and in mouse models. NetG1 overexpression was evident in cancer associated fibroblasts, while NGL-1 was upregulated in PDAC cells, and the ectopic expression of these proteins drove heterotypic cellular interactions, resulting in a nutrient transfer from CAFs to PDAC cells. Interestingly, NetG1 and NGL-1 had cell autonomous functions as well. For example, ablation of NetG1 in CAFs caused a decrease in cytokine production, an alteration of glutamine/glutamate secretion, and a reversion to a patient protective CAF phenotype. NGL-1 KO in PDAC cells resulted in reduced proliferative capacity in vitro and the diminished ability to uptake material from their environment. Importantly, orthotopically injected NGL-1 KO murine PDAC cells had a dramatically reduced incidence and tumorigenicity, demonstrating the importance of this axis in vivo. Thus, our data have revealed a complex signaling axis that controls cell-cell interactions, as well as cell intrinsic capabilities, that shapes the tumor microenvironment.
CAFs are the major cell type present in the PDAC microenvironment, yet their role in PDAC tumorigenesis is incompletely understood. This study aimed to characterize the functions of NetG1/NGL-1 in the PDAC microenvironment, with an emphasis on the contribution of the stroma. CAFs regulate three critical hallmarks of PDAC: 1.) the desmoplastic reaction; 2.) collapse of blood vessels, resulting in nutrient deprivation; 3.) vast immunosuppression of antitumor immune cells (Fu et al., 2018; Ryan et al., 2014). Our results confirm that all three hallmarks are interconnected, and that NetG1 expression in CAFs largely controls the PDAC microenvironment.
The PDAC microenvironment is nutrient deprived, due to the collapse of blood vessels, and this forces PDAC cells to seek out alternative sources of fuel (Kamphorst et al., 2015). CAFs represent an excellent potential source of nutrients in PDAC, as they can account for up to 90% of the tumor mass (Ricci et al., 2005). Recent studies have demonstrated that CAFs supply PDAC cells with important metabolites, through exosomes (Zhao et al., 2016) and amino acid secretion (Sousa et al., 2016). Moreover, the ECM has been shown to be an important source of fuel for cancer cells (Muranen et al., 2017), which potentially positions the scaffolding produced by CAFs in the PDAC microenvironment as vital source of fuel for PDAC cells. Interestingly, it has long been recognized that patients with pancreatic cancer have elevated serum levels of glutamate (Castro-Bello et al., 1976), with a corresponding depletion of serum glutamine levels (Roux et al., 2017). PDAC cells have a high capacity to utilize glutamate, by catabolizing glutamine through the enzyme glutaminase (GLS), in a process known as glutaminolysis (Lyssiotis and Kimmelman, 2017). While it is known that inhibition of GLS can decrease cancer cell growth in vitro and in vivo in a number of cancer models (Jin et al., 2016; Xiang et al., 2015), a recent study using a potent small molecular inhibitor of GLS displayed no efficacy in preclinical mouse models due to up-regulation of compensatory glutamine procuring pathways in PDAC cells (Biancur et al., 2017). Additionally, it has also been demonstrated that the conditions used in cell culture provide an overabundance of nutrients that does not accurately mimic the tumor microenvironment in vivo, and culturing cells in a medium with nutrients at levels more representative of tumors in vivo resulted in tumor cells with a decreased dependence on glutamine, due to increased utilization of cystine (Muir et al., 2017). An alternative/complementary hypothesis is that CAFs can overcome tumor specific targeting therapies by supplying key glutamine/glutamate metabolites to PDAC cells. Indeed, glutamine synthetase (GS; conversion of glutamate to glutamine) is up-regulated in CAFs in ovarian cancer compared to their normal counterparts, and inhibition of stromal GS resulted in decreased tumor development (Yang et al., 2016). Thus, consideration of the tumor microenvironment will be critical to effectively target tumor metabolism, and due to this fact, we performed many experiments in serum and glutamine free conditions to more accurately replicate the PDAC tumor microenvironment.
Here, we found that NetG1+ CAFs exchange material with PDAC cells, as determined by GFP transfer from CAFs to PDAC, and that this exchange is dependent upon NetG1 expression in CAFs and NGL-1 expression in PDAC cells (Fig 2). This finding prompted us to perform a screen comparing amino acid production and secretion in normal PSCs, NetG1+ CAFs, and NetG1 KO CAFs (Sup Fig 3). From the screen, the top two hits were glutamine and glutamate, as NetG1+ CAFs generated elevated levels of extracellular glutamine and glutamate, compared to normal PSCs or NetG1 deficient CAFs (Fig 3F), with a concomitant decrease in glutamine synthetase (GS) and vesicular glutamate transporter 1 (VGlut1) protein levels in NetG1 KO CAFs compared to CON CAFs (Fig 3G). Interestingly, VGlut1 is present in glutamatergic synapses in neurons, where it loads glutamate into vesicles (Liguz-Lecznar and Skangiel-Kramska, 2007), and VGlut1 expression in neurons was shown to be dependent on NetG1 expression (Song et al., 2013), in line with our data in CAFs, where the KO of NetG1 resulted in loss of VGlut1 expression. Functionally, while exogenous glutamine and glutamate could partially rescue NGL-1+ PDAC cell survival from metabolic stress, the same was not true for NGL-1 KO PDAC cells, as glutamine and glutamate had no effect on cell survival under the same serum free/glutamine free conditions (Fig 3I). Similarly, CAF CM media only had a modest rescue of NGL-1 KO PDAC cell survival, while significantly improving cell survival in PDAC cells expressing NGL-1, suggesting that NGL-1 may more broadly control cellular uptake of metabolites in PDAC cells. An additional interpretation of the data suggests that CAF driven metabolism of glutamine and glutamate may be required to first process these amino acids into other metabolites that PDAC cells, especially NGL-1 deficient PDAC cells, could utilize more effectively. Further analysis into the expression and activity of receptors that mediate uptake of extracellular amino acids in PDAC, such as glutamine and glutamate, as well as TCA cycle metabolites produced by CAFs, will be necessary to gain more insight into the general uptake ability of PDAC cells.
Another hallmark of the PDAC is an extremely immunosuppressive microenvironment, and many studies have confirmed a major role for CAFs in generating factors, such as secreted cytokines and chemokines (Harper and Sainson, 2014; Wu et al., 2017), that contribute to this environment, as well as physically sequestering anti-tumor immune cells (Ene-Obong et al., 2013). Furthermore, compared to many other tumor types, PDAC has one of the lowest mutational burdens and display of neoantigens (Chalmers et al., 2017; Evans et al., 2016), which correlates directly with low response rates to immune checkpoint inhibitors, such as PD-1 (Yarchoan et al., 2017). Collectively, these findings suggest that even if cytotoxic T-cells could penetrate the tumor and CAF driven immunosuppression was inhibited, the lack of tumor antigens would render them unable to kill PDAC cells effectively. However, the innate cytotoxic immune cell—natural killer (NK) cell—can destroy PDAC cells independent of antigen presentation, and thus represents an attractive anti-tumor cell type for PDAC therapy (Van Audenaerde et al., 2018). Additionally, NK cells play a natural role in the pancreas which is to remove activated stromal cells during acute fibrosis in wound healing by a process known as nemosis (Vaheri et al., 2009), but are unable to accomplish this in setting of PDAC, due to the overwhelming numbers of CAFs and immunosuppressive signals. Thus, reverting the immunosuppressive phenotype of CAFs could allow for NK cell stimulating therapies (e.g. IL-15 supplementation) (Van Audenaerde et al., 2017) to clear CAFs and PDAC cells. In the present work, we confirmed that CAFs produce several immunosuppressive cytokines (IL-6, IL-8, TGF-β), as well as a number of chemokines known to attract immunosuppressive immune cells (GM-CSF, CCL20, TGF-β) (Fig 4A). Intriguingly, we showed that CAFs, compared to normal PSCs, upregulate IL-15, a potent stimulator of NK cell activity. Functionally, however, IL-15 activity is likely overwhelmed by the greater number of immunosuppressive factors secreted by CAFs, as CAFs significantly inhibited NK cell activation and function (Fig 4B-E, Sup Fig 5). On the other hand, NetG1 KO CAFs exhibited reduced levels of all immunosuppressive factors tested, compared to CON CAFs, while maintaining IL-15 expression. We hypothesized that because the balance of immunosuppressive cytokines was now shifted towards a profile that would likely allow IL-15 to stimulate NK cell activation, allowing them to kill PDAC cells to a higher degree. Indeed, we saw that NK cells co-cultured with NetG1 KO CAFs or their CM, remained partially activated, and could kill PDAC cells more efficiently than NK cells co-cultured with NetG1 + CAFs. Furthermore, we demonstrated that IL-15 was partially responsible for NK cell killing ability, as neutralizing antibodies against IL-15 restored protection against NK cell induced death (Fig. 5). In this context, unlike the metabolic stress experiments, NGL-1 status on PDAC cells had nearly no effect on NK cell ability to kill PDAC cells in 3D. In 2D, however, NGL-1 expression on PDAC was critical for CAF mediated protection of PDAC cells from NK cell induced death, illustrating the importance of ECM effects in the PDAC microenvironment. Moreover, it is interesting to note that NK cell killing assays could be completed in 6-8 hours in 2D conditions, while 48 hours was required to complete assays performed in 3D, again highlighting the importance of ECM imparted effects that are more representative of the in vivo situation, where the time scales are increased (Deguine et al., 2010). Collectively, the data demonstrate that NetG1 in CAFs shapes the immunosuppressive microenvironment in PDAC, and its ablation reprograms CAFs to an anti-tumor phenotype (i.e. presenting low constitutive α5α1-integrin and pFAK), allowing NK cells to eliminate cancer cells.
In recent years, there has been growing interest in linking microenvironmental metabolites with immune cell function (Buck et al., 2017), and CAFs in the PDAC microenvironment are important players in this process (Lyssiotis and Kimmelman, 2017). For example, CAF derived prostaglandin E2 (PGE2), an immunomodulatory lipid, has been shown to inhibit NK cell antitumor function in a number of models (Balsamo et al., 2009; Li et al., 2012; Li et al., 2013). An exciting link between metabolism and immune cell function was observed in our study, as addition of exogenous glutamate to our co-culture system resulted in diminished NK cell induced killing of PDAC cells (Fig 5D). Conversely, adding glutamate at levels produced by CON CAFs to NK cells alone did not reduce NK cell activation (Fig 5C). Moreover, glutamate added to PDAC cells alone under serum free/glutamine free conditions only partially rescued survival for CON PDAC cells and not at all for NGL-1 KO cells, while CAF CM rescued both cell types. Thus, we speculate that it is CAF metabolism of glutamate into TCA cycle metabolites that drives both PDAC survival and immunosuppression. GABA (γ-Aminobutyric acid) is a neurotransmitter that is derived from glutamate, converted by the enzymes glutamate decarboxylase 1 and 2 (GAD1/2) (Zhou and Danbolt, 2013). GABA has potent immunomodulatory properties, and has been shown to inhibit T-cell cytokine production, proliferation, and infiltration into sites of inflammation (Jin et al., 2013). In addition, glutamate has been demonstrated to suppress activated murine lymphocytes in vitro (Droge et al., 1988). Although there is little known about the effects of glutamate and its derived metabolites on NK cells, they do express many of the receptors of these metabolites, and thus have the potential to respond to them (Boldyrev et al., 2005). Future work could explore gain/loss of function experiments of TCA cycle enzymes in CAFs and then test their immunosuppressive capacity, as well as explore the effect of the various TCA cycle metabolites on anti-tumor immune cell function in an effort to gain clearer mechanistic insight into the role CAF metabolism plays in the PDAC microenvironment.
Next, we took our promising in vitro findings demonstrating the effects of the NetG1/NGL-1 axis in the PDAC microenvironment and studied the effects of ablation of one arms of the axis, NGL-1, in murine orthotopic models of PDAC. We saw that deletion of NGL-1 in two distinct clones of murine PDAC cells resulted in significantly decreased tumor incidence and aggressiveness of tumors (Fig 6 and Sup Fig 6). This led us to postulate that the diminished tumorigenicity of the NGL-1 KO cells was likely due to their inability to accept nutrients from CAFs (NetG1/NGL-1 connection broken) or scavenge extracellular material (lower uptake of GFP from material transfer assay), and not due to the modulation of CAFs directly. Thus, we anticipated that there would be no changes in immunosuppression in the tumors that form. Indeed, injection of murine PDAC cells into immunocompromised mice did not alter the course of disease compared to immunocompetent mice (Sup Fig 6), suggesting our hypothesis that the disruption of metabolic aspect of the NetG1/NGL-1 axis was responsible for the decrease in tumorigenesis, when NGL-1 is absent in tumor cells. Thus, by modulating only one arm of the NetG1/NGL-1 axis, we could dramatically stunt tumorigenesis in vivo. It is possible that by disrupting both the metabolic and immune aspects of PDAC microenvironment by also deleting stromal NetG1, that tumor development will be diminished even further. To confirm these possibilities, these types of experiments should be conducted in future studies.
A major question in the field is the role CAFs play in PDAC tumorigenesis. Studies have demonstrated that CAFs are tumor promoting (Djurec et al., 2018; Hwang et al., 2008), while others have revealed tumor restrictive roles (Özdemir BC, 2014; Rhim et al., 2014). One possible explanation for the seemingly paradoxical findings is that not all CAFs are created equally, as it is now appreciated that there is great heterogeneity in the fibroblastic population of tumors (Ohlund et al., 2014). Recent studies have revealed multiple CAF subsets in a variety of tumors (Costa et al., 2018; Costea et al., 2013; Franco-Barraza et al., 2017; Moffitt et al., 2015; Ohlund et al., 2017), each with different functions within the tumor microenvironment. Our group has identified two distinct CAF subsets in PDAC that are predictive of patient outcome (Franco-Barraza et al., 2017). One CAF phenotype displayed low levels of p-SMAD2/3, pFAK, and active α5β1-integrin and correlated with better patient prognosis, while the other CAF phenotype displayed high levels of p-SMAD2/3, pFAK, and active α5β1-integrin and correlated with poor patient prognosis (Franco-Barraza et al., 2017). In this study, we build upon our established CAF phenotypes by placing NetG1 under the pro-tumorigenic phenotype. We demonstrated that NetG1 is upregulated in CAFs (Fig 1), deletion of NetG1 in CAFs results in a decrease in the pFAK and active α5β1-integrin (Sup Fig 1), and NetG1 drives CAF tumorigenic functions, such as metabolic support (Fig 3 and Sup Fig 3) and suppression of anti-tumor immunity (Fig 4 and Sup Fig 5). We now propose that NetG1+ CAFs fall within the pro-tumorigenic CAF category, which we term C2, that are also pFAK and active α5β1-integrin high (Fig 7). Accordingly, we define the C1 phenotype as a CAF that displays low levels of NetG1, pFAK, active α5β1-integrin and is tumor restrictive (“normalized”). Thus, C2 CAFs functionally support PDAC cell survival, while C1 CAFs fail to supply PDAC cells with nutrients and allow NK cells to kill PDAC cells. These findings help explain how CAFs can be tumor restrictive in some settings, while tumor promoting in others, highlighting the need to fully characterize CAF populations (markers and function) in order to develop more effective therapeutics. For example, systemic pFAK inhibition in a variant of the KPC mouse model, reverted desmoplastic phenotype of tumors, namely immunosuppression, which improved immunotherapeutic responses (Jiang et al., 2016). Our new model is summarized in Fig 7.

A. C1 CAFs express lower levels of NetG1, pFAK, and active-α5β1 integrin. The lack of NetG1 expression prevents C1 CAFs from supporting PDAC cells in nutritionally poor conditions, as they intrinsically produce less metabolites for PDAC and cannot transfer them through NetG1/NGL-1 mediated interactions. Additionally, C1 CAFs secrete less immunosuppressive factors and glutamate metabolites, allowing NK cells to kill PDAC cells. B. C2 CAFs maintain elevated levels of NetG1, pFAK, and active-α5β1 integrin. High NetG1 expression allows C2 CAFs to interact with PDAC cells that express the NetG1 binding partner, NGL-1. These interactions facilitate heterotypic cell-cell contacts that mediate the transfer of nutrients to PDAC cells, increasing their survival in the harsh PDAC microenvironment. Moreover, NetG1 CAFs intrinsically produce elevated levels of immunosuppressive factors and glutamate metabolites, which render NK cells unable to eliminate PDAC cells. Thus, NetG1 controls CAF cell autonomous and reciprocal functions.
Overall, we have identified two new potential therapeutic targets, NetG1 and NGL-1, for a devastating disease, in which there are no effective therapeutic interventions. Additionally, we have characterized two phenotypes of CAFs, the anti-tumor C1 and the pro-tumor C2, and by targeting NetG1 in CAFs, we can revert C2 CAFs back into tumor restrictive C1 CAFs. Thus, we offer not only a tumor cell target, but a stromal one as well, whereby ablation of these proteins affects cell intrinsic properties that promote tumorigenesis, but also disrupts tumor-stroma crosstalk that is essential for PDAC tumor development. This work will hopefully open the door for mechanistic studies into NetG1/NGL-1 mediated signaling that will potentially generate novel druggable targets.
Experimental Procedures
Reproducibility: Reagents Table
All information (manufacturer/source, RRID, website) regarding key antibodies, mouse models, chemical and biological reagents, software, and instruments has been compiled in a master file called “Reagents Table”.
Cell Culture
The PDAC cells used for the majority of the assays were the “KRAS” cells (Campbell et al., 2007), were maintained in media containing 1 part M3 Base F (INCELL, San Antonio, TX) to 4 parts Dulbeco Modified Eagle Medium (DMEM) low glucose (1 g/mL) + sodium pyruvate 110 mg/mL + 1% Penicillin-Streptomycin (10,000 U/mL; Thermo Fisher Scientific, Waltham, MA), supplemented with 5% fetal bovine serum (Atlanta Biologicals, Flowery Branch, GA). PANC-1 cells were maintained in DMEM supplemented with 5% FBS and 1% penicillin-streptomycin (P/S) (10,000 U/mL). Normal PSCs and CAFs (Franco-Barraza et al., 2017) were maintained in DMEM containing 15% FBS, 1% P/S, and 4 mM glutamine. For individual experiments, cells were cultured as described in the figure legends or methods, either with the maintenance conditions outlined above, or in DMEM without serum (serum free), or DMEM without serum and without glutamine (-). NK92 cells were maintained in Alpha Minimum Essential medium without ribonucleosides and deoxyribonucleosides supplemented with the following components: 2 mM L-glutamine, 1.5 g/L sodium bicarbonate, 0.2 mM inositol, 0.1 mM 2-mercaptoethanol, 0.02 mM folic acid, 400 units/mL IL-2, 12.5% horse serum and 12.5% fetal bovine serum.
Isolation and immortalization of patient derived fibroblasts
Fresh patient pancreatic tissue was digested enzymatically, using our established protocol (Franco-Barraza et al., 2016). Briefly, tissue was initially stored in PBS with antibiotics (P/S, Fungizone) Next, tissue was physically minced with a sterile razor blade, and was digested overnight in collagenase (2mg/mL). After a series of filtration and centrifugation steps, cells were plated on gelatin coated plates. Cells were characterized as done previously (Amatangelo et al., 2005; Franco-Barraza et al., 2017), and fibroblasts were confirmed by a lack of cytokeratin, expression of vimentin, cell shape, ability to create substantive ECM, and the presence of lipid droplets (Normal PSCs) or acquisition of lipid droplets after TGF-β signaling inhibition (CAFs). For the immortalization, cells were retrovirally transduced as previously described (Franco-Barraza et al., 2017), with the pBABE-neo-hTERT vector, which was a gift from Dr. Robert Weinberg (Addgene plasmid # 1774).
Generation of Patient Derived PDAC cell lines from patient derived xenographs (PDX)
Procedure was performed with an approved protocol from Fox Chase Cancer Center Institutional Review Board and was done as previously described (Beglyarova et al., 2016). Briefly, tumor fragments were obtained after surgery and washed in RPMI media. The washed fragments were then resuspended in 1:1 mixture of RPMI and Matrigel on ice and were implanted subcutaneously into 5-8 week old C-B17.scid mice (Taconic Bioscience). Once tumors developed to a size of at least 150 mm3, but no larger than 1,500 mm3, mice were sacrificed, and the tumors were collected. These tumors were then digested with a solution containing collagenase/hyaluronidase, and dispase (StemCell Technologies, Cambridge, MA). After several washes, dissociated PDX cells were plated in DMEM supplemented with 10% FBS, 1% penicillin/streptomycin, and 2 mM glutamine. All of the following reagents were from Thermo Fisher Scientific (Waltham, MA) and supplemented into the media: F12 nutrient mix, 5 μg/mL insulin, 25 μg/mL hydrocortisone, 125 ng/mL EGF, 250 μg/mL fungizone, 10 μg/mL gentamycin,10 mg/mL nystatin, 11.7 mmol/L cholera toxin, and 5 mmol/L Rho kinase inhibitor Y27632 (Sigma-Aldrich). After 1 month of passages, cells were lysed and subjected to western blot analysis for the detection of NGL-1 expression.
3D microenvironment preparation (CAF-derived ECM production)
Performed as previously described (Franco-Barraza et al., 2016; Franco-Barraza et al., 2017). Briefly, CON or NetG1 KO CAFs (1.25x10⁵/mL) were seeded onto crosslinked (1% (v/v) glutaraldehyde then 1M ethanolamine) 0.2% gelatin coated wells of a 24 well or 6 well plate. These cells were grown in DMEM supplemented with 15% FBS, 1% Penicillin-Streptomycin (10,000 U/mL), 4mM glutamine, and 50 μg/mL L-ascorbic acid (Sigma, St. Louis, MO), provided fresh, daily. After 5 days of ECM production, cells were lysed and extracted from ECMs using 0.5% Triton X-100 (Sigma, St. Louis, MO) supplemented with 20 mM Ammonia Hydroxide (Sigma, St. Louis, MO). The resulting cell-free ECMs were used as the 3D scaffold environment for subsequent functional assays.
Conditioned media (CM) preparation
Fibroblast CM was prepared by growing cells during 3D ECM production (see above) for 5 days and then replacing media with glutamine/serum free (-) media. Cells were allowed to condition the media for 2 days. The CM was then collected and used immediately or aliquoted and frozen at -80°C until use (for up to one month).
mRNA Microarray
RNA was isolated from two sets of patient matched normal and tumor associated fibroblasts generated in two technical repetitions. The RNA was processed by the Genomics Facility at Fox Chase Cancer Center to render differentially expressed genes between the normal and tumor associated fibroblasts. Briefly, an Agilent Technologies Gene Chip (~44,000 genes) was used and RNA was hybridized to the chip and run through the Agilent Technologies Instrument (S/N: US22502680). Raw data were processed using the Agilent Feature Extraction 9.5.1.1 Software, outputting processed data into excel spreadsheets. The data from those spreadsheets was used to generate the heat maps of the top differentially expressed genes. The full data set is available as the supplemental file: “Microarray Data”.
Quantitative Reverse Transcriptase Polymerase Chain Reaction (qRT-PCR)
The Ambion PureLink kit (Life Technologies, Carlsbad, CA) was used, following manufacturer’s instructions, to extract total RNA cells from the various experimental conditions and tested for RNA quality using a Bioanalyzer (Agilent, Santa Clara, CA). Contaminating genomic DNA was removed using Turbo DNA free from Ambion. RNA concentrations were determined with a spectrophotometer (NanoDrop; Thermo Fisher Scientific, Waltham, MA). RNA was reverse transcribed (RT) using Moloney murine leukemia virus reverse transcriptase (Ambion, Life Technologies, Carlsbad, CA) and a mixture of anchored oligo-dT and random decamers (Integrated DNA Technologies, Skokie, Illinois). Two reverse-transcription reactions were performed for each biological replicate using 100 and 25 ng of input RNA. Taqman assays were used in combination with Taqman Universal Master Mix and run on a 7900 HT sequence detection system (Applied Biosystems, Foster City, CA). Cycling conditions were as follows: 95°C, 15 min, followed by 40 (two-step) cycles (95°C, 15 s; 60°C, 60 s).
Ct (cycle threshold) values were converted to quantities (in arbitrary units) using a standard curve (four points, four fold dilutions) established with a calibrator sample. Values were averaged per sample and standard deviations were from a minimum of two independent PCRs. Polymerase (RNA) II (DNA directed) polypeptide F (POLR2F) was used as internal control. Identification numbers of commercial assays (Life Technologies, Carlsbad, CA) and sequences of the NTNG1 primers (FW and RV) and probe for the POLR2F assay are as follows:
GGAAATGCAAGAAGAATTATCAGG (forward),
GTTGTCGCAGACATTCGTACC (reverse),
6fam-CCCCATCATCATTCGCCGTTACC-bqh1 (probe)
SDS-PAGE and Western Blot Analysis
Cell lysates were prepared by adding 150 μL standard RIPA buffer to 6 well plates containing 106 cells. The lysates were homogenized using a sonicator. After centrifugation, the supernatant was collected and 30 μg of lysate (determined by the Bradford Assay) was diluted in 2x loading buffer (Bio-Rad, Hercules, CA) and was loaded onto 4-20% polyacrylamide gels (Bio-Rad, Hercules, CA). The gels were run at 70 volts for 2 hours, and transferred to PVDF membranes (Millipore, Burlington, MA) using the semi-dry transfer system (Bio-Rad, Hercules, CA). Membranes were blocked in 5% nonfat milk in 0.1% Tween in tris buffered saline (TBST) for 1 hour at room temperature (RT), and primary antibodies were incubated with the membranes overnight at 4°C. Next, membranes were washed 5 times with 0.1% TBST and then secondary antibodies linked to HRP were diluted in 5% nonfat milk in 0.1% TBST and were applied for 2 hours at RT. Membranes were washed again as before, and incubated for 5 minutes in Immobilon Western Chemiluminescent HRP substrate (Millipore, Burlington, MA). Membranes were developed using film and scanned to create digital images. Primary and secondary antibodies are listed in the Reagents table.
Indirect Immunofluorescence
CAFs were allowed to generate ECM (3D microenvironment) as outlined above. After 5 days of ECM production, cells on coverslips were fixed and simultaneously permeabilized for 5 minutes at RT in 4% paraformaldehyde containing 0.5% TritonX-100 and 150 mM sucrose and allowed to continue fixation, using the same preparation lacking triton, for an additional 20 minutes at RT. Fixed/permeabilized cells were then blocked for 1 hour at RT with Odyssey Blocking Buffer (PBS base; Li-Cor, Lincoln, NE). Cells were stained for 1 hour at RT with the following antibodies diluted in blocking buffer: fibronectin (Sigma-Aldrich, St. Louis, MO) and α-smooth muscle actin (SMA) (Sigma-Aldrich, St. Louis, MO). After 1 hour incubation, cells were washed 3 times with 0.05% Tween in phosphate buffered saline (PBST), and secondary antibodies diluted in blocking buffer were applied for 1 hour at RT (TRITC for α-SMA; Cy5 for fibronectin, Jackson ImmunoResearch, West Grove, PA). Next, cells were washed 3 times with 0.05% PBST, and nuclei were counter stained with SYBR green (1:10,000; Invitrogen, Carlsbad, CA). Stained coverslips were imaged using Spinning disk confocal microscopy (Perkin Elmer, Waltham, MA), captured by a CoolSNAP CCD Camera (Photometrics, Tucson, AZ) attached to an Eclipse 2000-S inverted microscope (Nikon, Tokyo, Japan). Images were exported from Volocity 3D Image Analysis Software (Perkins Elmer, Waltham, MA). α-SMA integrated intensity was quantified using Metamorph Image Analysis Software (Molecular Devices, San Jose, CA). Fibronectin alignment was quantified as described below.
ECM fiber orientation analysis
ECM fiber orientation, indicative of alignment, was performed as previously described (Franco-Barraza et al., 2017). Briefly, confocal images of fibronectin in CAF generated ECM’s were analyzed for fiber orientation using the OrientationJ plugin (Rezakhaniha et al., 2012) for ImageJ. Fiber angles generated by the plugin were normalized to fit within the angle range of -90° to +90°. Next, normalized angles were plotted in Excel to generate orientation curves (alignment output at every angle). Finally, the percentage of fibers between -15° to +15° were plotted as a measurement indicative of ECM fiber alignment. In general, normal PSCs tend to have disorganized -15° to +15° angle fibers (<50%), while CAFs tend to have fibers with angles >50%.
PDAC Proliferation Assay
CON or NGL-1 KO PDAC cells (2x10⁴) were seeded in CAF-derived 3D ECMs and allowed to proliferate overnight. Ki67, a nuclear marker of proliferation, and nuclei (DAPI) were stained by IF (as outlined above). The number of Ki67 positive cells/nuclei per field was calculated using Metamorph image analysis software.
CRISPR/Cas9 Mediated Knockout of NetG1 and NGL-1
Knockout of NetG1 in CAFs, or NGL-1 in PDAC cells, was achieved by introducing a frameshift mutation in coding regions of each gene, induced by cuts made by CRISPR/Cas9 and gene specific gRNAs introduced into cells by lentiviral transduction.
gRNA design
Using the MIT Optimized CRISPR Design website: http://crispr.mit.edu/, the first 200 bp of exon 5 for NetG1 (first common exon for all splice variants) and first 220 bp of the NGL-1 gene were used to generate gRNAs. The top two hits for each gene were selected and designed to include BsmBI/Esp3I overhangs (bold, underline, italics), the specific gRNA sequence (plain text). G (italics, underline) was added to the .1 gRNAs (and corresponding C on the .2 gRNA) to optimize its expression for the human U6 promoter.
The gRNA sequences are listed below:
NetrinG1 gRNA 1.1 CACCGGCGTCCAGACCAAATGATCC
NetrinG1 gRNA 1.2 AAACGGATCATTTGGTCTGGACGCC
NetrinG1 gRNA 2.1 CACCGTGATGCGAGTACCCCTGAGC
NetrinG1 gRNA 2.2 AAACGCTCAGGGGTACTCGCATCAC
NGL1 gRNA1.1 CACCGAACCTGCGTGAGGTTCCGGA
NGL1 gRNA1.2 AAACTCCGGAACCTCACGCAGGTTC
NGL1 gRNA 2.1 CACCGTGCCATCCGGAACCTCACGC
NGL1 gRNA 2.2 AAACGCGTGAGGTTCCGGATGGCAC
Empty vector or Nontargeting gRNA against eGFP was used as a control:
eGFP gRNA 2.1 CACCGCATGTGATCGCGCTTCTCGT
eGFP gRNA 2.2 AAACACGAGAAGCGCGATCACATGC
Generation of Lentiviral Vectors
Designed oligos were ordered from Integrated DNA Technologies (Skokie, Illinois) and cloned into the LentiCRISPR v2 vector, as previously published (a gift from Feng Zhang; Addgene plasmid # 52961; (Franco-Barraza et al., 2017; Sanjana et al., 2014). Briefly, oligos were phosphorylated using T4 PNK (New England Biolabs, Ipswich, MA) and annealed in a thermal cycler. Annealed oligos were cloned into a gel purified (GeneJet Gel Extration Kit; Thermo Fisher Scientific, Waltham, MA), dephosphorylated (Fast AP; Thermo Fisher Scientific, Waltham, MA), and digested vector (Fast Digest Esp3I; Thermo Fisher Scientific, Waltham, MA). Annealed oligos were ligated into the digested vector using quick ligase (New England Biolabs, Ipswich, MA). The ligated vectors were transformed into Stbl3 strain of Escherichia coli (Thermo Fisher Scientific, Waltham, MA) and selected with 100 μg/mL ampicillin on LB/agar plates. The following day, single colonies of bacteria were screened by colony PCR using a forward primer for the U6 promoter (GAGGGCCTATTTCCCATGATT) and the reverse primer sequence (gRNA ×.2) for each gene. Positive clones were subjected to sequencing and subsequently expanded for plasmid purification and lentivirus production.
Lentiviral Transduction
To package the LentiCRISPRv2 plasmid into functional virus particles, 10 LentiCRISPRv2, 5 μg psPAX2 (psPAX2 was a gift from Didier Trono; Addgene plasmid # 12260) and 2 μg VSVg were mixed with 30 μL X-tremeGene9 transfection reagent (Sigma, St. Louis, MO) in 1 mL of serum free/antibiotic free DMEM and held at RT for 30 minutes. The transfection mixture was added dropwise to 293T cells containing 5 mL serum free/antibiotic free DMEM and the cells were incubated at 37°C overnight. The next day, the media was replaced with complete DMEM media. On days 2 and 4 post-transfection, the media with viral particles was collected and syringe filtered through a 0.45 μM filter (Millipore, Burlington, MA). The filtered viral supernatant was used immediately to transduce target cells (PDAC or fibroblasts) with 10 μg/mL polybrene (Santa Cruz Biotechnology, Dallas, Texas) or stored at -80°C for use in the future. Target cells were selected with puromycin (2 μg/mL for CAFs, 5 μg/mL PANC-1, 12 μg/mL KRAS) for 2 weeks. Cells that survived selection were used for future experiments.
Generation of RFP+ and GFP+ CRISPR/Cas9 transduced cells
eGFP and mCherry (RFP) were PCR amplified using Phusion HF polymerase master mix (Thermo Fisher Scientific, Waltham, MA) to add overhangs compatible with restriction enzymes. Then cloned into Xbal/Xhol (New England Biolabs, Ipswich, MA) digested, Fast AP dephosphorylated pLV-CMV-H4-puro vector (kindly provided by Dr. Alexey Ivanov, West Virginia University School of Medicine, Morgantown, WV, USA). Empty vector transduced (CON) or NetG1 KO CAF were transduced with pLV-CMV-H4-puro-GFP and the CON or NGL-1 KO PDAC cells were transduced with pLV-CMV-H4-puro-RFP, with 10 μg/mL polybrene. Cells were selected by flow cytometry. The selected cells were used for future experiments.
Cell Engagement/Motility Assays
RFP+ CON or NGL-1 KO PDAC cells (5x10⁴) were plated with GFP+ CON or NetG1 KO CAFs (5x10⁴) in 3D and allowed to attach for 2 hours. Following cell attachment, 3 regions per well, where there was obvious clustering of red PDAC cells and green CAFs, were selected to be imaged every 15 minutes for 24 hours, using a motorized XYZ stage (Optical Apparatus Co., Ardmore, PA) controlled by MetaMorph 6.3r7 (Molecular Devices, Downingtown, PA) software. Time-lapse movies were built with images from each corresponding fluorescence channels acquired every 15 min for a period of 24 hours using either 4X or 20X Pan Fluor objectives mounted on a Nikon TE-2000U wide field inverted microscope (Optical Apparatus Co., Ardmore, PA) with a Cool Snap HQ camera rendering 3 time-lapse movies per condition for a total of 9 videos generated over 3 independent experimental repetitions. The resulting time-lapse videos were analyzed to quantify heterotypic cell engagement (yellow interacting areas using both channels simultaneously in merged file stacks) and PDAC cell motility (using only the monochromatic images corresponding to the red channel), as outlined below.
Cell Engagement
For image analysis MetaMorph offline 7.8.1.0 software was used. To achieve sequence coherence, out of focus or blank images from particular fluorescence channels were removed, together with its fluorescence counterpart image. All movies were normalized (trimmed) to 18 hours data for analysis. Images were scaled and pseudocolored (RFP in red, GFP in green) similarly for all conditions. After merging of fluorescence channels, cell engagement areas (CEA) obtained from regions of fluorescence colocalization (in yellow) were digitally detected, isolated and measured for each condition over time.
PDAC cell Motility
Monochromatic channel of RFP+ PDAC cells were tracked using the Track Object function in MetaMorph 7.8.1.0 offline software (Molecular Devices, Downingtown, PA). A minimum of 5 cells per region were chosen to carefully follow. Red PDAC cells that were touching other red PDAC cells, moving out of the imaging plane, or that began to round up prior to mitosis were not counted in this experiment. Motility was analyzed according to the total distance (μM) traveled over the timespan of the experiment (24 hr), expressed as velocity (μM/hr).
Material Transfer Assay
2x10⁴ RFP+ CON or NGL-1 KO PDAC cells and/or 2x10⁴ GFP+ CAFs were seeded in 3D and were co-cultured for 36 hours, in serum free DMEM. Spinning disk confocal images (Perkin Elmer, Waltham, MA) were captured by a CoolSNAP CCD Camera (Photometrics, Tucson, AZ) attached to an Eclipse 2000-S inverted microscope (Nikon, Tokyo, Japan). Images were exported from Volocity 3D Image Analysis Software (Perkins Elmer, Waltham, MA) and quantified for the integrated intensity of GFP+ pixels under RFP+ pixels, using Metamorph Image Analysis Software (Molecular Devices, San Jose, CA), which was indicative CAF derived GFP material transfer to RFP+ PDAC cells.
PDAC Survival Assay
2x10⁴ RFP+ CON or NGL-1 KO PDAC cells (KRAS or PANC-1) and/or 2x10⁴ GFP+ CON or NetG1 KO CAFs were seeded in 3D (CON CAF or NetG1 KO ECMs, as indicated) in 24 well plates. Cells were co-cultured for 96 hours in serum free DMEM or glutamine free/serum free DMEM, as indicated in the figure legends. After 96 hours, Sytox Blue (Thermo Fisher Scientific, Waltham, MA) was added to each condition at a final concentration of 1 μM, to label dead cells. Next, at least 10 images (4X) were taken of red PDAC cells, green CAFs, and blue dead cells per well, using a Cool Snap 1HQ camera (Roper Scientific, Vianen, Netherlands) on an Eclipse 2000-U inverted microscope (Nikon, Tokyo, Japan). PDAC cell survival was quantified as the number of RFP+/Sytox blue negative cells per field of view, using Image J. The mean RFP+/Sytox blue negative cells (live) from each condition was calculated and normalized to the CON PDAC/CON CAF condition. The 96 hour timepoint was determined empirically, when cell death became evident by eye. Some PDAC survival assays were performed with CAF conditioned media (CM), as indicated. To determine which cell type outcompeted the other, a ratio of living PDAC cells (red) to living CAFs (green) was calculated, with higher numbers indicating PDAC survival was preferred, and lower numbers indicating CAF survival was preferred.
For cell death inhibitor assays, PDAC cells were treated overnight using GSK◻872 (2.5 μM; RIPK3 Inhibitor, necroptosis), Z-VAD-FMK (10 μM; Pan Caspase Inhibitor, apoptosis), both, or DMSO control. The following day, pre-treated PDAC cells were co-cultured in 3D with CAFs as described above. After 48 additional hours, the number of dead cells (RFP+/Sytox Blue+) was quantified as outlined above. A 48 hour endpoint was used, instead of 96 hours, to ensure capturing cells that had recently died and to ensure the inhibitor activity was still effective.
NK92 cell killing assay
2x10⁴ RFP+ CON or NGL-1 KO PDAC cells and/or 2x10⁴ GFP+ CON or NetG1 KO CAFs were seeded in 3D in 24 well plates and were co-cultured in serum free DMEM overnight to establish their niche. The following day, wells were seeded with 8x10⁴ inactive or active NK92 cells. Cells were co-cultured for 48 hours and PDAC survival was assessed identically to the PDAC cell survival assay. For active NK92 cells, cells were maintained with 400 units/mL IL-2 and for inactive NK92 cells, cells were maintained for one week in 100 units/mL IL-2 and switched overnight to culture media containing no IL-2 the day before the experiment. For 2D conditions, all experimental conditions were the same, except the endpoint of the experiment was at 6-8 hours, as lack of CAF derived ECM (3D microenvironment) allowed NK92 cells to kill at a faster rate. For the IL-15 neutralizing experiments, an IL-15 neutralizing antibody (10 μg/mL; R&D Systems, Minneapolis, MN) or Nonspecific IgG isotype control (10 μg/mL; Jackson Immunoresearch, West Grove, PA) were added to the co-cultures where specified. Whenever CON or NetG1 KO CAF CM was used, it was diluted 1:1 NK92 media. For glutamate experiments, glutamate (150 μM) was added to each co-culture condition where specified.
NK92 cell activation assay
8x10⁴ IL-2 activated NK92 cells were directly co-cultured (CC) with CAFs or with CM derived from CAFs for 2 hours. After the co-culture period, NK92 activation status was determined by staining Granzyme B intracellularly, or by using the IFNγ secretion assay detection kit. Stained cells were subjected to flow cytometry using by LSRII (Beckton Dickinson, San Jose, CA) and analyzed with FlowJo 9.9 software (Tree Star, San Carlos, CA). IL-2 activated NK92 cells cultured alone were used as the positive control. Percentage of cells that were positive for either Granzyme B or IFNγ were considered activated.
Enzyme-linked immunosorbent assay (ELISA)
ELISAs for IL-15, IFN-β, and TGF-β (R&D Systems, Minneapolis, MN) were performed as recommended by the manufacturer. Briefly, buffers for the IL-15 and IFN-β ELISAs were prepared using the DuoSet ELISA Ancillary Reagent Kit 2, and buffers were prepared using the DuoSet ELISA Ancillary Reagent Kit 1 for the TGF-β ELISA (R&D Systems, Minneapolis, MN). Standards, CM or lysates from Normal PSCs, CON CAFs, or NetG1 KO CAFs were incubated for 2 hours on plates pre-coated overnight with capture antibody. For the TGF-β ELISA, samples first underwent activation using the Sample Activation Kit 1 (R&D Systems, Minneapolis, MN) before sample incubation. Next, detection antibody linked to biotin was added to the wells and incubated for 2 hours. Streptavidin-HRP was then added to the wells and incubated for 20 mins. Samples were rinsed 3 times with wash buffer in between all steps. Substrate was added for 20 min and was neutralized with stop buffer. Plates were read using Spark® Multimode Microplate Reader (Tecan, Switzerland) at 450 nm to measure the specified protein present in sample. Plate imperfections, measured at 570 nm, were subtracted from the readings at 450 nm, to produce corrected readings. Finally, media alone (BLANK) was subtracted from the corrected readings for each sample. To determine the concentration of the indicated protein in each sample, a standard curve was generated using known concentrations of analyte, and the blank corrected values determined for each sample were compared to the standard curve.
U-Plex Assay
U-Plex Assay (multiplex ELISA) was carried out as recommended by the manufacturer (Meso Scale Discoveries, Rockville, MD). Briefly, Normal PSC and CON or NetG1 KO CAF CM samples were generated and added to a pre-coated plate containing 10 capture antibodies per well for the detection of the following proteins: IL-β, IL-2, IFNγ, GM-CSF, IL-6, IL-8, IL-10, IL-12p70, MIP3α, and TNFα. After 3 washes, sample, standards, or calibrator were added to the wells and incubated for 1 hour. Next, after 3 washes, detection antibody was added to the wells and incubated for 1 hour. After a final set of 3 washes, read buffer was added to the wells and the plate was read using the MSD SECTOR Imager 2400 (Meso Scale Discoveries, Rockville, MD) and the data was processed using the MSD Workbench 4.0 software (Meso Scale Discoveries, Rockville, MD).
Amino Acid Screen
Media: 20 μL of media was mixed with 80 μL of water and 100 μL of 10% Sulfosalicylic acid (Sigma, St. Louis, MO) followed by incubation for 1 hour at 4°C and then centrifugation at 13,000 rpm (15 min; 4°C). No visible pellet was seen. Supernatant was filtered using Ultrafree-MC-GV centrifugal filters (Millipore, Burlington, MA) and used for amino acid analysis employing Biochrom 30 amino acid analyzer. Results are in terms of μM.
Cell Lysates: 14.55 μg of cell lysate protein in RIPA buffer was brought to a total volume of 50 μL in water and was mixed with 50 μL of 10% Sulfosalicylic acid (Sigma, St. Louis, MO) followed by incubation for 1 hour at 4°C and then centrifugation at 13,000 rpm (15 min; 4°C). Supernatant was filtered using Ultrafree-MC-GV centrifugal filters (Millipore, Burlington, MA) and used for amino acid analysis employing the Biochrom 30 amino acid analyzer (Biochrom US, Holliston, MA). Results were provided in nmol/mg protein units.
Human NK cell Isolation and Activation Experiments
Isolation of Primary NK cells
Blood was collected into heparinized tubes from healthy volunteer donors that consented using HIPAA-compliant procedures approved by the Institutional Review Board of Fox Chase Cancer Center. NK cells were enriched from healthy donor PBMCs using the EasySep NK cell negative selection kit (StemCell Technologies, Cambridge, MA) and confirmed to be >95% purity using flow cytometry.
Primary NK Cell Activation Assay
Purified NK cells were incubated overnight at 37°C in indicated percentages of CON or NetG1 CAF CM diluted in NK cell media (10%-65%) in the presence of IL-2 (500 units/mL) and IL-12 (10 ng/mL). NK cells activated with IL-2 and IL-12 were used as a positive control. After overnight incubation population of IFNγ secreting cells was identified using IFNγ Secretion assay detection kit (PE) (Miltenyi Biotec, Bergisch Gladbach, Germany) according to the manufacturer’s protocol. After incubation with IFNγ catch reagent, cells were washed in 2 times. Next, cells were stained with IFNγ detection antibody and antibodies against NKp80 (anti-NKp80-APC, Biolegend, San Diego, CA), CD3 (anti-CD3-Cy7APC, BD Pharmigen, San Jose, CA), CD56 (anti-CD56-BUV395, BD Horizon, San Jose, CA), CD69 (anti-CD69-Pac Blue, San Diego, CA). Cells were centrifuged and rinsed twice, with propidium iodide in second wash. NK cells were defined as NKp80+CD56+CD3- cells.
Flow cytometry and data analysis
Stained cells were analyzed on a BD ARIA II flow cytometer (Becton Dickinson, Franklin Lakes, NJ). Data was collected with BD FACS Diva software (v6) and analyzed with FlowJo (v9.9; Tree Star Inc., Ashland, OR). IFNγ and CD69 expression were identified as the percentange of IFNγ+ cells or mean fluorescence intensity (MFI) of CD69+ cells. The data were normalized to the positive control (NK cells with IL2/IL12 treatment alone).
Mouse Models
Tissue for stromal analysis was obtained from the LSL-KRASG12D, PDX1-Cre (KC) model (Hingorani et al., 2003), and KPC4B and KPC3 murine PDAC cell lines were derived from tumors generated from a variant of LSL-KRASG12D, LSL-TP53-/-, PDX1-Cre (KPC) mice (Hingorani et al., 2005).
Murine PDAC cell orthotopic injections
All animal work was performed under protocols approved by IACUC at Fox Chase Cancer Center. A small incision was made in the abdominal skin of the mice, and gently moved aside the spleen to reveal the pancreas. Next, 106 murine CON or NGL-1 KO #1 or #2 PDAC cells (derived from KPC tumors), were injected (100 μL) orthotopically into the pancreas of syngeneic C57BL/6 mice and tumors were allowed to develop for 3.5 weeks. Mice were monitored by observation, palpation, and weekly MRIs and sacrificed at 3.5 weeks. Pancreas weights were obtained and pancreatic tissue was further analyzed as described below. To determine the effect of the immune system on tumorigenesis in the orthotopic model, the injections were performed as above, with the following mice used as hosts:
C57BL/B6 (immunocompetent; FCCC), C.B17 Severe Combined Immunodeficient, (SCID; lacks T and B cells; Taconic Bioscience), and NOD.Cg-Prkdcscid IL2rgtm1Wjl/SzJ: NOD scid gamma (NSG; lacks NK, T, and B cells; Jackson Laboratories).
Murine tissue preparation and histopathological analysis
Tissue Preparation
Tissues were collected and fixed in 10% phosphate-buffered formaldehyde (formalin) 24-48 hrs, dehydrated and embedded in paraffin. Tissues were processed by dehydration in a series of ethanol followed by xylene (70% ethanol 3 hr, 95% ethanol 2 hr, 100% ethanol 2 hr, 100% ethanol Xylene mixed 1hr, Xylene 3hr, then immersed in Paraffin). Paraffin blocks were cut into 5 μM sections, mounted on microscope slides, and stored at room temperature until used. Sections were stained with hematoxylin and eosin for pathologic evaluation.
All H&E slides were viewed with a Nikon Eclipse 50i microscope and photomicrographs were taken with an attached Nikon DS-Fi1 camera (Melville, NY, USA).
Tumor area analysis
H&E stained slides were also scanned using Aperio ScanScope CS scanner (Aperio, Vista, CA). Scanned images were then viewed with Aperio’s image viewer software (ImageScope). Selected regions of interest for PDAC and total pancreatic areas were outlined respectively by a pathologist, who was blinded to the treatment groups. The ratio of PDAC to the total pancreatic areas scanned was calculated for each animal.
Differentiation status of tumor cells
H&E images of pancreata injected with CON or NGL-1 KO cells were scored for the percentage of cells that were well differentiated, moderately differentiated, or poorly differentiated, as determined by a pathologist, who was blinded to the treatment groups.
TUNEL Staining
Apoptotic cells were quantified using the DeadEnd™ Fluorometric TUNEL System (Promega, Madison, WI), per manufacturer’s instructions. Briefly, tissue was deparaffinized and fixed in 4% formaldehyde for 15 minutes at RT. After 2 PBS washes, tissue was treated with 20 μg/mL proteinase K solution for 10 minutes at RT. After 2 PBS washes, slides were fixed again in 4% formaldehyde for 5 minutes at RT. Tissue was then submerged in Equilibration buffer at RT for 5 minutes. Next, apoptotic cells were labeled with TdT reaction mixture for 1 hour at 37°C. After 1 hour, the reaction was stopped by adding SSC buffer for 15 minutes at RT. Tissue was then washed 3x in PBS and then stained with DAPI (1:10,000) for 15 minutes at RT. Finally, after an additional wash, tissue was mounted and imaged using the Eclipse 2000-U inverted microscope. Metamorph software was used to quantify dead cells (green)/nuclei (blue) in each field of view. At least 10 images (20X) per sample were acquired.
Ki67 staining (proliferation)
IF on tissue sections was done as previously published (Franco-Barraza et al., 2017). Briefly, deparaffinized tissue underwent antigen retrieval by boiling in buffer containing 10 mM Sodium citrate, 0.05% Tween 20, pH 6.0 for 1 hour. Next, tissue was blocked in Odyssey Blocking Buffer (PBS base) (LI-COR Biosciences, Lincoln, NE) for 1 hour at RT. Tissue was then stained with primary antibody against Ki67 (Abcam, Cambridge, UK) overnight at 4°C. The following day, tissue was washed 3 times in 0.05% PBST, and secondary antibody conjugated to TRITC (Jackson ImmunoResearch, West Grove, PA) was applied to the samples for 2 hours at RT. After 3 additional washes, nuclei were stained with DAPI (1:10,000) for 15 minutes at RT. After one final wash, samples were mounted and images (20X) were captured using an Eclipse 2000-U inverted microscope. Proliferating cells (red)/nuclei (blue) in each field of view were quantified using Metamorph Software.
Magnetic Resonance Imaging (MRI)
Animals were imaged in a 7 Tesla vertical wide-bore magnet, using a Bruker DRX 300 spectrometer (Billerica, MA) with a micro-imaging accessory, which included a micro 2.5 gradient set, a 30 cm radiofrequency coil, and Paravision software (Bruker, Billerica, MA). Animals were anesthetized with a mixture of oxygen and isoflurane (2-3%). An injection of 0.2 mL of 10:1 diluted Magnevist (gadopentetate dimeglumine; Bayer, Whippany, NJ) was made into the shoulder region immediately preceding the scan. Scout scans were performed in the axial and sagittal orientations, permitting us to accurately prescribe an oblique data set in coronal and sagittal orientations that included the organs of interest. A two-dimensional spin echo pulse sequence was employed with echo time 15 msec, repetition time 630 msec, field of view = 2.56 cm, acquisition matrix= 256x256, slice thickness= 0.75 mm, 2 averages, scan time = 5 minutes. Fat suppression (standard on Bruker DRX systems) was used for all scans. Raw data files were converted to Tiff format image files using the Bruker plugin on ImageJ.
Tissue Microarray (TMA)
All human tissue collected for this study was done under exemption-approval by the Fox Chase Cancer Center Institutional Review Board. Patients signed a written informed consent to donate their samples for research purposes. Patient samples were selected by a pathologist, coded and distributed by FCCC Institutional Biosample Repository Facility in order to protect the identity of the patients.
Simultaneous Multichannel Immunofluorescence (SMI)
Qdot antibody conjugation
Corresponding antibodies were linked to Qdot molecules using SiteClick Qdot labeling from Molecular Probes-ThermoFisher Scientific. In brief, approximately 100 mg of specific IgG were pre-purified to remove excessive carrier proteins (if needed) and each conjugation was performed following manufacturer’s three-step protocol requiring antibody’s carbohydrate domain modifications to allowing an azide molecule attachment to facilitate linking DIBO-modified nanocrystals to the antibodies.
Formalin fixed and paraffin embedded (FFPE) tissue processing
FFPE sections were deparaffinized using xylene and rehydrated in progressive ethanol to water dilutions. Tissues then were processed through heat-induced epitope retrieval using pH 6.0 Citrate buffer, followed by permeabilization with 0.5% TritonX-100. After treating them with Odyssey (PBS base) blocking buffer (LI-COR Biosciences, Lincoln, NE) samples were labeled by a three-day indirect immunofluorescence scheme. Initially, primary antibodies against mouse monoclonal NetG1 (D-2, Santa Cruz. Dallas, TX) and rabbit polyclonal NGL-1 (N1N3, Genetex Inc., Irvine, CA) were incubated at 4C overnight, followed by anti-mouse Q625 and anti-rabbit Q655 secondary antibodies, together with primary rabbit polyclonal Y397P-FAK (Genetex Inc., Irvine, CA) pre-linked to Q605, overnight incubation (see Q-dots antibody conjugation details above). After washes, sections were treated with corresponding monovalent Fab IgG fragments (Jackson Immuno Research Inc., West Grove, PA) to avoid cross-reaction during the incubation of the following mix of primary antibodies: mouse monoclonal anti-pan-cytokeratin (clones AE1/AE3, DAKO) to detect the epithelial compartment, together with rabbit monoclonal anti-vimentin (EPR3776, Abcam) antibodies for mesenchymal (stromal) components. Secondary antibodies were donkey anti-mouse Cy3 and donkey anti-rabbit Cy2 (Jackson Immuno Research Inc., West Grove, PA). Nuclei were labeled by DRAQ5 (Invitrogen-Thermo Fisher Scientific, Waltham, MA). Lastly, sections were dehydrated in progressive ethanol concentrations and clarified in Toluene before mounting using Cytoseal-60 (Thermo Fisher Scientific, Waltham, MA). Slides were cured overnight in dark at RT before the imaging.
Image acquisitions for SMI analysis (SMIA)
Fluorescently labeled tissue sections imaging was acquired using Caliper multispectral imaging system (LifeSciences, PerkinElmer), using full capabilities of its Tunable Liquid Crystal imaging module. We used two different systems, namely Nuance-FX (for 40X objective) and Vectra (for 20X objective and high throughput of TMA preparations). A specific wavelength based spectral library for each system was built using particular control pancreatic tissues (i.e. murine and human) labeled with individual fluorophores, also including unstained samples to discard specific auto-fluorescence spectra. Each particular spectral library was used for the subsequent image acquisition and analysis. All excitations were achieved via a high-intensity mercury lamp using the following filters for emission-excitation, for Nuance-FX, DAPI (450-720), FITC (500720), TRITC (580-720), CY5 (680-720); for Vectra, DAPI (440-680), FITC (500-680), TRITC (570-690), CY5 (680-720). Excitation was conducted from the infrared to ultraviolet spectrum, attempting to avoid energy transfer and excitation of nearby fluorophores. Emission was collected using ‘DAPI’ filter (wavelength range 450-720) for all Qdot labeled markers, while masks used the conventional FITC, TRITC, and CY5 filters.
Collected image cubes (multi-spectral data files), images were unmixed to obtain 16-bit (gray scale) individual monochromatic files. Using Photoshop’s ‘Levels’ and ‘batch processing’ automated functions, the images were processed in bulk for similar levels adjustment and 8-bit monochromatic image conversion for each channel. The resulting images were sampled to set identical threshold values for each channel, which then were used to analyze distribution, intensity and co-localization of positive-selected pixels using SMIA-CUKIE (SCR_014795) algorithm (Franco-Barraza et al., 2017).
SMIA-CUKIE usage and outputs
As described previously (Franco-Barraza et al., 2017), SMIA-CUKIE algorithm (SCR_014795) was used to analyze high throughput monochromatic images acquired from SMI-processed FFPE tissue sections. In brief, the algorithm is based on the usage of digital masks, based on pixel-positive area distribution for tissue compartmentalization (i.e. cytokeratin positive/vimentin negative area: epithelium/tumor compartment vs. vimentin positive/cytokeratin negative area: stromal compartment). Next, we inquired detailed occurrences (mean, median, coverage area, etc.) of the markers of interest (i.e. NetG1, NGL-1, Y397P-FAK), under each mask. Each of the masks and markers require a numeric threshold (0-255), indicating the value of pixel intensity considered positive for each channel (corresponding to each mask and marker). Finally, the analysis generated an Excel file containing numerical values, which were scrutinized for statistical significance as described in the corresponding statistical analysis section. Black lines through a row indicate an unquantifiable image. The algorithm is available at the public domain: https://github.com/cukie/SMIA_CUKIE. This dataset is available as the supplemental material files: “Murine SMIA” and “Human Single Patient SMIA”.
Statistics
For all in vitro and animal experiments, Prism 7.0 (Graph Pad Software, San Diego, California) was used for all statistical analysis. For comparison between two groups, a two tailed Student’s T-Test was performed. For comparisons between more than two groups, a One-Way ANOVA was performed, using either a Dunnett’s multiple comparisons test (compared to control condition) or Tukey’s multiple comparisons test (comparing all conditions to one another), depending on the experiment. Groups were deemed statistically significantly different from one another if the p-value was less than or equal to 0.05. On graphs, significance was defined as follows: * P <0.05; ** P <0.01; *** < 0.001; **** P < 0.0001. For the correlation of the SMI analysis, linear regression was applied to the SMIA generated values of two markers at the designated components, and the R2 value was calculated. All in vitro experiments were performed at least three times (unless explicitly stated in the figure legend) and the orthotopic injections were performed in two cohorts, resulting in N=7 for Control injected mice, and N=19 for combined NGL-1 KO injected mice.
Reagents Table
Author Contributions
Conceptualization, E.C., R.F., D.B.V.C., I.A.; Methodology, E.C., R.F., J.F.B, I.A., L.G., J.W, T.P., K.C., A.M., A.L., S.G, K.Q.C., R.T., S.B., M.V.H., H.H., E.N., N.S., T.L.; Validation, T.L., R.F., D.B.V.C, J.W., A.M. D.Ro., D.Re.; Formal Analysis, R.F., D.B.V.C, J.F.B., J.W., T.L., N.S., T.P., K.D., E.M., K.Q.C., E.C., D.Ro., Y.Z.; Investigation, R.F., D.B.V.C., J.F.B., T.L., N.S., T.P., S.G., L.G., A.M., E.M., H.H.; Resources, E.C., I.A., M.V.H., S.B., W.K., W.S.E.D., K.C.; Data Curation; J.F.B., N.S., D.K., Y.Z., D.Ro., T.L.; Writing-original draft, R.F., D.B.V.C.; Writing-review & editing, E.C., I.A., J.W., J.F.B., T.P., S.B., K.C., R.F., D.B.V.C.; Visualization, E.C.,J.F.B., R.F., D.B.V.C., J.W., A.M., T.P., D.Ro., T.L.; Supervision, E.C., I.A., K.C.; Funding Acquisition, E.C., I.A., K.C.
Declaration of Interests
The authors declare no competing interests.
Acknowledgments
We would like to thank Dr. Martin Humphries for the SNAKA 51 antibody. We appreciate the advice from Dr. Alexander Macfarlane on NK cells and flow cytometry. We thank Jim Oesterling for his great feedback and technical ability with flow cytometry experiments. We greatly appreciate the NetG1/NGL-1 discussions with Dr. Shigeyoshi Itohara. We are grateful for the kind gifts provided by Robert Weinberg (pBABE-neo-hTERT vector; Addgene plasmid # 1774), Dr. Feng Zhang (LentiCRISPRv2; Addgene plasmid # 52961), Dr. Didier Trono (psPAX2; Addgene plasmid # 12260), and Dr. Alexey Ivanov (pLV-CMV-H4-puro vector). This work was supported in part by NIH/NCI grants R01CA113451-10 (EC), T32CA009035 (RF), R01CA113451-09S1 (JFB/EC), R01CA188430 (IA), R03CA212949 (IA), R01GM116911 (IA), R01CA194263 (KC) Core grant CA06927 in support to Fox Chase Cancer Center’s facilities including: Bio Sample Repository, Light Microscopy, Small Animal Imaging, Biostatistics and Bioinformatics, Flow Cytometry, Laboratory Animal Facility, Cell Culture Facility, DNA sequencing, and Talbot Library) and DOD grant WX81XWH-15-1-0170 (EC/RF/JFB).
References


