

Abstract
Alterations in the gut microbiota have been associated with a variety of medical conditions such as obesity, Crohn’s disease and diabetes. However, establishing connections between the microbial composition and function remains a challenge. We introduce a strategy based on metabolic models of complete microbial gut communities and apply it to derive the particular metabolic consequences of the microbial composition for the diabetic gut in a balanced cohort of 186 individuals. By using a heuristic optimization approach based on L2 regularization we were able to obtain a unique set of realistic growth rates that allows growth for the majority of observed taxa in a sample. We also integrated various additional constraints such as diet and the measured abundances of microbial species to derive the resulting metabolic alterations for individual metagenomic samples. In particular, we show that growth rates vary greatly across samples and that there exists a network of bacteria implicated in health and disease that mutually maintain each other’s growth rates. Studying individual exchange fluxes in the gut microbiota we observed that consumption of metabolites by the microbiota follows a niche structure whereas production of short chain fatty acids by the microbiota was highly sample-specific, showed complex cross-feeding, and was affected in diabetes. In particular the models predicted alterations in SCFA production in Danish individuals and its restoration after metformin treatment. Additionally, we found that production of many metabolites by the microbiota could not be easily influenced by single-target interventions and that intervention effects may be very different across individuals. All methods are implemented in the open source Python package “micom” which is available at https://github.com/resendislab/micom.
Introduction
The microbial composition in the gut may be highly consequential for human metabolism and has been associated to a variety of medical conditions such as obesity, Crohn’s Disease, diabetes and colorectal cancer (1–5). Nevertheless, the causality by which the microbiota may alter the host’s metabolism remains unclear. Several studies have mapped microbial genes in the microbiome to particular functions (6–8), however that approach is only qualitative since the presence of a particular metabolic gene does not guarantee expression nor a change in the associated biochemical reaction. An alternative strategy to quantify the metabolic alterations that microbial community can induce in the host’ metabolism is to use computational models for analyzing the fluxes in biochemical networks (9, 10). Even though direct measurement of fluxes by carbon or nitrogen labeling is costly, one can usually approximately infer the metabolic fluxes of a particular model organism using genome-scale metabolic models. For individual bacteria, metabolic modeling using flux balance analysis (FBA) has shown to be a valuable tool to explore their respective metabolic capacities and has been used extensively in basic research, biochemical strain design and in vitro models of bacterial interactions (11–14). In FBA, fluxes are usually approximated from a genome-scale model containing all known biochemical reactions by maximizing the production of biomass under various constraints mirroring the enzymatic, thermodynamic and environmental conditions (12). For instance, one can restrict metabolic import fluxes to the ones whose substrate is present in (11, 13, 15) the media in order to simulate a particular growth medium. Extending FBA to microbial communities can be challenging due to the necessity of modeling the metabolic exchanges between individuals and suggesting a proper objective function to mimic the growth of the entire community as well as individual bacterial species.
In many cases one only maximizes the overall growth rate of the entire community which may be problematic since individual species might be competitive and will rather maximize their own growth rate than the growth rate of the community. More complex methods such as OptCom thus try to find the joint multi-objective maximum of the individual and community growth rates (16). However, those multi-objective methods are limited to communities consisting of only very few members which is not realistic for microbial communities in the gut which may contain up to several hundred distinct subpopulations (17). An additional challenge is the inclusion of abundance data obtained from 16S rRNA sequencing or metagenomic shotgun experiments into the metabolic model. This is particularly important for the metabolic exchanges taking place between different species in the same community. A highly abundant species may usually import and export much higher absolute quantities than a low abundant species which will affect the resulting biochemical fluxes. Nevertheless, genome-scale metabolic modeling shows a strong potential in microbial communities as it may directly quantify the metabolic potential of a particular gut microbiota in the form of the metabolic fluxes. In particular, this computational approach predicts the metabolic exchange rates between the host and the microbial community in the gut which suggests possible mechanisms associated with the wellness or disease state of the host.
In this work, we present a strategy that efficiently extends metabolic modeling to microbial communities. Using an iterative strategy of linear and quadratic optimizations over a community of microbial genome scale metabolic reconstructions, we were able to scale a formulation that uses the community as well as individual growth to several hundred microbial species which enables the study of realistic microbial compositions. Additionally, we explicitly included microbial abundances from metagenomic shotgun sequencing and realistic diets in order to make quantitative predictions regarding the metabolic consequences for the host. The entire strategy is implemented in an easy to use Python software package called “micom”. In order to assess the explicative and predictive capacities of our approach, we applied the analysis in micom to a balanced data set of 186 Danish and Swedish individuals distributed across healthy individuals, patients with type 1 diabetes and patients with type 2 diabetes (with and without metformin treatment). We show that individual bacterial growth rates vary greatly across samples and that a subset of bacteria often associated with health show strong interdependencies within samples. We also quantified exchanges between the gut microbiota and gut lumen and studied the effect of the microbiota composition on the production of short chain fatty acids (SCFAs) across samples from healthy and diabetic individuals.
Results
A regularization strategy for microbial community models
Growth in microbial communities can be quantified by two classes of growth rates, the community growth rate μc (in 1/h) which expresses the growth of the entire community and the individual growth rates μi which measures the growth of the subpopulation i (16, 18). Here, the community growth rate μc is connected to the individual growth rates μi by
 where ai denote the relative abundance for the subpopulation i (the fraction of the community that is constituted by this subpopulation). Even though FBA can be used to obtain the maximum community growth rate, one can see from equation 1 that there is an infinite combination of different individual growth rates μi for any given community growth rate μc (see Figure 1A for an example). Various strategies have been employed in order to deal with this limitation, the most common one being just reporting any one of the possible growth rates distributions for μi. Other approaches have tried to find the set of growth rates that maximize community growth and individual growth at the same time (16), but this is computationally intensive and may not scale well to the gut microbiota which is composed by at least tens of different genera and hundreds of different species (17, 19). Thus, we tried to formulate a strategy that would allow us to identify a realistic set of individual growth rates μi and which would still scale to large communities. The simplest case of a microbial community is a community composed of two identical clonal subpopulations of the same bacterial strain each being present in the same abundance (thus constituting 50% of the community each). Assuming that the maximum community and individual growth rates are equal to one there are now many alternative solutions giving maximal community growth as shown in Figure 1A. However, the two populations are identical one would expect that both grown at the same rate. In order to enforce a particular distribution of individual growth rates one can try to optimize an additional function over the individual growth rates μi. This is known as regularization and the two most common strategies are L1 regularization which minimizes the sum of individual growth rates and L2 regularization which minimized the sum of squares of the growth rates (20, 21). Here, only the L2 norm correctly identifies the alternative solution where both subpopulations grow at the same rate as optimal.

(A) Regularization values for a toy model of two identical E. coli subpopulations. Shown are two alternative solutions with different individual growth rates and the respective values of L1 and L2 regularization. Only L2 regularization favors one over the other and identifies the expected solution where both subpopulations grow with the same rate. (B) Effect of different trade-off values (fraction of maximum) on the distribution of individual genus growth rates. Zero growth rates were assigned a value of 10−16 which was smaller than the observed non-zero minimum. Growth rates smaller than 10−6 were considered to not represent growth. (C) Fraction of the overall number of genera that were able to grow under varying trade-off values. “None” indicates a model without regularization returning arbitrary alternative solutions. Growth rates assumed a total microbiota biomass of 200g for all samples (see Methods).
The same strategy can be applied to heterogeneous microbial communities composed of several subpopulations with different abundances. Here the L2 norm will give the distribution of growth rates were growth is distributed as evenly as possible across the individual populations, which allows growth for as many sub-populations as possible. Thus, the L2 norm minimization can be interpreted as a heuristic for the simultaneous maximization of individual growth rates attempted in the non-convex multi-objective formulation. This is also consistent with the demand that a subpopulation observed in the gut microbiota should be able to grow in the gut. Additionally, the L2 norm has a unique minimum. Thus, there is only one configuration of individual growth rates μi that minimizes the L2 norm for a given community growth rate μc. In practice, maximal community growth might only be achievable if many subpopulations are excluded from growth, for instance by giving all resources to a fast growing subpopulation. Again, this would be inconsistent if one has prior knowledge that the other subpopulations are present in the gut and should be able to grow. Instead of enforcing the maximal community growth rate one can limit community growth to only a fraction of its maximal rate. Thus, creating a tradeoff between optimal community growth and individual growth rate maximization. Because the community growth maximization requires full cooperativity whereas the L2 norm minimization represents egoistic individual growth maximization, we call the two-step strategy to fix the community growth rate a fraction of its optimum followed by minimization of the L2 norm of individual growth rates “cooperative trade-off”.
Regularization by cooperative trade-off yields realistic growth rate estimates
In order to test whether cooperative trade-off yields realistic growth rates, we implemented and applied it to a set of 186 samples from Swedish and Danish individuals (22), consisting of healthy individuals, individuals with type 1 diabetes and individuals with type 2 diabetes stratified by metformin treatment (a known modulator of gut microbiome). Relative abundances for a total of 367 bacterial genera and 727 species were obtained with SLIMM (23) from previously published metagenomic reads (22, 23) as described in the Methods section. Abundance profiles for all identified genera across all samples were connected with the AGORA models, a set of previously published manually curated metabolic models for 773 bacterial species (24). In the used data set the AGORA reconstructions mapped to 109 genera which represented more than 99% of the total abundance of the metagenomic reads with an assigned genus (85.3% vs 85.7%, see Table 1) and in average 85% of all aligned reads for each sample. Even though the cooperative tradeoff strategy is applicable to species-level subpopulations, the AGORA reconstructions accounted in average only for 63% of the total reads in each sample and for less than 50% of the total reads in some samples meaning that the AGORA models would not be representative for the microbial diversity in those samples. Thus, we decided to model the subpopulations at the genus level since this covers a larger fraction of the observed microbiota. For that individual species models from AGORA were pooled into genus-level models (see Methods). The resulting communities contained between 22 and 78 genera, each represented by a full genome-scale metabolic model and connected by exchange reactions with the gut lumen, thus yielding a set of 186 complete metagenome-scale metabolic models. We used the relative read abundances as a proxy for the abundance of each genus in each sample (see Methods). Even though DNA quantity is not an exact representation of bacterial mass (in grams dry weight), we argue that the discrepancy between the two is probably much smaller than the variation in abundances which spans several orders of magnitude (17). Import fluxes for external metabolites were restricted by applying an average western diet to each community model (24).
Distribution of taxa assignments across ranks. Shown are the number of unique taxa for each rank together with the percentage of mapped reads that could be uniquely assigned to a taxa in the rank, as well as the percentage of reads whose taxa had at least one representative in the AGORA genome-scale metabolic models. Percentages are shown as mean ± standard deviation across the 186 samples.
We found that computation time generally scaled well with the community size when using interior point methods which are known to provide better performance for larger models, with most individual optimizations taking less than 5 minutes (25). However, we found that it was difficult to maintain numerical stability with large community models. In fact, the largest difficulty we encountered was numerical stability and not computation time. None of the tested solvers were able to converge to optimality when solving the quadratic programming problem posed by the L2 norm minimization (see Methods). Thus, we used a crossover strategy to identify an optimal solution to the L2 minimization (see Methods).
For each of the of the 186 individual community models we solved several linear programming problems in order to evaluate the effectiveness of different optimization strategies. First, to establish a baseline we only maximized the community growth rate and used the arbitrary distribution of growth rates that is returned by the solver when applying no regularization. This was followed by applying the cooperative trade-off strategy with varying levels of suboptimality ranging from 10% to 100% of the maximum community growth rate. As argued before we observed that just optimizing the community growth rate with no regularization of the individual growth rates led to solutions where only a few subpopulations were left to grow with unreasonably high growth rates (doubling times smaller 5 minutes) whereas the rest of the microbial community did not grow (compare Figures 1B-C with strategy marked by “none”). Adding the L2 norm minimization even while maintaining maximum community growth notably increased the growing fraction of the community and gave smaller growth rates overall. However, we also found that maximization of the community growth rate is generally incompatible with the assumption that the majority of the observed genera should be able to grow. Lowering the community growth rate to suboptimal levels strongly increased the growing fraction of the population where a community growth rate of 20% of its maximum will allow essentially all bacterial subpopulations to grow. Based on reports that about 20-40% of the bacteria found in stool are not viable (26), we chose a suboptimal community growth rate of 50% maximum growth (which allowed growth for about 70% of all subpopulations) as the trade-off parameter for all subsequent analyses (see Figure S1).
Growth rates are heterogeneous and depend on the community composition
The community and individual growth rates obtained this way were in good agreement with previous evidence. Bacterial communities showed an average doubling time of about 10 hours where individual genera had an average doubling time of 20 hours with a minimum of 23 minutes which is consistent with the generally low growth in the gut and the fast doubling time of about 20 minutes that can be observed in laboratory growth media (27).
Even though community growth rates varied only little across all samples (0.069 +− 0.019 1/h) we found that individual growth rates often varied across fiver orders of magnitude (see Figure 2). Here Eubacterium was predicted to be the fastest growing genus overall which is consistent with the ubiquitous presence of Eubacterium in microbiome samples (28, 29). We found that growth rates and abundances were not linearly correlated (Pearson R=0.0) but showed a moderate correlation on the log-log scale (Pearson R=0.69) which indicates that the relationship between abundance and growth rate weakly follows a Power law, Figure 3A. However, for any given abundance growth rates would still vary by up to two orders of magnitude (compare Figure 3A). Thus, the growth rate is related to abundance but cannot simply be inferred from it.

Non-zero growth rates (> 10−6) across genera obtained by cooperative trade-off (50% maximum community growth rate). Each point denotes a growth rate in one of the 186 samples. Growth rates assumed a total microbiota biomass of 200g for all samples (see Methods).

(A) Genera growth rates are slightly correlated on the log-log-scale (Pearson R=0.69, n=39,815). Shown is the density at each point with darker blue indicating higher density. Marginal density estimations are shown on the sides. (B) Growth rate interactions between genera as estimated by genera knockouts. Shown are only interaction that induce a growth rate change of at least 50% the observed maximum. Color of edges indicates strength (in %maximum growth rate change) and type of interaction. Red edges denote competition where one removal of one genus increases the growth rate of the other and blue edges denote cooperation where the removal of one genus lowers the growth rate of the other. Nodes are colored by the degree (number of edges) from lime (low degree) to dark blue (high degree).
To explain this variation in individual growth rate, we hypothesized that different genera might mutually influence each other’s growth rate, either by competition or by cooperation. In order to quantify the level of growth rate interdependencies we performed in silico knockouts for each genus in each sample and tracked the change of growth rate for all remaining genera in the sample (see Methods). Here we found that each individual genus’ growth rate was impacted by another genus in at least one of the 186 samples. As could be hypothesized for a set of bacteria competing for the same resources, most interactions were competitive (red edges in Figure 3B). However, we observed a distinct subset of bacteria that were interconnected by a large amount of cooperative interactions (blue edges in Figure 3B). Strikingly, many of the bacterial genera contained in the group have been associated with gut health or disease, such as Anaerostipes, Blautia, Escherichia, Bacteroides and Eubacterium (5, 30–34).
Analysis of minimal exchanges reveals the metabolic consequences for the host
One of the major modes of interaction between the gut microbiota and the host is by means of consumption or production of the metabolite pool in the gut. We quantified this effect by obtaining all import and export fluxes for each individual genus across all samples (12,460 exchange reactions) as well as metabolite exchanges between the microbiota and the gut lumen (195 metabolites). This was done in the absence of a metabolic model for the enterocytes, colonocytes or goblet cells due to the lack of a curated metabolic reconstruction and validated objective function for those cells. Thus, the presented results should be seen as a lower bound for the interaction of the microbiota with the gut. A unique set of exchange fluxes was obtained by calculating the minimal medium, the set of exchange fluxes with smallest total import flux for the growth rates obtained by cooperative trade-off (see Methods). This assumes that the microbiota competes for resources with the gut or normal dilution and will thus favor an efficient import that yields the maximum growth rate.
Even though the minimization of total import fluxes favors simpler media compositions most samples showed a diverse consumption of metabolites from the gut, particularly using a wide array of different carbon and nitrogen sources (see Figure 4A). There was a large set of metabolites that were consumed across all samples but also a smaller set containing some specific carbon sources such as Arabinogalactan and Rhamnogalacturonan derivatives and a few selected amino acids such as Alanine and Cysteine. Also, all communities showed a net anaerobic growth as would be expected in the gut.
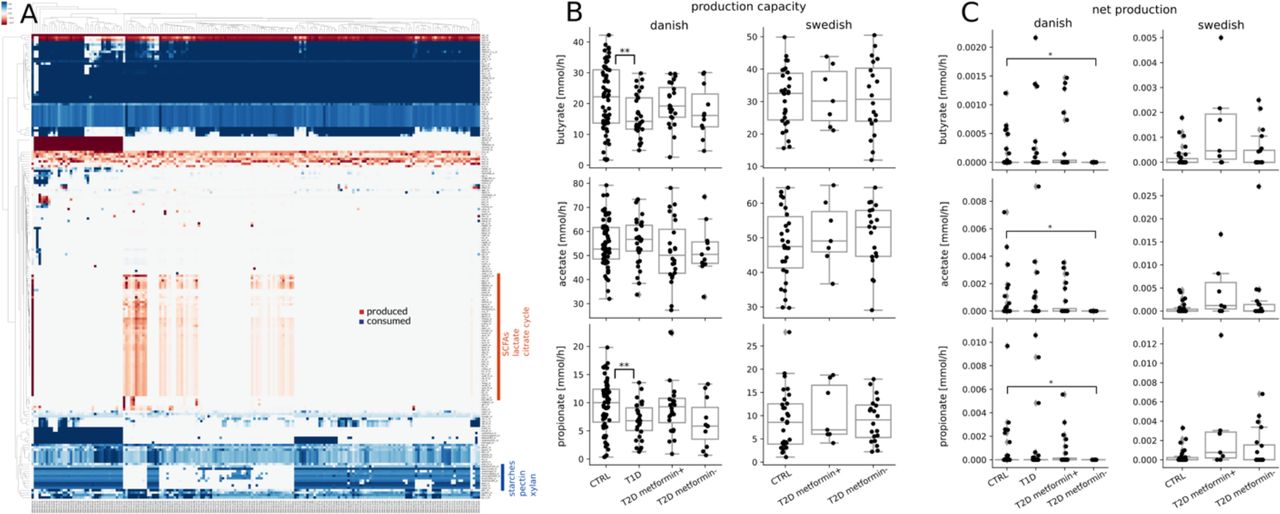
Exchange fluxes were calculated as the smallest set of import fluxes that could maintain the genera growth rates obtained by cooperative trade-off. (A) Exchange fluxes across samples. Rows were normalized to their absolute maximum and colors denote the strength and direction of exchange. Red denotes import fluxes (consumption of metabolites by the community) and blue denotes export fluxes (production of metabolites by the community). (B) Production capacities of the major SCFAs stratified by population. Fluxes denote totals of export fluxes scaled by genus abundance (see Methods). (C) Net production rates of the major SCFAs stratified by population. Fluxes denote the overall net production in the external medium/gut lumen (see Methods).
Export fluxes in general were pretty sparse which could again be expected from the minimization of import fluxes and the lack of the gut epithelium in the models (Figure 4A). However, we observed a large array of metabolites that was produced by the microbiota and secreted into the gut lumen. Those are always available to gut epithelium since they are a byproduct of maximizing growth in the microbiota. The associated export fluxes were in general much more sample-specific than imports. In particular we found a large set of metabolites that was only produced by a small set of samples and included all the major short-chain fatty acids (SCFAs) such as butyrate, acetate, propionate and its precursors which have been previously implicated in intestinal health (1, 35, 36). SCFA production seemed to be dependent on the consumption of a small set of starches, pectin and xylan (see Figure 4A). The overall production capacity (total production flux across all genera in the sample) for the major SCFAs showed large variations even in healthy individuals. Butyrate and propionate production capacities were diminished by about 2-fold in individuals with type 1 diabetes and also slightly altered (non-significant) in metformin negative individuals with type 2 diabetes (Figure 4B). However, most of the produced SCFAs were also consumed by the microbiota leaving only a small net production of SCFAs available for the host (at least in the absence of competition with the gut epithelium, see Figure S2). We observed that this net production was completely abolished for all major SCFAs in Danish metformin negative individuals with type 2 diabetes but was recovered in Danish metformin positive individuals (Figure 4C). This means that overshoot SCFA production is a common necessity from microbiota growth in healthy and metformin positive individuals but not in metformin negative individuals. This is consistent with previous findings in Danish and Chinese populations (3, 22, 37). However, we did not observe those effects in the samples from Swedish individuals which had generally higher production rates of the major SCFAs and showed only a slightly higher net production rate in metformin treated individuals (Figure 4C).
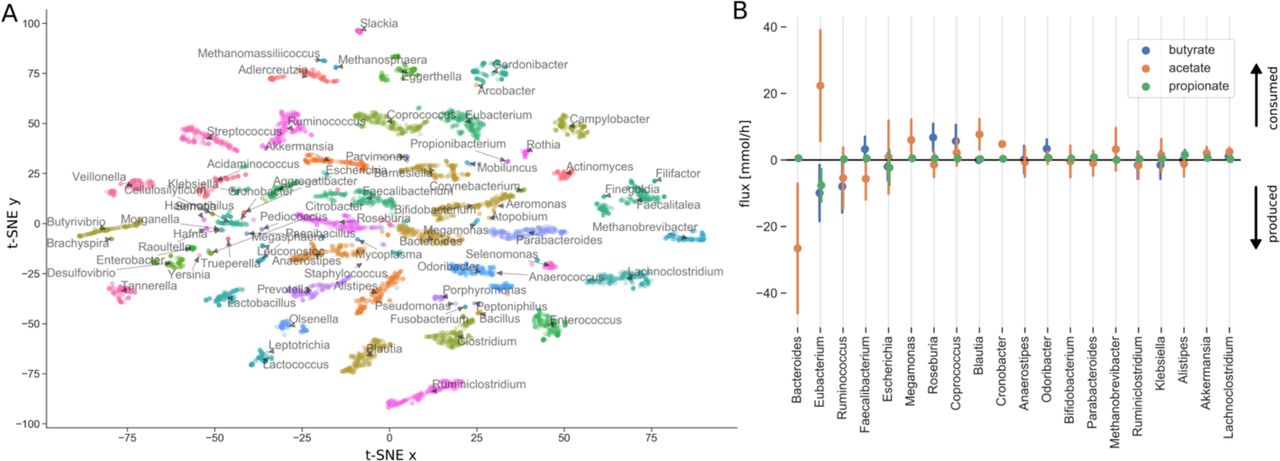
To visualize the structure of metabolite consumption by individual bacterial genera in the gut we used t-SNE dimensionality reductions on the individual genus-specific import fluxes (38). This showed a clear niche structure across samples were individual genera could usually be identified by their particular set of import fluxes (Figure 5A). Given the association between short chain fatty acids and disease progression we also tried to characterize the degree of SCFA cycling in the microbiota. Here we observed that butyrate was almost exclusively formed in an acetate-dependent manner from acetyl-CoA, which is the most prevalent pathway in bacteria (39). This was enabled by an extensive cross-feeding between the genera in the microbiota. Acetate was mainly produced by Bacteroides and metabolized by Eubacterium to yield butyrate and propionate (Figure 5B). However, production of SCFAs was complemented by several other genera generating a network of SCFA cycling within the microbiota. Other bacteria could selectively substitute Bacteroides and Eubacterium in order to maintain production of acetate and butyrate (Figure S3). Consequently, 20 bacterial genera showed notable (total exchange flux > 0.5 mmol/h) cross-feeding of SCFAs (Figure 5B). Cycling of SCFAs and downstream metabolites within the gut microbiota seemed to differ across metabolites. For instance, acetate and lactate were both produced and consumed by more than 20 genera, whereas propionate and pyruvate were only produced by a few genera (7 and 2 genera respectively, Figure S3).

(A) Import fluxes for each genus in each sample were reduced to two dimensions using t-SNE. Each point denotes a genus in one sample and is colored and named by its genus. (B) Genus-specific fluxes for the three major SCFAs. Shown are only genera that show large total SCFA exchange fluxes (> 0.5 mmol/h). Dots denote means across all samples and bars denote standard deviations. Fluxes are scaled by genus abundances (see Methods) and directed towards imports. Thus, positive fluxes denote consumption of the metabolite and negative fluxes secretion/export.
Finally, we aimed to quantify the impact that isolated interventions may have on the net consumption or production of particular metabolites by the microbiota. For this we chose three Swedish samples (normal, T2D metformin-, T2D metformin+) with the most diverse set of imports (largest set of imported metabolites) and which did not produce butyrate in the non-perturbed setting (optimization by cooperative trade-off, no optimization on import fluxes). The impact of a particular intervention was then quantified by using the elasticity coefficients (40, 41), a dimensionless measure of how strongly a particular parameter affects a particular flux (see Methods). The specific single target interventions we tested were either increasing the availability of any single metabolite in the diet or increasing a single bacterial abundance in the community. In general, we observed that the healthy individual showed lower elasticity coefficients than the two type 2 diabetes samples which can be interpreted as a certain robustness to changes (see Figure 6). Most interventions had a strong impact on the import fluxes (consumption of metabolites, yellow dots in Figure 6) but not on the net export fluxes (production of metabolites, brown dots in Figure 6). In particular there was no single intervention that would increase net butyrate production in any of the three samples tested.

Single target interventions and their effect on exchange fluxes between the microbiota and gut lumen. Edges denote interventions and are colored by their elasticity coefficient. Shown are only interactions and metabolites with an elasticity coefficient larger one (high sensitivity to changed parameters). Environmental parameters that were changed are indicated in green (microbial abundances) and gray (diet) and their exchange fluxes are colored in yellow if the microbiota produces the corresponding metabolite and in brown if the microbiota consumes the target metabolite.
Methods
Data availability and reproducibility
All data to reproduce the manuscript, intermediate results as well as Python scripts to reproduce the figures in this manuscript are available in a data repository at https://github.com/resendislab/micom_study. Metagenomic reads for the 186 individuals were obtained from the study of Pedersen et. al. and can be downloaded from the Sequence Read Archive (https://www.ncbi.nlm.nih.gov/sra) with the SRA toolkit (https://www.ncbi.nlm.nih.gov/sra/docs/toolkitsoft/). A full list of run accession IDs for the individual samples is provided in the data repository (“samples.csv”). All algorithms and methods used here were implemented in a Python package and can be easily applied to different data sets. The Python package “micom” (microbial communities) along with documentation and installation instructions is available at https://github.com/resendislab/micom. Micom is based on the popular COBRApy Python package for the constraint-based modeling of biological networks and is compatible with its API (42). The cooperative trade-off strategy as described here was introduced to micom in version 0.9.0. The AGORA reference reconstructions with an already applied average Western diet can be downloaded from https://vmh.uni.lu/#downloadview. Several methods used in micom require an interior point solver with capabilities for quadratic programming problems (QPs) for which there is currently only commercial software available. Micom supports CPLEX (https://cplex.org) and Gurobi (https://gurobi.org) both of which have free licenses for academic use. Intermediate results that required those solvers are also provided in the data repository to permit reproduction of our major conclusions.
Metagenomic shotgun data analysis
All metagenomic analyses were performed in R using an in-house pipeline which is available as an open source package along with documentation at https://github.com/resendislab/microbiome. Sample FASTQ files were downloaded using the SRA toolkit and trimmed and filtered using the DADA2 “filter_and_trim” function (43) with a left trimming of 10 bp, no right trimming, a quality cutoff of 10 and a maximum number of 2 expected errors under the Illumina model. Abundances across different taxa levels were then obtained using SLIMM (23) which was chosen since it supported one of the largest references (almost 5,000 reference bacterial genomes). In brief, all sample FASTQ files were first aligned to the SLIMM reference using Bowtie2 saving the 60 best matches for each read. Taxa abundance profiles were then obtained using SLIMM with the default parameters and assembled into a single abundance file. Genus-level quantifications for each sample were then matched to the AGORA models by their respective NCBI taxa id. The final quantification and mapping is provided in the data repository (“genera.csv” at https://github.com/resendislab/micom_study).
Strategies used in micom
Flux balance analysis obtains approximate fluxes for a given organism by assuming a steady state for all fluxes in the biological system and optimizing an organism-specific biomass reaction. Using the stoichiometric matrix S which contains reaction in its columns and metabolites in its rows this can be formulated as a constrained linear programming problem for the fluxes vi (in mmol/[gDW h]):

The biomass reaction vbm is usually normalized such that it will produce 1g of biomass which results in a unit 1/h corresponding to the growth rate μ of the organism. The upper and lower bounds (lbi and ubi, respectively) impose additional thermodynamic constraints on the fluxes or restrict exchanges with the environment (in the case of exchange fluxes). In order to describe a community model containing several organisms each with a particular abundance ai (in gDW) one usually embeds each organism in an external compartment which represents the community environment (for instance the gut lumen for models of the gut microbiota). Adding exchanges for the environment compartment and exchanges between a particular organism and the environment one obtains a community model with the following constraints:

Here, ai denotes the relative abundance of genus i, μi its growth rate,  its biomass flux,
  a user specified minimum growth rate,
  the exchange fluxes with the external environment, and lb and ub the respective lower and upper bounds. Additionally, μc denotes the community growth rate and
  the exchanges between the entire community and the gut lumen. The described constraints are identical to the ones employed in SteadyCom (18, 23). We assigned an upper bound of 100 mmol/[gDW h] for the internal exchange fluxes
  . Assuming a total microbiota biomass of 200 g and a representative bacterial cell dry weight of 2 pg (44), this corresponds to a maximum import or export of more than 100,000 molecules/[cell s]. Diet derived lower bounds with values smaller 10−6 mmol/[gDW h] were set to zero because they would correspond to an exchange of less than a 1 molecule/[cell s]. Subpopulations with relative abundances ai smaller 10−4 were discarded since they would not be able to affect the external metabolite levels in a significant way. Internal fluxes vi received respective bounds of 1000.0 (or 0 if irreversible) making them essentially unbounded. The described constraints are applied to all optimization problems in micom and will be further called the “community constraints”. It should be noted that internal exchange fluxes
  have to be scaled by the abundance of the respective sub-model when reporting to give the net exchange flux provided by the subpopulation i.
The cooperative trade-off method consists of two sequential problems. First, maximize the community growth rate μc to obtain  . Using a user specified trade-off α now solve the following quadratic minimization problem:

The knockout for a genus i was performed by setting all fluxes belonging to this genus along with its exchanges with the external environment to zero (lb=0 and ub=0). This is followed by running cooperative trade-off on the knockout model and comparing the growth rates after the knockout with the ones without the knockout.
Solvers and Numerical stabilization
Most genome-scale metabolic models usually do not treat more than 10,000 variables in the corresponding linear or quadratic programming problems. However, in microbial community models we usually treat 10s to 100s distinct genome-scale models which makes the corresponding problem much larger. Unfortunately, many open and commercial solvers have difficulties solving problems of that scale, so we also implemented strategies to increase the success rate of those optimizations. All linear and quadratic programming problems were solved using interior point methods as those were much faster than simplex methods for problems with more than 100,000 variables. Here, we used Cplex but also tested all methods with Gurobi. Since growth rates tend to be small we also multiplied the objectives used in cooperative tradeoff (maximization of community growth rate and minimization of regularization term) with a scaling factor in order to avoid near-zero objective coefficients. A scaling factor in the order of the largest constraint (1000.0) seemed to work well. Nevertheless, the default interior point methods for quadratic problems in Cplex or Gurobi were usually not capable of solving the minimization of the regularization term to optimality and usually failed due to numerical instability. However, the solutions reported by the aborted optimization run were usually close to the optimum but had the tendency to violate some numerically ill-conditioned constraints. To alleviate this problem, we implemented a crossover strategy were we took the solution of the numerically ill-conditioned quadratic interior point method as a candidate solution set  . Based on that we now optimized the following linear programming problem in order to restore feasibility:

Linear interior point methods are usually numerically stable so this linear programming problem can usually be solved to optimality. The maximization together with the new constraints will push the individual growth rates towards the candidate solution as long as it is numerically feasible.
Additionally, we found that normalizing the import fluxes to the total community mass also increased numerical instability since it leads to models where flux bounds varied up to ten orders of magnitude. A more stable strategy was to apply unscaled import fluxes and rather dividing all growth rates by the total community mass after optimization. Fluxes obtained this way can either be interpreted as the total flux across the entire microbiota (in mmol/h, our preference) or be scaled the same way to obtain fluxes per gDW of microbiota (in mmol gDW−1 h−1). In general, we divided the growth rates by community biomass of 200g as reported recently (44) and interpreted fluxes as total fluxes within the microbiota (in mmol/h).
Minimal media and exchange fluxes
By convention micom formulates all exchange fluxes in the import direction so that all import fluxes are positive and export fluxes are negative. Based on this, the minimal medium for a community was obtained by minimizing the total import flux:

Here  denotes the optimal genera growth rates obtained by cooperative trade-off. The community exchanges were then obtained by extracting all
  , whereas genus-specific exchanges were given by all
  as defined earlier.
Single target intervention studies
We used elasticity coefficients (40, 41) to evaluate the sensitivity of exchange fluxes to changes in exchange flux bounds (ergo diet changes) or changes in genus abundances. The logarithmic formulation of elasticity coefficients is given by
 where v denotes the exchange flux of interest and p the changed parameter. Since the absolute value removes information about the directionality of the flux this was logged separately to maintain this information. We used a value of 0.1 as differentiation step size in log space which which corresponds to a bound or abundance increase of about 10.5% in the native scale. To enable efficient computation elasticity coefficients were grouped by parameter, cooperative trade-off run once without modification, the parameter was increased, cooperative trade-off was run again and differentiation was performed for all exchange fluxes at once.
Discussion
There is a large amount of data on microbial abundances available today. This is mostly due to the cost efficiency of abundance-based experiments such as 16S rRNA sequencing or shallow shotgun sequencing (45). However, there is also a wide interest in extracting information from abundance data that goes beyond differential abundance testing (46). Here, metabolic modeling can be a valuable tool since it integrates a wide array of data. In particular it allows to integrate genomic data in the individual species-level metabolic models, diet information in the form of import flux bounds, and abundance data from metagenomic shotgun or marker gene sequencing. This allows to generate mechanistic predictions concerning the metabolism of the microbial community and its exchanges with the environment. However, the complexity of metagenome-scale metabolic models brings additional problems such as the inability to identify individual growth rates and slow computations. Here, we provided a strategy that alleviates those limitations and allows for complex analysis of the community structure and its metabolic consequences. Our regularization strategy allowed for a fast identification of unique sets of individual growth rates which operate in biological realistic ranges. This assumed that the microbiota will prefer enabling more species or genera to grow over maximizing the growth of only a few. We feel that this assumption is supported by the observation that most microbial communities are constituted by a large amount of species. Individual growth rates for bacterial genera varied greatly across samples (Fig. 2) and were only weakly dictated by the genus’ abundance in the sample (Fig. 3A). It seems that the large variation of growth rates can be explained by a dependency of the growth rate on the presence of other bacteria in the sample (compare Fig. 3B). Thus, bacterial growth in the gut microbiota is not only dictated by abundance but also by intra-microbiota interactions.
Using cooperative trade-off, we were able to estimate arising co-dependencies in 186 personalized community models. Cooperative effects where limited to a small set of genera that are often associated with health or disease. The microbiota composition also has a strong influence on the metabolites produced by the community and production of important compounds such as butyrate is hardly affected by interventions once established. Additionally, the predicted effects on SCFA production by the community fall in line with previous observations and suggest a potential application of community models in order to predict the metabolic impact of a particular microbiota composition in a personalized manner (22, 47). For instance, we showed that the connection between butyrate production and microbiota growth is fragile and forcing butyrate production to be a necessity of growth might be a robust strategy to improve gut health. We furthermore predicted a complex system of SCFA cycling in the microbiota which might serve to stabilize not only the overall production of SCFAs but also their ratios. Experiments in rat and mouse models have shown that ratios between the three major SCFAs help to control the fraction of goblet cells and underlie the maintenance and function of colonocytes (48–50).
However, it should be noted that our predictions are limited by a variety of factors, for instance the lack of metabolic models for the major cell types of the gut epithelium (especially goblet cells, enterocytes and colonocytes) and sample-specific nutrition data. Thus, we feel that the current major application for micom is to provide detailed functional hypothesis which can then be validated experimentally. Here, we identified the potential major contributors to SCFA production and cycling in the gut microbiota which may form the basis for identifying cross-feeding mechanisms to validate in vitro.
We observed that changes in metabolism seemed to require rather large changes in the community composition. Import fluxes varied only slightly across samples and most individual genera formed distinct niches. Furthermore, small single target interventions only had a substantial impact on the consumption rates of metabolites but could not affect the production of metabolites by the community in a consistent manner (Figure 6). Still, export fluxes did vary substantially across samples with different microbiota compositions (Figure 4A). In summary, this suggests that changes in the production of metabolites by the microbiota require relatively large-scale changes in the community and cannot be achieved by small-scale changes such as changing a single diet component or increasing the abundance of a single bacterial genus. This goes in line with the large success of fecal microbiota transplants (FMT) and we hope that the methods introduced here will help to leverage affordable microbiome data in order to design personalized intervention strategies. Additionally, the methods here extend to any ecosystem containing several microbial species. As such micom can be used to perform computational functional analysis for a wide class of microbial ecosystems.
Author contributions
CD developed/implemented the methods and performed the analysis. ORA developed the methods and designed the meta-analysis. All authors wrote the manuscript.
Acknowledgements
ORA thank the financial support of an internal grant from the National Institute of Genomic Medicine (INMEGEN/México).
References


