

Abstract
Rapid adaptation can be necessary to prevent extinction when populations are exposed to extremely marginal or stressful environments. Factors that affect the likelihood of evolutionary rescue from extinction have been identified, but much less is known about the evolutionary dynamics and genomic basis of successful evolutionary rescue, particularly in multicellular organisms. We conducted an evolve and resequence experiment to investigate the dynamics and repeatability of evolutionary rescue at the genetic level in the cowpea seed beetle, Callosobruchus maculatus, when it is experimentally shifted to a stressful host plant, lentil (Lens culinaris). Low survival (~ 1%) at the onset of the experiment caused population decline. But adaptive evolution quickly rescued the population with survival rates climbing to 69% by the F5 generation and 90% by the F10 generation. Population genomic data showed that rescue likely was caused by rapid evolutionary change at multiple loci, with many alleles fixing or nearly fixing within five generations of selection on lentil. By comparing estimates of selection across five lentil-adapted C. maculatus populations (two new sublines and three long-established lines), we found that adaptation to lentil involves a mixture of parallel and idiosyncratic evolutionary changes. Parallelism was particularly pronounced in sublines that were formed after the parent line had passed through an initial bottleneck. Overall, our results suggest that evolutionary rescue in this system is driven by very strong selection on a modest number of loci, and these results provide empirical evidence that ecological dynamics during evolutionary rescue cause distinct evolutionary trajectories and genomic signatures relative to adaptation in less stressful environments.
Impact Statement Evolutionary adaptation is an ongoing process in most populations, but when populations occupy particularly stressful or marginal environments, adaptation can be necessary to prevent extinction. Adaptation that reverses demographic decline and allows for population persistence is termed evolutionary rescue. Evolutionary rescue can prevent species loss from climate change or other environmental stresses, but it can also thwart attempts to control or eradicate agricultural pests and pathogens. Many factors affect the likelihood of evolutionary rescue, but little is known about the underlying evolutionary dynamics, particularly molecular evolutionary changes in multicellular organisms. Here we use a powerful combination of experimental evolution and genomics to track the evolutionary dynamics and genomic outcomes of evolutionary rescue. We focus on the seed beetle Callosobruchus maculatus, which is both an agricultural pest and a convenient model system. We specifically examine how this species is able to persist on a novel and very poor crop host, lentil.
We show that evolution in an experimental seed beetle populations increases survival on lentil from ~1% to >80% in fewer than a dozen generations. This rapid adaptive evolutionary change at the trait (i.e., phenotypic) level was associated with equally rapid evolution at the molecular level, with some gene variants (i.e., alleles) showing frequency shifts of around 30% in a single generation. In contrast to most other experimental evolution studies in multicellular organisms (particularly Drosophila fruit flies), we find that gene variants at multiple loci rapidly fix, that is, reach a frequency of 100%, during adaptation to lentil. Our results suggest that the dynamics and genetics of adaptation to severe conditions could be distinct from adaptation under more benign conditions. By comparing outcomes of adaptation across multiple lines and sublines, we show that repeated rapid adaptation at the trait level does not necessarily involve the same evolutionary changes at the molecular level. This limited parallelism was likely driven by extreme population bottlenecks caused by low survival in the early generations on lentil. Indeed, evolutionary changes in sublines formed after recovery from a common bottleneck were highly parallel. This coupling of demographic (i.e., ecological) and evolutionary changes during evolutionary rescue may therefore limit the predictability of evolution. Because colonization of novel environments may often occur after a bottleneck, our results could be of general significance for understanding patterns of parallel (and non-parallel) evolutionary change in nature.
Introduction
Decades of field and lab studies have overturned historical views of extreme evolutionary gradualism by showing that evolution can be rapid and relentless (e.g., Steinhauer and Holland, 1987; Grant and Grant, 2002; Thompson, 2013; Bergland et al., 2014; Elmer et al., 2014; Nosil et al., 2018). Evidence for rapid adaptive evolution is particularly common in human-altered environments (e.g., during adaptation to pesticides, antibiotics, or pollution; Palumbi, 2001; Vonlanthen et al., 2012; Cook and Saccheri, 2013) or when adaptation is driven by interactions among species (e.g., resource competition, host-pathogen interactions, or predator-prey interactions; Yoshida et al., 2003; Stuart et al., 2014; Antonio-Nkondjio et al., 2015; Behrman et al., 2018). Rapid adaptive evolution may even be necessary to prevent sustained demographic decline and extinction when populations are exposed to extremely marginal or stressful environments during a process known as evolutionary rescue (Gomulkiewicz and Holt, 1995; Bell and Gonzalez, 2009; Gonzalez et al., 2013; Lindsey et al., 2013; Orr and Unckless, 2014). Whereas most theory and experiments have focused on the probability of evolutionary rescue under different conditions (reviewed in Bell, 2017), much less is known about the evolutionary dynamics and genomic consequences of rescue when it occurs (but see Wilson et al., 2017).
Evolutionary rescue differs from other forms of adaptive evolution in a few key ways that could result in distinct evolutionary dynamics and genomic signals. First, evolutionary rescue necessarily couples ecological and evolutionary dynamics, because low absolute fitness in a deteriorating or stressful environment causes population decline that is then reversed when evolution leads to a sufficiently large increase in absolute fitness (Gomulkiewicz and Holt, 1995; Orr and Unckless, 2014). Second, compared to other cases of adaptive evolution, evolutionary rescue is more likely to occur via rapid adaptation in populations far from a phenotypic optimum (because population decline implies a poor fit to the current environment). Thus, major effect genes could contribute disproportionately to evolutionary rescue (McKenzie and Batterham, 1994; Orr, 2005). This prediction is supported by empirical evidence that major genes often drive the evolution of herbicide and insecticide resistance (ffrench Constant et al., 2004; Kreiner et al., 2017). Additionally, recent theory suggests that evolutionary rescue is more likely when standing genetic variation is present, and may often involve soft selective sweeps in which multiple beneficial mutations increase in frequency simultaneously (Hermisson and Pennings, 2005; Bell, 2017; Wilson et al., 2017). Thus, substantial genetic variation might be retained in a population throughout this process.
Because evolutionary rescue often involves rapid adaptation (e.g., Bell and Gonzalez, 2009; Bell, 2013; Vander Wal et al., 2013; Kreiner et al., 2017), cases of rescue could provide tractable opportunities to study the dynamics of adaptive alleles during a complete bout of adaptation, that is, from the onset of population decline to when a population has rebounded demographically. Such studies should also help determine whether instances of repeated ecological dynamics (e.g., population decline and recovery) are driven by repeatable evolutionary dynamics, and thus whether eco-evolutionary dynamics are repeatable or predictable (Rudman et al., 2018). Whereas experimental studies have documented patterns of ecological and evolutionary change during rescue (e.g., Bell and Gonzalez, 2009; Gonzalez and Bell, 2013; Ramsayer et al., 2013; Killeen et al., 2017), such work has mostly focused on microorganisms (but see, e.g., Agashe, 2009; Agashe et al., 2011) and has rarely been combined with genetic or genomic data. Here, we conduct an evolve and resequence experiment to investigate the dynamics and repeatability of evolutionary rescue at the genetic level in the cowpea seed beetle, Callosobruchus maculatus (Chrysomelidae), when it is experimentally shifted to a marginal host plant, lentil (Lens culinaris, Fabaceae).
Callosobruchus beetles infest human stores of grain legumes. Females attach eggs to the surface of legume seeds. Upon hatching, larvae burrow into and develop within a single seed. Because C. maculatus has been associated with stored legumes for thousands of years, laboratory conditions are a good approximation of its “natural” environment (Tuda et al., 2014). Beetle populations mainly attack grain legumes in the tribe Phaseoleae, particularly those in the genus Vigna (Tuda et al., 2006). Lentil (L. culinaris), a member of the tribe Fabeae, is a poor host for most C. maculatus populations, as larval survival in seeds is typically <5% (Messina et al., 2009a). However, lentil is used as a host by a few unusual ecotypes (Credland, 1987, 1990). Previous attempts to establish laboratory populations on lentil have often resulted in extinction (Credland, 1987), but in a few cases experimental lines have rapidly adapted to lentil (Messina et al., 2009b). For example, in three experimental lines, survival rose to >80% within 20 generations, and these lines have now persisted on lentil for >100 generations (Messina et al., 2009b). Thus, evolutionary rescue appears to characterize this system.
In the current study, we established a new lentil-adapted line, which we then split into two sublines before evolutionary rescue was complete, i.e., after the population began to rebound from an initial bottleneck, but before it reached a performance plateau (Fig. 1). We sampled and sequenced beetles nearly every generation, and could thus characterize genome-wide evolutionary dynamics on a fine temporal scale. Our goal was not to identify specific genes that mediate evolutionary rescue, but rather to determine (i) whether rescue depends on a few or many genetic loci, (ii) whether selection on individual genetic loci is consistent throughout the process, and (iii) whether selection causes alleles to fix or instead causes more subtle shifts in allele frequencies (via partial/incomplete sweeps), as has been observed during other evolve and re-sequence experiments with multicellular organisms (e.g., Burke et al., 2010). Then, by comparing patterns of change between the two new sublines and across three independently derived lines, we ask (iv) to what extent the dynamics and outcomes of genome-wide allele frequency changes during evolutionary rescue are repeatable. We are particularly interested in whether the inevitable bottleneck that precedes rescue increases variation in subsequent evolutionary dynamics. Bottlenecks could precede adaptation even in more benign environments if new populations are derived from a modest number of founders (e.g., Baker and Moeed, 1987; Spurgin et al., 2014; Haileselasie et al., 2018).

Design for the evolve and resequence experiment. The L14 lentil line was established from an Indian mung bean line (a). At the F5 generation, L14 was split into sublines A and B. Samples were taken for genetic analysis every generation up to F4 (black dots), and then in subline A in the F5–F8, and F16 generations (orange dots), and subline B in the F5, F8, and F16 generations (blue dots). Open circles denote generations in which fitness was assassyed. Bayesian estimates of survival on lentil (b). Survival was measured at generations L14–F5, L14A–F10, L14A–F20, and in the Indian mung bean line, which is shown as generation 0. Points and vertical lines denote posterior medians and 95% equal-tail probability intervals.
Methods
Study system, selection experiment and fitness assays
Both the long-established lentil lines (~100 generations on lentil) and the new line produced for the current study were derived from the same base population of C. maculatus that was originally collected from southern India (Messina, 1991; Mitchell, 1991). This population had been continuously reared on mung bean, Vigna radiata (L.) Wilczek, for >300 generations at the time we formed the new lentil line. Three lentil-adapted lines (L1-L3) were established as described by Messina et al. (2009a,b). Previous assays demonstrated that, for this Indian beetle population, initial survival to adult emergence is only 1-2% in lentil (Messina et al., 2009b; Messina and Jones, 2011). Consequently, there is always a severe initial bottleneck, and more than half of the attempts to produce a self-sustaining population on lentil seeds eventually fail (Messina et al., 2009a; Gompert and Messina, 2016). In the lines designated as L1-L3, survival increased rapidly over the course of only a few generations. Survival in these lines reached >60% after only five generations, and >80% in fewer than 20 generations (Messina et al., 2009a). At the same time, there were substantial decreases in development time and increases in body size. Genomic analyses of these lines did not commence until each had been maintained on lentil for 80-100 generations, and had reached a plateau with respect to performance on the novel host (Gompert and Messina, 2016). Hence, we were unable to capture the initial stages of adaptation.
We followed the same protocol to establish a new lentil line for genomic sampling in each successive generation (as described below). As expected, several initial attempts to produce a new lentil-adapted line eventually resulted in population extinction, but a single line (hereafter, L14) exhibited the rapid rise in survival previously observed in L1-L3 (see Results). This line was formed by adding >4000 founding adults to 1500 g of lentil seeds (about 24,000 seeds). Most F1 offspring emerged 55–65 days after the founding adults were added. We transferred F1 beetles (approximately 100–200 individuals) to a new jar to form the F2 generation.
Following the severe bottleneck in the initial generation on lentil, larval survival in seeds increased rapidly (as described below), so that we were able to use at least a few hundred beetles to form each successive generation. After five generations, the L14 population size was sufficiently high to implement standard culturing techniques, which involved transferring >2000 beetles to a new batch of 750g lentil seeds each generation (see “Culturing and establishing lines” in the OSM). At the F5 generation, the L14 line was split into sublines A and B (Fig. 1a). By doing so, we could assess whether evolutionary dynamics after a shared bottleneck were more repeatable or parallel than were dynamics across independently derived lines (i.e., across the L1–L3 lines established earlier). Thus, while we have replication in terms of the two sublines and our comparison with older lentil lines (L1–L3), we lack replication for evolutionary dynamics during the early stages of adaptation. Nonetheless, even a single instance of adaptation can provide important insights into how evolution can occur (e.g., Grant and Grant, 2002; Blount et al., 2008).
By the F5 generation, the population size of the L14 line was sufficiently high to apply our standard protocol for measuring survival in lentil from egg hatch to adult emergence (Messina et al., 2009a; Messina and Durham, 2015). We established a cohort of larvae in lentil seeds by first placing three pairs of newly emerged adults into each of 40 petri dishes containing about 100 lentil seeds. After 10-15 days, we collected a few seeds bearing a single hatched egg from each dish, and isolated each seed in a 4-ml vial. Vials were inspected daily for adult emergence until two weeks after the last adult had emerged. We collected a total of 224, 224, and 182 infested seeds for assays of the F5, F10, and F20 generations (Fig. 1b). For the F5 and F10 assays, we also measured survival in lentil in the ancestral, source population that had remained on mung bean. To reduce any effects of parental host, the L14 line was reverted back to mung bean for a generation (Messina et al., 2009a). Thus, parents of all test larvae had developed in mung bean. Survival probabilities were estimated using a Bayesian binomial model with an uninformative (Jefferys) beta prior on the survival proportions (this model has an analytical solution, so exact posteriors are presented).
Genetic data
We sampled and isolated genomic DNA from 48 adult beetles per generation for the L14 founders (the P generation) as well as for the F1-F4 generations. After L14 line was split into two sublines (A and B) we sampled beetles from subline A (L14A) at generations F5, F6, F7, F8 and F16, and from subline B (L14B) at generations F5, F8 and F16 (Fig. 1a). We generated partial genome sequences for these 624 C. maculatus beetles using our standard genotyping-by-sequencing approach (see “Our GBS approach” in the OSM; Gompert et al., 2012, 2014b). This approach provides a sample of SNPs distributed across the genome. We do not assume that the actual alleles responsible for lentil adaptation are included in this set of SNPs, but we do expect these data to include SNPs indirectly affected by selection on the causal genetic loci through linkage disequilibrium. Our genomic sampling scheme should thus provide a reasonable approximation for the evolutionary dynamics of the causal variants.
We used the aln and samse algorithms from bwa (ver. 0.7.10) (Li and Durbin, 2009) to align the 764 million ~86 bp DNA sequences (after trimming barcodes) to a new draft genome assembly for C. maculatus (Fig. S1; see “De novo assembly of a C. maculatus genome” and “Alignment and variant calling” in the OSM for details). We then identified SNPs using the Bayesian multiallelic/rare variant caller from samtools (version 1.5) and bcftools (version 1.6) (implemented with the -m option in bcftools call). SNPs were subsequently filtered based on a variety of criteria, such as minimum mean coverage (≈2× per beetle) and mapping quality (30) (see the OSM for details). We retained 21,342 high-quality SNPs after filtering. Genetic data from the long-established lentil lines (L1, L2, and L3) were described in Gompert and Messina (2016). These samples were collected after 100 (L1), 87 (L2) and 85 (L3) generations of evolution on lentil (N = 40 individuals per line), and also include a reference sample from the source mung bean line collected at the same time the lentil lines were sampled (M14, N = 48). We aligned these data to our new genome assembly and called SNPs as described above but only considering the 21,342 SNPs already identified from the L14 data set. 18,637 of these SNPs were validated in the L1–L3 data set.
We used a hierarchical Bayesian model to estimate the allele frequencies for the 21,342 SNPs in L14 at each sampled generation, and for the 18,637 SNPs in the L1, L2 and L3 data set (Gompert and Messina, 2016). This model jointly infers genotypes and allele frequencies while accounting for uncertainty in each due to finite sequence coverage and sequence errors, and thereby allows precise and accurate estimates of allele frequencies with low to moderate sequence coverage for individual beetles (see “Allele frequency model” in the OSM for details; Buerkle and Gompert, 2013). Allele frequency estimates were based on two Markov-chain Monte Carlo runs per sample (i.e., line by generation combination), with each consisting of a 5000 iteration burn-in and 15,000 sampling iterations with a thinning interval of 5. We then calculated the mean expected heterozygosity (across SNPs) and pairwise linkage disequilibrium among all pairs of SNPs each generation as summary metrics of genetic variation.
Parameterizing and testing a null model of genetic drift
We estimated the variance effective population size (Ne) during the experiment from patterns of allele frequency change, and then used the estimates of Ne to parameterize and test a null model of evolution solely by genetic drift. We did this not as a formal test for selection, but rather to identify the set of SNPs that were most likely to have been affected, at least indirectly (i.e., through linkage disequilibrium), by selection. We estimated variance effective populations sizes as described in Gompert (2016) using a Bayesian bootstrap method (see “Bayesian bootstrap” in the OSM for details; Jorde and Ryman, 2007; Foll et al., 2015). Distinct estimates of Ne were obtained for the following generation intervals and (sub)lines: from L14 P to L14 F4, from L14 F4 to L14A F16, and from L14 F4 to L14B F16. We placed a uniform prior on Ne (lower bound = 5, upper bound = 2000), and generated samples from the posterior distribution using 1000 bootstrap replicates.
We then asked whether the magnitude of allele frequency change for each SNP deviated from null expectations under a model of pure drift, given the estimated values of Ne (we used the posterior median for this). As with our estimates of Ne, we separately tested for deviations from neutrality for the following generation intervals and (sub)lines: from L14 to L14 F4, from L14 F4 to L14A F16, and from L14 F4 to L14B F16. We calculated the probability of the observed allele frequency change from the start to end of each of these intervals based on a beta approximation to the basic Wright-Fisher model (Ewens, 2004). Specifically, we assumed pt|p0 ~ beta(α + 0.001, β + 0.001), where  and pt are the allele frequencies at the beginning and end of the interval,
  is the number of generations between samples, and Ne is the variance effective population size. We retained SNPs with allele frequency changes more extreme than the 0.1th or 99.9th quantiles of the null distribution for any of the three time intervals for further analyses (Figs. S2, S3). We identified 198 SNPs (188 of which were variable in L1, L2 and L3) based on these relatively conservative criteria, and we hereafter focus primarily on the evolutionary dynamics at and effect of selection on these “focal” SNPs.
Quantifying patterns of linkage disequilibrium over time
To assess the potential for evolutionary independence among these focal loci, we calculated the squared correlation (r2) between genotypes for all pairs of the 198 SNPs as a metric of linkage disequilibrium (LD). Estimates of LD were made for each generation and (sub)line and were compared across generations. Hierarchical clustering and network-based methods were then used to identify and visualize groups or clusters of SNPs in high LD, with a focus on patterns of LD in L14–P, L14–F1, L14–F4, L14A–F16 and L14B–F16. We used the Ward agglomeration method implemented in the R hclust function for hierarchical clustering (from fastcluster version 1.1.24; Müllner et al., 2013). Clusters of high LD SNPs were then delineated using the cutreeDynamic R function (version 1.63-1) with the cut height set to 99% of the truncated height range of the dendrogram (Langfelder et al., 2016). Next, we visualized patterns of LD using networks with each of the 198 SNPs denoted by a node and edges connecting SNPs in high LD. To do this, we created an adjacency matrix from each LD matrix. SNPs were considered adjacent, that is connected in the network, when the r2 metric of LD was 0.25 or greater; this cut-off corresponds with the 97.5th quantile of the empirical LD distribution for the focal SNPs in L14 P. The R package igraph (version 1.2.1) was used to construct and visualize these networks (Csardi and Nepusz, 2006).
Estimating selection
We estimated the selection experienced by each of the 198 SNPs in L14 from generation P to F4, and then in each subline from generation F4 to F16. These estimates, including their consistency between earlier (up to F4) and later (from F4 to F16) stages of evolutionary rescue (i.e., adaptation to lentil) were used as our primary process-based metric of evolutionary dynamics (patterns of LD and allele frequency changes themselves provided pattern-based metrics of evolutionary dynamics). Selection coefficients were also estimated in the long-established lentil lines (L1-L3) for the subset of these SNPs (188 of 198) that were variable in these lines. Comparisons of selection coefficients across lines, sublines, and time periods allowed us to assess the consistency and repeatability of genomic changes associated with adaptation to lentil in C. maculatus.
We used approximate Bayesian computation (ABC) to fit Wright-Fisher models with selection and thereby estimate selection coefficients for each SNP in each (sub)line and time period (Ewens, 2004; Gompert and Messina, 2016). Here, we first describe the general approach and specific details for the L14 data analysis, and then discuss modifications for the long-established lentil lines. We assumed that marginal relative fitness values for the three genotypes at each locus were given by w11 = 1 + s, w12 = 1 + hs, and w22 = 1, where s is the selection coefficient, h is the heterozygote effect, and 1 and 2 denote the reference and non-reference allele, respectively. Critically, s reflects the combined effects of indirect and (possibly) direct selection on each SNP. That is, it includes the effect of selection transmitted to a SNP because of LD with one or more causal variants (Gompert et al., 2014a; Egan et al., 2015; Gompert et al., 2017).
With our ABC approach, we first sampled values of s and h from their prior distributions and then simulated evolution forward in time from the parental generation of L14 to generation F16 in sublines A and B while allowing for genetic drift (which was parameterized by the relevant estimate of Ne) and selection (this combines equation 1.24 from Ewens, 2004 with binomial sampling for genetic drift). Our primary interest was in estimating s, but we included h as a free parameter to account for the effect of uncertainty in h on inference of s, and to extract any information available from the data on h. We considered three models, (i) a fully constrained model with constant s (and h) over time and across sublines, (ii) a partially constrained model that allowed s and h to change at the F4 generation but with identical selection in both sublines, and (iii) an unconstrained model with a priori independent values of s and h prior to the subline split and in each subline after the split. We assigned a prior probability of  to each model. Simulation output comprised the full vector of allele frequencies across generations and sublines, which we then compared to the analogous allele frequency vector containing the observed data for each locus. As is standard with ABC methods, posterior distributions for s and h were generated by retaining (and correcting, see below) the set of parameter values that best recreated the observed allele frequency vector.
We based inferences of s and h for each of the 198 SNPs on five million simulations. The non-reference allele frequency for each SNP in the L14 founder generation (P) was used to initialize each simulation. We retained the sampled parameter values from the 0.02% of simulations (1000 samples) that generated allele frequency vectors with the smallest Euclidean distance to the observed allele frequency vector (across lines, sublines and generations). We then corrected these sampled parameter values by adjusting them towards the true posterior distribution using a weighted local linear regression (Beaumont et al., 2002). This was done with the abc function in the R abc package (version 2.1) (Csilléry et al., 2012). Model posterior probabilities were calculated using a simple rejection method, and posterior probabilities of s and h integrated over uncertainty in the best model except where noted otherwise. Simulations were used to assess the precision and accuracy of selection coefficient estimates with our ABC framework (see “Evaluation of the ABC approach” and Figs. S4 and S5 in the OSM)
We modified the method described above to obtain inferences for s in the L1, L2 and L3 lines. First, since the mung-bean source line was sampled contemporaneously with the long-established lentil lines rather than at the point in time when the lentil lines were founded, we first simulated evolution by genetic drift backwards in time (from M14 to the founding population of each lentil line) to obtain a starting value for forward-in-time simulations of evolution by selection and drift in each lentil line (see “The ABC model” in the OSM and Gompert and Messina, 2016 for additional details). Variance effective population sizes from Gompert and Messina (2016) were used for these simulations. Values of s and h were sampled from their prior distributions and the 0.02% of simulations that best matched the observed data were retained as described for L14, but in this case we compared only the final allele frequency in L1 F100, L2 F87 and L3 F85 with the simulated value after 100, 87 or 85 generations of evolution (we lack genetic data from the early stages of adaptation in these lines). Because this constraint greatly reduced the dimensionality of the summary statistics, many simulations gave exact matches to the observed data. This result caused the local linear regression to fail, but also made such an analyis unnecessary. Hence, we used simple rejection to obtain the posterior distributions of s for L1, L2 and L3.
Estimates of s were designated as credibly different from zero when the 95% equal-tail probability intervals (ETPIs) of the relevant posterior distribution did not overlap zero. Cases where this was not true do not constitute evidence of neutral evolution, but rather indicate that we cannot confidently distinguish among three possibilities: neutral evolution, selection favoring the non-reference allele, and selection favoring the reference allele. Comparisons of selection coefficients across lines, sublines or time intervals were made by calculating Pearson correlation coefficients (r). Rather than basing these calculations on the point estimates of s, we obtained posterior distributions for r by integrating over uncertainty in s (i.e., by calculating r for each posterior sample of s). Thus, uncertainty in s was propagated to downstream summary analyses.
Results
Fitness assays
Survival from egg hatch to adult emergence from lentil seeds was low as expected in the source mung bean population (~ 1%) (Fig. 1). Yet survival had risen to 69.2% by the F5 generation. Subsequent to the subline split, survival assays were only conducted in subline A. At generation F10, survival had further increased to 90.2%, and remained high (91.8%) at the F20 generation (Fig. 1). This pattern of rapid adaptation thus resembled those observed earlier in the L1-L3 lines.
Patterns of allele frequency change and LD in L14
We observed substantial evolutionary change over the course of the experiment, with an average net allele frequency change between generations P and F16 of 0.155 in subline A (SD = 0.150) and 0.159 in subline B (SD = 0.155). Average expected heterozygosity also declined over time, from 0.274 in generation P to 0.246 in generation F4, and finally to 0.222 (subline A) or 0.220 (subline B) in the F16 generation. Consistent with the observed decline in diversity and census population bottleneck, the variance effective population size was quite low initially (N̂e for P to F4 = 8.82, 95% credible intervals [CIs] = 8.60–9.04; Table 1). Variance effective population sizes then increased between generations F4 and F16 to 68.92 (95% CIs = 66.69–71.05) and 56.77 (95% CIs = 55.25–58.35) in sublines A and B, respectively. Even in the parental generation, LD was high between nearby SNPs (r2̅ = 0.369 for SNPs <100 bp apart), and modest out to 500 kb (r2̅ = 0.152) (Table S1, Fig. S6). On average, LD increased over the course of the experiment, although the upper quantiles of the LD distribution reached their maximum by the F4 generation before declining in both sublines.
Bayesian estimates of variance effective population sizes for different sublines and time periods.
Considerably greater evolutionary change was observed for the 198 SNPs with significant deviations from the null genetic drift model (i.e., the focal SNPs). For these SNPs, the average net allele frequency change over the experiment (from P to F16) was 0.611 in subline A (range = 0.004–0.973) and 0.616 in subline B (range = 0.018–0.980) (Figs. 2, S7). Many of these SNPs exhibited substantial allele frequency change in a single generation, with an mean (across SNPs), maximum single-generation change of 0.446 (range across SNPs = 0.175–0.7451). For 70.7% of these SNPs the maximum change occurred between the F2 and F3 generation (the mean absolute change for this generation was 0.370). By the F16 generation, the initially rarer allele (i.e., the minor allele) had reached a frequency of > 0.90 at 64.1% of these SNPS, and > 0.98 for 29.2% (subline A) or 22.2% (subline B) of them. Frequency changes during the first four generations were only modestly correlated with changes after the formation of the the two sublines (rP–F4,F4–F16A = 0.125, rP–F4,F4–F16B = 0.240), whereas evolutionary changes were more parallel between sublines after the split (rF4–F 16A,F4–F16B = 0.744, Fig. S8).

Plots depict patterns of allele frequency change for L14 subline A (L14A). Panels (a)–(j) show allele frequency (P) over time (Gen. = generation) for the 198 focal SNPs. Each line shows the allele frequencytrajectory for a single SNP and these are organized into panels by the LD clusters delineated in the F1 generation (Cl. = cluster number; see Fig. 3 and the main text for details). Colors correspond with those from L14–F1 in Fig. 3(a). The number of SNPs and number in each panel and number of scaffolds on which they reside is given. Panel (k) shows patterns of change for 50 randomly selected SNPs. In all cases, the frequency of the minor allele from the parental generation is shown. See Fig. S7 for similar results from L14B.
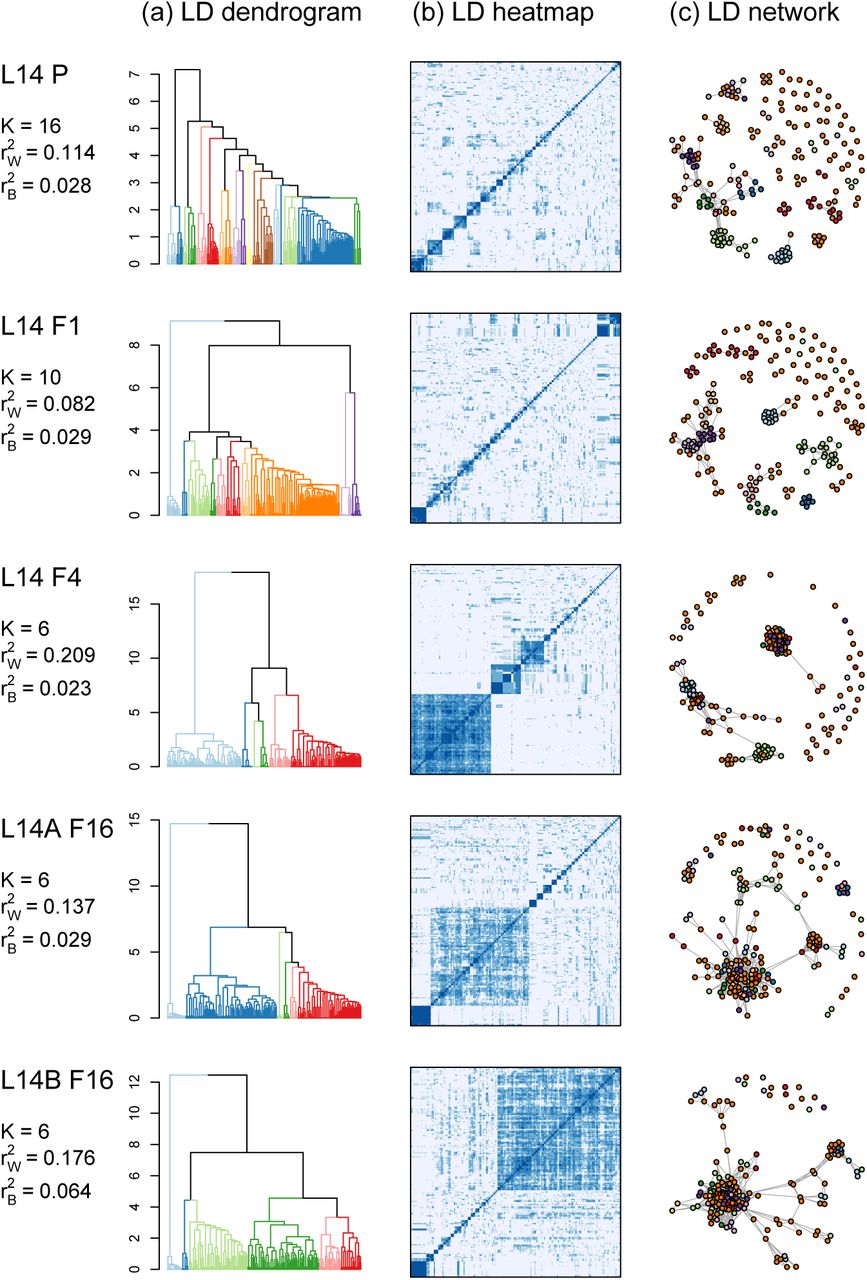
The 198 focal SNPs did not evolve independently, but instead were organized into clusters of high LD loci that exhibited similar patterns of allele frequency change (Figs. 2, 3, S9). We identified 16 and 10 clusters of high LD SNPs in the L14–P and L14–F1, respectively, which were reorganized into six high LD clusters by the F4 generation. LD within clusters was considerably higher than LD between clusters (e.g., mean r2 within,  versus mean among,
  in L14–F4; Fig. 3). Despite the fragmented nature of our reference genome (Fig. S1), we found that cluster membership was consistent with physical proximity, such that SNPs on the same scaffold were more likely to be assigned to the same cluster (p < 0.001 based on a randomization test in L14–F1). With that said, patterns of LD and cluster membership shifted over the experiment, particularly during the first four generations (Fig. 3b), such that pairwise LD in generations F1 and F4 were only modestly correlated (rF1,F4 = 0.199). Patterns of LD changed less after that; the correlations in pairwise LD between F4 and L14A–F16 and L14B–F16 were rF4,F16A = 0.605 and rF4,F16B = 0.569, respectively.

Patterns of LD among the 198 focal SNPs for L14–P, L14–F1, L14–F4, L14A–F16 and L14B–F16. Panel (a) shows dendrograms from hiearchical clustering of SNPs based on LD, with colors denoting clusters delineated with the cutreeDynamic function (colors do not track clusters across generations). The number of clusters (K) and mean LD for SNPs in the same
 versus different
 clusters are given. The corresponding pairwise LD matrixes are shown as heat maps in panel (b) (darker shades of blue denote high LD). Panel (c) shows networks connecting SNPs (nodes = colored dots) with high LD (r2 ≥ 0.25). Nodes are colored based on their cluster membership as defined by hierarchical clustering in the F1 generation (see panel a) (compare to Fig. S9).
Strength and consistency of natural selection
For most SNPs, constrained and unconstrained models had similar posterior probabilities (Fig. S10). Consequently, rather than focusing on a specific model, we report model-averaged selection coefficients. Consistent with the observed patterns of allele frequency change, selection coefficients were large on average, especially during the early stages of adaptation (i.e., from L14–P to L14–F4) (as expected, allele frequency change and estimates of selection were strongly correlated, with r > 0.8; Fig. S11). In particular, the average intensity of selection was 0.388 in L14 from P to F4, and 0.207 and 0.211 in sublines A and B between the F4 and F16 generations (Fig. 4; see Figs. S12, S13, S14, S15, S16 and S17 and text in the OSM for results using different priors). Of these 198 SNPs, we detected a credible effect of selection (that is, 95% ETPIs for s not overlapping zero) in 53 SNPs from six of ten LD clusters during the early phase of adaptation (from P to F4), and 53 and 51 SNPs from four of ten LD clusters during the later stage of adaptation (F4-F16) in sublines A and B, respectively (here we define LD clusters based on patterns of LD in L14–F1). Estimates of h were associated with considerable uncertainty, but there was a slight signal of an overall negative correlation between s and h (see “Heterozygous effect”, Table S3 and Figs. S18 and S19 in the OSM for details).
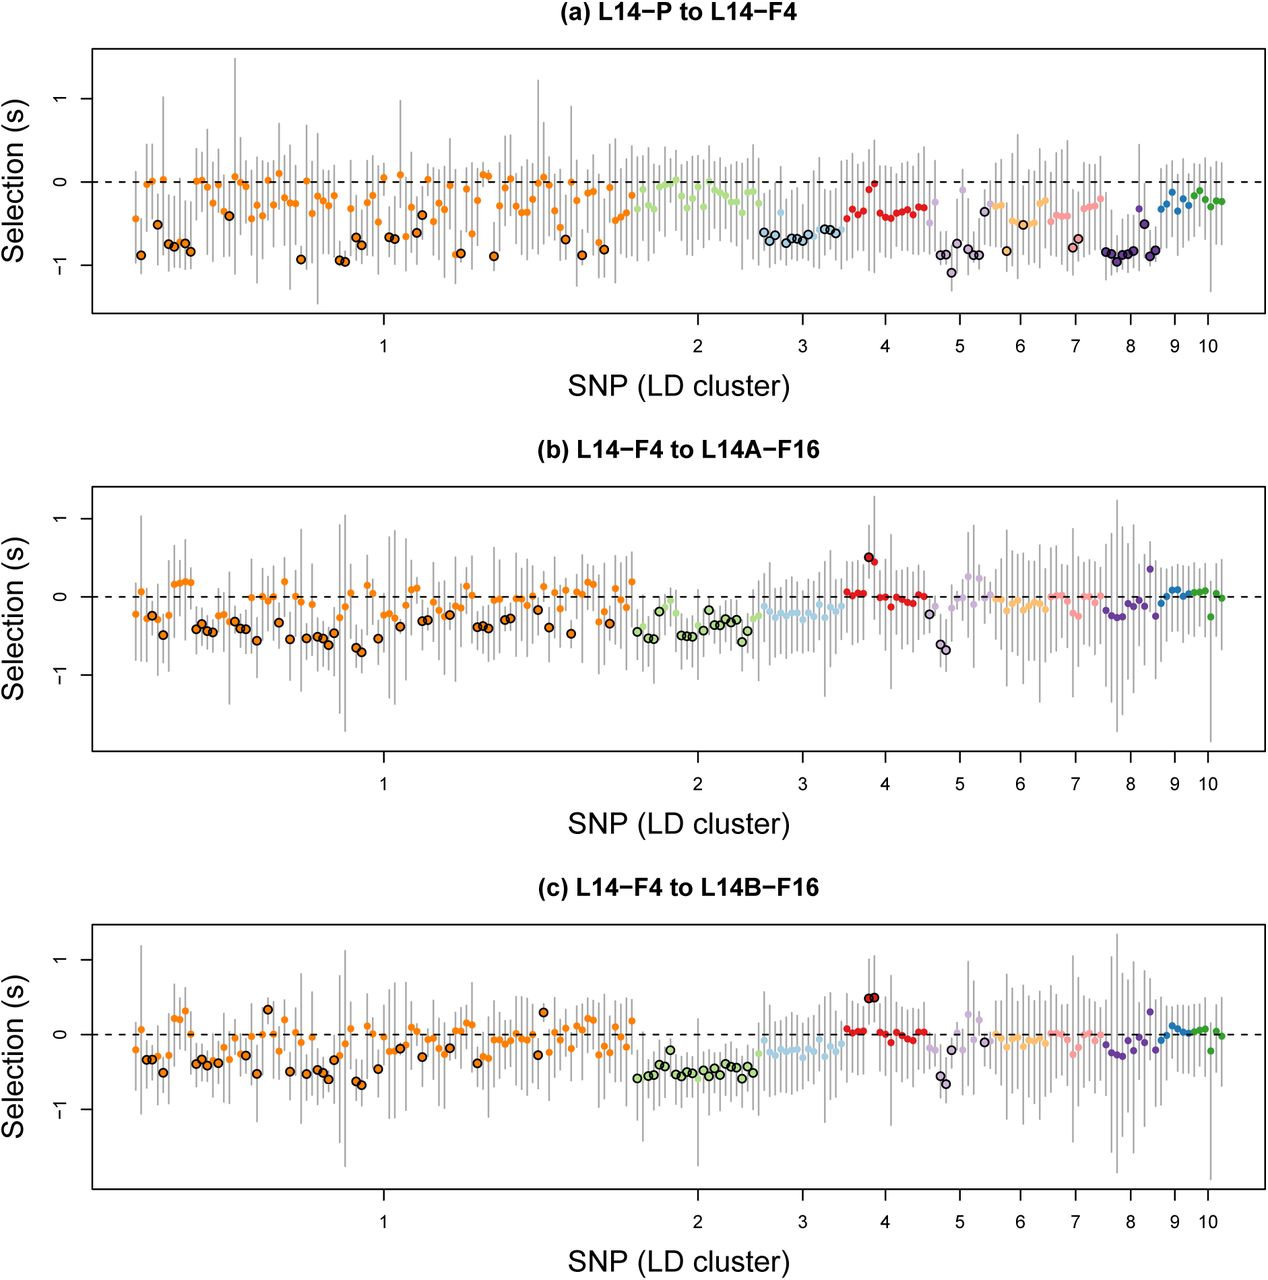
Scatter plots show Bayesian estimates of selection coefficients for the 198 focal SNPs in different generations and sublines. Dots and vertical bars denote posterior medians and 95% equal-tail probability intervals (ETPIs), respectively. Colors and the order of SNPs reflect LD cluster membership in the F1 generation. Black circles around dots denote cases where the 95% ETPIs exclude 0. For the purpose of visualization, we have polarized estimates of s such that negative values indicate selection favoring the minor allele.
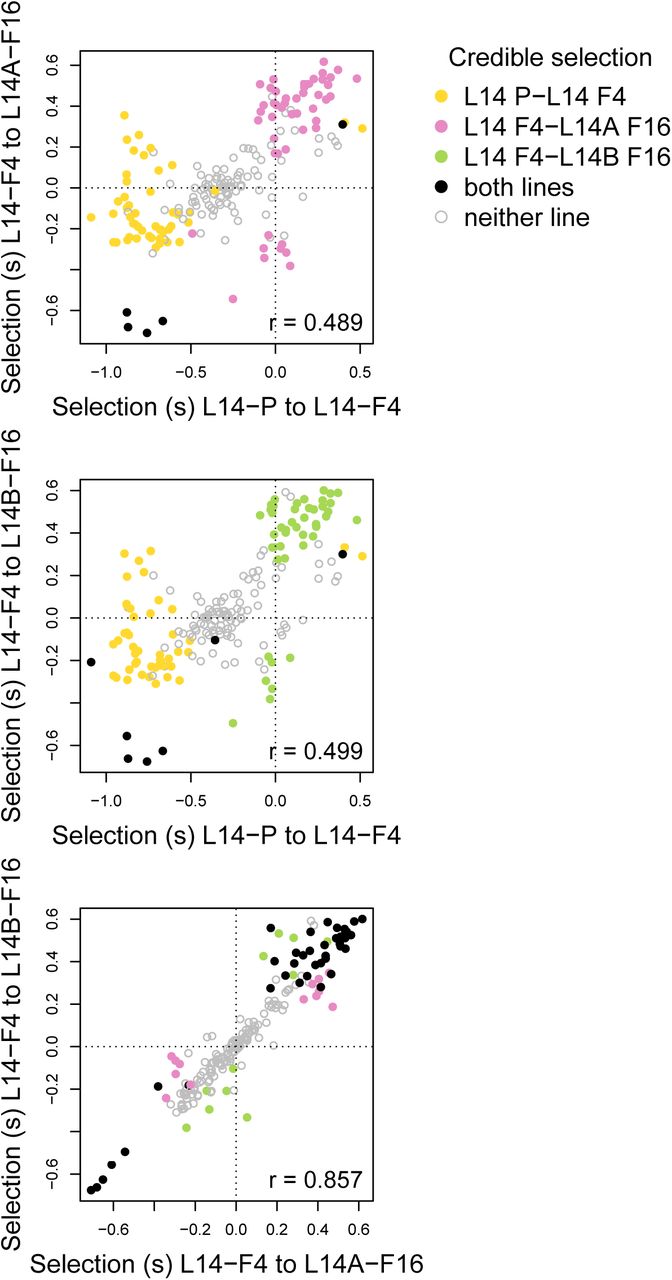
Only five and seven SNPs had credible effects of selection during both time periods for sublines A and B, respectively (Fig. 5a,b). Nevertheless, estimates of s during early (between P and F4) and late (from F4 to F16) adaptation were moderately correlated (rP–F4,F4–F16A = 0.489, rP–F4,F4–F16B = 0.499) (Table S4). Moreover, we never detected credible effects of selection with opposite signs between time periods. We obtained similar results when we based our inferences only on the fully unconstrained model (see “Sensitivity to model assumptions” and Figs. S17 and S20 and Table S5 in the OSM for details). We detected much greater consistency in estimates of s during the later stages of adaptation in the two sublines (rF4–F16A,F4–F16B = 0.857; Fig. 5c). Forty SNPs had credible effects of s in both sublines, and always with the same sign.

Scatter plots show the relationships between selection coeffcient estimates for the 198 focal SNPs in different time intervals and sublines. Dots correspond to SNPs and are colored based on whether there was credible evidence of selection in each subline/interval. Pearson correlations account for uncertainty in estimates of selection (i.e., they are not based solely on the point estimates shown here).
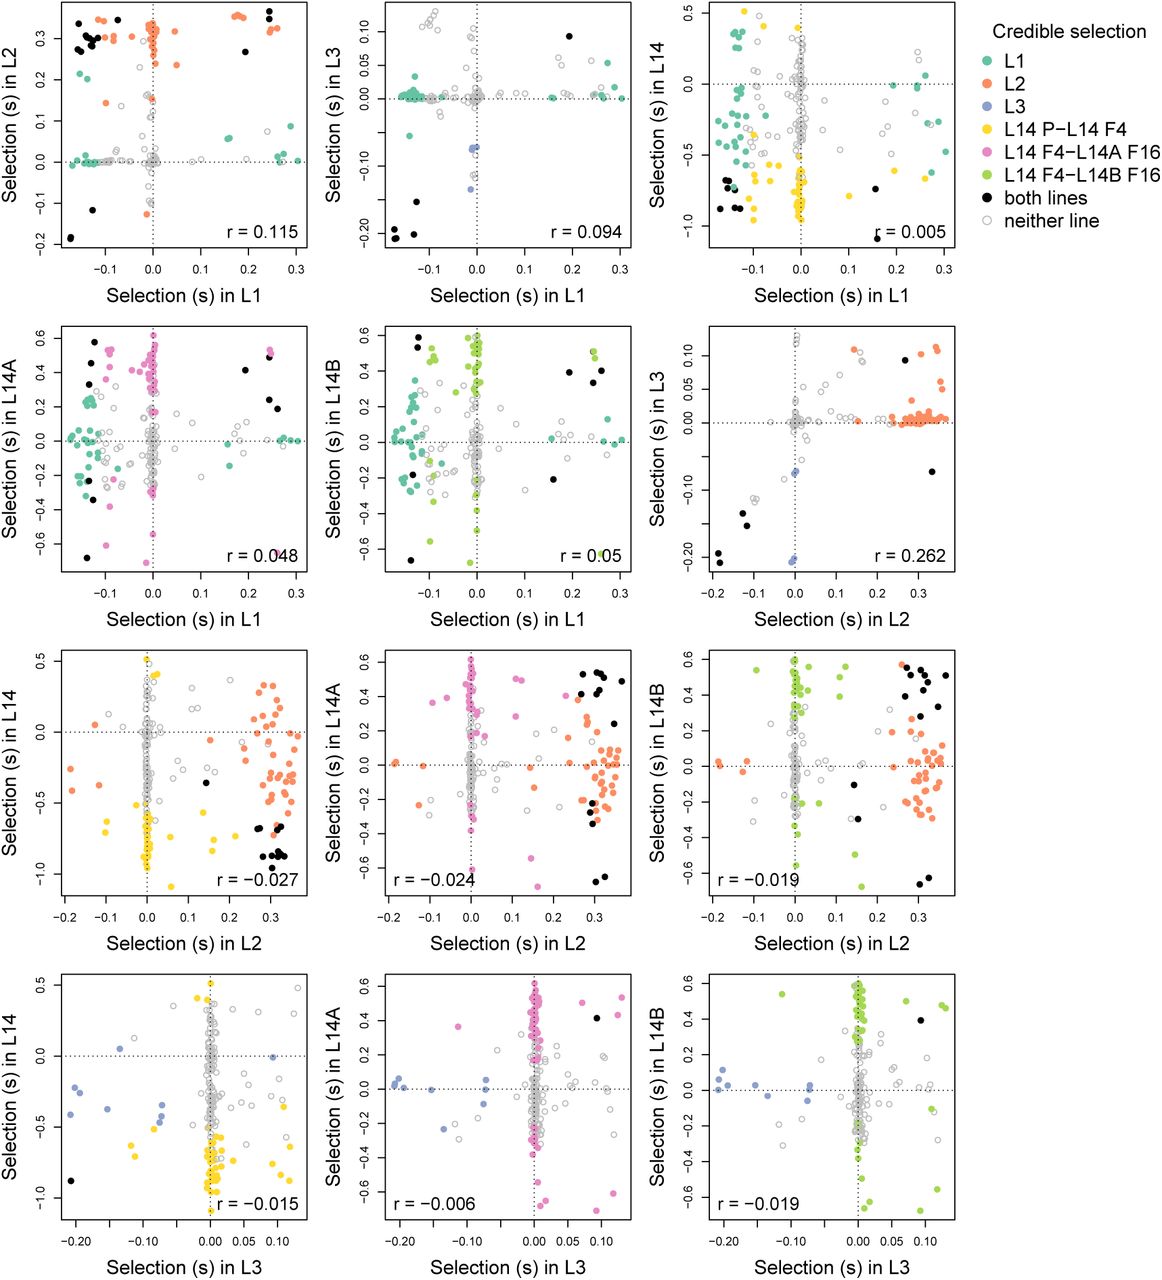
On average, estimates of s were lower for the long-established lentil lines with means of 0.067, 0.103 and 0.022 in L1, L2 and L3, respectively. Lower estimates of s are expected, as patterns of change were averaged over longer periods of time (this effect is evident in Gompert and Messina, 2016) and similar numbers of SNPs had values of s credibly different from zero (43 in L1, 55 in L2, and 10 in L3). Correlations in selection coefficients among the three long-established lines were considerably lower, ranging from 0.094 to 0.262 (Fig 6). There was an even weaker association between selection in the L14 line (and sublines) and any of the long-established lentil lines, with correlations ranging from −0.024 to 0.050 (Table S4).

Scatter plots show the relationships between selection coefficient estimates for the focal SNPs between lines and sub-lines. For comparisons with lines L1, L2, and L3, the 188 SNPs present in those lines are shown. Dots correspond to SNPs and are colored based on whether there was credible evidence of selection in each (sub)line. Pearson correlations accountfor uncertainty in estimates of selection (i.e., they are not based solely on the point estimates shown here).
Discussion
Using an evolve and resequence approach, we have shown that evolutionary rescue in C. maculatus on lentil occurred via rapid evolutionary changes at multiple loci. We found evidence of very strong selection on these loci (e.g., s̅ > 0.3 during the first four generations), consistent with the observed rapid increase in survival and rapid fixation or near fixation of initially rare alleles. Our results also suggest that semi-independent loci are involved in the very early stages of adaptation versus the later stages. Comparisons across (sub)lines indicated that evolutionary rescue occurred via a mixture of repeatable and idiosyncratic evolutionary changes. However, extreme parallelism was observed in sublines that were formed after the population recovered from an initial bottleneck. Hence, the repeatability of evolutionary rescue at the molecular level could depend on demographic factors early in the process of decline and recovery. We discuss these findings and their caveats below.
The genetic architecture and evolutionary dynamics of rescue
Survival rates on lentil increased from less than 1% to over 90% in just 10 generations. During this time, the new lentil line (L14) went through a severe bottleneck with the variance effective population size (Ne) dropping to fewer than 10 individuals before rebounding. Our results suggest that this demographic rebound was driven by adaptive evolutionary changes involving several to a dozen major causal loci. Specifically, we found evidence that very strong (indirect) selection drove evolutionary change at >100 SNP markers, which were organized into 4–12 high LD clusters. We hypothesize that each cluster comprises SNPs in LD with one or more distinct causal variants. If we are correct, our results suggest that rapid adaptation to lentil was driven by strong selection on oligogenic variation (consistent with Orr, 2005 and Bell and Gonzalez, 2009), similar to adaptation to freshwater in marine sticklebacks (Jones et al., 2012; Lescak et al., 2015). These results are consistent with theory predicting a greater role for major effect loci (and fewer total genes) during the early stages of adaptation, particularly when a population is far from a phenotypic optimum. Such circumstances may be common in cases of evolutionary rescue (Orr, 2005; Bell, 2017).
At more than 100 SNPs, the minor allele reached a frequency >90% within 16 generations (and in some cases within five generations). While we lack data on the underlying causal variants, we can assume that such variants evolved at least this rapidly during the same time period, as direct selection on a causal variant should generally exceed indirect selection on a marker locus in LD with that variant. We interpret this result as strong evidence that selection on standing genetic variation fixed or nearly fixed alleles (or haplotypes) at many of these causal loci. Thus, our results differ from other recent evolve and resequence experiments in eukaryotes (mostly Drosophila) where adaptation occurred by more subtle shifts in allele frequencies and incomplete selective sweeps (Burke et al., 2010; Orozco-terWengel et al., 2012; Burke et al., 2014; Tobler et al., 2014; Graves Jr et al., 2017). These different genomic outcomes likely reflect the fact that mean absolute fitness in the Indian C. maculatus population on lentil is initially extremely low. Thus, unlike in the aforementioned Drosophila experiments, selection likely continued to favor the same alleles until they reached fixation.
We found evidence of very strong selection on individual loci during this experiment, with average selection coefficients on the set of 198 focal loci ranging from 0.207 to 0.388 (depending on the subline and time interval). Although this magnitude of selection is much stronger than is commonly assumed in population-genetic theory, it is consistent with strong selection detected in other systems, such as sticklebacks (Barrett et al., 2008), phlox (Hopkins and Rausher, 2012), flies (Cardoso-Moreira et al., 2016) and stick insects (Gompert et al., 2014a; Nosil et al., 2018), as well as with the observed rapid rise in survival of C. maculatus on lentil. Thus, our work further highlights the importance of developing a more mature population-genetic theory of strong selection and rapid adaptation, especially in populations that colonize stressful novel environments (e.g., Gompert, 2016; Messer et al., 2016).
Despite the constant host environment during the experiment, selection on individual loci varied across generations, particularly in terms of the magnitude (but not direction) of selection. Several complementary explanations may account for this observation. First, given the observed patterns of allele frequency change at the SNP markers, some causal variants likely fixed or nearly fixed within the first five generations. After this, selection on these variants would have ceased, thereby reducing or eliminating selection on linked SNP markers. Second, epistatic interactions could have altered the marginal fitness effects of causal variants as allele frequencies changed. Epistatic interactions have previously been shown to play an important role in adaptation in several species, including mice (Steiner et al., 2007), yeast (Ono et al., 2017), and bacteria (Arnold et al., 2018). Third, direct selection on causal variants could be constant, but indirect selection on our SNP markers could shift as allele frequencies and LD evolve. Given the major shifts we see in patterns of LD, this is almost certainly part of the reason for the variable strength of selection over time. Lastly, some sources of selection could be density dependent. Male-male competition is common in high-density populations of C. maculatus (Hotzy and Arnqvist, 2009), and the Indian source population has particularly pronounced intraspecific competition at the larval stage (Messina, 1991; Fox and Messina, 2018).
Repeatability of evolutionary rescue
At the phenotypic level, the rapid rate of adaptation to lentil in the new L14 line closely matched that observed in earlier successful experimental host shifts to lentil (Messina et al., 2009b). Evidence for parallelism at the genetic level was less consistent. Specifically, we observed extreme parallelism in terms of allele frequency change and selection coefficients for the focal SNPs when comparing the two L14 sublines, but less parallelism was observed among the three long-established lentil lines (L1–L3) (consistent with Gompert and Messina, 2016), and there was little to no evidence of parallel evolutionary change between L14 and L1, L2, or L3. We think much of this variation in parallelism stems from differences in shared genetic variation available for selection across these cases (as has also been seen in evolve and resequence studies in Drosophila; Seabra et al., 2017). This hypothesis is further supported by the limited phenotypic and genetic parallelism that we observed in reversion lines derived from L1, L2 and L3 (Gompert and Messina, 2016; Messina and Gompert, 2017).
Perhaps most important, because lentil is a very stressful host, each lentil line went through a severe bottleneck when it was founded (Gompert and Messina, 2016). Thus, the subset of adaptive genetic variation (or adaptive gene combinations) available for selection in each line was likely quite different (e.g., Charlesworth, 2009; Tinghitella et al., 2011), which necessarily limits parallelism at the genetic level. In contrast, the two L14 sublines were split after they had begun to recover from a shared bottleneck, and likely shared a much greater proportion of adaptive alleles. Thus, our results suggest that bottlenecks associated with colonizing a new (and possibly stressful) environment (e.g., host) could put limits on parallel evolution.
In addition, evolutionary changes within the source mung bean line have likely altered the standing genetic variation initially available for adaptation to lentil in each line. Given the modestly high variance effective population size in this source line (Ne = 1149; Gompert and Messina, 2016) and the fact that the population has been kept on the same host for >1000 generations, we expected minimal evolution within this line, but yet it is clearly still evolving. L2 and L3 were formed within just a few generations of each other, and L1 was started about 20 generations before that (Messina et al., 2009b; Gompert and Messina, 2016). Consequently, these lines, and particularly L2 and L3, which show the greatest parallelism, had much of the same genetic variation available, at least before each bottleneck. L14 was formed more than 100 generations later, after much more time had passed for the source population to have evolved in meaningful ways (e.g., for rare alleles adaptive on lentil to have been lost). Taken together, our results suggest that demographic history can be a key determinant of the extent of parallel evolution at the genetic level, and that bottlenecks could decrease parallelism in cases of evolutionary rescue.
Conclusions
We documented rapid adaptation to a stressful host by seed beetles, and showed that it was associated with exceptionally rapid evolutionary change at numerous loci. This result does not mean that all (or any) of the focal SNPs drove adaptation to lentil. Rather, these SNPs were in LD clusters associated with the actual causal variants and thus indirectly affected by selection. Our approach differs in some respects from most evolve and resequence experiments (e.g., Burke et al., 2010; Orozco-terWengel et al., 2012; Tobler et al., 2014; Graves Jr et al., 2017). By foregoing the expenses associated with whole-genome sequencing (the standard approach), we were able to obtain (partial) genome sequence data that were tied to individual seed beetles and were also able to sample nearly every generation during adaptation. These individual-level data were critical for confidently measuring LD among the focal SNPs. Moreover, without the fine-scale temporal sampling, we likely would have missed most of the dynamics of adaptation. The latter constraint might not be a problem in systems where adaptation occurs more slowly, but it is hard to know the pace of adaptation without good temporal resolution. Thus, our results suggest a need for additional evolutionary studies with fine-scale temporal sampling.
Our results also suggest that understanding the repeatability/predictability of evolution might require considering both ecological (e.g., demographic) and evolutionary processes. We suggest that demographic events such as bottlenecks receive too little attention in some areas of evolutionary biology. For example, with increased attention on ecological speciation (Nosil, 2012), that is, with a greater focus on the nature and consequences of divergent selection in speciation, the contribution of demographic processes to speciation has perhaps been deemphasized. However, ecological speciation could often exhibit dynamics similar to what we observed here if it is initiated when a population colonizes a marginal environment. Thus, we suspect better integration of eco-evolutionary thinking throughout evolutionary biology (which is already underway, e.g., Hendry, 2016) will be very productive.
Author Contributions
ZG and FJM conceived and designed the study. FJM ran the selection experiment. ZG generated the DNA sequence data. AR an ZG analyzed the data. ZG and AR drafted the initial version of the manuscript and authors contributed to later versions of the manuscript.
Data Accessibility
DNA sequence will be archived in the NCBI SRA (accession numbers pending). Other data and computer code used to analyze these data will be archived in DRYAD.
Acknowledgments
This manuscript was improved by comments on earlier drafts by J. Fordyce, L. Lucas, C. Nice, P. Nosil, T. Saley, and A. Springer. We thank C. Bourgeois, S. Thelen, and C. Willden for technical assistance. This research was supported by the Utah Agricultural Experiment Station, Utah State University (UAES paper number 9119). The support and resources from the Center for High Performance Computing at the University of Utah are gratefully acknowledged.
Footnotes
Article type: Letter
Literature Cited


