

ABSTRACT
Non-invasive genomic research on free-ranging mammals typically relies on the use of fecal DNA. This requires the isolation and enrichment of endogenous DNA, given its small proportion compared to bacterial DNA. Current approaches for acquiring large-scale genomic data from feces rely on bait-and-capture techniques. While this technique has greatly improved our understanding of mammalian population genomics, it is limited by biases inherent to the capture process, including allele dropout, low mapping rates, PCR duplication artifacts, and structural biases. We report here a new method for generating whole mammalian genomes from feces using fluorescence-activated cell sorting (FACS). Instead of enriching endogenous DNA from extracted fecal DNA, we isolated mammalian cells directly from feces. We then built fragment libraries with low input material from commercially available kits, which we sequenced at high and low coverage. We validated this method on feces collected from primates stored in RNAlater for up to three years. We sequenced one fecal genome at high coverage (12X) and 15 additional fecal genomes at low coverage (0.1X - 4X). For comparative purposes, we also sequenced DNA from nine blood or tissue samples opportunistically collected from capuchin monkeys that died of natural causes or were treated in a local rehabilitation center. Across all fecal samples, we achieved median mapping and duplication rates of 82% and 6%, respectively. Our high-depth fecal genome did not differ in the distribution of coverage, heterozygosity, or GC content from those derived from blood or tissue origin. As a practical application of our new approach with low coverage fecal genomes, we were able to resolve the population genetic structure of capuchin monkeys from four sites in Costa Rica.
INTRODUCTION
Advances in DNA sequencing technology have allowed for great strides to be made in comparative genomics (Arandjelovic & Vigilant, 2018; Corlett, 2017; Perry, 2014). It is now commonplace in a single study of a non-model organism to sequence partial genomes from multiple individuals. If fresh tissue or blood samples can be acquired from a handful of individuals, sequencing a de novo reference genome or generating a panel of single nucleotide variants is relatively straightforward. However, answering population level questions typically depends upon the non-invasive collection of fecal samples from free-ranging animals. Unfortunately, less than 5% of the extracted DNA from a fecal sample typically originates from an endogenous source (i.e. the host animal) (Hernandez-Rodriguez et al., 2017; Snyder-Mackler et al., 2016), while the remaining 95% comes from microorganisms and dietary items. For many species, this combination of factors makes is unfeasible to sequence whole genomes at high coverage from a large number of individuals. The resulting dearth of population-wide high-coverage genomes limits the scope of questions that can be asked and answered in genomics, ecology, and conservation.
Thanks to recent advances in non-invasive genomics, it has become possible to sequence partial genomes by enriching the proportion of endogenous DNA in feces (Chiou & Bergey, 2018; Perry, Marioni, Melsted, & Gilad, 2010; Snyder-Mackler et al., 2016). Through the use of targeted bait-and-capture and reduced representation libraries, this approach allows for the sequencing of single nucleotide variant (SNV) sets, which has begun to provide important insights into population structure and local adaptation of free-ranging mammals (Chiou, 2017; de Manuel et al., 2016; Wall et al., 2016). Despite the promise of this approach, DNA enrichment suffers from biases and impracticalities that limit its ability to uniformly cover a genome. Current bait-and-capture techniques are subject to inherent biases in the type of DNA captured (e.g. non-repetitive elements, GC content, reduced representation libraries, inconsistent hybridization); requires the costly and time consuming generation of RNA or DNA baits; have limited ability to enrich endogenous DNA (mean: ~57% of mapped reads (Snyder-Mackler et al., 2016)); and have high average PCR duplication rates (mean: ~38% of mapped reads (Snyder-Mackler et al., 2016)). Methylation-based enrichment offers a promising and cost-effective alternative to bait-and-capture for SNV generation, although it also suffers from inherent bias in the composition of the enriched libraries, and has limited enrichment capacity (mean: <50% of mapped reads (Chiou & Bergey, 2018)). While both approaches are viable for partial data, neither offers the realistic possibility of truly unbiased, cost-effective whole genome sequencing.
Through a novel application of fluorescence-activated cell sorting (FACS), we present a rapid, cost-effective method of isolating a host animal’s intestinal epithelial cells for DNA extraction and genome sequencing. With this approach, we have routinely mapped more than 80% of reads to the host genome, strongly suggesting they are from endogenous DNA. This method requires no targeted enrichment of DNA, RNA baits, or methylation. It allows for DNA to be extracted and libraries built with commercially available kits, removing many of the challenges of enrichment-based techniques. Furthermore, our method allows for the long-term, room-temperature stabilization of samples, making it possible for field workers to collect samples with ease from remote areas without the need for temperature sensitive storage.
Here, we propose a novel protocol to isolate intestinal epithelial cells from the feces of white-faced capuchin monkeys (Cebus imitator) up to three years after initial collection. From these cells, we generated low coverage genomes from 17 fecal samples and selected one of them for deeper sequencing (targeting ~10X - 15X coverage). In so doing, we have generated the first uniformly-distributed, high-coverage, whole genome of a mammal from its feces. To demonstrate the breadth of fecal FACS, we also conducted an analysis of population genetic structure in two Costa Rican forest reserves using DNA derived from both fecal FACS and traditional blood/tissue extractions.
METHODS
2.1 Sample Collection
We collected fecal samples from free-ranging white-faced capuchin monkeys (Cebus imitator) at Sector Santa Rosa (SSR), part of the Área de Conservación Guanacaste in northwestern Costa Rica, which is a 163,000 hectare tropical dry forest nature reserve (Figure 1). Behavioral research of free-ranging white-faced capuchins has been ongoing at SSR since the 1980’s which allows for the reliable identification of known individuals from facial features and bodily scars (Fedigan & Rose-Wiles, 1996). We collected 14 fresh fecal samples from 12 white-faced capuchin monkeys immediately following defecation (Table 1). We placed 1 mL of feces into conical 15 mL tubes pre-filled with 5 mL of RNAlater. RNAlater preserved fecal samples were sent to the University of Calgary, where they were stored at room temperature for up to three years. To evaluate other preservation methods, we also collected two additional capuchin monkey fecal samples (SSR-FLand a section of SSR-ML) and one spider monkey (Ateles geoffroyi) fecal sample, which we stored in 1X PBS buffer and then froze in liquid nitrogen with a betaine cryopreservative (Rinke et al., 2014). Given the logistical challenges of carrying liquid nitrogen to remote field sites, we prioritized evaluation of samples stored in RNAlater.

Map of sampling sites. Sector Santa Rosa (SSR) and Cañas are situated in the northern dry forest and samples from Quepos and Manuel Antonio are from the southern wet forest. Map courtesy of Eric Gaba—Wikimedia Commons user: Sting.
Origins and preservation information for Cebus imitator samples.
Finally, we took tissue and blood samples opportunistically. During the course of our study, 4 individual capuchin monkeys died of natural causes at SSR, from whom we were able to collect tissue samples, which we stored in RNAlater. By collaborating with Kids Saving the Rainforest veterinary rehabilitation clinic in Quepos, Costa Rica, we acquired blood samples from 5 more Costa Rican white-faced capuchins who were undergoing treatment at the facility (although we were unable to collect paired fecal samples). Samples were collected with permission from the Area de Conservacion Guanacaste (ACG-PI-033-2016) and CONAGEBIO (R-025-2014-OT-CONAGEBIO). Samples were exported from Costa Rica under permits from CITES and Area de Conservacion Guanacaste (2016-CR2392/SJ #S 2477, 2016-CR2393/SJ #S 2477, DGVS-030-2016-ACG-PI-002-2016; 012706) and imported with permission from the Canadian Food and Inspection agency (A-2016-03992-4).
2.2 FACS
Before isolating cells by Fluorescence-activated cell sorting (FACS), fecal samples were prepared using a series of washes and filtration steps. Fecal samples were vortexed for 30 s and centrifuged for 30 s at 2,500 g. Then the supernatant was passed through a 70 um filter into a 50 mL tube and washed with DPBS. After transferring the resultant filtrate to a 15 mL tube, it was centrifuged at 1,500 RPM for 5 minutes to pellet the cells. Then we twice washed the cells with 13 mL of DPBS. We added 500 uL of DPBS to the pellet and re-filtered through a 35 um filter into a 5 mL FACS tube. We prepared a negative control (to control for auto-fluorescence) with 500 uL of DPBS and one drop of the cell solution. To the remaining solution, we added 1 uL of AE1/AE3 Anti-Pan Cytokeratin Alexa Fluor® 488 antibody or TOTO-3 DNA stain, which we allowed to incubate at 4°C for at least 30 minutes.
We isolated cells using a BD FACSAria™ Fusion (BD Biosciences) flow cytometer at the University of Calgary Flow Cytometry Core. To sterilize the cytometer’s fluidics before processing each sample, we ran a 3% bleach solution through the system for four minutes at maximum pressure. We assessed background fluorescence and cellular integrity, by processing the negative control sample prior to all prepared fecal samples. For each sample we first gated our target population by forward and side scatter characteristics that were likely to minimize bacteria and cellular debris (Figure 2). Secondary and tertiary gates were implemented to remove cellular agglomerations. Finally, we selected cells with antibody or DNA fluorescence greater than background levels. In cases when staining was not effective, we sorted solely on the first three gates. Cells were pelleted and frozen at −20°C.

FACS gating strategy. Cells were gated first by size and complexity to avoid bacteria and cellular debris (A), followed by discrimination of cellular agglomerations (B and C). Fluorescence of AE1/AE3 Anti-Pan Cytokeratin Alexa Fluor® 488 antibody (FITC-A) is depicted in unstained (D) and stained (E) cellular populations. Epithelial cells were identified as those fluorescing beyond background levels, as depicted in the P4 gate.
2.3 DNA Extraction and Shotgun Sequencing
We extracted fecal DNA (fDNA) with the QIAGEN DNA Micro kit, following the “Small volumes of blood” protocol. To improve DNA yield, we increased the lysis time to three hours, and incubated 50 μL of 56°C elution buffer on the spin column membrane for 10 minutes. DNA concentration was measured with a Qubit fluorometer. Additionally, to calculate endogenous DNA enrichment, we extracted DNA directly from five fecal samples prior to their having undergone FACS. We extracted DNA from the nine tissue and blood samples using the QIAGEN Gentra Puregene Tissue kit and DNeasy blood and tissue kit, respectively.
For the fecal samples, DNA was fragmented to 350 bp with a Covaris sonicator. We built whole genomic sequencing libraries with the NEB Next Ultra 2 kit using 10-11 PCR cycles. Fecal genomic libraries were sequenced on an Illumina NextSeq (2×150 PE) at the University of Calgary genome sequencing core. We resequenced one fecal sample at high coverage on an Illumina HighSeq 4000 at the McDonnell Genome Institute at Washington University in St. Louis (MGI). High-coverage, whole genomic shotgun libraries were prepared for the blood and tissue DNA samples and sequenced on an Illumina X-10 at MGI.
2.3 Mapping and SNV Generation
Reads were trimmed of sequencing adaptors with Trimmomatic (Bolger, Lohse, & Usadel, 2014). Subsequently, we mapped the Cebus reads to the Cebus imitator 1.0 reference genome (GCF_001604975.1) with BWA mem (Li & Durbin, 2009) and removed duplicates with Picard Tools (http://broadinstitute.github.io/picard/). We called SNVs for each sample independently using the Cebus genome and the GATK UnifiedGenotyper pipeline (-out_mode EMIT_ALL_SITES) (McKenna et al., 2010). Genomic VCFs were then combined using GATK’s CombineVariants restricting to positions with a depth of coverage between 3 and 100, mapping quality above 30, no reads with mapping quality zero and variant PHRED scores above 30. Sequencing reads from one of the high coverage fecal samples (SSR-FL) bore a strong signature of human contamination (16%), and were thus excluded from SNV generation. We included reads from nine tissue/blood samples and one frozen fecal sample with high coverage (SSR-ML). In total, we generated 4,184,363 SNVs for downstream analyses.
To remove potential human contamination from sequenced libraries, we mapped trimmed reads to the Cebus imitator 1.0 and human (hg38) genomes simultaneously with BBsplit (Bushnell, 2016). Using default BBsplit parameters, we binned separately reads that mapped unambiguously to either genome. Ambiguously mapping reads (i.e. those mapping equally well to both genomes) were assigned to both genomic bins, and unmapped reads were assigned to a third bin. We calculated the amount of human genomic contamination as the percentage of total reads unambiguously mapping to the human genome (Table 2). After removing contaminant reads, all libraries with at least 0.5X genomic coverage were used for population analysis.
FACS and mapping results from Cebus and Ateles fecal samples
In order to test the effect of fecal FACS on mapping rates, we selected five samples at random (SSR-CH, SSR-NM, SSR-LE, SSR-PR, SSR-SN) to compare pre-and post-FACS mapping rates. To test for an increase in mapping percentage, we ran a one-sample paired Wilcoxon signed-rank test on the percentages of reads that mapped exclusively to the Cebus genome before and after flow FACS. Additionally, we ran Pearson’s product moment correlations to test for an effect of the number of cells (log10 transformed) on rates of mapping, read duplication, and ng of input DNA. The above tests were all performed in R.
2.5 High coverage fecal genome comparison
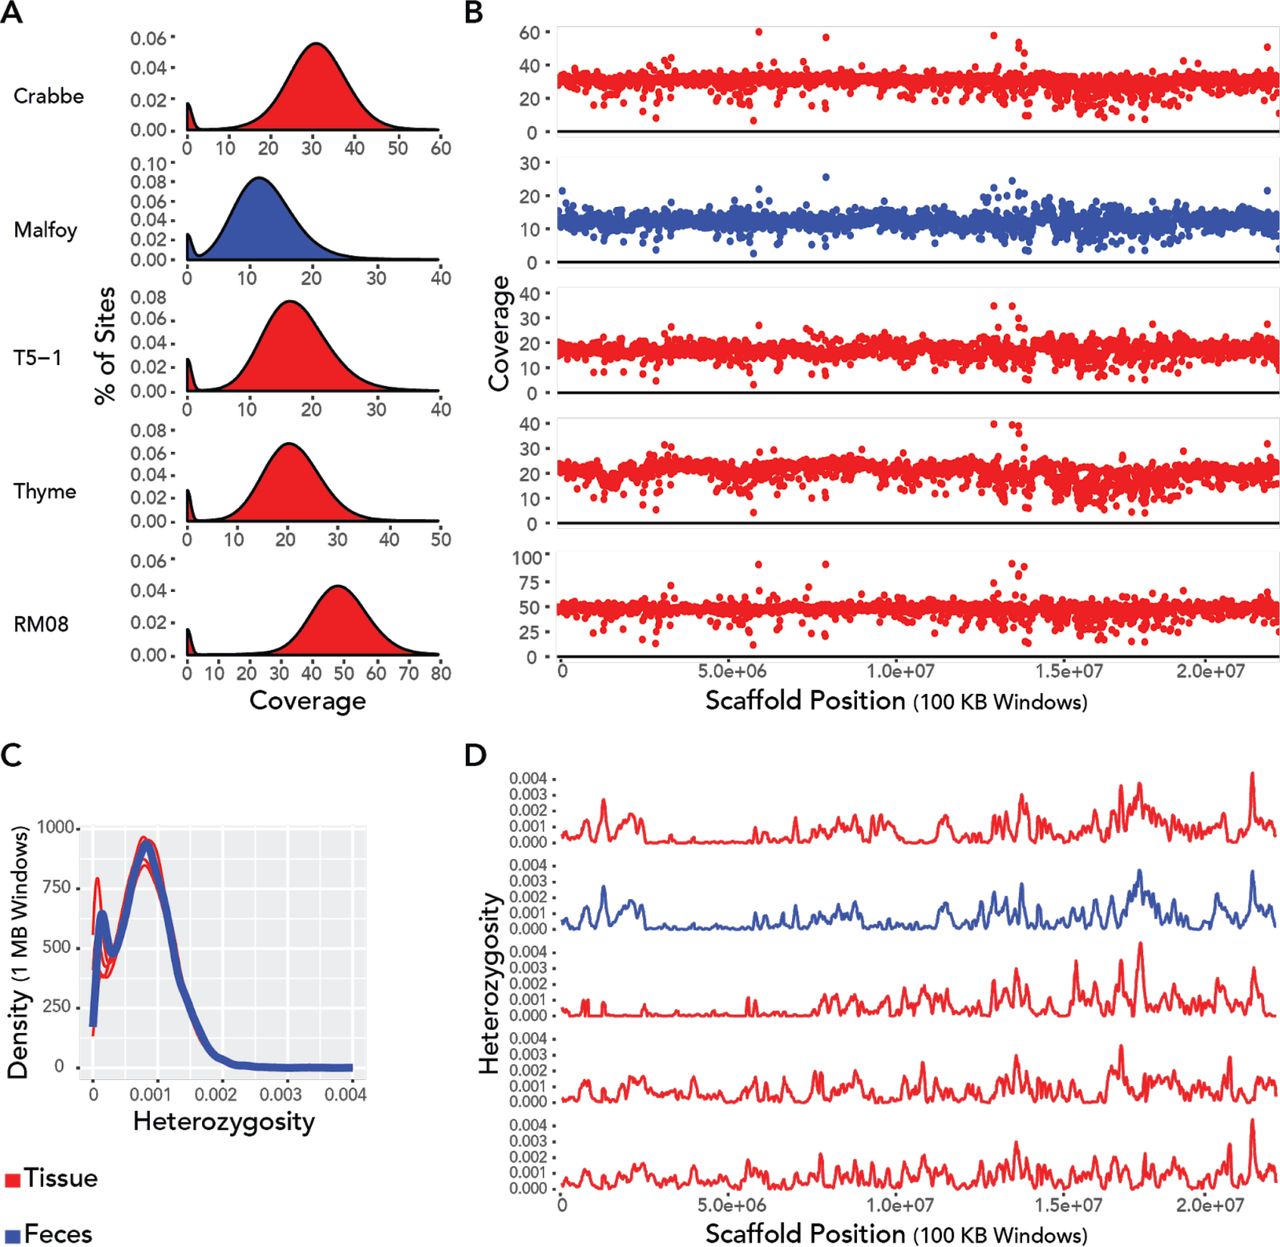
We made several comparisons between our high-coverage feces-derived genome and the blood/tissue-derived genomes using window-based approaches. For each test, the feces-derived genome should fall within the range of variation for members of its population of origin (SSR). Deviations from this, for examples all fecal genomes clustering together, would indicate biases in our DNA isolation methods. To assess this, we constructed 10 KB / 4KB sliding windows along the largest scaffold (21,314,911 bp) in the C. imitator reference genome. From these windows, we constructed plots of coverage density and the distribution of window coverage along the scaffold. Secondly, we assessed the level of heterozygosity in 1 MB / 200 KB sliding windows throughout the ten largest scaffolds. For each high-coverage genome, we plotted the density distribution of window heterozygosity. We measured genome-wide GC content with the Picard Tools CollectGcBiasMetrics function. The percentage of GC content was assessed against the distribution of normalized coverage and the number of reads in 100 bp windows per the number reads aligned to the windows.
2.6 Population genomic analysis
Given the large degree of difference in coverage among our samples, (less than 1X to greater than 50X), we performed pseudodiploid allele calling on all samples using custom scripts. For each library, at each position in the SNV set, we selected a single, random read from the sequenced library. From that read, we called the variant information at the respective SNV site for the given library. In so doing, we generated a VCF with a representative degree of variation and error for all samples.
To assess population structure and infer splits between northern and southern groups of Costa Rican white-faced capuchins, we constructed principal components plots with EIGENSTRAT (Price et al., 2006) and built population trees with TreeMix (Pickrell & Pritchard, 2012). Because we ascertained variants predominantly with libraries that were of tissue/blood origin, we built principal components solely with SNVs from these libraries and projected the remaining fecal libraries onto the principal components. For our maximum likelihood trees, we used three outgroups (Ateles geoffroyi, Saimiri sciureus, and Cebus albifrons), with A. geoffroyi serving as the root of the tree. Given the geographic distance and anthropogenic deforestation between northern and southern populations, we assumed no migration. To account for linkage disequilibrium, we grouped SNVs into windows of 1,000 SNVs.
RESULTS
3.1 Isolation of intestinal epithelial cells using Fluorescence-activated cell sorting (FACS)
Flow cytometry can be used to discriminate among categories of cells by examining the manner in which light scatters in response to cellular properties. We interpreted forward scatter (FSC) and side scatter (SSC) as measures of cellular size and granularity (complexity), respectively. When cells are intact, free of agglomerations, and of limited variety, they form easily identifiable clusters, particularly when bound with fluorescently labeled antibodies. In contrast to this idealized schema, abundant cellular debris prevented us from observing distinct cellular populations when assessing the relationship between FSC and SSC (Figure 2) of fecal samples. The vast majority of events were usually clustered in lower range of FSC, and likely of bacterial origin. To exclude bacteria insofar as possible, we implemented a FSC gate that only included events above this cluster, typically the top ½ to ⅔ of the FSC range. From the 14 RNAlater preserved capuchin fecal samples, we isolated a median of 1,739 cells, with a range of 129 - 62,201 (Table 2). Typically, we collected a few hundred or thousand cells, but in two cases of poor fluorescent staining (SSR-FN and the RNAlater preserved SSR-ML sample), we sorted the larger gated populations, irrespective of fluorescent intensity. From the frozen samples, SSR-FLand SSR-ML, we collected 4,405 and 2,546 cells, respectively. Similarly, from the spider monkey sample, which we split into two separate FACS runs, we isolated 4,026 and 602 cells.
3.2 Mapping of genomic libraries
From each cellular population, we successfully extracted DNA and prepared sequencing libraries. Among the RNAlater preserved capuchin samples, the total amount of DNA per sample was low, ranging from 2.96 to 21.50 ng, with a median value of 7.85 ng (Table 2). A relationship between the number of cells was not significantly correlated with the amount of extracted DNA (R=0.227; 95% CI (−0.345, 0.676); t=0.808, p > 0.05) or mapping rate (R = −0.204; 95% CI (−0.663, 0.367); t = −0.721; p > 0.05). Median mapping rates reached 93% (range: 55 - 98%) with BWA-MEM and 82% (range: 11 - 95%) with the more stringent BBsplit settings (Figures 3A, 3B, Table 2). Read duplication levels were low, with a median value of 9% (range: 2 - 40%) resulting in 63% (range: 8 - 92%) of reads being unique and mapping to the Cebus imitator 1.0 genome. The amount of duplicate reads was distributed bimodally across individuals, with reads from five samples having substantially higher duplication rates than the remaining nine. The rate of duplication was significantly correlated (R = −0.751; 95% CI (−0.917, −0.366); t = −3.94; p < 0.01) with the number of cells (log10 transformed), decreasing sharply above a threshold of about 1,000 cells (Figure 3D).

Mapping percentages of sequencing reads from RNAlater preserved fDNA libraries prepared with FACS for A) all samples, and B) individual libraries. C) Increase in mapping rate for RNAlater preserved samples. D) Relationship between mapped read duplication and number of cells with LOESS smoothing. The duplicate rate decreases sharply once a threshold of about 1,000 cells is reached.
The samples frozen in liquid nitrogen mapped at comparable rates to those preserved in RNAlater. From the two frozen capuchin samples, SSR-ML and SSR-FL, respectively, we extracted 10.50 and 6.72 ng of DNA. These two samples mapped at 96% and 80.4% with BWA-MEM and 90% and 42% with BBsplit (5% and 3% duplicates), respectively. We extracted 6.96 and 4.50 ng of DNA from the two runs of the spider monkey sample, which mapped at a substantially lower rate of 54% and 49% with BWA-MEM and 12% with BBsplit for both (1% duplicates for both).
We observed little to no human contamination in the RNAlater preserved samples. For nine of the 14 samples, BBsplit mapped between 0.61 and 1.25% of reads to hg38 (median 0.96%); however, in four cases 2.86 - 5.80% of reads were binned to the human genome. Human mapped reads were also low for the frozen SSR-ML (1.25%) and spider monkey (2.83% and 1.82%) samples. However, SSR-FLappeared to have substantial human contamination (15.77% of reads). This may be due to initial processing of these three samples, which were stored using the cryopreservation method, at the field site. We conducted the initial vortexing, centrifugation, and collection of supernatant (see section 2.2) at the SSR field station, which is likely where SSR-FLwas contaminated. Due to this, we examine the mapping rates using only the RNAlater preserved samples. However, we were able to decontaminate reads bioinformatically, and include the decontaminated reads in downstream analyses where appropriate.
By sorting fecal samples with FACS, we substantially increased the percentage of reads mapping to the target genome. We selected five samples at random (SSR-CH, SSR-NM, SSR-LE, SSR-PR, SSR-SN) to compare pre-and post-FACS mapping rates. The mapping rates of unsorted feces ranged from 10 - 42%, with a median of 14% (Figure 3C). After flow sorting aliquots of these fecal samples, we obtained significantly higher mapping rates (V = 15, p < 0.05) for each sample, ranging from 64 - 95%, with a median of 85%, resulting in a median 6.07 fold enrichment.
3.3 High coverage fecal genome
Given that the sample SSR-ML had a high mapping percentage, a low rate of duplication, and was effectively free of human-specific mapping, we selected it for sequencing at high coverage. Using ½ of one HiSeq 4000 lane, we achieved an average coverage of ~12X across the Cebus imitator 1.0 genome.
When comparing the high coverage fecal and tissue genomes from the Santa Rosa site, we observed no substantial difference in quality, coverage, heterozygosity, or GC content (Figures 3 and 4). For each genome, the distribution of per site coverage followed a roughly normal distribution with a small number of positions uncovered (~2%) (Figure 3A). Coverage along the largest scaffold from the Cebus genome was uniform in both tissue and fecal samples (Figure 3B). No obvious area of excessively high or low coverages is apparent in the fecal genome compared to that of the tissue derived genomes. Importantly, the fecal genome does not have any obvious gaps in coverage. Likewise, levels of heterozygosity were comparable between fecal and tissue genomes (Figure 3C, D). The fluctuating levels of heterozygosity across the largest genomic scaffold in 100 KB windows is highly similar for SSR-ML and SSR-CR (Figure 3D), indicative of their close familial relationship. Finally, the distribution of GC content across the genome does not suffer from substantial bias (Figure 5B). Although the normalized coverage at the extremes of the GC distribution is on the higher end of the capuchin samples (Figure 5A), it falls well within the range of other samples for the vast majority of the genome where GC content ranges from ~20 - 75% (Figure 5B).

A) Density of genomic coverage of high coverage genomes from Santa Rosa. B) Average coverage per 100 KB window along the largest scaffold of the C. imitator 1.0 reference genome. C) Density of 1 MB windows at varying levels of heterozygosity along the entire genome. D) Heterozygosity of 100 KB windows along the largest scaffold of the C. imitator 1.0 reference genome. The top two genomes (SSR-CR and SSR-ML) are from siblings. The order of individuals in figures B and D correspond to that of figure A.

Percent of GC content across the genome for the four tissue (red) and one fecal (blue) samples from Sector Santa Rosa. GC content does not substantially differ for each type of sample. A) Average normalized coverage at each percentage of GC. B) Number of reads per 100 bp window (scaled by the number aligned reads) at each percentage of GC.
3.4 Population structure
We observed likely population subdivision between the northern and southern groups of white-faced capuchins in our SNV set. This separation corresponds to the ecological division of the season tropical dry forests in the north from the non-seasonal tropical wet forests in the south. Given the limitations of the available sampling sites, it is possible that the appearance of an ecological divide is actually evidence of isolation by distance.
All individuals from the north and the south are sharply discriminated by the first principle component of the PCA (Figure 6A). The second component indicates a higher degree of genetic variation within the southern individuals. All the northern individuals form a tight cluster on the PCA plot, in contrast to those from the south, which are more widely dispersed along PC 2. Furthermore, the single individual from the northern site of Cañas clusters closely with the individuals from Santa Rosa, despite a geographic distance of more than 100 km, which suggests that isolation by distance might not be the sole reason for population differentiation. No clustering was observed within the four individuals from the southern sites of Manuel Antonio and Quepos, apart from their separation from the northern individuals along PC 1. Because we generated the principal components with samples from the primary SNV set and projected the remaining samples (fecal flow FACS and tissue-based outgroups), the outgroup taxa are expected to fall in between the two main sampling clusters of white-faced capuchins. As expected, the three outgroup taxa (C. albifrons, S. sciureus, and A. geoffroyi) fall in the center of the PCA plot.

Left: Principal components of 14 fecal and 10 blood/tissue libraries from white faced capuchin and three outgroups. Right: Maximum likelihood tree of 9 fecal and 10 blood/tissue libraries. Samples with less 0.5X coverage were excluded. Among the white-faced capuchin samples, individuals from northern (dry forest) and southern (wet forest) regions form the primary split; secondary splits reflect the individuals from different sites within regions.
The pattern of clustering generated by our maximum likelihood SNV tree recapitulates the expected patterns of geographic distance and ecological separation in our sample (Figure 6). Among the white-faced capuchin monkeys, the northern and southern clades represent the main split in the tree. Each clade is subdivided according to the two sampling sites within the geographic/ecological regions. Furthermore, the three outgroup taxa split by the expected degree of evolutionary distance. These relationships are not perturbed by the fact that samples were a mixture of traditional tissue-based genomic libraries and libraries generated by fecal flow-FACS. This pattern is evident both within the northern sites and outgroup taxa. Additionally, depth of coverage does not appear to affect the pattern of clustering. Our sample ranged in coverage from less than 1X to greater than 50X. In spite of this, the pattern of geographic/ecological subdivision held.
DISCUSSION
In this manuscript, we describe a novel use of FACS to isolate cells from the feces of free-ranging mammals for population and comparative genomics. We have demonstrated that fecal FACS is an effective means for: 1) the enrichment of endogenous DNA from non-invasive primate samples; 2) the generation of unbiased whole genomes at high coverage or low coverage sequencing libraries suitable for population genomic analysis. Isolating genome-scale information from non-invasively collected samples remains a major challenge in molecular ecology. Although DNA can be extracted readily from museum specimens and captive individuals (Guschanski et al., 2013; Prado-Martinez et al., 2013; van der Valk, Lona Durazo, Dalén, & Guschanski, 2017), the vast majority of the world’s mammalian genomic diversity remains in free-ranging individuals. Our results indicate that fecal FACS has the potential for widespread application in molecular ecology and the broadening of non-invasive genomics for threatened and cryptic mammals.
4.1 Performance and cost-effectiveness
Current techniques to isolate whole genomic information from fecal samples depend upon the enrichment of endogenous DNA from extracted fDNA (Chiou & Bergey, 2018; Perry et al., 2010; Snyder-Mackler et al., 2016). While these methods have proven effective for SNV analyses, particularly at low coverage (Chiou, 2017; de Manuel et al., 2016; Wall et al., 2016), they remain of limited genomic scope. The total mapping rate of endogenous reads from the highest performing enrichment protocol is 57%, with a non-duplicate mapping rate of 38% (Snyder-Mackler et al., 2016). The median non-duplicate rate that we generated through FACS is 63% (82% when including duplicates), substantially outperforming that of enrichment-based approaches. While sequencing costs have fallen dramatically in recent years, maximizing the proportion of non-duplicate reads in sequencing libraries remains a critical factor in determining the feasibility of sampling schemes. Studies that aim to sequence tens or hundreds of fecal individuals at high coverage are simply not practical for most labs, given the current cost structure. We were able to isolate primate cells from feces for roughly $40 per sample. Given that each sample required about 30 minutes of FACS time and three hours of wet lab preparation time (per batch of samples), a trained lab worker could prepare five to ten samples per day, presuming the availability of FACS resources. Although these costs of time and money are not negligible, this may be a justifiable expense for projects where the increased mapping rate and genomic coverage are desired.
While our fecal FACS method is effective in white-faced capuchin monkeys and Geoffroy’s spider monkeys, we acknowledge that further validation in other species is warranted. Given the disparity in mapping rates between the capuchin and spider monkey samples, it is possible that cytometry protocols would need to be optimized toward the particularities of a given species’ feces and conditions. Consistent with this notion is the fact that the fecal sample (SSR-SB1) with low mapping success, was substantially darker than the other capuchin samples, which, depending on the dietary items consumed, typically have a green, brown, or rust coloration. Mapping was substantially improved in the replicate sample (SSR-SB2), which was collected on a different day. Curiously, we did not observe a relationship between the number of sorted cells and the concentration of extracted DNA. However, this is likely explained by residual intercalating dyes used in FACS process remaining in the sorted cells and interfering with Qubit quantification (Kuderna et al., 2018). Additionally, it is peculiar that the mapping rates of the libraries we built from unsorted fDNA were so high (median 14%). Typically, less than 5% of fDNA is of an endogenous source, although some chimpanzee samples have been reported to have up to 25% endogenous reads (Hernandez-Rodriguez et al., 2017). Further testing of capuchin fecal samples with lower endogenous DNA concentration is worth pursuing, as mapping rates for endogenous DNA from unprocessed and enriched fDNA are often correlated (Chiou & Bergey, 2018; Hernandez-Rodriguez et al., 2017; Snyder-Mackler et al., 2016). However, because cell sorting is not a targeted DNA enrichment process, we find it unlikely that post-FACS mapping rates should depend on the concentration of endogenous fDNA; accordingly, we did not observe any such relationship among the five samples we tested for enrichment (Figure 3C). Furthermore, we did not observe a correlation between the number of isolated cells and the mapping rate; in one case, we obtained a 94% mapping rate with only 140 cells. Presuming that the flow cytometer is sorting cells correctly, and that those cells contain viable DNA, the mapping rate should only be contingent upon the accuracy of the cell sorting process.
We have demonstrated that RNAlater is an effective, long-term, room-temperature cellular storage medium for fecal FACS. In the great majority of cases, FACS involves the sorting of living cellular populations, and attempts to sort dead cells are often met with skepticism (Sasaki, Dumas, & Engleman, 1987). Dead cells are typically distorted and fragmented, yielding populations that are difficult to discriminate. We attempted to freeze fresh feces with liquid nitrogen and a betaine cryopreservative, following the single-cell protocol of Rinke et al. (2014). Unfortunately, many of these samples contained extremely large amounts of cellular debris, likely from improper cryopreservation in field conditions. Additionally, cryopreservation of samples required a non-trivial amount of laboratory preparation in non-sterile field conditions that we believe introduced substantial human contamination to SSR-FL. While we were able to sequence one of the frozen samples (SSR-ML) at high coverage and replicate it with RNAlater, we cannot presently recommend in-field cryopreservation of fecal samples for FACS. RNAlater is often commonly used in molecular field primatology, because it offers long-term, stable preservation of host DNA at room temperature. For our purposes, it also offered the distinct advantage of not requiring any in-field laboratory preparation, which minimized human contamination of our cellular populations. Attempts to flow sort RNAlater preserved cells of any origin are extremely scant, and we only found two such studies in the literature (Barrett et al., 2002; Zaitoun, Erickson, Schell, & Epstein, 2010). We observed a substantial improvement in the cellular integrity in the RNAlater preserved samples. Although cells preserved in RNAlater are dead, they suffer minimal histological disruption, and maintain cellular epitopes critical for antibody binding (Florell et al., 2001). Given this array of benefits, we recommend preservation of fresh fecal samples in RNAlater when collected in field conditions.
4.2 Quality and feasibility of high-coverage fecal genomics
We have presented the first high-coverage, unbiased mammalian genome, derived exclusively from feces. While traditional bait-and-capture approaches to non-invasive genomics have allowed for broad sampling of the mammalian genome from feces, such methods remain limited by genomic bias. When compared to tissue-derived capuchin genomes, our FACS-derived fecal genome indicates no such biases. SSR-ML consistently fell within or immediately adjacent to the observable range of variation of the other tissue samples collected from Sector Santa Rosa. While we acknowledge that it would have been optimal to compare high-coverage whole genomes generated from the blood and feces of the same individual, this was not possible, because of our non-invasive sampling strategy. Nonetheless, we are able to infer such a comparison through the use of pedigree data in our SSR samples. The scaffold-wide pattern of heterozygosity observable in SSR-ML (Figure 4D) is nearly identical to that of SSR-CR (tissue), who was his sibling. This relationship is further supported by the population clustering results (section 4.3). Furthermore, the SSR-ML sample we used in SNV calling did not bear any indication of human contamination. In order to remain consistent in comparison with the tissue and blood derived samples, we did not remove reads mapping to the hg38 with BBsplit during SNV calling. Because the Cebus genome is less complete than hg38, it is likely that the majority of human-specific mapping from this and other samples is artifactual. Given the consistency similarity of the SSR-ML sample to the others from SSR, we and suggest that FACS is a viable approach to expand the horizons of non-invasive population and conservation genomics.
Prior to selecting libraries for high-coverage sequencing, we suggest that multiple libraries should be run on a lower throughput sequencing platform (e.g. MiSeq). Given the variability in sequencing outcomes inherent in our technique, it would be prudent to avoid wasting sequencing capacity on libraries that lack the requisite diversity for high-depth sequencing. Working with extremely low numbers of cells, which is sometimes the result of the FACS process, can result non-trivial duplication rates and the potential for the introduction of human contaminants. Given that our FACS protocol only requires a small amount of fecal slurry, processing two or three aliquots from the same fecal sample would increase the number of cells and, presumably, the available diversity in cases where it was deemed necessary.
4.3 Population structure of white-faced capuchin monkeys
By successfully discriminating among two populations of white-faced capuchins in Costa Rica, we have demonstrated that fecal FACS is effective for low-coverage applications of population and conservation genomics. While bait-and-capture approaches remain a valuable tool for the assessment of population genetic structure from real-world distributions of free-ranging mammals, fecal FACS provides a simple alternative approach.
The clustering patterns in our trees and PCA plots do not reveal any samples that deviate from their expected geographic or ecological origin. These relationships are robust to both the coverage levels (< 1X to > 50X) and biological origins (feces, tissue, and blood) of the samples. The tight geographic clustering of individuals within the SSR sampling locale provides reasonable evidence that there is no substantial effect from fecal FACS on population structure. Were it the case that fecal FACS introduced substantial bias, we would have expected the fecal samples from SSR to plot in a separate cluster from those of tissue origin. As fecal and tissue samples fall in the same general cluster, this is no evidence of such an effect. Furthermore, known pedigree information from SSR corresponds to the genetic relationships observed in our SNV tree. SSR-ML (fecal) and SSR-CR (tissue) form an internal clade in the tree (sixth and seventh points from the top). These two individuals also cluster adjacent to each other on the PCA plot.
4.4 Summary
Through a novel use of flow cytometry/FACS, we have developed a new method for the isolation of epithelial cells from mammalian feces for population genomics. We generated the first high-coverage, unbiased mammalian genome solely from feces. Additionally, we have demonstrated that fecal FACS can be used to generate low coverage SNP datasets that function well in population assignment and clustering algorithms. Fecal FACS is cost-effective and free of the biases that commonly occur in traditional bait-and-capture approaches to the enrichment of endogenous DNA from feces. Furthermore, fecal FACS does not require costly impractical preservation of biomaterial in liquid nitrogen; rather, we rely on room-temperature stable storage in RNAlater. Fecal FACS offers great benefits to the field of mammalian conservation and population genomics.
AUTHOR CONTRIBUTIONS
Research was designed by JDO, ADM, RK and JC; performed by JDO, RK, CF, LFKK, EL, and JT; analyzed by JDO and MM; and written by JDO, ADM, and TMB.
DATA ACCESSIBILITY STATEMENT
Sequencing data will be archived on NCBI SRA and made publically available.
ACKNOWLEDGEMENTS
We would like to thank Laurie Kennedy, Yiping Liu form the University of Calgary Flow Cytometry Core for their patience and assistance with developing this protocol. Additionally, we thank Jene Weatherhead, Shelley Wegener, Frank Visser, Gwen Duytschaever for molecular laboratory assistance. We acknowledge Oscar Fornas for helpful discussion. Thanks to Wes Warren, Pat Minx, Mike Montague, Shoji Kawamura, and J. Pedro Magalhaes for their involvement with the development of the Cebus imitator reference genome. PJ Perry, Shasta Webb, Rachel Williamson, and Saul Cheves Hernandez assisted with sample acquisition. This research was supported by the National Sciences and Engineering Research Council of Canada (NSERC), and the Canada Research Chairs program to ADM. TMB is supported by BFU2017-86471-P (MINECO/FEDER, UE), Howard Hughes International Early Career, Obra Social "La Caixa" and Secretaria d’Universitats i Recerca del Departament d’Economia i Coneixement de la Generalitat de Catalunya. JDO is supported by the Alberta Children’s Hospital Research Institute (ACHRI). CF is supported by “La Caixa” PhD fellowship. L.F.K.K. is supported by an FPI fellowship associated with BFU2014-55090-P (MINECO/FEDER, UE)
REFERENCES


