

Summary
The small GTPase RAS is a signalling hub for many pathways and oncogenic human RAS mutations are assumed to over-activate all of its downstream pathways. We tested this assumption in fission yeast, where, RAS-mediated pheromone signalling (PS) activates the MAPKSpk1 and Cdc42 pathways. Unexpectedly, we found that constitutively active Ras1.G17V induced immediate but only transient MAPKSpk1 activation, whilst Cdc42 activation persisted. Immediate but transient MAPKSpk1 activation was also seen in the deletion mutant of Cdc42-GEFScd1, a Cdc42 activator. We built a mathematical model using PS negative-feedback circuits and competition between the two Ras1 effectors, MAPKKKByr2 and Cdc42-GEFScd1. The model robustly predicted the MAPKSpk1 activation dynamics of an additional 21 PS mutants. Supporting the model, we showed that a recombinant Cdc42-GEFScd1 fragment competes with MAPKKKByr2 for Ras1 binding. Our study has established a concept that the constitutively active RAS propagates differently to downstream pathways where the system prevents MAPK overactivation.
Constitutively active Ras1.GV prolongs Cdc42 activation in S. pombe pheromone signalling
Ras1.GV results in an immediate but only transient MAPKSpk1 activation
The RAS effector pathways MAPKSpk1 and Cdc42 compete with each other for active Ras1
Predictive modelling explains MAPKSpk1 activation dynamics in 24 signaling-mutants
eTOC Blurb S. pombe Ras1 activates the MAPKSpk1 and Cdc42 pathways. Kelsall et al. report that the constitutively active Ras1.G17V mutation, which causes morphological anomalies, induces prolonged Cdc42 activation but only a transient MAPKSpk1 activation followed by attenuation. Mathematical modelling and biochemical data suggest a competition between the MAPKSpk1 and Cdc42 pathways for active Ras1.
Introduction
Proto-oncogene Ras GTPase family members are widely conserved and play pivotal roles in cell growth, differentiation and apoptosis (Cox and Der, 2010). The physiological impact of Ras mutations is highlighted in the resultant tumorigenesis and developmental disorders (Prior et al., 2012; Schubbert et al., 2007). More than 99% of identified oncogenic RAS mutations occur at codons 12, 13 and 61 of human Ras isoforms (Prior et al., 2012) and impair efficient GTP hydrolysis (Trahey and McCormick, 1987). This results in accumulation of GTP-bound Ras, which is generally considered to cause constitutive activation of the downstream effector pathways, such as ERK and PI3K signalling pathways (Lin et al., 1998; Zhu et al., 1998). Interestingly, however, mouse embryonic fibroblasts (MEFs) derived from the K-rasG12D mouse model show neither an increased basal level of active ERK and Akt nor constitutive activation of ERK and Akt upon growth factor stimulation even though the K-rasG12D MEFs showed enhanced proliferation and partial transformation (Tuveson et al., 2004). This observation indicates that not all effector pathways become constitutively activated by oncogenic Ras, presumably because of an efficient negative feedback loop. Meanwhile, it is reasonable to expect that oncogenic RAS over-activates some of its effector pathways to initiate tumorigenesis. Small GTPases, including Cdc42 and Rac, may be such effector pathways, as they are required in oncogenic-RAS-driven tumorigenesis (Malliri et al., 2002; Qiu et al., 1997; Stengel and Zheng, 2012).
We wished to understand how multiple Ras effector pathways respond to the Ras-triggered signals in a physiological setting. We employed the model organism fission yeast. In this organism, a unique Ras homologue, Ras1, plays a key role in pheromone signalling to cause mating of haploid cells and sporulation in diploid cells (Yamamoto, 1996)(Fig. 1A, B). Upon nutritional starvation, cells of opposite mating types (h+ and h−) exchange mating pheromones. Gpa1, the α-subunit of the pheromone receptor-coupled G-protein, relays the pheromone signal into the cell (Obara et al., 1991). Activated Gpa1 together with Ras1 then activate MAPK cascade consisting of Byr2 (MAPKKK), Byr1 (MAPKK) and Spk1 (MAPK) (Fukui et al., 1986; Masuda et al., 1995; Nadin-Davis and Nasim, 1988; Nadin-Davis et al., 1986a; Nadin-Davis et al., 1986b; Wang et al., 1991; Xu et al., 1994). An intriguing observation is that the ras1.G17V mutant, an equivalent of mammalian ras.G12V mutant prevalent in cancer, produces an excessively elongated shmoo, or a conjugation tube, upon exposure to the mating pheromone (Nadin-Davis et al., 1986a). This “elongated” ras1.G17V phenotype has been interpretted that Ras1 may be responsible for amplifying the pheromone signal (Yamamoto, 1996).

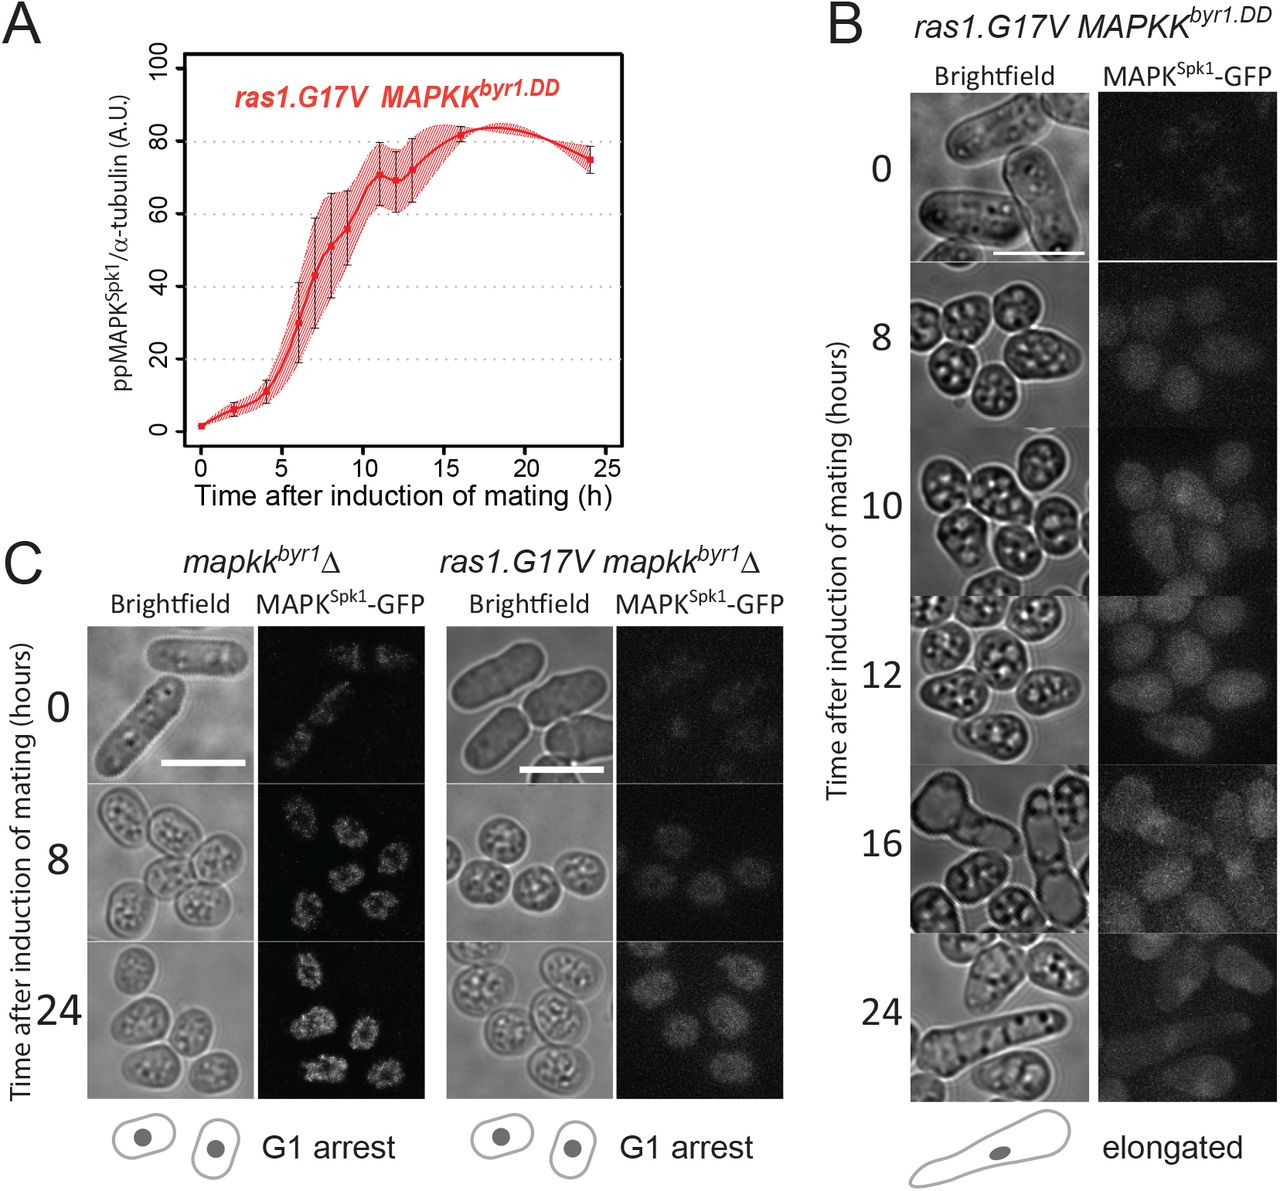
(A) A pictorial representation of wildtype fission yeast sexual differentiation. (B) A list of key signalling components of the fission yeast pheromone signalling pathway. The diagram reflects the prediction that Gpa1 and Ras1 separately contribute to activation of MAPKKKByr2 activation although the precise mechanism is unknown (Xu et al., 1994). At the same time, Ras1 activation is expected to be at least partly under influence of active Gpa1 because the ste6 gene, encoding a Ras1 activator, is strongly induced upon successful pheromone signaling (Hughes et al., 1994). (C)-(H) Cells were induced for sexual differentiation by the plate mating assay system as described in the materials and methods. (C), (E) and (G) Quantified ppMAPKSpk1 signal from western blots of wildtype (KT3082) (C), MAPKKbyr1.DD (KT3435) (E) and ras1.G17V(KT3084) (G) cells. Three biological replicates were used for quantitation (error bars are ±SEM). α-tubulin was used as a loading control and quantitation was carried out using the Image Studio ver2.1 software (Licor Odyssey CLx Scanner). For the wildtype samples in (C), the % of cells mating is also indicated (n=400, three biological replicates). The wildtype ppMAPKSpk1 result (C) is also presented in (E) and (G) as a reference. (D), (F) and (H) Cellular morphology (brightfield) and localization of MAPKSpk1-GFP over a 24 hour time-course in wildtype (D), MAPKKbyr1.DD (F) and ras1.G17V (H) cells. Time after induction of mating in hours is indicated on the left. At each time point, a bright-field image and a GFP signal image were taken and processed as described in materials and methods. Green asterisks in the time 24 h in the ras1.G17V cell image (H) indicate auto-fluorescence signal from inviable cell debris, which were produced through cytokinesis failure or cell lysis. Yellow arrows in panels (D) and (F) indicate transient accumulation of MAPKSpk1-GFP at the shmoo tips. Scale bars represent 10μm.
Ras1 also regulates cell morphology during vegetative growth; whilst deletion of either gpa1, MAPKKKbyr2, MAPKKbyr1 or MAPKspk1 does not result in any obvious phenotypes during vegetative cell growth (Obara et al., 1991; Sipiczki, 1988; Toda et al., 1991), ras1Δ cells lose the typical rod-shape morphology of fission yeast to become rounded (Fukui et al., 1989; Nadin-Davis et al., 1986a). Studies based on recombinant protein assays and yeast-2-hybrid analysis demonstrated that Ras1 interacts with both MAPKKKByr2 and Scd1, a GDP-GTP exchange factor (GEF) for Cdc42, which regulates the actin cytoskeleton and cell morphology (Chang et al., 1994; Gronwald et al., 2001; Tu et al., 1997). These observations suggest that Ras1 simultaneously regulates both the pheromone MAPKSpk1 and the Cdc42 pathways at the cell membrane (Weston et al., 2013). Indeed, a dynamic “Cdc42 zone” at the cell cortex prior to mating has been observed (Merlini et al., 2013) and Ras1 and MAPKSpk1 cascade components are found there and are involved in the process (Dudin et al., 2016; Merlini et al., 2013; Merlini et al., 2016; Merlini et al., 2018; Weston et al., 2013). However, it is not yet understood how Ras1 interplay between the two pathways. By establishing conditions to induce highly synchronous mating of fission yeast cells, for the first time we were able to follow MAPKSpk1 activation dynamics during the physiological mating process in wildtype and in mutants showing various mating phenotypes. This comprehensive set of quantitative measurements allowed us to build a mathematical model of the Ras-mediated pheromone signalling. Our model serves as a prototype of a branched Ras-mediated signalling pathway, demonstrating a competition of downstream pathways for a common upstream activator, Ras1. The model also highlights the physiological importance of the bipartite activation of MAPKKKByr2: a Ras1-dependent and a Ras1-independent mechanism, the latter of which employs the adaptor protein Ste4 (Barr et al., 1996; Okazaki et al., 1991). The adaptorSte4 can be targeted to downregulate MAPKSpk1 even in the presence of ras1.G17V mutation. Finally, our study reveals the crucial role played by Cdc42 in the ras1.G17V mutant causing the ras1.G17V phenotype.
Results
(1) A highly synchronous mating assay allows the precise measurement of MAPKSpk1 activity
To directly measure fission yeast pheromone signalling, we quantitated MAPKSpk1 phosphorylation throughout the mating process (Supplementary Fig. S1, Fig. 1A and B). We established a protocol to induce highly synchronous mating and employed cells where the endogenous MAPKSpk1 is tagged with GFP-2xFLAG. Under these conditions, homothallic h90 cells started to mate 7-hours after induction of mating (Fig. 1C, grey line). Phosphorylated (active) MAPKSpk1 (ppMAPKSpk1) levels were quantitated as described in Materials and Methods. The ppMAPKSpk1 signal was first detected three hours after induction of mating and reached its peak at about seven hours, when cell fusion was also initially observed (Fig. 1C, blue line. Original membrane images presented in Supplementary Fig. S3). The ppMAPKSpk1 then gradually decreased to a non-zero level as meiosis continued towards sporulation. The observation established that the MAPKSpk1-GFP activation occurs as the mating process progresses and declines before sporulation, around 15 hours post induction. It was also noted that the total MAPKSpk1-GFP was essentially not expressed during the vegetative cycle, but it was promptly induced by nitrogen starvation (Supplementary Fig. S2A and S2B). The mapkspk1 gene is a known target of the transcription factor Ste11 (Mata and Bahler, 2006), which itself is activated (phosphorylated) by MAPKSpk1 (Kjaerulff et al., 2005). This positive feedback loop likely facilitates a swift increase of MAPKSpk1 expression upon nitrogen starvation. We found that MAPKSpk1-GFP localised to both the cytosol and the nucleus, with some nuclear accumulation, before it gradually disappeared as the mating process came to the end (Fig. 1D). Interestingly, transient foci of GFP signals were also found at the cell cortex, as has been reported for MAPKKByr1, the activator of MAPKSpk1 (Dudin et al., 2016) (Fig. 1D, yellow arrows).
(2) Constitutively active MAPKKByr1.DD mutant causes constitutive activation of MAPKSpk1
Activation of MAPKK family kinases is mediated by dual phosphorylation of conserved Ser/Thr residues (Zheng and Guan, 1994). These correspond to serine 214 and threonine 218 of the MAPKKByr1. A MAPKKByr1 mutant termed MAPKKByr1.DD, which carries aspartic acid substitution at these sites, was expected to act as a constitutively active MAPKK (Ozoe et al., 2002). We introduced the MAPKKbyr1.DD mutation at its chromosome locus and measured the activation profile of its target, MAPKSpk1 during the mating process. The increase of the ppMAPKSpk1 signal in the MAPKKbyr1.DD mutant strain was delayed compared to the wildtype strain and the ppMAPKSpk1 accumulated at a slower rate (Fig. 1E, light green line, original membrane images in Fig. S3). However, the level of ppMAPKSpk1 remained high after reaching its highest intensity at around 16 hours after induction, resulting in a constitutive phosphorylation of MAPKSpk1 (Fig. 1E and Supplementary Fig. S2C and S2D). This result highlights that the suggested dephosphorylation of ppMAPKSpk1 by phosphatases Pmp1 and Pyp1 (Didmon et al., 2002) is not efficient in downregulating the pheromone signalling in the presence of MAPKKByr1.DD. The MAPKKByr1.DD strain is also less competent in finding the partner mating cell than cells with wildtype MAPKKByr1. We also confirmed the intriguing “fus” (fusion deficient) phenotype of cells expressing MAPKKByr1.DD from its native promoter (Fig.1F) (Dudin et al., 2016; Ozoe et al., 2002). These cells find their partners and pair up successfully but fail to fuse with each other, resulting in fus phenotype. Consistent with the observed slower increase in ppMAPKSpk1 (Fig.1E) the nuclear localisation of MAPKSpk1 was also delayed compared to Wildtype cells (Fig 1F). A strong MAPKSpk1-GFP signal was then observed in the nuclei of the paired fus cells and the nuclear MAPKSpk1-GFP signal persists even 24 hours after the induction of mating (Fig. 1F). Interestingly, the projection tips of the paring cells often show increased MAPKSpk1-GFP signal (Fig. 1F, yellow arrows). These results conclude that MAPKSpk1 activation is highly influenced by the MAPKKByr1 status and phosphatases directly regulating MAPKSpk1 cannot counteract MAPKKByr1.DD.
(3) The ras1.G17V mutation causes immediate but transient MAPKSpk1 activation
The fission yeast equivalent of human oncogenic ras.G12V is ras1.G17V, which induces an excessively elongated shmoo, and the cells fail to recognize a partner and become sterile (Fukui et al., 1986; Nadin-Davis et al., 1986a). The “elongated shmoo” phenotype was interpreted as an excess activation of the downstream pathway(s) of Ras1, leading to a prediction that the ras1.G17V causes over-activation of MAPKSpk1 (Weston et al., 2013; Yamamoto, 1996). However, no direct evidence has been provided.
Quantitation of the ppMAPKSpk1-GFP in the ras1.G17V mutant showed an immediate increase of the ppMAPKSpk1-GFP upon induction of mating (Fig. 1G, Green line, original membrane images in Fig. S3). However, the signal intensity declined gradually and by 16 hours after induction the level was comparable to wildtype cells, indicating that down-regulation of ppMAPKSpk1-GFP is effective, unlike in MAPKKbyr1.DD mutant. Correspondingly, the cellular MAPKSpk1-GFP signal also declined 24 hours after induction of mating (Fig. 1H). Collectively, these observations indicate that the down-regulation mechanism for ppMAPKSpk1 is robust and resistant to Ras1.G17V. It was also noted that the peak intensity of the ppMAPKSpk1 was somewhat lower and the rate of signal reduction was slightly decreased compared to wildtype cells (Fig. 1G).
(4) The elongated ras1.G17V shmoos develop with a minimum level of MAPKSpk1: neither amplitude nor duration of ppMAPKSpk1 signal influences the ras1.G17V phenotype
Having observed that MAPKKbyr1.DD and ras1.G17V show different MAPKSpk1 activation profiles (sustained vs transient) and different morphological phenotypes (“fus” vs elongated), we examined a link between the MAPKSpk1 activation profiles and the cell morphology. The MAPKSpk1 phosphorylation profile of the cells harbouring both ras1.G17V and MAPKKbyr1.DD mutations (ras1.G17V MAPKKbyr1.DD double mutant) was comparable to the cells harbouring MAPKKbyr1.DD mutation only; it showed a slow increase of the ppMAPKSpk1-GFP level, which reached the plateau at about 16 hours after induction of mating (Fig. 2A, red line, original membrane images in Fig. S3). The nuclear ppMAPKSpk1-GFP signal in the ras1.G17V MAPKKbyr1.DD double mutant was also present 24 hours after induction of mating, unlike the ras1.G17V single mutant cells, confirming that the ras1.G17V MAPKKbyr1.DD double mutant cells retained a high ppMAPKSpk1 level. Thus, in terms of the activation status of MAPKSpk1, MAPKKbyr1.DD is epistatic to ras1.G17V.
(A) MAPKSpk1 phosphorylation status in the ras1.G17V MAPKKbyr1.DD double mutant cells (KT3439). Cells were induced for mating by the plate mating assay system as described in the materials and methods. Quantitated ppMAPKSpk1 signal (arbitrary unit) from western blots is presented. Results of two biological replicates (each derived from three technical replicates, error bars are ±SEM) are presented in red. (B) The terminal mating phenotype of ras1.G17V MAPKKbyr1.DD double mutant is a phenocopy of ras1.G17V single mutant which shows the “elongated” morphology. Images were taken of ras1.G17V MAPKKbyr1.DD double mutant (KT3439) in the same way as in Fig. 1. Time after induction of mating in hours is indicated on the left. (C) There is no morphological change in the absence of MAPKSpk1 signalling. Cell images of MAPKKbyr1Δ (KT4700) and ras1.G17V MAPKKbyr1Δ (KT5030) strains are shown. Images were taken in the same way as in Fig. 1. Time after induction of mating in hours is indicated on the left of each series. Scale bars represent 10μm.
In terms of cell morphology, the ras1.G17V MAPKKbyr1.DD double mutant cells showed the “elongated” ras1.G17V phenotype (Fig. 2B), but not the “paired” MAPKKbyr1.DD phenotype. Therefore, ras1.G17V was epistatic to MAPKKbyr1.DD in terms of the elongated shmoo morphology.
Interestingly, obvious shmoo formation in the ras1.G17V MAPKKbyr1.DD double mutant was first noticed 16 hours after induction of mating, much later than the ras1.G17V single mutant, but as a similar timing as the MAPKKbyr1.DD single mutant (Fig. 2B). Given the slow increase of the ppMAPKSpk1 signal in mutants harbouring the MAPKKbyr1.DD mutation, we predicted that the delayed appearance of the ras1.G17V shmoo meant that the ras1.G17V shmoo formation still requires a certain level of MAPKSpk1 activity. Indeed, when MAPKKbyr1 was deleted in the ras1.G17V mutant, not only was the MAPKSpk1 activation and nuclear MAPKSpk1-GFP signal abolished (Fig. S1F), but also shmoo formation was abrogated as in the MAPKKbyr1Δ single mutant (Fig. 2C). Based on these observations, we concluded that the cell morphology is determined by the molecular status of Ras1, and not by the MAPKSpk1 activation profile. Yet, the ras1.G17V phenotype still requires MAPKSpk1 activity, which determines the timing of shmoo formation.
(5) Cdc42 is required for the shmoo formation but not for the MAPKSpk1 activation
During the vegetative cycle, ras1Δ cells show spherical cell morphology (Fukui et al., 1986; Nadin-Davis et al., 1986a) and polarised localisation of active Cdc42 is compromised (Kelly and Nurse, 2011), (Fig. 4C, D), indicating that Ras1 is involved in Cdc42 activation. The GTP-loaded Cdc42 is then predicted to activate the downstream Ste20-like kinase, Pak1/Shk1 (Endo et al., 2003; Marcus et al., 1995; Ottilie et al., 1995; Verde et al., 1995), resulting in actin reorganisation and shmoo formation under mating conditions (Bendezu and Martin, 2013; Merlini et al., 2016).
To confirm that Cdc42 acts downstream of Ras1, we generated a double mutant strain harbouring ras1.G17V and deletion of scd1, encoding a GDP-GTP exchanging factor for Cdc42 (Cdc42-GEFScd1). The ras1.G17V elongated shmoo phenotype was lost in the double mutant and instead, the cells showed a mating-deficient phenotype similar to the cdc42-GEFscd1Δ single mutant (Fig 3A). The result supports the model that Cdc42 acts downstream of Ras1 to cause morphological changes.

(A) scd1Δ morphology and MAPKSpk1-GFP signal. Images of WT (KT3082), scd1Δ (KT4061) and scd1Δ ras1.G17V double mutant (KT4056) were taken in the same way as in Fig.1. Numbers on the left represents hours after induction of mating. (B) MAPKSpk1 phosphorylation state in scd1Δ (KT4061) cells after mating induction. Results of three biological replicates (error bars are ±SEM) are presented. The wildtype ppMAPKSpk1 result presented in Fig.1 (C) is also shown in blue as a reference. (C) Cell images of scd1Δ MAPKKbyr1.DD double mutant (KT4047) were taken in the same way as in Fig.1. Numbers on the left represents hours after induction of mating. (D) MAPKSpk1 phosphorylation state in ras1Δ (KT4323), MAPKKbyr1.DD (KT3435) and ras1Δ MAPKKbyr1.DD (KT4359) cell extracts. Original Western blotting data is presented in Fig. S4A. (E) MAPKSpk1 phosphorylation state in mapkkkbyr2Δ (KT3763), MAPKKbyr1.DD (KT3435) and mapkkkbyr2Δ MAPKKbyr1.DD (KT4010) cell extracts. Original Western blotting data is presented in Fig. S4B. For (D) and (E), quantification was carried out using the Image Studio ver2.1 (Li-cor). (F) Cell images of the strains mentioned in (D) and (E) were taken in the same way as in Fig.1. Numbers on the left represents hours after induction of mating. For all the images presented in (A), (C) and (F), scale bars represent 10μm.
Intriguingly, in the strains harbouring the cdc42-GEFscd1Δ mutation, a nuclear MAPKSpk1-GFP signal appeared (Fig. 3A), indicating that activation of MAPKSpk1 may not be impaired by lack of active Cdc42. This was unexpected because in a previous study, it was predicted that activation of Cdc42 contributes to activation of MAPKKKByr2 (Tu et al., 1997). To clarify this issue, we measured ppMAPKSpk1 in the cdc42-GEFscd1Δ mutant. Strikingly, in these cells MAPKSpk1 activation occurred with a reproducible advancement of the initial activation timing compared to the wildtype cells (Fig. 3B, original membrane images in Fig. S3). The result shows that MAPKSpk1 activation does not require Cdc42 activity. Additionally, the faster activation of MAPKSpk1 raises the interesting possibility that two Ras1 effectors, MAPKKKByr2 and Cdc42-GEFScd1, are competing with each other for activated Ras1, thus, lack of Cdc42-GEFScd1 results in an advanced MAPKSpk1 activation (modelled in Fig. 7A).
Substantial MAPKSpk1 activation in the cdc42-GEFscd1Δ mutant means that the mating deficiency of this mutant is unlikely to be the result of the lack of MAPKSpk1 activation. Indeed, introduction of MAPKKbyr1.DD to the cdc42-GEFscd1Δ mutant did not restore the mating deficient phenotype, even though nuclear MAPKSpk1-GFP highly accumulated (Fig. 3C). The result shows that active Cdc42 function is absolutely required for the mating process regardless of the MAPKSpk1 activation status. Taken together with the essential role of MAPKSpk1, we concluded that the mating pheromone signalling feeds into at least two pathways, MAPKSpk1 and Cdc42.
(6) Ras1 activates two effector pathways, MAPKSpk1 and Cdc42
In order to further clarify the role of Ras1 we examined the MAPKSpk1 activation status and cell morphology in the following four strains: ras1Δ mutant, ras1Δ MAPKKbyr1.DD double mutant, MAPKKKbyr2Δ mutant and MAPKKKbyr2Δ MAPKKbyr1.DD double mutant. As mentioned earlier, deletion of ras1 causes cells to show a round morphology (Fig. 3F), with reduced cortical signal of CRIB-GFP, an indicator of the active GTP-bound form of Cdc42, showing that Cdc42 activation is compromised (Fig.4C, D). ras1 deletion also causes substantial reduction, but not complete elimination, of the ppMAPKSpk1 (Fig. 3D, red line, and Supplementary Fig. S4A); thus, Ras1 plays an important role in activating both Cdc42 and MAPKSpk1 pathways. Introduction of the MAPKKbyr1.DD mutation into the ras1Δ mutant cells induces the constitutive ppMAPKSpk1 (Fig. 3D, green line and Supplementary Fig. S4A) but does not affect the round cell morphology and cells remain sterile (Fig. 3F, the 2nd left panel. Note the accumulating MAPKSpk1-GFP at 16 hours after induction of mating), as was the case for the Cdc42-GEFScd1Δ MAPKKbyr1.DD double mutant (Fig. 3C).

(A) Cell morphology and localisation of Cdc42GTP, indicated by CRIB-GFP signal, during the sexual differentiation process. Wildtype (KT5077) and ras1.G17V (KT5082) mutant cells were induced for mating/sexual differentiation by the plate mating assay condition (Materials and Methods) and live cell images were taken at the indicated time after induction of mating/sexual differentiation. Representative CRIB-GFP signal images are presented. Cells with cortical CRIB-GFP foci are indicated by orange stars. Rapidly-disappearing CRIB-GFP signals at the fusion site of wildtype mating cells are indicated by green arrows at time 8.5h image. Scale bar: 10 μm. (B) Quantitation of the results presented in (A). At each time point (4.5h, 6.5h, 10.5h, 12.5h and 22.5h after induction of mating/sexual differentiation), 150 cells were examined whether they have cortical CRIB-GFP foci. % cells with cortical CRIB-GFP foci is presented. The experiment was repeated for three times and the mean values and SDs are plotted in the graph. (C) Cell morphology and localisation of Cdc42GTP, indicated by CRIB-GFP signal, during vegetative growth. Representative CRIB-GFP signal images of cells of wildtype (KT5077), ras1Δ (5107), ras1.G17V(KT5082), rga4Δ (5551) and rga4Δ ras1.G17V(KT5554) are presented. Scale bar: 10 μm. (D) Quantitated CRIB-GFP signals on the cell cortex of cells presented in (C). Intensity of GFP signal on the cell cortex was measured along one of the cell tips as indicated as a magenta dotted line in the example image on the right (Scale bar: 10 μm) as stated in the Materials and Methods. 40 cells without septum were measured for each strain and the average curve from all aligned traces per strain was calculated, and displayed with respective standard error of the mean curves (dashed lines) as described in Materials and Methods.
In a striking contrast, the sterile phenotype of the MAPKKKbyr2Δ, associated with complete lack of shmoo formation (Fig. 3F, the 2nd right panel), was converted to the “fus” phenotype, when combined with the MAPKKbyr1.DD mutation (Fig. 3F, the far right panel). As expected, the MAPKKKbyr2Δ MAPKKbyr1.DD double mutant shows MAPKSpk1 constitutive activation (Fig. 3E and Supplementary Fig. S4B). Thus, unlike the cases of scd1Δ or ras1Δ, lack of MAPKKKbyr2 can be bypassed by constitutive activation of MAPKSpk1, indicating that the sole role of MAPKKKByr2 is to activate the MAPKSpk1 unlike its upstream activator, Ras1, which also activates Cdc42 pathway (a model presented in Fig. 7A).
(7) Ras1.G17V causes accumulation of Cdc42-GTP at the cell cortex
Having observed a relatively mild influence of Ras1.G17V towards the MAPKSpk1 activation, we next examined whether the Cdc42 pathway was affected by the ras1.G17V mutation. We visualized the active GTP-bound form of Cdc42 (Cdc42GTP) using CRIB-GFP that specifically binds to Cdc42GTP (Tatebe et al., 2008). As previously observed, dynamic foci of CRIB-GFP appeared on the cell cortex upon induction of mating (Bendezu and Martin, 2013)(Fig. 4A and B). In our experimental condition, more than 80% of wildtype cells showed the cortical CRIB-GFP signal at 4.5 hours after induction of mating (Fig. 4B). The cortical CRIB-GFP foci became concentrated at the site of mating and quickly disappeared once cells fused successfully to form zygotes (Fig. 4A and B). In striking contrast, in the ras1.G17V mutant cells, the cortical CRIB-GFP signal persisted, often at the elongated tip end of the cells, even 12.5 hours after induction of mating (Fig. 4A and B). The signal could still be seen in about 40% of the cells 22.5 hours after induction of mating (Fig. 4A and B). The result shows that the Cdc42 pathway is excessively activated in the ras1.G17V mutant and the localisation pattern of Cdc42GTP indicates that the signature “elongated” ras1.G17V morphological phenotype is caused by deregulation of the Cdc42 pathway.
Ras1-mediated Cdc42 pathway activation has been also indicated during the vegetative growth where the ras1Δ mutant shows a round cell morphology (Chang et al., 1994; Kelly and Nurse, 2011). However, unlike during the mating process, the ras1.G17V mutation does not cause an obvious morphological phenotype during the vegetative growth. We predicted that, during the vegetative growth, rigorous negative regulation occurs for Cdc42 by GTPase activation protein(s) (GAPs), such as Rga4 (Das et al., 2007; Kelly and Nurse, 2011; Tatebe et al., 2008) to counteract the effect of ras1.G17V. To examine this possibility, we compared Cdc42 activation status of vegetatively growing wildtype, ras1Δ, ras1.G17V, rga4Δ, and rga4Δ ras1.G17V double mutant cells (Fig. 4C and D). As previously described, CRIB-GFP showed a clearly polarized signal at the growing cell tips in the wildtype strain (Tatebe et al., 2008)(Fig. 4C and D). In the ras1Δ mutant, the cells were round and CRIB-GFP signal on the cell cortex had largely disappeared as was seen in the cdc42-GEFscd1Δ mutant (Kelly and Nurse, 2011). In contrast, the cortical CRIB-GFP signal was clearly increased in the ras1.G17V single mutant although the cell morphology appeared largely similar to the wildtype cells (Fig. 4C, D). These results indicate a direct involvement of Ras1 in activating Cdc42. Meanwhile, the rga4Δ mutant cells showed slight alterations to the cell morphology, accompanied with less polarized distribution of cortical CRIB-GFP signal, as has been reported (Fig. 4C and D) (Das et al., 2007; Kelly and Nurse, 2011; Tatebe et al., 2008). Strikingly, the rga4Δ ras1.G17V double mutant showed a clear morphological alteration (big round cells) and the strongest cortical CRIB-GFP signal among all the mutants examined (Fig. 4C and D). The result fits well with our hypothesis that Ras1.G17V is activating Cdc42 even during vegetative growth, but the overall effect of Ras1.G17V is counteracted by the Cdc42-GAP, Rga4.
(8) Ras1 and an adaptor protein Ste4 are both necessary to fully activate MAPKKKByr2
Although Ras1 clearly plays the major role to activate MAPKSpk1, a marginal, but detectable level of ppMAPKSpk1 was still induced in the ras1Δ mutant (Fig. 3D and Supplementary Fig. S4A), indicating that there is a Ras1-independent mechanism to activate MAPKSpk1. Previous studies proposed an adaptor protein, Ste4, to be involved in the activation of MAPKKKByr2(Barr et al., 1996; Okazaki et al., 1991; Ramachander et al., 2002; Tu et al., 1997). We therefore examined whether Ste4 is required for MAPKSpk1 activation.
In constrast to the ras1Δ mutant, we detected virtually no MAPKSpk1 phosphorylation in the ste4Δ mutant (Fig. 5A and Supplementary Figure S4C), indicating that the adaptorSte4 is a prerequisite for the MAPKSpk1 activation and the ppMAPKSpk1 signal observed in the ras1Δ mutant is dependent on Ste4 function. Introduction of ras1.G17V mutation neither restored the MAPKSpk1 activation nor mating (Fig. 5A, B), thus, activation of Ras1 cannot take over Ste4 function. In a striking contrast, the ste4Δ MAPKKbyr1.DD double mutant showed the “fus” phenotype as the MAPKKbyr1.DD single mutant cells and induced constitutive MAPKSpk1 activation, indicating that Ste4 is solely required for MAPKSpk1 activation (Fig. 5A, B). Taken together, MAPKKKByr2 is activated through a mechanism involving both Ras1 and Ste4, but Ste4 only conveys the signal towards the MAPKSpk1, while Ras1 also activates Cdc42.

(A) Ste4 is essential for MAPKSpk1 activation. MAPKSpk1 phosphorylation status in ste4Δ (KT4376), ste4Δ ras1.G17V(KT5143) and ste4Δ MAPKKbyr1.DD (KT5136) at times-points 0, 8, 16 and 24 hours post mating induction are presented. Original Western blotting membranes are presented in Fig. S4C. (B) Incapability of ste4Δ to cause pheromone-induced morphological change is suppressed by MAPKKbyr1.DD but not by ras1.G17V. Cell images of ste4Δ (KT4376), ste4Δ ras1.G17V (KT5143) and ste4Δ MAPKKbyr1.DD (KT5136) strains were taken 24 hours after induction of mating. Scale bar: 10 μm. (C) Lack of Ste6 does not result in the complete loss of MAPKSpk1 phosphorylation. MAPKSpk1 phosphorylation status in ste6Δ (KT4333), ste6Δ ras1.G17V (KT4998) and ste6Δ MAPKKbyr1.DD (KT5139) at times-points 0, 8, 16 and 24 hours post mating induction are presented. Original Western blotting membranes are presented in Fig. S4D. (D) Incapability of ste6Δ to cause pheromone-induced morphological change is suppressed by ras1.G17V mutation but not by MAPKKbyr1.DD mutation. Cell images of ste6Δ (KT4333), ste6Δ ras1.G17V (KT4998) and ste6Δ MAPKKbyr1.DD (KT5139) strains were taken 24 hours after induction of mating. Scale bar: 10 μm.
(9) Ste6, a Ras1 GTP-GDP exchange factor, contributes to both the MAPKSpk1 and the Cdc42 pathway activation
There are two GDP-GTP exchange factors (GEFs) identified for Ras1: Ste6 and Efc25 (Hughes et al., 1990; Tratner et al., 1997). As to the functional differences, Ste6 is essential for mating but is dispensable during the vegetative cycle whilst Efc25 is dispensable for mating but is required to maintain the cell morphology during the vegetative growth (Hughes et al., 1990; Tratner et al., 1997). There has been an interesting proposition that Ste6 may specifically help Ras1 to activate the MAPKSpk1 pathway, but not the Cdc42 pathway, whilst Efc25 specifically facilitates Ras1 to activate the Cdc42 pathway (Papadaki et al., 2002). We examined this hypothesis by monitoring the MAPKSpk1 activation status and conducting genetic epistasis analysis of ras1.G17V and MAPKKbyr1.DD in the ste6Δ mutant.
In ste6Δ cells, MAPKSpk1 phosphorylation was found somewhat reduced but occurred at a clearly detectable level. The signal increased when the ras1.G17V mutation was introduced (Fig. 5C and Supplementary Figure S4D). When ste6Δ and MAPKKbyr1.DD were combined, MAPKSpk1 signalling recapitulated the MAPKKbyr1.DD activation profile (Fig. 5C and Supplementary Figure S4D). Nonetheless, the “pheromone-insensitive sterile” morphology of ste6Δ was only rescued by ras1.G17V, as previously reported, exhibiting the “elongated” phenotype (Hughes et al., 1990), but not by MAPKKbyr1.DD (Fig. 5D). The result indicates that, unlike ste4Δ mutant, the mating deficiency of ste6Δ is not caused by mere lack of MAPKSpk1 activation but by lack of Ras1 activation. We concluded that Ste6 functions to activate Ras1, which then activates both the MAPK and Cdc42 pathways in response to pheromone signalling.
(10) Activation mutant of Gpa1 mimics the full pheromone signalling
In order to generate an integrated prototype Ras signalling model, we further investigated the upstream signal input machinery. Previous studies showed that Gpa1 plays the primary role in pheromone signalling (Obara et al., 1991). In agreement, in the gpa1Δ mutant we detected no MAPKSpk1 activation nor nuclear accumulation of MAPKSpk1-GFP (Fig. 6A, B and Supplementary Fig. S5A). Introducing the ras1.G17V to the gpa1Δ strain did not rescue the complete lack of MAPKSpk1 activation nor did it induce a shmoo-like morphological change (Fig. 6A, B and Supplementary Fig. S5A), supporting our earlier observation that a Ras1-independent mechanism, involving Ste4 is essential for MAPKSpk1 activation. Meanwhile, introducing the MAPKKbyr1.DD mutation caused the constitutive activation of MAPKSpk1 (Fig. 6A and Supplementary Fig. S5A), but cells showed no morphological change (Fig. 6B). When both ras1.G17V and MAPKKbyr1.DD mutations were introduced into the gpa1Δ strain, MAPKSpk1 was activated and a shmoo-like morphological change occurred (Fig. 6A, B and Supplementary Fig. S5A). Therefore, activation of both of these two molecules is required and sufficient to mimic the pheromone signalling.
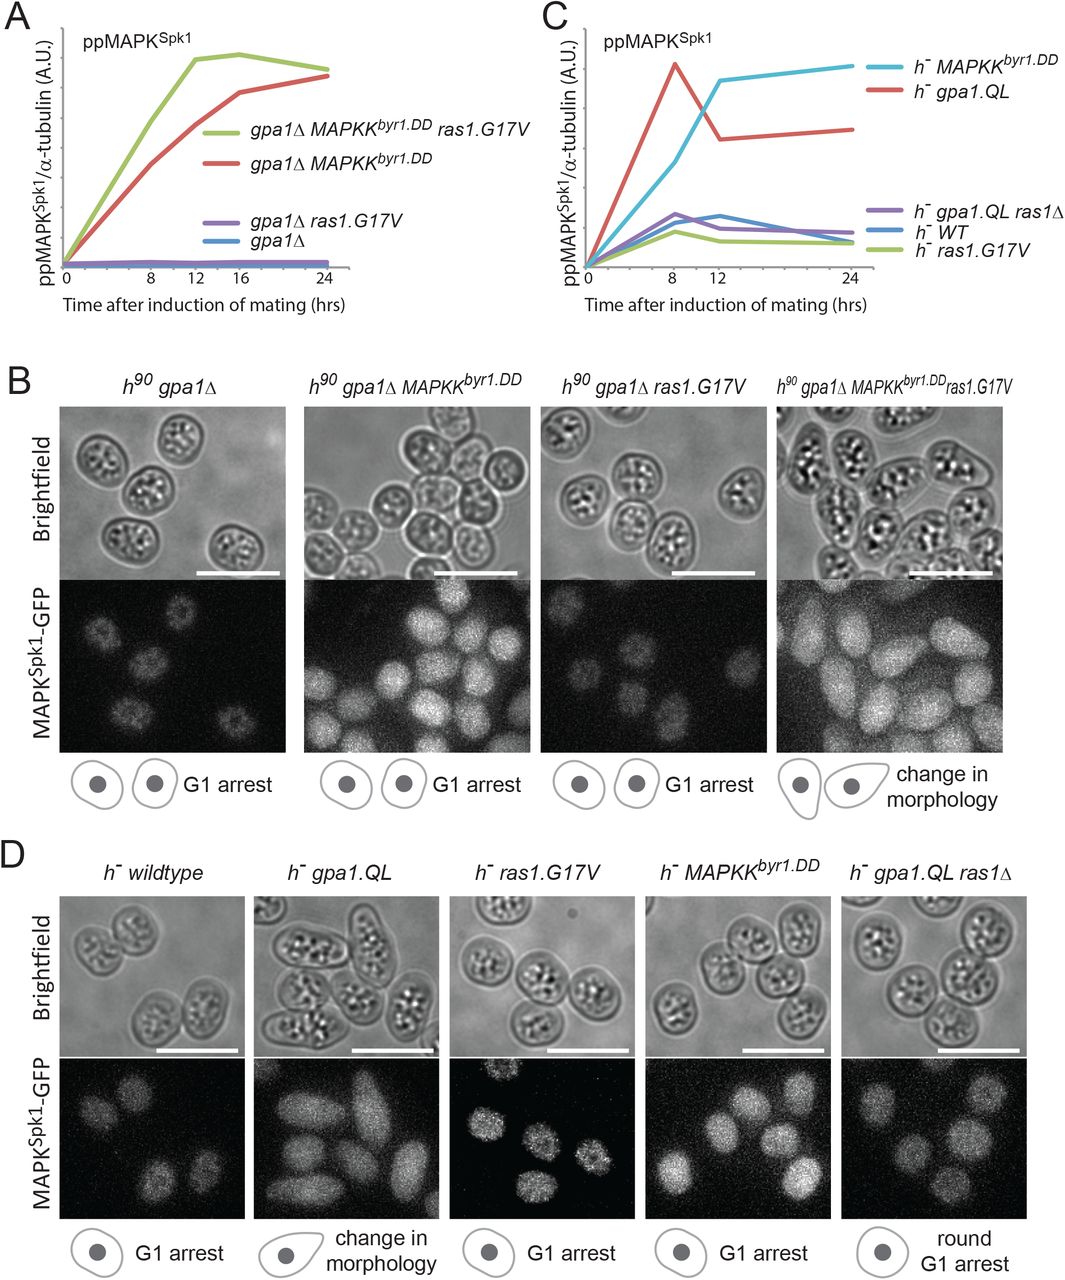
(A) MAPKSpk1 phosphorylation status in homothallic gpa1Δ (KT4335), gpa1Δ ras1.G17V (KT5023), gpa1Δ MAPKKbyr1.DD (KT4353) and gpa1Δ ras1.val17 MAPKKbyr1.DD (KT5035) at times-points 0, 8, 12, 16 and 24 hours after mating induction. Original Western membrane is presented in Fig. S5A. (B) Cell images of the above mentioned strains at 16 hours after mating induction. All the cell images were taken and processed as in Figure 1. Scale bar is 10 μm. (C) MAPKSpk1 phosphorylation status in h− WT (KT4190), h− gpa1.QL (KT5059), h− ras1.G17V (KT4233), h− gpa1.QL ras1Δ (KT5070) and h− MAPKKbyr1.DD (KT4194) at times-points 0, 8, 12 and 24 after mating induction. Note that while the activation induced in the gpa1.QL mutant was down-regulated, MAPKKbyr1.DD induced a constitutive activation. Original Western membrane is presented in Fig. S5B. (D) Cell images of the above strains at 12 h after induction of mating. All the cell images were taken and processed as in Figure 1. Scale bar is 10 μm.
To further confirm that the Gpa1 is a central component of pheromone signalling, we looked into the MAPKSpk1 activation status in the constitutively active gpa1.QL mutant, which exhibits a “shmoo-like” morphological change in the heterothallic h− strain without the mating partner (Obara et al., 1991).
Upon nitrogen starvation, the h− gpa1.QL mutant strain showed morphological changes and a strong MAPKSpk1 activation (Fig. 6C red line, Fig. 6D and Supplementary Fig. S5B). This response was largely dependent on the Ras1 function as the h− gpa1.QL ras1Δ double mutant exhibited a significantly reduced level of ppMAPKSpk1 and a round cell morphology, two typical features of ras1Δ cells (Fig. 6C, D and Supplementary Fig. S5B). On the other hand, the h− ras1.G17V single mutant showed a very low level of MAPKSpk1 activation, comparable to the one observed in the h− wildtype strain, with no apparent morphological alternation, confirming that sole activation of Ras1 does not substitute the pheromone signalling.
The h− MAPKKbyr1.DD mutant induced a strong constitutive MAPKSpk1 activation, confirming that the MAPKKByr1.DD molecule can activate MAPKSpk1 regardless of the pheromone signal input (Fig. 6C, light-blue line and Supplementary Fig. S5B). However, cell morphology was unchanged (Fig. 6D). Collectively, these results support the model where Gpa1 acts as the central transducer of the pheromone signalling, which can be mimicked only if both MAPKSpk1 and Ras1 are activated.
(11) A holistic modelling framwork of MAPKSpk1 activation
Based on quantitative ppMAPKSpk1 measurements in wildtype and various mutant strains (Fig. 1C, E, G, and Fig. 3B), we constructed a mathematical model of the MAPKSpk1 signalling dynamics. The aim of the model is to test whether a simple competition of the MAPK and the Cdc42 pathways for a shared pool of active RasGTP, can explain why the scd1Δ strain shows the similar ppMAPKSpk1 activation profile as the ras1.G17V strain.
We designed a reductionist model of 6 ordinary differential equations to represent key steps of pheromone signalling (Fig. 7A, Supplementary Fig. S6 and materials and methods). Model simulations and parameter estimations were performed in COPASI (Hoops et al., 2006) and details of the modelling process are described in Materials and Methods. Each biochemical process is referred as [L1]-[L10] as depicted in Fig. 7A. All the signalling components were set to be in close proximity, based on our own observation (Fig. 1 and Fig. 4) and recent series of localization studies (Dudin et al., 2016; Merlini et al., 2016; Merlini et al., 2018). This allowed the model to predict some signaling to involve protein-protein interactions.

(A) Components and frameworks of the mathematical model in wildtype and signalling mutants: ras1.G17V, Cdc42GEFscd1Δ, and MAPKKbyr1.DD. Changes corresponding to each mutant are indicated as follows: Grey: removed components or interactions, orange: increased level of activity. For the exact implementation of the mutants, see Materials and Method. The measured component, ppMAPKSpk1, is highlighted in green. (B) Measured and simulated ppMAPKSpk1 activation profiles in wildtype, ras1.G17V, Cdc42GEFscd1Δ and MAPKKbyr1.DD mutants. Dashed lines: model simulations. Diamonds: experimental data presented in Fig. 1C, E, G, and Fig. 3B; error bars: SEM. (C) GTP-loaded Ras1.G17V (1-172) directly binds to Byr2 (65-180) and Scd1 (760-872). In vitro GST pull-down assays of bacterially expressed Ras1.G17V (1-172), GST-Byr2 (65-180) and GST-Scd1 (760-872) were conducted as described in materials and methods. GTP-loaded Ras1.G17V (1-172) was found to bind to both GST-Byr2 (65-180) and GST-Scd1 (760-872). (D) Two Ras1 effectors, Byr2 and Scd1, compete for GTP-loaded Ras1.G17V (1-172). In vitro GST pull-down assays of bacterially expressed Ras1.G17V (1-172) and GST-Byr2 (65-180) were conducted as in (A). Addition of Scd1 (760-872) fragment interfered with Ras1-Byr2 binding (the 4th lane). Quantitated signal intensities of the Ras1.G17V (1-172) band in the gel are shown in the right panel. (E) Simulated ppMAPKSpk1 dynamics in the wildtype model at increasing concentrations of Ras1GTP added in silico to the system. Increased Ras1GTP concentration causes advanced and reduced ppMAPKSpk1 peak intensities. (F) The model fitted to the 4 strains (as above, in red) correctly predicts ppMAPKSpk1 dynamics in the additional 21 signalling mutant strains (in light and dark green) measured in this study.
The framework of the modelling process is as follows: Genes encoding pheromones, receptors, Gpa1, Ste4 and Ste6 are all known to be under regulation of Ste11, the master transcriptional regulator for meiotic genes (Hughes et al., 1994; Mata and Bahler, 2006; Mata et al., 2002; Mata et al., 2007; Sugimoto et al., 1991) and these components are grouped into the Pheromone Sensing (PS) unit. During the vegetative growth, the PS unit is set to zero. Nitrogen starvation activates Ste11 (Kjaerulff et al., 2007; Sugimoto et al., 1991), which induces the PS unit [L1]. The PS unit activates MAPKKKByr2 in a twofold manner: Directly by Ste4 [L3] and through Ras1 [L4](Fig. 7A). Activated MAPKKKByr2 then triggers activation of MAPKKByr1 [L5] that activates MAPKSpk1 [L6]. Since activated MAPKSpk1 further activates Ste11 (Kjaerulff et al., 2005), MAPKSpk1 has a positive feedback loop on its own expression via Ste11 [L2,L7] (Fig. 7A). As the pheromone signalling was found to induce a transient ppMAPKSpk1 peak (Fig. 1C), ppMAPKSpk1 activity is ought to be regulated by a delayed downregulation. Because the MAPKKbyr1.DD mutant completely lacks downregulation (Fig. 1E), downregulation occurring downstream of MAPKKbyr1 (e.g.: Pyp1 and Pmp1) were considered physiologically insignificant. Meanwhile, Sxa2 (a serine carboxypeptidase against a mating pheromone P-factor) and Rgs1 (a regulator of Gpa1), both of which are induced upon successful pheromone signalling (Imai and Yamamoto, 1992; Mata and Bahler, 2006; Pereira and Jones, 2001; Watson et al., 1999), receptor internalization (Hirota et al., 2001) and regulation of the mapkspk1 transcript or other components by antisense RNA (Bitton et al., 2011) fit well to the criteria for the negative feedback. We represented all these potential negative feedbacks collectively as a single circuit, [L8]. Importantly, this downregulation [L8] works unperturbed in the presence of Ras1.G17V, by acting through the Ste4-dependent MAPKKKByr2 activation process (Fig. 1G, Fig. 7A). Ras1-GTP activates both the MAPKKKByr2 and the Cdc42 pathways [L9] (Chang et al., 1994). As opposed to previous expectations that active Cdc42GTP is required to activate MAPKKKByr2 (Tu et al., 1997), deletion of Cdc42-GEFScd1 does not compromise MAPKSpk1 activation (Fig. 3B) and rather, it makes ppMAPKSpk1 dynamics remarkably similar to that of the Ras1.G17V strain (Fig. 3B and Fig. 1G, plotted together in Fig. 7B): in both cases, ppMAPKSpk1 peaks earlier than the wildtype case. At a molecular level, reactions depleting the Ras1GTP pool are compromised in both strains. Therefore, to explain these observations, we hypothesized that MAPKSpk1 and Cdc42 pathways are competing for the common Ras1GTP pool. In this manner, one of the pathways can modulate the other by changing the amount of unbound (available) Ras1GTP. In support of this prediction, we showed that binding of recombinant Ras1.G17VGTP to a MAPKKKByr2 fragment was reduced by the presence of a Cdc42-GEFScd1 fragment in vitro (Fig. 7C, D). In this assay, bacterially expressed GST tagged fragments of both MAPKKKByr2 (65-180) and Cdc42-GEFScd1 (760-872) showed a specific binding towards the GTP-loaded Ras1.G17V (1-172) (Fig. 7C). However, the binding of Ras1.G17VGTP to MAPKKKByr2 was substantially decreased when the Cdc42-GEFScd1 fragment was added (Fig. 7D). The result likely refects the intrinsic biochemical competitive nature of MAPKKKByr2 and Cdc42-GEFScd1 for Ras1 binding. As we show below, this simple hypothesis successfully describes pheromone signalling mutants tested in this study, suggesting that no unproven cross links are necessary to reproduce the in vivo observations.
An intriguing common feature observed in both Cdc42-GEFscd1Δ and ras1.G17V mutants is that ppMAPKSpk1 peaks not only at an earlier time point, but also with a lower amplitude as compared to the wildtype. If increased Ras1GTP levels simply accelerate MAPKSpk1 activation, as has been conventionally assumed, ppMAPKSpk1 production should peak earlier and higher (Supplementary Fig S7B, best fit out of 1000 global fits), and the addition of Ras1GTP only should increase the amplitude, but not affect timing (Supplementary Fig S7C). We confirmed these results in the best models from 1000 global fits (Materials and Methods). The comparison between our experimental results and the in silico predictions suggests that the role of Ras1GTP is more complex than previously thought.
Strikingly, if we hypothesize that Ras1GTP also contributes to the negative feedback [L10] (Fig. 7A), we recapitulate the “earlier and lower” peak of ppMAPKSpk1 in both the ras1.G17V and the Cdc42-GEFscd1Δ mutants (Fig. 7B). We currently do not have a direct experimental evidence to support [L10]. However, considering the fact that Ras1GTP likely acts as a physical signalling hub at the cell cortex, mediating MAPKKKByr2 recruitment and activation, which leads to recruitment of MAPKKByr1 and MAPKSpk1, Ras1GTP may work as a two-way amplifier, both assisting localized MAPKSpk1 activation at the shmoo site, as well as helping the negative feedback by concentrating the affected molecules.
The model successfully recapitulated the experimental results for wildtype, ras1.G17V, MAPKKByr1.DD and cdc42-GEFscd1Δ mutants (Fig. 7B). To test the predictive capacity of the model, we next performed an in silico experiment where we titrated increasing amounts of Ras1GTP in the wildtype condition before nitorgen removal. In agreement with our hypothesis, we obtained a ras1.G17V-like ppMAPKSpk1 activation profile with increasing amount of Ras1GTP, i.e., the ppMAPKSpk1 peaks earlier with a lower peak intensity (Fig. 7E). The result further supported that Ras1GTP availability alone is sufficient to explain both the ras1.G17V and Cdc42-GEFscd1Δ phenotypes.
To further test the predictive value of the model, we asked whether it could predict ppMAPKSpk1 dynamics in the 21 other strains, which were measured (Fig. 2-6), but not used for fitting the model. We implemented each mutation in the wildtype model (Supplementary Table S2) and the model accurately predicted relative ppMAPKSpk1 dynamics in 17 cases, or showed predicitons in close proximity to the observed ppMAPKSpk1 dynamics in the 4 remaining cases (Fig. 7F). Concluding from these results, our model likely represents the physiological framework of fission yeast RAS-MAPK signalling.
Discussion
By quantitating the MAPKSpk1 and Cdc42 activation status during the mating process and conducting epistasis analysis between numerous signalling mutants, we showed that Ras1 coordinates activation of both the MAPKSpk1 cascade and the Cdc42 pathway. Furthermore, we revealed that the ras1.G17V mutant phenotype is caused by deregulation of Cdc42, rather than altered activation of MAPKSpk1 in physiological setting. Based on the experimental data, we built a mathematical model, incorporating an assumption that two Ras1 effectors, Cdc42-GEFScd1 and MAPKKKByr2, are competing for active Ras1. This is the first simulation of a physiological Ras signalling network in a whole organism. The model faithfully recapitulates MAPKSpk1 activation profiles in the wildtype and all mutant strains examined in this study. The model implies that targeting one of the RAS effector pathways can potentially result in a complex outcome, rather than simply shutting down the targeted effector pathway. We concluded that fission yeast pheromone Ras signalling is not only defined by compartmentalisation (Onken et al., 2006) but rather a coordination of events involving both the MAPKSpk1 and Cdc42 pathways. Coordinated activation of MAPK and Cdc42 pathways upon pheromone stimulation is a common feature shared by budding yeast pheromone signalling. In budding yeast, however, Ras homologues are not involved in the process. β and γ subunits of the receptor-coupled trimeric G-protein act as the hub to activate both pathways ((Hegemann et al., 2015; McClure et al., 2015), reviewed in (Atay and Skotheim, 2017)). It is intriguing that the key hub moleucules are evolutionary diverged in these yeast species whilst the effector pathways are conserved to bring comparable biological outcomes.
In this study, we confirmed that Gpa1, the α subunit of the receptor-coupled trimeric G-protein, is the central player of the pheromone signalling. It is likely that Gpa1 is the most downstream molecule conveying the complete pheromone signal. Considering that all the pheromone signalling components examined so far have been found at the shmoo site (Dudin et al., 2016; Merlini et al., 2016; Merlini et al., 2018)(this study), an attractive hypothesis is as follows: firstly, the activated pheromone receptor Map3/Mam2 locally activates Gpa1, which activates Ras1 and MAPKSpk1. This then leads to a localised activation of the Cdc42, causing shmoo formation in the direction of a mating partner (Fig. 8A).

(A) Wildtype fission yeast pheromone signalling pathway, highlighting the branched pheromone sensing, and that both branches are necessary for mating. (B) Because of the robust regulatory mechanism implemented for the MAPK pathway and the competition between the effectors, the constitutively active Ras1.G17V mutation yields a biased overactivation of Cdc42.
The ras1.G17V mutation led to an immediate activation of MAPKSpk1 compared with the wildtype cells. The G17V mutation of Ras1 is equivalent of G12V mutation of mammalian RAS, which results in a substantial reduction of both intrinsic and GAP-mediated GTPase activities (Trahey and McCormick, 1987). Therefore a larger fraction of Ras1 is expected to be in the active GTP-bound form in the ras1.G17V mutant cells. By mathematical modelling, we showed that the increased Ras1GTP pool can explain a faster activation of MAPKSpk1. To our surprise, the constitutive Ras1.G17V mutation did not induce over-activation of MAPKSpk1. The attenuated MAPKSpk1 activation in the presence of Ras1.G17V indicated that an efficient feedback mechanism is in place to counteract the effect of Ras1.G17V. Strikingly, the same trend has been reported in the mouse model of the K-rasG12D mutation integrated at the endogenous chromosome locus (Tuveson et al., 2004). Therefore it is highly likely that the MAPK cascade is generally robust against upstream oncogenic constitutive stimulation. Based on our observation that the MAPKSpk1 is constitutively activated in the MAPKKbyr1.DD mutant, we predict that the negative regulation occurs upstream of, or at the same level as, MAPKKByr1, rather than phosphatases that directly regulate MAPKSpk1. In humans, ERK is shown to phosphorylate RAF proteins, the prototype MAPKKKs, to contribute to ERK signal attenuation (Brummer et al., 2003; Dougherty et al., 2005; Ritt et al., 2010). In future studies it will be important to determine whether MAPKSpk1 can directly downregulate MAPKKKByr2 in a physiological setting.
Our results also show that an adaptorSte4 plays a crucial role in activating MAPKKKByr2, abolishing ppMAPKSpk1 production even in the presence of ras1.G17V mutation. This suggests that the adaptorSte4 fits well to be one of the major targets by the negative feedback loop against ppMAPKSpk1. This mechanism is shared by budding yeast, where an adaptor protein, Ste50, modulates MAPKKKSte11 (Ramezani-Rad, 2003). In humans, although such an adaptor protein for RAF proteins has yet to be identified, multiple RAF-interacting proteins, including 14-3-3 proteins, as well as formation of heterodimers between BRAF and CRAF, have been studied for their Ras-independent mechanism to activate RAF proteins (Lavoie and Therrien, 2015). Collectively, MAPK cascades seem to retain a general resistance to oncogenic RAS mutations in physiological settings (Fig. 8B).
Whilst lack of Cdc42 activation does not impair MAPKSpk1 activation, we found that MAPKSpk1 activity is required for shmoo formation even in the presence of Ras1.G17V (Fig. 2C). Therefore, the two Ras1 effectors, Cdc42 and MAPKSpk1 pathways, are not completely separable. The situation is reminiscent of the K-rasG12D MEFs (Tuveson et al., 2004). In this system, the K-rasG12D MEFs showed morphological anomalies. As both ERK and AKT phosphorylation levels in the K-rasG12D MEFs resembled wildtype, these pathways unlikely caused the morphological phenotype. Nonetheless, inhibitors against MAPK and PI3K pathways reverted the K-rasG12D–induced abnormal morphology back to the one similar to wildtype. The observation suggests that MAPK and PI3K pathways somehow contribute to the K-rasG12D morphological phenotype; for example, a basal level of MAPK and PI3K pathway activation may be a prerequisite for the K-rasG12D–induced morphological anomalies.
The molecular mechanism of how MAPKSpk1 contributes to Cdc42 activation will require further studies. Key components in pheromone signalling are transcriptionally up-regulated upon pheromone signalling (Xue-Franzen et al., 2006). This is driven by MAPKSpk1, which activates the master transcriptional regulator Ste11 (Kjaerulff et al., 2005; Mata and Bahler, 2006; Xue-Franzen et al., 2006). Therefore, the contribution of MAPKSpk1 to Cdc42 activation is expected to occur, at least partly, through transcriptional activation.
In addition, localisation of signalling components may be regulated by MAPKSpk1. In budding yeast, MAPKFus3 brings Cdc24, the GEF for Cdc42, to the shmoo site by phosphorylating an adaptor protein Far1 (Hegemann et al., 2015), which otherwise sequesters Cdc24 into the nucleus (Nern and Arkowitz, 2000; Shimada et al., 2000). Fission yeast does not have an obvious Far1 homologue but MAPKSpk1 may also directly phosphorylate and activate Cdc42 and/or its regulatory proteins such as Cdc42-GEFScd1, Scd2 or GAP-Cdc42Rga4, all of which function at the shmoo site during the mating (Bendezu and Martin, 2013; Dudin et al., 2016)(Fig.4 A and B). In agreement with this hypothesis, a transient MAPKSpk1 and MAPKKByr1 signal on the cell cortex was observed during the mating process (Fig. 1)(Dudin et al., 2016). Localisation of MAPK at the growing cell tips was also observed in other fungi including S. cerevisiae and N. crassa (Chen et al., 2010; Fleissner et al., 2009; Maeder et al., 2007; van Drogen et al., 2001). In budding yeast, MAPKFus3 can directly phosphorylates Bni1, a formin that organises actin filaments, to facilitate shmoo formation (Matheos et al., 2004). It will be important to determine whether this is also the case in fission yeast.
Interestingly, during the vegetative growth when expression of MAPKSpk1 is repressed, Ras1.G17V is still capable of activating Cdc42 (Fig. 4C and D). Whether other MAPKs, such as Sty1 or Pmk1, contribute to Cdc42 activation during the vegetative cell cycle will be an important question to answer. Intriguingly, recent studies show that Sty1 inhibits, rather than assists, establishment of the Cdc42 polarity module (Mutavchiev et al., 2016). Collectively, it is likely that the Cdc42 polarity module is regulated in a context dependent manner by multiple MAPKs in a range of ways.
In this study we revealed the vital contribution of Cdc42 to induce the ras1.G17V phenotype in fission yeast pheromone signalling (Fig. 8B). In mouse models, small GTPases, Cdc42 and Rac, are required for H-rasG12V induced transformation (Malliri et al., 2002; Stengel and Zheng, 2012). Therefore, oncogenic RAS-induced Cdc42/Rac misregulation may be a common basis of oncogenicity of mutated-RAS-induced signalling. Specifically targeting this process may therefore be an effective strategy against oncogenic RAS-driven tumourigenesis.
Materials and methods
Yeast strains and media
Genotypes of the Schizosaccharomyces pombe strains used are listed in the supplementary Table S1. Gene disruption and 2xFLAG-GFP-tagging of genes were performed using the direct chromosomal integration method described previously (Bahler et al., 1998; Funaya et al., 2012; Wach, 1996). Fission yeast media (YE, MM-N and SPA) and basic genetic manipulations are described in (Moreno et al., 1991).
Plate mating assay for synchronous mating
In order to induce synchronous mating, we established the “Plate mating assay” system as follows: Cells were grown in YE supplemented with adenine (0.2g/L) until the cell density reaches 8-10 x 106 cells/ml. Cells were then washed with MM-N (1% glucose, supplemented with Leucine 40mg/L) using a filtration unit. These cells were resuspended to a cell density of 0.8-1x10⁷cells/ml in MM-N. In the timecourse experiments, this moment was considered time 0. 8x10⁷cells were re-filtered onto a PDVF membrane of 47 mm diameter (Millipore DVPP04700) in order to evenly place the cells across the defined area. The filters bearing the cells over their surface were carefully transferred onto sporulation agar plates (SPA+Leucine 40mg /L, 50ml SPA agar / 14cm diameter for 6 membranes), cell side up, and incubated at 30°C. During the time course experiments, at each time-point one membrane, which initially had 8x10⁷cells at time 0, was removed from the SPA plate and placed into 5 ml of ice-cold 20% trichloroacetic acid (TCA) in a 50 ml falcon tube. The tube was shaken vigorously to remove cells from the membrane. The tube was briefly centrifuged and the membrane removed from the tube. The tube was then centrifuged for 1 minute at 2000rpm to pellet cells. Supernatant was discarded, cells were resuspended in 1 ml 20% TCA and transferred to a tube capable of storage at −80°C. The cells were pelleted again using a bench top centrifuge, supernatant discarded, and the pellet snap frozen in liquid nitrogen. Tubes were stored at −80°C ready for protein extraction.
Preparation of whole cell extracts
This method is based on that described by Keogh lab Protocols (https://sites.google.com/site/mckeogh2/protocols). All steps were performed on ice unless otherwise stated. Cell pellets were thawed on ice and resuspended in 250 μl 20% TCA. 250 μl of acid washed glass beads (SIGMA) were added and sampled chilled on ice for 5 minutes. Cells were broken in a FastPrep24 cell beater (MP Biomedicals, speed 6.5 x 1 minute x 3 with 1 minute intervals). Cell extracts were collected by piercing the bottom of tubes with a needle and placing them into collection tubes and centrifuged at 2000 rpm for 1 minute. Beads were washed with 300 μl of 5% TCA and centrifuged at 2000 rpm for 1 minute, this was repeated twice. The contents of the collection tube were transferred to a 1.5 ml tube and centrifuged at 14K rpm for 10 minutes at 4°C. The liquid was discarded and the cell pellet washed with 750 μl of 100% ethanol. Tubes were centrifuged briefly (~1min 14000rpm) again. Ethanol was completely removed with a pipette and the pellet resuspended in 100 μl 1M Tris pH8.0 and 100 μl 3x protein loading buffer (Laemmli, 1970). Cell extracts were then heated for 5 minutes at 95°C, centrifuged for 5 minutes at 14K rpm and the supernatant transferred to a fresh 1.5 ml tube. Samples were stores at −20°C.
Western Blotting
Protein extracts were subject to SDS-PAGE and were transferred to Immobilon-FL PVDF membrane (Millipore). Membranes were blocked for a minimum of 1-hour in Odyssey Blocking Buffer (OBB) (Li-cor) diluted 1:1 in PBS. Primary antibody incubation was carried out overnight in OBB 1:1 in PBS with the anti phospho-p44/42 MAPK (Erk1/2) (Thr202/Tyr204) rabbit monoclonal antibody (#4370 Cell Signaling technology. Used at 1:2000 dilution), the monoclonal anti GFP antibody ((0.4mg/ml), Roche Cat No 11814460001. Used at a 1:2000 dilution) and the anti α-tubulin antibody, TAT1 (generous gift from Keith Gull, 1:3000). Membranes were washed 3x10 minutes with 20 ml TBST (50 mM Tris, pH 7.4 – 150 mM NaCl – 0.1% Tween 20) whilst gently shaking followed by secondary antibody incubation (IRDye 680LT goat anti-mouse antibody, Li-cor 926-32211(1.0 mg/ml), 1:16,000 dilution and IRDye 800CW goat anti-rabbit secondary antibody Li-cor 926-68020 (1.0 mg/ml), 1:16000 dilution in 0.01% SDS, 0.1% Tween 20 in OBB 1:1 PBS) for 1 hour in the dark to prevent fluorophore bleaching. This was followed by 2x 10 minute TBST washes and a 1x 10 minute TBS (50 mM Tris, pH 7.4 – 150 mM NaCl) wash before scanning on the Odyssey CLx infrared Imaging System (Li-cor). Protein quantitation using the Image Studio V2.1 software supplied with the Odyssey CLx scanner. The background method used was median with a border of 3 pixels to the left and right of quantitation boxes.
Quantitation of MAPKSpk1 phosphorylation
To detect the activated MAPKSpk1, whole cell extracts were prepared and Western blotting analysis was carried out using the anti-phospho ERK antibody (#4370 Cell Signalling Technology) that recognises the dual phosphorylation at the conserved TEY motif. Specificity of the antibody against the phosphorylated MAPKSpk1 (ppMAPKSpk1) in the fission yeast cell extracts was confirmed before proceeding with further experiments as shown in Supplementary Fig. S1. As described above in the “Plate mating assay for synchronous mating”, during the time course experiments, at each time-point, one membrane, which initially had 8x10⁷cells at time 0, was used to prepare the whole cell extracts. Then an equal volume of each sample was loaded to the Western blotting. In this manner, we observed that the change of the protein level throughout the mating process per a defined starting material. We noticed that the level of α-tubulin during the wildtype mating process is relatively constant; less than 25% fluctuation throughout the timecourse for all three biological replicates (an example shown in Fig. S2B). Based on these observations, we chose to use α-tubulin as an internal control to quantitate the ppMAPKSpk1 signal.
In order to quantitate ppMAPKSpk1 levels in wildtype, byr1.DD, ras1.G17V and scd1Δ mutants, Western blotting of three biological replicates of time-course experiments was conducted (original membranes presented in Fig. S3). Because the SDS-PAGE gels we used had only 25 wells, only two out of three biological replicates could be run simultaneously on the same gel. The third replicate was run separately on a different gel as shown in Fig. S3 (A). Definite measurement values of the third replicate were multiplied by a constant to bring the values closest to the rest of the two replicates. In order to directly compare results of wildtype, byr1.DD, ras1.G17V and scd1Δ mutants, technical replicates of Western blotting were generated by directly comparing one of the biological replicates of each strain as follows: the third replicate of the wildtype and byr1.DD samples (WT-3 and byr1.DD-3) (Fig. S3A), the second replicate of the wildtype and ras1.G17V samples (WT-2 and ras1.G17V −2) and the second replicate of the wildtype and scd1Δ samples (WT-2 and scd1Δ −2) (Fig. 3B).
Cell Imaging for bright field and Spk1-GFP signals
A Nikon Eclipse Ti-E microscope equipped with CoolLED PrecisExcite High Power LED Fluorescent Excitation System, an Andor iXon EM-DU897 camera and aCFI Plan Apo VC 100x/1.4 objective was used for cell imaging to capture the morphology of cells and the localisation of the GFP-tagged MAPKSpk1 during mating time-courses. For cell images presented in Figure 4, a 2D array scanning laser confocal microscope (Infinity 3, VisiTech) was used (see below). Each time point comprises 15-25 serial images with 0.4 μm intervals along the Z axis taken to span the full thickness of the cell. All of the Spk1-GFP images were deconvolved using the Huygens Essential Deconvolution software (Scientific Volume Imaging). Deconvolved images were Z-projected (maximum intensity), cropped and combined using Fiji (Schindelin et al., 2012).
Imaging and quantitation of CRIB-GFP signal
A 2D array scanning laser confocal microscope (Infinity 3, VisiTech) on a NikonTi-E microscope stand equipped with a Hamamatsu Flash 4.0V2 sCMOS camera and a Plan Apo 100x/1.45 objective was used to capture CRIB-GFP signal to examine activation status of Cdc42. For images presented in Fig. 4A, 25 serial Z images with step size of 0.25 μm were taken. Images were deconvolved using Huygens Essential (Scientific Volume Imaging) and maximum intensity projections are presented.
For images presented in Fig. 4C, for each image, 30-45 serial images with 0.2 μm interval along the Z axis were taken to span the full thickness of the cell. Using FIJI software maximum intensity Z-projections were created and used for quantitation. Intensity of GFP signal on the cell cortex was measured using FIJI along one of the cell tips that shows stronger GFP signal as indicated in an example image in Fig. 4D. 40 cells without septum were measured for each strain. Quantified CRIB-GFP intensity traces were analysed in R (R Core Team http://www.R-project.org/). First, rolling averages over +/−5 measurement points were calculated. Next, the X-coordinates of these traces were aligned by their peak intensity. Finally, the average curve from all aligned traces per strain was calculated, and displayed in Fig 4.D with respective standard error of the mean curves (dashed lines). Analysis script will be accessible on the GiHub repository upon publication (see availability section 1.1.16).
Glutathione-S-transferase (GST) tag pull-down assays
Fission yeast cDNA fragments encoding Ras1.G17V (1-172), Byr2 (65-180) and Scd1 (760-872) were cloned in the pLEICS1 (Ras1.G17V) and pLEICS4 (Byr2 and Scd1) vectors (Protex [Protein Expression Laboratory], University of Leicester) to produce N-terminally His6-tagged Ras1.G17V (1-172), N-terminally GST-tagged Byr2 (65-180) and N-terminally GST-tagged Scd1 (760-872). Constructs were expressed in E.coli BL21 Rosetta cells in LB. All bacteria cell lysates were prepared in phosphate-buffered saline (PBS), pH 7.4.
His6-Ras1.G17V (1-172) was purified using Ni Sepharose 6 Fast Flow (GE Healthcare) and dialysed into buffer A (20 mM Tris-Cl (pH 7.5), 100 mM NaCl, 5mM MgCl2, 1mM β-mercaptoethanol). For GTP loading, buffer A of the Ras1.G17V (1-172) preparation was firstly replaced by Exchange buffer (20 mM Tris-Cl (pH 7.5), 1mM EDTA, 1mM β-mercaptoethanol) using a filtration unit (Amicon Ultra Centrifugal Filter Unit, 10K cut off, Millipore). GDP-GTP exchange reaction was carried out by adding GTP and EDTA to a final concentration of 8 mM and 12 mM respectively and incubating the sample at 37°C for 10 min. The exchange reaction was terminated by adding MgCl2 to a final concentration of 20.5 mM. The resultant GTP-loaded Ras1.G17V (1-172) was washed with buffer A using the filtration unit and immediately used for the GST pull-down assays.
GST-Byr2 (65-180) and GST-Scd1 (760-872) were purified using glutathione sepharose 4B (GE Healthcare). The proteins bound on the glutathione beads were washed with buffer A and used for the GST pull-down assays together with the Ras1.G17V (1-172) preparation. For the competition assays shown in Fig. 7D, Scd1 (760-872) fragment was prepared by cleaving it out from the N-terminal GST, which was bound to the glutathione beads, using TEV protease.
GST pull-down assays were carried out by incubating Ras1.G17V (1-172) (GDP bound or GTP bound) and GST-Byr2 (65-180) or GST-Scd1 (760-872) with or without Scd1 (760-872) fragment at 4 °C for 30 min. Supernatant of the reaction was saved and mixed with the same volume of the 3x loading buffer (Laemmli, 1970) to generate the “unbound” fraction. The remaining beads were washed twice, resuspended in buffer A of the original volume and mixed with the same volume of the 3x loading buffer to generate the “bound” fraction. Protein samples were run on a SDS-PAGE gel and proteins were visualised by InstantBlue protein stain (Expedeon). Quantitation of the intensities of Ras1.G17V (1-172) bands in Fig. 7D was carried out using Fiji software.
Mathematical Modelling
We built a mathematical model in form of a system of ordinary differential equations (ODE) for the dynamics of the signaling pathway downstream of the pheromone receptor. The model consists of 6 ordinary differential equations representing 9 chemical reactions connecting 6 variables (1.1.14).
We focused on the competition between the MAPKSpk1 and Cdc42 pathways for active Ras1GTP molecules, but no other pathway “cross-talks” were instigated. We estimated the model parameters from the measured time courses of ppMAPKSpk1 in wild type and the three key mutant strains (ras1.G17V, MAPKKbyr1.DD and Cdc42-GEFscd1Δ) examined in this study. Time courses in these strains are precisely reproduced by the model, thereby we have made it plausible that the competition between MAPKSpk1 and Cdc42 pathways is sufficient to cause the ppMAPKSpk1 early activation phenotype observed in the ras1.G17V and Cdc42-GEFscd1Δ mutants. The model also successfully predicted the ppMAPKSpk1 temporal dynamics in the 21 other mutant strains examined in this study (Fig.7D). We therefore concluded that the model may serve as a general framework for pheromone signalling in S. pombe and can be used for further in silico experimental design.
1.1.1 Pathway components
Previous studies showed that more than 20 proteins, more than 20 biochemical and at least 10 relevant genetic interactions are involved in the fission yeast pheromone pathway (Mata and Bahler, 2006; Mata et al., 2002; Otsubo and Yamamoto, 2012; Xue-Franzen et al., 2006). Given the complexity of the pathway, and in order to attain the simplest model fulfilling our criteria, several pathway components and steps were simplified in the presented model as detailed below.
1.1.2 Nitrogen withdrawal, and subsequent pathway activation
Nitrogen starvation induces the expression of the meiotic transcriptional regulator Ste11, which then induces expression of the key components of the pheromone pathway (Egel, 2004). Experimentally, this initial process occurs as a step-like nitrogen removal from the media, which is implemented as a change of starvation signal S from 0 →1, i.e. activator step-function in the model.
The response to starvation is two fold. First of all, various signaling components under the regulation of Ste11 are induced: the pheromone (M-or P-factor), the pheromone receptors (Map3 or Mam2), the receptor-coupled G-protein (Gpa1), a GDP-GTP exchange factor (GEF) for Ras1 (Ste6) and an adaptor Ste4. For simplicity, the pheromone sensing and upstream signal transduction machinery is modelled by one variable, called here the Pheromone Sensing (PS) unit (Fig. 7A). The PS unit is sometimes also referred to as the “upstream pheromone pathway”. Induction of the PS unit by Ste11 as well as pheromone binding, subsequent Gpa1 activation and consequential activation of Ste4 and Ste6 are all encompassed in the process [L1] in Fig. 7A. As Ste11 is induced by starvation, PS is also created proportionally to starvation sensing (S, Eq. 1). Since downregulation of PS occurs in form of a long negative feedback loop, the term vdownreguiation(PS) depends on ppMAPKSpk1 (Eq. 2); and it is explained in a later section.


The second response to starvation is the activation of a basal MAPKSpk1 transcription through Ste11. MAPKSpk1 is then activated by phosphorylation to ppMAPKSpk1, if (active) ppMAPKKByr1 is present. This basal activation (F1) is also proportional to starvation sensing (Eq. 3), also see (Eq. 7) and section (1.1.6) for details.

1.1.3 The upstream pheromone pathway (PS)
The PS unit activates the downstream MAPK cascade in two ways:
PS activates Ras1GDP (process [L4] in Fig. 7A), which in turn activates MAPKKKByr2, and
Ste4, a PS unit component, directly activates MAPKKKByr2 independently of Ras1 (process [L3] in Fig. 7A).
Both of these steps are necessary to functionally activate MAPKKKByr2 (Eq. 6).
Finally, the upstream pheromone pathway is downregulated in a negative feedback loop as discussed in a later section (1.1.7).
1.1.4 Ras1
In the S. pombe pheromone response, Ras1 is a central component as it both activates the transcriptional response via MAPKKKByr2, and the morphological response via Cdc42-GEFScd1. Both molecules form protein complexes that anchor pools of Ras1GTP (Chang et al., 1994; Tu et al., 1997; Weston et al., 2013), thus we hypothesised that the two pathway branches might affect each other by changing the amount of available, unbound Ras1GTP. In other words, MAPKSpk1 and Cdc42 pathways compete with each other for unbound Ras1GTP. As the model focuses on the ppMAPKSpk1 levels, but not on Cdc42GTP production / localisation, the Cdc42 branch (the process [L9]) is simply represented as a change in available Ras1GTP for MAPKKKByr2 in the model. This is further discussed in the section on the Cdc42-GEFscd1Δ mutant strain (1.1.11).
In the wildtype model, Ras1GDP is activated by the PS unit and deactivated by a Ras-GAP. Both reactions are described by mass action kinetics in (Eq. 4 and Eq. 5). For simplification of parameters, see section (1.1.8).


1.1.5 MAPKKKByr2 and MAPKKByr1
Following the PS unit and Ras1GDP activation, MAPKKKByr2 is activated by a twofold mechanism involving Ste4 (a component in the PS unit) and Ras1GTP. Note, that MAPKSpk1 is the only member of the kinase cascade whose transcription is regulated by Ste11 (the process [L2]) (Mata and Bahler, 2006). Therefore, accordingly, the expression levels of MAPKKKByr2 and MAPKKByr1 were not subject to Ste11 activity in our model. Compared to the 24hrs time scale of pheromone signaling, the MAPKKKByr2 -> MAPKKByr1 activation likely happens on a much faster time scale. Therefore, and for simplicity, we grouped MAPKKKByr2 and MAPKKByr1 into one unit (Fig. 7A). Thus, MAPKKByr1 activation (phosphorylation) (the process [L5]) is given as in (Eq. 6 and Eq. 7) and both activation and deactivation follows mass action kinetics. For simplification of parameters, see section (1.1.8).


1.1.6 MAPKSpk1
In the cells, MAPKSpk1 protein expression is induced upon nitrogen removal (the process [L2] in Fig. 7A). MAPKSpk1 is then phosphorylated and activated to ppMAPKSpk1 by ppMAPKKByr1 (the process [L6]). Experimentally we observed very similar dynamics for MAPKSpk1 and ppMAPKSpk1. Therefore, we assumed that MAPKSpk1 ~ ppMAPKSpk1 system is in equilibrium, so creation and destruction reactions for each state can be disregarded. Thus, for simplicity, MAPKSpk1 is only present in its phosphorylated form (ppMAPKSpk1) in the model.
Despite the simplification, the model represents the three main processes contributing to ppMAPKSpk1 levels: it is created proportionally to starvation and to MAPKKByr1 activity (F1, Eq. 3); it is also self-induced (which is again proportional to MAPKKByr1 activity (F6, Eq. 7-Eq. 9); and it is degraded by mass action kinetics (Eq. 11).
1.1.6.1 Positive Feedback
Previous studies have shown that ppMAPKSpk1 activates Ste11 (Kjaerulff et al., 2005), which in turn transcribes more mapkspk1. This forms a positive feedback loop (the process [L7]) if ppMAPKKByr1 is present to phosphorylate MAPKSpk1. A simplest form of an abstract positive feedback is given as the self-dependence term ppMAPKSpk1k9 in Eq. 9.


Finally, MAPKSpk1 is set to be degraded following simple mass action kinetic, thus the final equation for ppMAPKSpk1 kinetics in wild type yeast is given as (Eq. 11).

1.1.7 Down regulation of the pathway by a negative feedback loop
Transient MAPKSpk1 activation in the wildtype cells (Fig.1C) suggests that there is a delayed negative feedback to downregulate the ppMAPKSpk1 in the pathway, which leaves only a certain time-window for activity. As this downregulation was found abolished in the constitutively active MAPKKbyr1.DD mutant (Fig. 1E), the target(s) of the negative feedback must be MAPKKByr1 or upstream components. Hence, potential negative regulators, such as phosphatases Pyp1 and Pmp1 that are proposed to directly deactivate ppMAPKSpk1 (Didmon et al., 2002), were excluded from our model. Meanwhile, the negative regulators Sxa2 (encoding a serine carboxypeptidase against a mating pheromone P-factor) and Rgs1 (encoding a regulator of Gpa1), both of which are transcriptionally induced upon pheromone signalling, fit well to the criteria of a negative feedback component (Imai and Yamamoto, 1992; Mata and Bahler, 2006; Pereira and Jones, 2001; Watson et al., 1999). Receptor internalization is also expected to be a part of the negative feedback (Hirota et al., 2001) and regulation by antisense RNA for the mapkspk1 transcript as well as other signalling components may also play a role (Bitton et al., 2011). As relative contributions of each remain to be quantified, we represented all these potential negative feedbacks collectively as a single circuit in our model that inactivates the PS unit (the process [L8]) (Fig 7A). The chemical equation is therefore given as: Ras1GTP + ppMAPKSpk1 + PS → Ras1GTP + ppMAPKSpk1, which gives rise to the negative term in Eq. 12.

1.1.7.1 Ras1GTP contribution to the negative feedback
Transient, peaking ppMAPKSpk1 activation in wildtype solely requires a delayed negative feedback. However, as described in the main text, a more complex regulation is necessary to describe the both earlier and lower peak in ras1.G17V and cdc42-GEFScd1Δ mutants. By incorporating Ras1GTP in this feedback (the process [L10], see: Eq. 12), we could precisely recapitulate both phenotypes.
1.1.7.2 The “simple-activator-Ras” model variant
We wanted to show the behaviour of the model if Ras1GTP would only act as an activator. From the wild type model presented in Fig.7 we removed Ras1GTP from the downregulation resulting in (Eq. 13).

We fitted this model variant to the data sets as before, using Hooke–Jeeves (Hooke and Jeeves, 1961) and particle swarm optimisation methods (Kennedy and Eberhart, 1995). The objective value for the best fit was ~3 higher for this model variant than for the original model. Although it recapitulated the main features (Fig.S7B), it could not describe the observed “earlier and lower” signalling phenotype observed in the ras1.G17V and cdc42-GEFScd1Δ strains. Finally, we also show that the addition of Ras1GTP to this model only leads to increased amplitude, not to earlier timing (Fig.S7C).
1.1.8 Model simplification
After extensive parameter estimations, we found that the model can be simplified in the number of individual parameters for forward and reverse reaction of the same species without compromising the quality of fit. For the Ras1GDP ←→ Ras1GTP and MAPKKByr1 ←→ ppMAPKKByr1 reactions we could set the forward and reverse parameters to the same value, and achieve virtually identical quality fits, while reducing the number of free dimensions in the parameter space by two. With this simplification the remaining model parameters became uniquely identifiable, with the exception of k1 (Fig.S6). We also fitted the models with these as free parameters and achieved very similar fit qualities, but most parameters became unidentifiable, therefore, we decided for the simpler model.
Mutant strains
1.1.9 MAPKKbyr1.DD
MAPKKByr1.DD harbors two phosphomimetic point mutations, which keep MAPKKByr1.DD active even in the absence of its activator MAPKKKByr2 (Fig. 3). Therefore, this mutation effectively uncouples MAPKSpk1 from the upstream part of the pathway, as represented in Fig. 7A, MAPKbyr1.DD panel. In this mutant, MAPKSpk1 (its substrate) also becomes constitutively phosphorylated and activated (Fig. 1E).
It is known that the phosphomimetic substitution of the amino acids often does not fully “mimic” the phosphorylated status and often fails to bring a full activation of the modified kinase. This is likely happening to the MAPKKByr1.DD mutant molecule: the initial production of ppMAPKSpk1 upon nitrogen starvation was much slower in the MAPKKbyr1.DD mutant than in wildtype (Fig. 1E). This effect is represented by the fByr1DD <1 fitted parameter in the MAPKByr1.DD model variant (see: Eq. 14).

As MAPKByr1 is not induced upon starvation (Nadin-Davis and Nasim, 1990), in the mutant strain, we could implement the mutation by setting initial concentrations [Byr1]0 = 0 and [Byr1PP]0 = 1; and setting the respective activation and inactivation reactions to zero.
1.1.10 ras1.G17V
The ras1.G17V strain contains a point mutation, equivalent to human Ras G12V oncogenic mutation, which impairs the GTPase activity of the molecule (Trahey and McCormick, 1987). This results in being most of the molecules to stay in the Ras1GTP form.
In the model, the following changes are implemented to represent the mutation: The initial concentration of [Ras1GTP]0 is set to 1, while that of [Ras1GDP]0 is set to 0, which is the opposite of the wildtype initial state. Also, the deactivation and activation reactions are set to zero.
1.1.11 Cdc42-GEFscd1Δ
Ras1GTP is proposed to interact with and activate Cdc42-GEFScd1, which then activates Cdc42 by acting as a GDP-GTP exchange factor (GEF) (Chang et al., 1994). Because Cdc42-GEFScd1 binds Ras1, the loss of it leads to an increased pool of unbound Ras1GTP. In our model this mutation is implemented as additional, unbound Ras1GTP added to the wildtype system. In this setting the amount of Ras1GTP available for MAPKKKByr2 determines the ppMAPKSpk1 dynamics. Since it is unknown, how much Ras1GTP is bound by Cdc42-GEFScd1, we fit the [Ras1GTP]0 as a free parameter in the otherwise intact, wild type model.
1.1.12 Implementation and availability
The ppMAPKSpk1 temporal dynamics in the four strains, wildtype, MAPKKbyr1.DD, ras1.G17V and cdc42-GEFScd1Δ, were described by 6 ODEs and 8 parameters shared across all species (List of Differential Equations, Supplementary Table S2). MAPKbyr1.DD has an additional parameter, fByr1DD, while [Ras1GTP]0 is fitted the Cdc42-GEFscd1Δ strain as described above. The model represents relative concentrations of proteins on an absolute time scale. Initial concentrations of components are therefore either set to 1, if the component is present prior to starvation, or 0, if the component is not present, and it is induced or activated during starvation or pheromone response. To show that the model is at steady state before nitrogen removal, it was simulated for 100 hours prior to starvation in every case. All variables remained constant during this time. All other plots start from T=t-100 as origin, when nitrogen is removed.
Model simulation and parameter estimation (model fitting) was performed in COPASI 4.20 (Hoops et al., 2006). Visualisation and data analysis was done in python v2.7 and R v3.2. Plotting was performed by base R graphics and by the MarkdownReports v2.9.5 (Vertesy, 2017), pheatmap (Kolde, 2013) and plotly v4.7.1 (Sievert et al., 2017) packages.
1.1.13 Parameter Estimation
Parameter estimation consisted in fitting of 8 rate constants (parameters) and one additional parameter per mutant strain. We used the gradient-free Hooke–Jeeves (Hooke and Jeeves, 1961) and particle swarm optimisation methods (Kennedy and Eberhart, 1995) implemented in COPASI.
We found that the algorithm converges better to the optimal solution, if key time points in the dataset are counted with different weights for optimisation. Therefore, data points 102 (early activation), 108 and 109 (peak) were passed on with triple weight to the optimisation function.
1.1.13.1 Parameter identifiability, multiplex parameter estimation and ensemble modelling
To investigate parameter identifiability, we performed multiplexed parameter estimation by 5000 parallelised particle swarm optimisation. In each of the estimation rounds, the model was fitted to the data, starting from randomised parameters. Parameters were sampled uniformly +/− 4 orders of magnitudes around the previously achieved best fit, except the exponent (N). This is the exponent of the positive feedback loop, is therefore an ‘explosive’ parameter, and there is no reason to assume a stronger dependence than 4-th order (x4) for ppMAPKSpk1 in the positive feedback. The range for this parameter was therefore set to [1e-5, 4].
We repeated the estimations with +/− 5 magnitudes (5000 times), but we achieved no better fit, while the convergence of optimisation dramatically decreased (i.e. >90% of the optimisations did not get close to the optimal fit).
We found that with increasing fit quality (lower objective value) all parameters except k1 converge to a single value, or a very limited range (Fig.S6D, top row, objective value <5).
In Fig.S7A, we further show the convergence on linear scale for an extended number of simulations (objective value <8). The convergence of parameters is even more pronounced. In suboptimal fits (O.V. >>3.6) [Ras1GTP]0 in the scd1Δ strain frequently hits the upper boundary, which marks a 10-fold increase in available Ras1GTP. Although the boundary is arbitrary, it is unreasonable to think that there will be a bigger increase to the available Ras1GTP pool by the knockout of scd1.
Multiplexed parameter estimation for the simple-Ras model performed in the same manner as for the wildtype, 1000 fits with particle swarm optimisation from randomly sampled starting points from a parameter space +/− 4 magnitudes around the best previous fit.
1.1.13.2 Ensemble modelling
To show the reliability of the model dynamics in spite of the un-identifiability of certain parameters, we applied ensemble modelling (Brannmark et al., 2010). In this approach, we analysed the predicted time courses of the 100 best fitting models to show that regardless of the residual parameter uncertainty, the simulated variables’ dynamics are robustly predicted (Fig. S8). To show the variation of the individual simulation, ten thousand randomly sampled simulation points are displayed behind the running average.
1.1.14 List of Differential Equations
As introduced above, here listed and separately defined for all species. Equations 4b and 6b are only listed here, and provided for completeness: they are simply the reverse reactions for 4 and 6 respectively, thus not discussed in the section above.


1.1.15 List of Algebraic Equations
(All introduced above)


1.1.16 Availability
Upon acceptance, the source code for analysis is available “as-is” under GNU GPLv3 at https://github.com/vertesy/Competition.Model.of.Ras.in.Pombe.Pheromone.Response. The model file will be provided at https://www.ebi.ac.uk/biomodels-main/ in SBML “Level 3: Version 1” format exported from COPASI. The recommended COPASI format model file will be available at the GitHub repository.
Author Contributions
E.J.K., S.R. and K.T. generated yeast strains. E.J.K., G.S. and K.T. monitored activation status of MAPKSpk1 and Cdc42. A.V. and E.K. conducted mathematical modelling. E.J.K., K.S. and K.T. conducted image analysis. M.T., R.G., C.P. and C.D. conducted biochemical analysis of Ras1, Byr2 and Scd1. E.J.K., A.V., E.K. and K.T. designed the experiments and interpreted the data.
Declaration of Interests
The authors declare no competing interests.
Acknowledgment
The authors thank Tatsuya Maeda, Thibault Mayor, Janni Petersen, Louise Fairall, John Schwabe, David Critchley, Andrey Reviyakin, Gary Willars and Mohan Harihar for helpful suggestions, stimulating discussions and critical reading of the manuscript. We thank PROTEX and PNACL at University of Leicester for their technical assistance. We are grateful to Kazu Shiozaki, Keith Gull and Yeast Genetic Resource Center for providing strains and antibodies. This work was funded by the Wellcome Trust Institutional Strategic Support Fund WT097828/Z/11/Z, WT097828/Z/11/B and the Deutsche Forschungsgemeinschaft (DFG) EXC 81. A.V. was supported by German Academic Exchange Service (DAAD) A0981674.
References


