

Reactive oxygen species (ROS) generated by mitochondria are a well-known example of mitochondria-derived signals that can drive cell adaptations or trigger cell damage1–4. This is the case of the increase in ROS upon acute hypoxia5–7. However, the precise mechanism by which acute hypoxia triggers mitochondrial ROS production is still unknown. Mitochondrial Ca2+ movements have been considered direct effectors in cell signalling, and recent reports show that the mitochondrial Na+/Ca2+ exchanger (NCLX) has a major role in controlling Ca2+ homeostasis during reperfusion8. However, the role ascribed so far to mitochondrial Na+ is to serve as a mere mediator to equilibrate membrane potential9. Here we show that acute hypoxia selectively induces mitochondrial Na+ import into the matrix, which regulates mitochondrial OXPHOS activity and drives ROS production. We found that NCLX is activated by the mitochondrial complex I conformational shift induced by hypoxia10. Na+ imported into the matrix reduces the fluidity of the mitochondrial inner membrane and the mobility of free ubiquinone. As a consequence, the transfer of electrons between complexes II and III is decreased, while transfer between I and III is maintained, as it depends preferentially on the ubiquinone trapped in the supercomplexes11–16. The reduction in ubiquinone mobility increases superoxide production at complex III, generating a redox signal. Inhibition of mitochondrial Na+ import through NCLX is sufficient to block this pathway, preventing hypoxia adaptation and injury in ex vivo and in vivo models. These results underscore a new role for mitochondrial Na+ in controlling OXPHOS function and mitochondrial redox signals, providing an additional functional implication of the plasticity model of organization of OXPHOS complexes17. In addition, our data introduce a new therapeutic potential for NCLX inhibition, controlling hypoxia adaptation and injury through Na+ homeostasis.
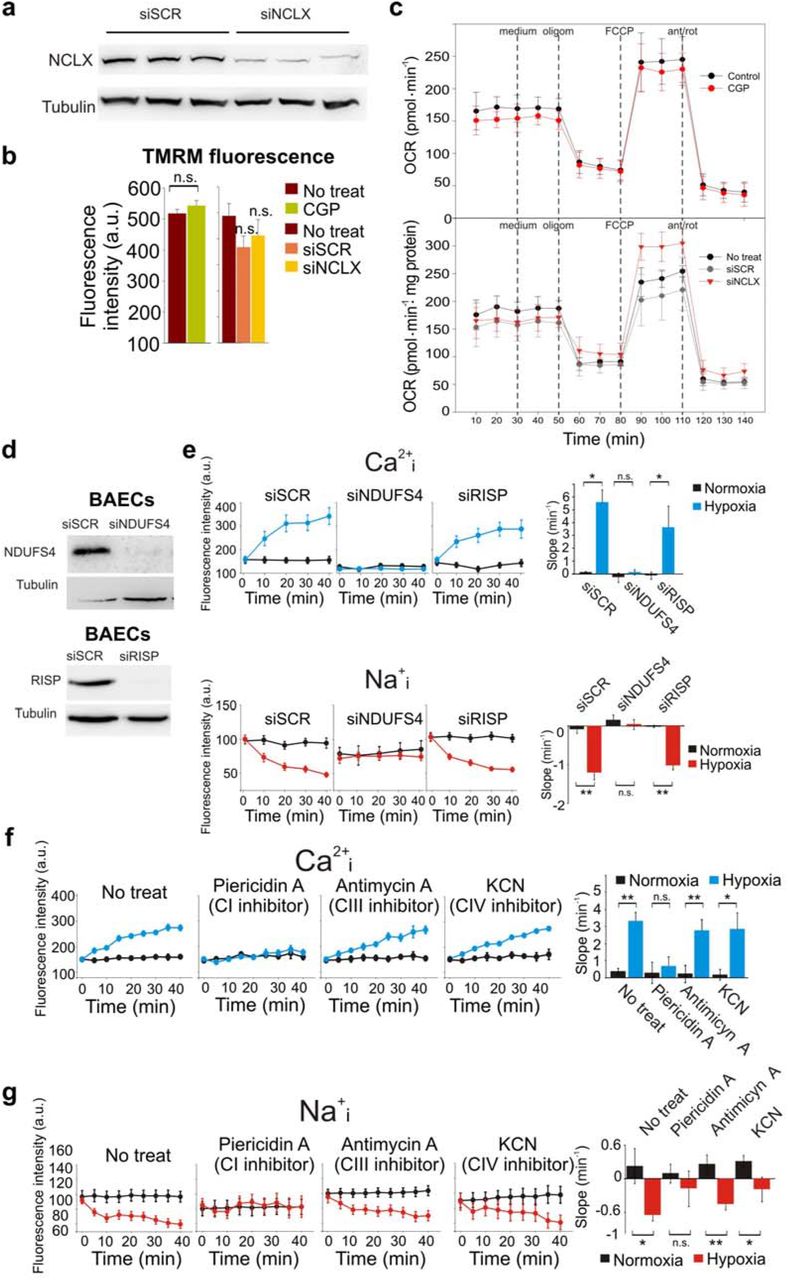
Primary bovine aortic endothelial cells (BAECs) exposed to acute hypoxia showed a marked increase in cytosolic Ca2+ (Ca2+i) and a decrease in cytosolic Na+ (Na+i) that is prevented by NCLX down-regulation or its pharmacologic inhibition by CGP-37157 (Fig. 1) without interfering in mitochondrial membrane potential or respiration (Extended Data Fig 1a-c). Thus, acute hypoxia induces NCLX activation, which modulates the cytosolic levels of Ca2+ and Na+.

Cytosolic Ca2+ or Na+ was measured by live cell fluorescence microscopy in normoxia or acute hypoxia (2% O2). a-d, BAECs not treated (No treat) or transfected with scramble siRNA (siSCR) or siRNA for NCLX (siNCLX). e-h, BAECs treated or not with the NCLX inhibitor CGP-37157. a,c,e,g, time-course traces; b,d,f,h, slopes. n=3. * p < 0.05, ** p < 0.01, *** p<0.001, n.s. not significant (Student’s t-test).
Cells and tissues produce a burst of superoxide upon the acute exposure to hypoxia as an essential feature in a range of adaptive responses6,18. This burst is blocked by NCLX silencing or inhibition (Fig.2a-d). Hydrogen peroxide (which is produced after superoxide dismutation) behaved similarly (Fig. 2e). Measurement with DCF, a probe that is irreversibly oxidized after reaction with several ROS, confirmed that NCLX activation in acute hypoxia is required for the ROS burst (Fig. 2f).

a–d, Superoxide detection by fluorescence microscopy after incubation with DHE in 10-min time windows in normoxia (Nx) or hypoxia (1% O2); AA = antimycin A. a-b, BAECs with CGP-37157 (NCLX inhibitor); c, HUVECs with CGP-37157¸d, BAECs with NCLX knockdown. e, Detection of H2O2 by live confocal microscopy in CytoHyPer-transfected BAECs in normoxia (Nx) or acute hypoxia (1% O2, Hp). f, Detection of ROS by live fluorescence microscopy with DCFDA in normoxia or acute hypoxia (2% O2). n=3 (all except e, n=4). Two-tailed Student’s t-test for pairwise comparisons and one-way ANOVA and Tukey’s test for multiple comparisons n.s. not significant, * p<0.05, ** < p0.01, *** p<0.001. b-d, statistical comparisons shown only for Nx vs 0-10 groups.
In addition to NCLX activity, it has been reported elsewhere that mitochondrial complexes III (CIII) and I (CI) are necessary for ROS production and cellular adaptation to hypoxia5,19,20. Knockdown of the CI subunit NDUFS4, but not of the CIII subunit RISP, abrogated Na+/Ca2+ exchange in hypoxia (Extended Data Fig. 1d-e). Accordingly, pharmacological inhibition of CI but not of CIII or of complex IV (CIV) abolished the hypoxia-induced Na+/Ca2+ exchange (Extended Data Fig.1f-g), confirming that CI, but not other mitochondrial complexes, is necessary for NCLX activation in acute hypoxia.
NCLX is activated when mitochondrial matrix is acidified, and it has an essential role in maintaining a Na+ gradient that parallels the H+ gradient (ΔpNa=ΔpH) across the mitochondrial inner membrane21. Complex I presents two functionally different conformation states (A-CI or D-CI)22–24, and D-CI behaves as a mitochondrial NHE, extruding Na+ and importing H+ into the matrix25, contributing in that way to acidify the mitochondrial matrix (Extended Data Fig. 2a). The transition from A-CI to D-CI is favoured in acute hypoxia10. The A/D transition exposes the Cys-39 residue within the ND3 subunit of CI10,23-25. Fluorescent labelling of exposed Cys-39 in non-denaturing conditions allowed the quantification of the ND3 band separated by tricine gel-electrophoresis10. We confirmed that hypoxia treatment for 5 min increased the Cys-39 exposure and decreased CI activity independently of NCLX inhibition (Extended Data Fig.2a-d). Concomitantly, hypoxia promoted mitochondrial CI-dependent matrix acidification10 independently of NCLX activity (Extended Data Fig.2e). An alternative mitochondrial NHE activity, independent of CI, is performed by a still unidentified molecular component; this activity is sensitive to amiloride compounds such as EIPA. The observation that the Na+/Ca2+ exchange in BAECs was inhibited by rotenone (a CI inhibitor) but not by EIPA (Extended Data Fig.2f-g) identifies CI as the responsible of NCLX activation.
In line with previous reports identifying CIII as a site of ROS production in hypoxia26,27, RISP knockdown abolished the superoxide burst in acute hypoxia (Fig. 3a) without affecting NCLX activation (Extended Data Fig. 1d-e). This effect can be reproduced by myxothiazol, an inhibitor of CIII Qo site (Fig. 3b). In order to assess the mechanism by which NCLX activity drives CIII superoxide production, NCLX was activated in normoxia by increasing cytosolic Na+ through the addition of NaCl28 (Extended Data Fig.3a-c). NCLX activation in normoxia promoted CIII-mediated superoxide production (Fig. 3c-d) which correlated with a reduction in cellular oxygen consumption (Fig. 3e and Extended Data Fig.3d). Accordingly, ROS production in active coupled respiring mitochondria transiently increased upon sequential addition of Na+ and Ca2+, which activates Na+ entry and Ca2+ extrusion through NCLX29,30 (Extended Data Fig. 3e).

a–b, Superoxide detection by fluorescence microscopy after incubation with DHE in 10-min time windows in normoxia (Nx) or hypoxia (1% O2), in BAECs with RISP silencing (a) or with myxothiazol (b); n=3. c-d, Superoxide detection with DHE in BAECs treated with extra 100 mM NaCl, CGP-37157 or myxothiazol; n = 3. e OCR of BAECs before and after NaCl-induced NCLX activation, n=4. f Effect of NCLX activation on succinate-based OCR in isolated mitochondria from BAECs, n=5. g-j Effect of NaCl in isolated mitochondrial membranes from BAECs. g, Succinate-cytochrome c activity, n=4. h Box diagram showing ROS production on succinate-cytochrome c activity, n=10. i NADH-cytochrome c activity, n=3. j Glycerol-3-phosphate-cytochrome c activity, n=3. k, Variation in the anisotropy of TMA-DPH contained in liposomes of egg phosphatidylcholine (PC) in the presence of increasing amounts of NaCl, n=4. l, Effect of hypoxia (1% O2, 10 min) on intramitochondrial Na+ content in BAECs, n=4. m, FRAP of BAECs expressing MitoDsRed, a protein directed to the mitochondrial inner membrane, in normoxia or acute hypoxia (1% O2), n=4. n-o, Nonyl acridine orange quenching recovery signal after FRAP in BAECs expressing siSCR or siNCLX (n) or treated with CGP (o) and exposed to normoxia or acute hypoxia (1% O2), n=5. p, CoQ10 redox state of HUVECs in normoxia (No treat) or in acute hypoxia (1% O2, Hp), n=4. Two-tailed Student’s t-test for pairwise comparisons and one-way ANOVA with Tukey’s test for multiple comparisons. n.s. not significant, * p<0.05, **<p 0.01, *** p<0.001. AA = antimycin A.
The contribution of the different ETC complexes to respiration was measured in isolated mitochondria upon addition of different substrates and inhibitors11, in the absence or presence of Na+ and Ca2+ to activate NCLX, and with the addition of CGP to inhibit NCLX. In contrast to CIV-dependent respiration, CI- and CII-dependent respiration were decreased by NaCl addition, but only reduction in CII-dependent respiration is dependent on NCLX activation (Fig. 3f and Extended Data Fig.3f-g). CII+III activity in isolated mitochondrial membranes was unaffected by the addition of Ca2+ (Extended Data Fig. 3h), but clearly decreased with Na+ addition in a dose- dependent manner (Fig. 3g and Extended Data Fig.3i) which also increased ROS production (Fig. 3h). Surprisingly, CII and CIII activities showed no variation after Na+ addition (Extended Data Fig. 3j-k); neither did CI+III activity (Fig. 3i).
The specific inhibition exerted by Na+ on the combined II+III activity can be explained by the proposed role of supercomplex formation between complexes I and III14. Due to the formation of supercomplexes the electron transfer between CI-III and CII-III relies on different CoQ pools14; thus, Na+ would specifically affect electron transfer between CII-III affecting the flux of the so-called CoQFAD pool, the CoQ pool not shielded by supercomplexes. If this explanation is correct other activities dependent on the CoQFAD pool should also be affected. In agreement with this prediction, G3PD+III activity decreased in the presence of Na+ (Fig. 3j). Interaction between CoQFAD and CIII is limited by CoQ diffusion through the mitochondrial inner membrane, which depends on its fluidity31. Previous reports have shown that Na+ reduces diffusion and fluidity in lipid bilayers through its interaction with the ester group of phospholipids32; in line with this, we added increasing concentration of Na+ to liposomes containing TMA-DPH, a fluorescent probe that locates at the lipid-water interface of the phospholipid bilayer, observing an increase in its anisotropy, which indicates a reduced fluidity of the lipid membrane (Fig. 3k). We confirmed that hypoxia increased mitochondrial Na+ concentration in an NCLX-dependent manner (Fig. 3l). We used fluorescence recovery after photobleaching (FRAP) of a fluorescent protein targeted to the mitochondrial inner membrane (mitoDsRed) to study mitochondrial inner membrane fluidity. NCLX activation by both NaCl addition and acute hypoxia markedly reduced the FRAP signal (Fig. 3m and Extended Data Fig 3l), which reflects a reduced diffusion of the protein through the mitochondrial inner membrane. This effect was abolished by NCLX inhibition (Fig. 3m and Extended Data Fig 3l). We also used a lipophilic fluorescent probe, nonyl acridine orange (NAO), that binds specifically to cardiolipin33, an abundant characteristic phospholipid of the mitochondrial inner membrane. The reduced recovery rate of NAO fluorescence quenching after photobleaching confirmed the reduction of mitochondrial inner membrane fluidity in acute hypoxia in an NCLX-dependent manner (Fig. 3n-o and Extended Data Fig.3m-n).
All these results can be integrated in a mechanistic explanation: of the two sites of CoQ-CIII interaction, the Qi site is located in the inner side of the membrane, which is affected by the increase of matrix Na+ concentration. Thus, reduction of CoQ diffusion in this side of the membrane would slow down electron transfer from CIII to oxidized CoQ in the Qi site during Q cycle turnover, increasing the half-life of the semiquinone form in the Qo site, and producing superoxide anion34. We confirmed this by studying the CoQred/CoQox ratio. When the downstream flux of electrons in the mitochondrial electron transport chain is reduced by inhibition of CIII or CIV activities, it leads to the increase in the CoQred/CoQox ratio35; this is the case of pharmacological inhibition of CIII by antimycin A, which substantially increased the proportion of reduced CoQ (Fig. 3p). However, if the mechanism proposed here operates, the CoQred/CoQox ratio in acute hypoxia should instead be reduced. This is precisely what we observed in endothelial cells exposed to acute hypoxia, an effect prevented by the inhibition of Na+ entry through NCLX into the mitochondria (Fig. 3p). These results unveil an unexpected new role of mitochondrial matrix Na+ as a direct effector regulating inner membrane fluidity, CoQFAD- CIII interaction, OXPHOS function and ROS production.
Next, we analysed the role of this pathway in different physiological responses to hypoxia. Hypoxic pulmonary vasoconstriction (HPV) helps to match lung ventilation with perfusion by inducing a contractile response in pulmonary arteries (PA). NCLX silencing inhibited the superoxide burst in rat pulmonary artery smooth muscle cells subjected to acute hypoxia (PASMCs; Extended Data Fig. 4a-b). In rat PA, exposure to hypoxia in the absence of pretone (precontraction) induces a rapid contractile response (peak contraction) which decays and reaches a plateau (steady-state contraction). The latter is dependent on mitochondrial ROS36–38. Inhibition of mitochondrial Na+ entry markedly reduced the steady-state component (Extended Data Fig. 4c-d), in a manner that is similar to that caused by antioxidants39.

a–b, Superoxide detection by fluorescence microscopy after incubation with DHE in 10-min time windows in HT-22 cells in normoxia (Nx) or hypoxia (1% O2), n=3. Inset in b shows NCLX silencing effectiveness. c HIF-1α stabilization in HT-22 cells, n=3. d-f Effect of 30 µM CGP-37157 in mice hippocampal slices subjected to normoxia (Nx) or 30 min hypoxia (1% O2; Hp). d CI CysND3, n=3. e Superoxide detection, n=4. f HIF-1α stabilization, n=4. g–h Mice subjected to photothrombotic stroke induction were treated with vehicle or with 30 mg/kg CGP-37157. g CI CysND3 exposure from samples of different regions of the brain: infarct, ipsilateral (Ipsi) and contralateral (Contra), n=3. h Infaract volume quantification in brain tissue stained with triphenyltetrazolium chloride, n=7. Two-tailed Student’s t-test for pairwise comparisons and one-way ANOVA with Tukey’s test for multiple comparisons. n.s. not significant, * p<0.05, **<p0.01, *** p<0.001.
A central component of hypoxic long term adaptation is the stabilization of HIF-α, in which mitochondrial ROS production is involved27,40-42. Blockade of mitochondrial Na+ influx with CGP or NCLX silencing abolished the hypoxic HIF-1α stabilization and the induction of HIF-regulated genes in endothelial cells (Extended Data Fig. 4e-g). Both the hypoxic superoxide burst and HIF-1α stabilization were also abolished in mouse hippocampal neuronal cells after NCLX inhibition (Fig. 4a-c). Inhibition of mitochondrial Na+ entry during hypoxia maintained CI conformational shift intact, but selectively abolished the superoxide burst and HIF-1α stabilization in mouse hippocampal slices (Fig. 4d-f). Finally, in mice subjected to photothrombotic ischemic injury we observed the CI conformational shift in the infarcted and ipsilateral areas, independently of NCLX (Fig. 4g). However, the inhibition of mitochondrial Na+ entry promoted a significantly smaller infarct size than that of non-treated littermates (Fig. 4h), indicating that Na+ regulation of OXPHOS is involved in brain ischemic injury in vivo.
NCLX has been mainly studied in relation to its role in Ca2+ homeostasis in mitochondria, and in the regulation of Ca2+ currents in the cell8,29,30. In this line, recent reports have demonstrated the essential role of NCLX in mitochondrial Ca2+ cycling in the adult heart8 and controlling Ca2+ movement across the plasma membrane28. NCLX overexpression protected the heart from ischemia/reperfusion injury8, which could seem to be contradictory with our results showing protection by NCLX inhibition in ischemia; however, both results are complementary, as we have studied redox signaling in an ischemic episode, highlighting the effects of acute Na+ entry in the mitochondria, while Luongo et al. studied the recovery after reperfusion, which involve long-term effects of NCLX in Ca2+ cycling8.
The role of Na+ in the cell has been considered to be restricted to the support of membrane potentials and in mitochondria to aid in Ca2+ efflux. Here we show that Na+ directly modulates mitochondrial OXPHOS and ROS signalling. This cation enters the mitochondrial matrix during acute hypoxia and reduces mitochondrial inner membrane fluidity through its direct interaction with lipids. As a result, diffusion of the CoQFAD pool is lessened, reducing the electron transfer at the Qi site. This has, at least, two major consequences: 1) a downregulation of the entrance of electrons into the mitochondrial electron transport chain from FAD dependent enzymes, illustrated by the reduction in the electron flux between CII-CIII and G3PDH-CIII; and 2) the accumulation of the CoQ semiquinone at the Qo site of CIII that produces superoxide anion, which signals downstream short and long-term hypoxic adaptation. In contrast, the activity between CI-CIII or CI-CIII-CIV remains unaffected, because of its lower dependency on membrane fluidity due to supercomplex formation.
Our findings open new horizons for the study of mitochondrial OXPHOS and signalling. The impact of Na+ on mitochondrial homeostasis acting as a direct effector has been so far overlooked and could be essential for the understanding of the mitochondrial physiology in health and disease.
Methods
Animals, cell culture and transfection
All animal experiments were performed following the Guide for the Care and Use of Laboratory Animals and were approved by the institutional ethics committee of the Universidad Autónoma de Madrid or the Universidad Complutense de Madrid, Spain, in accordance with the European Union Directive of 22 September 2010 (2010/63/UE) and with the Spanish Royal Decree of 1 February 2013 (53/2013). All efforts were made to minimize the number of animals used and their suffering.
Cells were routinely maintained in cell culture incubators (95% air, 5% CO2 in gas phase, 37 ºC). Bovine aortic endothelial cells (BAECs) were isolated as described43 and cultured in RPMI 1640 (which contains 133 mM Na+ and 5.3 mM K+) supplemented with 15% heat-inactivated fetal bovine serum (FBS), 100 U/mL penicillin and 100 μg/mL streptomycin. Human umbilical vein endothelial cells (HUVECs) were isolated as described44 and cultured in Medium 199 supplemented with 20% heat-inactivated FBS, 16 U/mL heparin, 100 mg/L ECGF (endothelial cell growth factor), 20 mM HEPES (4-(2-hydroxyethyl)piperazine-1-ethanesulfonic acid), 100 U/mL penicillin and 100 μg/mL streptomycin. BAECs were used between passages 3 and 9 and HUVECs between passages 3 and 7. Endothelial morphology was assessed by visual inspection. Rat pulmonary artery smooth muscle cells (PASMCs) were isolated as described37 and cultured in Dulbecco’s modified Eagle’s medium (DMEM; which contains 155 mM Na+ and 5.4 mM K+) supplemented with 10% FBS, 1.1 g/L pyruvate, 1% non-essential amino acids, 100 µg/mL streptomycin and 100 U/mL penicillin. PASMCs were used between passages 2 and 3. Immortalized mouse hippocampal cells (HT22 cell line) were cultured at 37 ºC in DMEM supplemented with 10% heat-inactivated FBS, 20 mM HEPES, 100 U/mL penicillin and 100 μg/mL streptomycin.
Transfection of 30 nM siRNA or 0.25 µg C199S pHyPer-Myto (mitosypHer), pHyPer-cyto (cytohyper) or pDsRed2-Mito (mitoDsRed) vector DNA per 0.8 cm2 well was carried out using Lipofectamine 2000 (Invitrogen). In PASMCs, 10 nM siRNA was transfected using Lipofectamine RNA iMAX (Invitrogen); in parallel experiments, siRNA efficiency was measured by RT-PCR using commercially available primers (TaqMan Gene Expression Assay Rn01481405_m1, Applied Biosystems). Experiments were carried out 48 to 72 h after transfection.
siRNA preparation
Doubled-stranded siRNA against bovine NCLX was designed and purchased from Dharmacon (sense sequence AGCGGCCACUCAACUGCCU). Doubled-stranded siRNAs against bovine NDUFS4, NDUFS2 and RISP were designed and purchased from Integrated DNA Technologies (NDUFS4 sense sequence GCUGCCGUUUCCGUUUCCAAGGUUUTT; NDUFS2 sense sequence TCGGACAGTCGACATTGGGATT; RISP sense sequence CCAAGAAUGUCGUCUCUCAGUUUTT). Scrambled siRNA (siSCR) was purchased from Santa Cruz Biotechnology. Doubled-stranded siRNA against human NCLX (SLC8B1 gene) was designed and purchased from Dharmacon (sense sequence AACGGCCACUCAACUGUCU), and siRNA against rat NCLX (SL8B1 gene) was purchased from OriGene (SLC8B1 Trilencer-27 Rat siRNA).
Detection of superoxide by fluorescence microscopy in fixed cells
Cells were seeded on glass coverslips one day before experimentation. In some experiments, 1 µM rotenone or 10 µM 7- chloro-5-(2-chlorophenyl)-1,5-dihydro-4,1-benzothiazepin-2(3H)-one (CGP-37157) was added 30 min before experimentation and maintained during the experiment. For treatments in hypoxia, all the solutions were pre-equilibrated in hypoxic conditions before use; plated cells were introduced into an Invivo2 400 workstation (Ruskinn) set at 1% O2, 5% CO2, 37 ºC, and incubated for the indicated times (0, 15, 30, 45 and 60 min) in fresh medium, washed three times with Hank´s Balanced Salt Solution with Ca2+/Mg2+ (HBSS+Ca/Mg, which contains 141 mM Na+ and 5.8 mM K+) and incubated with 5 µM dihydroethidium (DHE) in HBSS+Ca/Mg for 10 min in the dark. Excess probe was removed by three washes with HBSS+Ca/Mg, cells were fixed with 4% paraformaldehyde (PFA), and incubated in the dark at 4 ºC for 15 min. After fixation, the cells were again washed three times with HBSS+Ca/Mg and coverslips were placed on slides. For normoxic treatments, the medium was changed for fresh normoxic medium, and cells were treated as for hypoxic cells but in a standard cell incubator. Images (three images per each coverslip; the number of independent experiments is described in the figure legends) were taken with a Leica DMR fluorescence microscope with a 63× objective, using the 546-12/560 excitation/emission filter pairs, and quantified using ImageJ software (NIH). The same threshold was set for all the images and the mean value from histograms was averaged for the three images of each coverslip.
Detection of intracellular calcium, sodium, ROS and mitochondrial membrane potential by live imaging fluorescence microscopy
Cells were seeded in 6-well plates one day before experimentation. Plated cells were washed three times with HBSS+Ca/Mg+Glucose and incubated with 30 nM tetramethylrhodamine methyl ester (TMRM), 1 µM Fluo-4 AM, 10 µM CoroNa Green AM, DHE or 10 µM 6-carboxy-2’,7’- dichlorodihydrofluorescein diacetate (CDCFDA) for 20 min at 37 ºC in the dark. In some experiments, 10 µM CGP-37157 was also added and maintained during the experiment. CDCFDA, CoroNa Green AM and Fluo-4 AM were then washed out and new HBSS+Ca/Mg was added. For Fluo-4 AM imaging, cells were further incubated for 30 min at 37 ºC in the dark to allow complete de-esterification of the probe. After this time, the plate was placed into a Leica DM 16000B fluorescence microscope equipped with a Leica DFC360FXcamera, an automated stage for live imaging and a thermostated hypoxic cabinet. The planes were focused for image capture, and images were taken with a 20× objective every 2 min during 40 min, providing a total of 21 cycles. Normoxia experiments started and ended at 20% O2 and 5% CO2, whereas hypoxia experiments started at 20% O2 and 5% CO2 and then were switched to 2% O2 and 5% CO2 in cycle 2. The excitation/emission filter pairs used were as follows: 546-12/560 for DHE and TMRM, and 480-40/505 for CDCFDA, Fluo-4 AM and CoroNa Green AM. Images were quantified with Leica Las-AF software. Three independent experiments were performed for each condition. For each experiment and condition, four regions of interest (ROIs) were created, each ROI surrounding an individual cell, and the mean fluorescence of each ROI for each time cycle was collected. In some analyses, for each experiment and condition, four identical linear ROIs were created and the maximum peak value of cycles 0, 5, 10, 15 and 20 were collected for each ROI.
Detection of intracellular calcium, sodium and H2O2, and intramitochondrial pH by live imaging confocal microscopy
To detect intracellular calcium and sodium, cells were seeded one day before experimentation, washed three times with HBSS+Ca/Mg+Glucose and incubated with 1 µM Fluo-4 AM or 5 µM CoroNa Green AM for 30 min at 37ºC in the dark. In some experiments, 10 µM CGP-37157, 1 µM rotenone, or 10 µM EIPA were also added and maintained during the remainder of the experiment. CoroNa Green AM and Fluo-4 AM were then washed out and new HBSS+Ca/Mg plus 25 mM glucose was added. For Fluo-4 AM imaging, cells were further incubated for 30 min at 37ºC in the dark to allow complete de-esterification of the probe. After this time, the plate was placed into a Leica SP-5 confocal microscope, an automated stage for live imaging and a thermostated hypoxic cabinet. The planes were focused for image capture and images were taken with a 20× objective every 2 min during 40 min, providing a total of 21 cycles. Normoxia experiments started and ended at 20% O2 and 5% CO2, whereas hypoxia experiments started at 20% O2 and 5% CO2 and then were switched to 1% O2 and 5% CO2 in cycle 1. Loaded cells were excited with an argon/krypton laser using the 496 nm line. Fluorescence emission of Fluo-4 AM and CoroNa Green was detected in 500–575 nm range.
To detect intramitochondrial pH, cells were transfected with the ratiometric probe mitosypHer in 8-well plates two days before the experiment. The same protocol as above was used, except that the objective was 63× and imaging time was 30 min, with 7 cycles of 5 min. Excitation was performed with a 405 diode laser for 405 nm line and an argon/krypton laser for 488 nm line, and fluorescent emission was recorded at the 515–535 nm range. Samples were excited with an argon/krypton laser using the 488 nm line for mitosypHer. Fluorescence emission of mitosypHer was detected in the 515–535 nm range.
For H2O2 detection, BAECs were transfected with the non-targeted version of HyPer (pHyPer-cyto) following the same procedure for live imaging as with mitosypHer. Images were quantified with ImageJ software. Three or four independent experiments were performed for each condition. For each experiment and condition in loaded cells, four identical linear regions of interest (ROIs) were quantified, and for each time point the mean of these ROIs was obtained.
Isolation of submitochondrial particles and blue native polyacrylamide gel electrophoresis
BAECs were washed twice in ice-cold PBS, scraped off the plate and centrifuged for 5 min 600 g at 4ºC. To obtain submitochondrial particles (SMPs), cells were resuspended in 200 µL of PBS, mixed with 200 µL of 8 mg/mL digitonin and incubated for 10 min in ice. After this, 1 mL PBS was added and the samples were centrifuged 5 min at 10,000 g, 4ºC. The resulting pellet of SMPs was washed and resuspended in 100 µL of 1.5 M aminocaproic acid, 50 mM Bis-Tris/HCl pH 7.0. Protein concentration was quantified by BCA assay. SMPs were centrifuged for 2 min at 13,500 g, 4 ºC and the pellet was resuspended at 10 µg/µL with 1.5 aminocaproic acid, 50 mM Bis-Tris/HCl pH 7.0. SMPs were solubilized with 4 g/g digitonin, incubated 5 min in ice and centrifuged for 30 min at 16,000 g, 4 ºC. Supernatant was collected and mixed with sample buffer (Commassie brilliant blue G-250 5% in 1 M aminocaproic acid solution). For each sample, 100– 150 µg was loaded and run on a 3–20% gradient BN-PAGE gel as described45. Gel transfer was performed onto PVDF membranes, which were then washed with methanol for 3 min before western blotting.
Western blot analysis
Protein samples were extracted with non-reducing Laemmli buffer without bromophenol blue and quantified by BCA assay. Extracts were loaded onto 10% standard polyacrylamide gel electrophoresis after adding 5% 2-mercaptoethanol, and subsequently transferred to nitrocellulose membranes or PVDF membranes for BN-PAGE. The following antibodies were used: monoclonal anti-HIF-1α antibody (#MAB1536; R&D Systems), polyclonal anti-NCLX antibody (ARP44042_P050; Aviva Systems Biology), monoclonal anti-NDUFS4 antibody (ab87399; Abcam), monoclonal anti-NDUFS2 antibody (ab110249; Abcam), monoclonal anti-RISP (UQCRFS1) antibody (ab14746; Abcam), anti-NDUFB6 antibody (16037-1-ap, Proteintech), anti-ubiquinol-cytochrome c reductase core protein I antibody (ab110252; Abcam) and monoclonal anti-α-tubulin antibody (#T6199, Sigma). Antibody binding was detected by chemiluminiscence with species-specific secondary antibodies labeled with horseradish peroxidase (HRP), and visualized on a digital luminescent image analyzer (Fujifilm LAS-4000).
Quantitative Real Time PCR
Total RNA was extracted from HUVECs using Trizol reagent (Vitro) and 0.5 µg was reverse-transcribed (Gene Amp Gold RNA PCR Core Kit; Applied Biosystems). PCR was performed with GotaqqPCR Master Mix (Promega) or Power SYBR Green PCR Master Mix (Applied Biosystems) with 1 µL of cDNA and specific primer pairs (Table S1). β-actin mRNA was measured as an internal sample control.
Measurement of cellular oxygen consumption
Oxygen consumption rate (OCR) was measured using an XF24 Extracellular Flux Analyzer (Seahorse Bioscience, North Billerica, MA, USA). BAECs, 6×10⁴ per well (6–7 wells per treatment for each independent experiment) were plated one day before the experiment. Cells were preincubated with unbuffered DMEM (155.462 mM Na+ and 5.366 mM K+) supplemented with 25 mM glucose, 1 mM pyruvate, and 2 mM glutamine for 1 h at 37 °C in an incubator without CO2 regulation. OCR measurements were programmed with successive injections of unbuffered DMEM, 5 µg/mL oligomycin, 300 nM carbonyl cyanide 4-(trifluoromethoxy) phenylhydrazone (FCCP), and 1 µM rotenone plus 1 µM antimycin A. DMSO or 10 µM CGP-37157 were added before starting the measurements. In experiments using silenced cells, as proliferation and cell growth may vary after plating, protein concentration was quantified by the BCA assay to normalize the OCR. Calculations were performed following the manufacturer´s instructions. After measuring basal respiration, oligomycin was added to inhibit respiration (by blocking H+-ATPase); therefore, the amount of oxygen used to produce ATP by OXPHOS is estimated from the difference with basal oxygen consumption (i.e., coupling efficiency). FCCP uncouples OXPHOS by translocating H+ from intermembrane space to matrix, thus maximizing electron flux through the electron transport chain (ETC), giving the maximal respiration rate. This treatment provides information about the stored energy in mitochondria that a cell could use in an energetic crisis (i.e., reserve capacity). Antimycin A and rotenone block complexes III and I, respectively, consequently inhibiting electron flux through the ETC and eliminating any H+ translocation, therefore, the leftover value is non-mitochondrial respiration, that is, the oxygen consumed by other enzymes in the cell.
Fluorescent labeling of ND3 Cys-39 from isolated mitochondrial membranes
For cell extracts and ex vivo samples, the same procedure as for SMP preparation was used. For in vivo samples, brain mitochondria isolation was performed using the Mitochondrial Isolation Kit for tissue (ab110168; Abcam). Briefly, brain tissue was washed and minced in Isolation Buffer and cells were disrupted using a Dounce tissue grinder pestle (Sigma). Then, homogenized tissue was centrifuged at 1,000 g for 10 minutes at 4 °C and the supernatant was centrifuged at 12,000 g for 15 minutes at 4 °C, giving the enriched mitochondria and cytosol fractions in the pellet and the supernatant, respectively. SMP or mitochondrial protein amount was determined by BCA assay and then proteins were solubilized with 4 g/g digitonin, incubated 5 min on ice and centrifuged for 30 min at 16,000 g, 4 ºC. Samples from cell cultures were split into two parts: one part was incubated at 37 ºC for 60 min to fully deactivate complex I and the other part was kept on ice. Samples were then incubated with Bodipy-TMR C5-maleimide (Invitrogen) for 20 min at 15 ºC in the dark; then, 1 mM cysteine was added and the samples were further incubated for 5 min. After this time, the samples were precipitated twice with acetone, centrifuged at 9,500 g for 10 min at 4 ºC in the dark, and the resulting pellet was resuspended in non-reducing Laemmli loading buffer. For each sample, 100 g was loaded onto 10% Tricine-SDS-PAGE gels as described46. Total protein staining was performed with Sypro Ruby (Invitrogen). The images of the different fluorophores were obtained using a digital fluorescent image analyzer (Fujifilm LAS-4000). Images were quantified using ImageQuant TL7.0 software.
Mitochondria isolation and measurement of H2O2 and oxygen consumption
Mitochondria were isolated from BAECs with a protocol adapted for cell culture14. Briefly, after resuspending BAECs with a sucrose buffer in a glass Elvehjem potter, homogenization was performed by up and down strokes using a motor-driven Teflon pestle. Successive homogenization-centrifugation steps yielded the mitochondria-containing fraction. H2O2 production from isolated rat heart mitochondria was performed in an O2k Oxygraph instrument (Oroboros Instruments). 500 µg of isolated rat heart mitochondria were loaded in KCl buffer with Amplex Red: 150 mM KCl, 10 mM K2HPO4, 1 mM EDTA, 5 mM MgCl2, 1 mg/mL BSA,15 µg/ml of Horseradish peroxidase (HRP), 15 µg/ml of Superoxide dismutase (SOD) and 25 µM Amplex Red. Recordings started before the addition of substrates: 5 mM glutamate and 5 mM malate (GM); and the indicated amounts of NaCl and/or CaCl2 were subsequently added. Oxygen consumption was determined with an oxytherm Clark-type electrode (Hansatech) as described14. Briefly, isolated mitochondria from BAECs (150 µg) were resuspended in MAITE buffer (10 mM Tris-HCl, pH 7.4; 25 mM sucrose; 75 mM sorbitol; 100 mM KCl; 10 mM K2HPO4; 0.05 mM EDTA; 5 mM MgCl2; 1 mg/mL BSA) either untreated, treated with 20 mM NaCl and 100 µM CaCl2 or with 20 mM NaCl, 100 µM CaCl2 and 10 µM CGP-37157. Substrates and inhibitors were then successively added: 5 mM glutamate and 5 mM malate (GM), 1 µM rotenone, 10 mM succinate, 2.5 µg/mL antimycin A, 10 mM N,N,N’,N’-tetramethyl-p-phenylenediamine and 10 mM sodium azide. Oxygen consumption rate (OCR) was obtained by calculating the slope after each treatment. Values for specific complex input were acquired from the subtraction of substrate less specific inhibitor rates.
Mitochondrial membranes isolation and complex activity measurement
Mitochondrial membranes from BAECs were obtained after freezing isolated mitochondria, and OXPHOS enzyme activity was measured as described14, using 50 µg per sample. Briefly, rotenone-sensitive NADH-ubiquinone Q1 oxidoreduction (complex I activity) was measured by changes in absorbance at 340 nm. Succinate dehydrogenase (complex II) activity was recorded in a buffer containing mitochondrial membranes, succinate and 2,6-dichlorophenol-indophenol (DCPIP) by changes in absorbance at 600 nm. Rotenone-sensitive NADH-cytochrome c activity (complex I+III activity) was measured by changes in absorbance at 550 nm after NADH addition. Antimycin A-sensitive succinate-cytochrome c activity (complex II+III activity) was calculated after measuring changes in absorbance at 550 nm. Antimycin A-sensitive ubiquinone 2-cytochrome c activity (complex III activity) was measured following changes in absorbance at 550 nm. Glycerol-3-Phosphate dehydrogenase (G3PD) activity was measured as for CII activity but with glycerol-3-Phosphate (10 mM) as electron donor.
Measurement of mitochondrial sodium
BAECs were untreated or preincubated with extra 100 mM NaCl and/or 10 µM CGP-37157 for 30 min. Then, cells were treated with normoxia, or hypoxia (1%O2) for 10 min. Mitochondria were isolated on ice and resuspended in milliQ water. The samples were split, one part incubated with benzofuran isophthalate tetra-ammonium salt (SBFI) and the other was used to quantifiy protein amount by BCA. For SBFI measurements, a calibration curve was used in every measurement and the fluorescence recorded at 340 nm/380 nm and emission 520 nm in a FLUOstar Omega Microplate Reader (BMG Labtech).
Fluorescence recovery after photobleaching (FRAP)
BAECs were transfected with pDsRed2-Mito Vector (Clontech). Growing media was changed for HBSS+Ca/Mg+Glucose ± 10 µM CGP-37157 ± 100 mM NaCl and the plate placed into a Leica SP-5 confocal microscope, an automated stage for live imaging and a thermostated hypoxic cabinet. The planes were focused for image capture and images were taken with a 63× objective with 13x zoom.
Samples were excited with an argon/krypton laser using the 488 nm line and emission was detected in the 565–595 nm range. Images were collected using TCS software (Leica). MitoDsRed was scanned five times and then bleached using 15 scans at 40% laser power. To image the recovery of fluorescence intensity after photobleaching, we recorded 60 scans every 1 s. FRAP in normoxia was performed at 20% O2 and 5% CO2, the chamber was then switched to 1% O2 and 5% CO2 and after 25 min FRAP was performed in hypoxia.
Fluorescence quenching
Medium of BAECs was changed for HBSS+Ca/Mg+Glucose with 50 nM 10N-nonyl acridine orange. In some experiments 10 µM CGP-37157 ± 100 mM NaCl was added. The plate placed into a Leica SP-5 confocal microscope, an automated stage for live imaging and a thermostated hypoxic cabinet. The planes were focused for image capture and images were taken with a 63× objective with 13x zoom.
Samples were excited with an argon/krypton laser using the 488 nm line and emission was detected in the 515–535 nm range. Images were collected using TCS software (Leica). 10N-nonyl acridine orange was scanned two times and then bleached using 15 scans at 20% laser power. To image the quench of fluorescence intensity after photobleaching, we recorded 30 scans every 0.372 s. Quenching recording in normoxia was performed at 20% O2 and 5% CO2, the chamber was then switched to 1% O2 and 5% CO2 and the quench again recorded after 15 min in hypoxia.
Measurement of redox state of ubiquinone
The ratio of the oxidized and reduced forms of ubiquinone (CoQ) were measured as described47–49. 10 µM CGP-37157 or antimycin A was added 30 min before the experiment and maintained throughout. HUVECs with or without CGP-37157 were subjected to 10 min of hypoxia (1% O2) or normoxia. Antmicyin A was used in normoxic cells as a control. Plates were washed three times with ice-cold PBS and the cells were transferred to ice-cold tubes, which were subsequently centrifuged at 2000 g for 5 min at 4º C. Cell pellets were resuspended in 95 µl of PBS from which 91.5 µl were taken and mixed with 3.5 µl 14.3 µM 2-mercaptoethanol. 5 µl 10 µM coenzyme Q6 were added as internal standard. Then, 330 µl 1-propanol were added, the sample vortexed for 30 s, incubated for 3 min at RT, vortexed again for 20 s and centrifuged at 14,000 g for 5 min. 100 μl of the supernatant was immediately injected into a 166-126 HPLC system (Beckman-Coulter) equipped with an UV/Vis detector (System Gold R 168, Beckman-Coulter) and an electrochemical (Coulochem III ESA) detector. Separation was carried out in a 15 cm Kromasil C18 column (Scharlab, Spain) at 40ºC with a mobile phase of methanol/n-propanol (65:35) containing 1.42 mM lithium perclorate at a flow-rate of 1 ml/min. UV-spectrum was used to identify the different forms of ubiquinone (oxidized CoQ10 with maximum absorption at 275 nm) and ubiquinol (reduced CoQ, CoQ10H2, with maximum absorption at 290 nm) using specific standards. Quantification was carried out with electrochemical detector readings.
Steady-state fluorescence emission anisotropy of TMA-DPH incorporated into lipid vesicles
Mixtures of 1-3 mg of egg phosphatidylcholine (PC; Avanti Polar Lipids Inc., Birmingham, AL, USA) and the fluorescent lipid probe 1-(4(trimetylamonium)-phenyl)-6-diphenyl-1,3,5-hexatriene (TMA-DPH; Sigma-Aldrich), at a lipid/probe molar ratio of 1/100, were dissolved in 200 µL of chloroform:methanol (2:1) and dried under flow of nitrogen for at least 60 min. The resulting dry lipid film was then resuspended in 1.5 mL of MilliQ-degree water and vortexed vigorously for 1 min. This suspension of multilamelar vesicles was then incubated for one hour at 37 ºC. Large unilamelar vesicles were then prepared by extrusion of this lipid dispersion through polycarbonate filters of controlled 100 nm diameter pore size. These vesicles were maintained at 37 ºC for no more than 3 h before being used 50.
The steady-state fluorescence emission anisotropy experiments were carried out on a SLM Aminco 8000C spectrofluorimeter (SLM Aminco, Urbana, IL, USA), as previously described 51. Fluorescence anisotropy (r) of TMA-DPH incorporated into the liposomes described above was recorded at 37 ºC using excitation and emission wavelengths of 356 and 451 nm, respectively.
Measurement of pulmonary artery contraction
Third division branches of the pulmonary arteries (PAs) were isolated from male Wistar rats and mounted in a wire myograph. Contractile responses were recorded as reported 28, 50. The chambers were filled with Krebs buffer containing (in mM) NaCl 118, KCl 4.75, NaHCO3 25, MgSO4 1.2, CaCl2 2.0, KH2PO4 1.2 and glucose 11, maintained at 37 °C and aerated with 21% O2, 5% CO2, 74% N2 gas (pO2 17–19 kPa). After an equilibration period of 30 min, PAs (internal diameter 300–400 µm) were distended to a resting tension corresponding to a transmural pressure of 2.66 kPa. Preparations were initially stimulated by raising the K+ concentration of the buffer (to 80 mM) in exchange for Na+. Vessels were washed three times and allowed to recover. Then, each vessel was exposed to two hypoxic challenges (95% N2, 5% CO2; pO2 = 2.6–3.3 kPa), the second one after 40 min incubation with vehicle (control) or CGP-37157 (30 µM).
Preparation of mouse hippocampal slices
Three-month-old C57BL/6J mice were anesthetized with 1.5% isoflurane in oxygen under spontaneous respiration, then decapitated, and forebrains were rapidly removed from the skull and placed into ice-cold Krebs bicarbonate dissection buffer (pH 7.4), containing (in mM): NaCl 120, KCl 2, CaCl2 0.5, NaHCO3 26, MgSO4 10, KH2PO4 1.18, glucose 11 and sucrose 200. The hippocampi were dissected, and slices (250-µm thick) were prepared using a McIlwain Tissue Chopper. Then, the slices were transferred to vials containing sucrose-free dissection buffer to allow tissue recovery from slicing trauma before experimentation (equilibration period). Both solutions were gassed with 5% CO2 at least 30 minutes before use to ensure pH 7.4. Hippocampal slices were placed into an Invivo2 400 workstation (Ruskinn) set at 1% O2, 5% CO2, 37 ºC, incubated for 30 minutes, disaggregated in PBS and then SMPs were extracted as described. For western blot analysis, slices were incubated for 4 hours and lysed in non-reduced bromophenol-free Laemmli buffer inside the chamber.
Detection of superoxide in hippocampal slices by confocal microscopy
For treatments in hypoxia, all solutions were pre-equilibrated to hypoxic conditions before use; when necessary, 10 µM CGP-37157 or 10 µM antimycin A was added 30 min before the experiment and maintained during the remainder of the procedure. Hippocampal slices were placed into an Invivo2 400 workstation (Ruskinn) set at 1% O2, 5% CO2, 37 ºC, and incubated for 30 min in fresh medium, washed three times with HBSS+Ca/Mg and incubated with 5 µM DHE for 10 min in the dark. After incubation, excess probe was removed by three washes in HBSS+Ca/Mg, slices were fixed with 4% paraformaldehyde, and incubated in the dark at 4ºC for 15 min. After fixation, wells were again washed three times with HBSS+Ca/Mg and the slices placed on slides with coverslips on top. For normoxic treatments, medium was changed for fresh normoxic medium, and treated as above but in a standard cell incubator. Images of CA1 region of hippocampal slices were taken with a Leica SP-5 confocal microscope with a 40× objective. Samples were excited with an argon/krypton laser using the 488 nm line for hydroxyethidium (OH-Eth) and 496 nm line for ethidium (Eth). Fluorescence emission of OH-Eth was detected at 560–570 nm and Eth at 570–600 nm following previously-reported methods52. Three-dimensional image stacks were processed using ImageJ software. For each stack, the background was substracted from the fluorescence intensity of the CA1 region, and two hippocampal slices were averaged in each independent experiment.
In vivo photothrombotic stroke
Three-month-old male C57BL/6J mice (30–35 g) were anesthetized with 1.5% isoflurane in oxygen under spontaneous respiration. Mice were then placed in a stereotaxic frame (David Kopf Instruments, Tujunga, CA, USA) and physiological temperature (37 ± 0.5 ºC) was maintained by a servo-controlled rectal probe heating pad (Cibertec, Madrid, Spain). A small incision in the midline was made and, after removal of the periosteum, bregma and lambda points were identified. A cold light (Zeiss KL 1500 LCD, Jena, Germany) was centred using a micromanipulator at 0.2 mm posterior and 1.5 mm lateral to bregma on the right side using a fibre optic bundle of 2 mm in diameter. One milligram of the photosensitive dye Rose Bengal (Sigma Aldrich, St. Louis, MO, USA) dissolved in sterile saline (0.1 mL) was injected intraperitoneally and 5 min later the brains were illuminated during 20 min. After completion of the surgical procedures, the incision was sutured and the mice were allowed to recover for 24 hours. Animals were randomly distributed into 2 groups53: control (treated with vehicle) and CGP-37157 30 mg/kg. CGP-37157 was dissolved in Tween 80 and diluted with 5× volume of NaCl 0.9% and was administered intraperitoneally 5 min after photothrombotic stroke induction.
Twenty-four-hours after stroke induction, mice were anesthetized and sacrificed by decapitation and brains were quickly removed. Then, coronal sections of 1-mm-thickness were cut and slices were incubated in a 2% solution of triphenyltetrazolium chloride and then fixed in a buffered formalin solution. Infarcted tissue was defined by the unstained area and the morphometric determination of cortical infarct volume was calculated by the use of an unbiased stereological estimator of volume based on Cavalieri’s principle54.
Statistics
Data are presented as mean ± SEM. Normality and homoscedasticity tests were carried out before applying parametric tests. For comparison of multiple groups, we performed one-way analysis of variance (ANOVA) followed by Tukey’s or Bonferroni’s tests for all the groups of the experiment. For comparison of two groups, we used Student’s two-tailed t-test; when the data did not pass the normality test, we used a non-parametric t-test (Mann-Whitney U test). Variations were considered significant when the p value was less than 0.05. Statistical analysis was performed with SigmaPlot 11.0 software.
Author contributions
P.H.A. and A.M.R. conceived the idea. P.H.A., J.A.E. and A.M.R. designed the study. P.H.A. performed the bulk of the experiments and analysed the data. E.R. and T.O. performed blinded replicates of several experiments. E.N., E.P., J.E., I.B., M.G.L., P.H.A and E.R. performed experiments with neuronal tissue and the in vivo stroke model. L.M. and A.C. carried out PA contractility experiments. A.M.P. performed fluidity experiments in liposomes. P.H.A., A.C.R., J.C.R.A. and P.N. analysed the redox state of ubiquinone. P.H.A., R.A.P. and J.A.E. analysed mitochondrial complex and supercomplex activities. D.C.G., T.V.P., A.I.A. and D.T. helped with crucial experimental procedures. M.P.M. proposed and supervised experiments measuring H2O2 in mitochondria. A.B., J.A.E. and A.M.R. supervised the study and P.H.A., J.A.E. and A.M.R. wrote the manuscript.
The authors declare no competing financial interest.

a, Assessment of NCLX interference in BAECs by Western blot. b-c, Effect of NCLX inhibition or interference on BAECs mitochondrial function. b, Mitochondrial membrane potential assessed by live cell fluorescence microscopy, n=3. c Oxygen consumption rate (OCR), n=3 (upper panel), n=4 (lower panel). d-e, Effect of interference of subunits of CI (NDUFS4) or CIII (RISP) in BAECs. d, Assessment of interference by Western blot. e, Cytosolic Ca2+ or Na+ measured by live cell confocal microscopy in normoxia or acute hypoxia (1% O2), n=3 (Ca2+), n=4 (Na+). f-g, Effect of OXPHOS inhibitors on ytosolic Ca2+ (f, n=3) or Na+ (g, n=4) measured by live cell confocal microscopy in BAECs normoxia or acute hypoxia (1% O2). Two-tailed Student’s t-test. n.s. not significant, * p<0.05, **<p0.01.
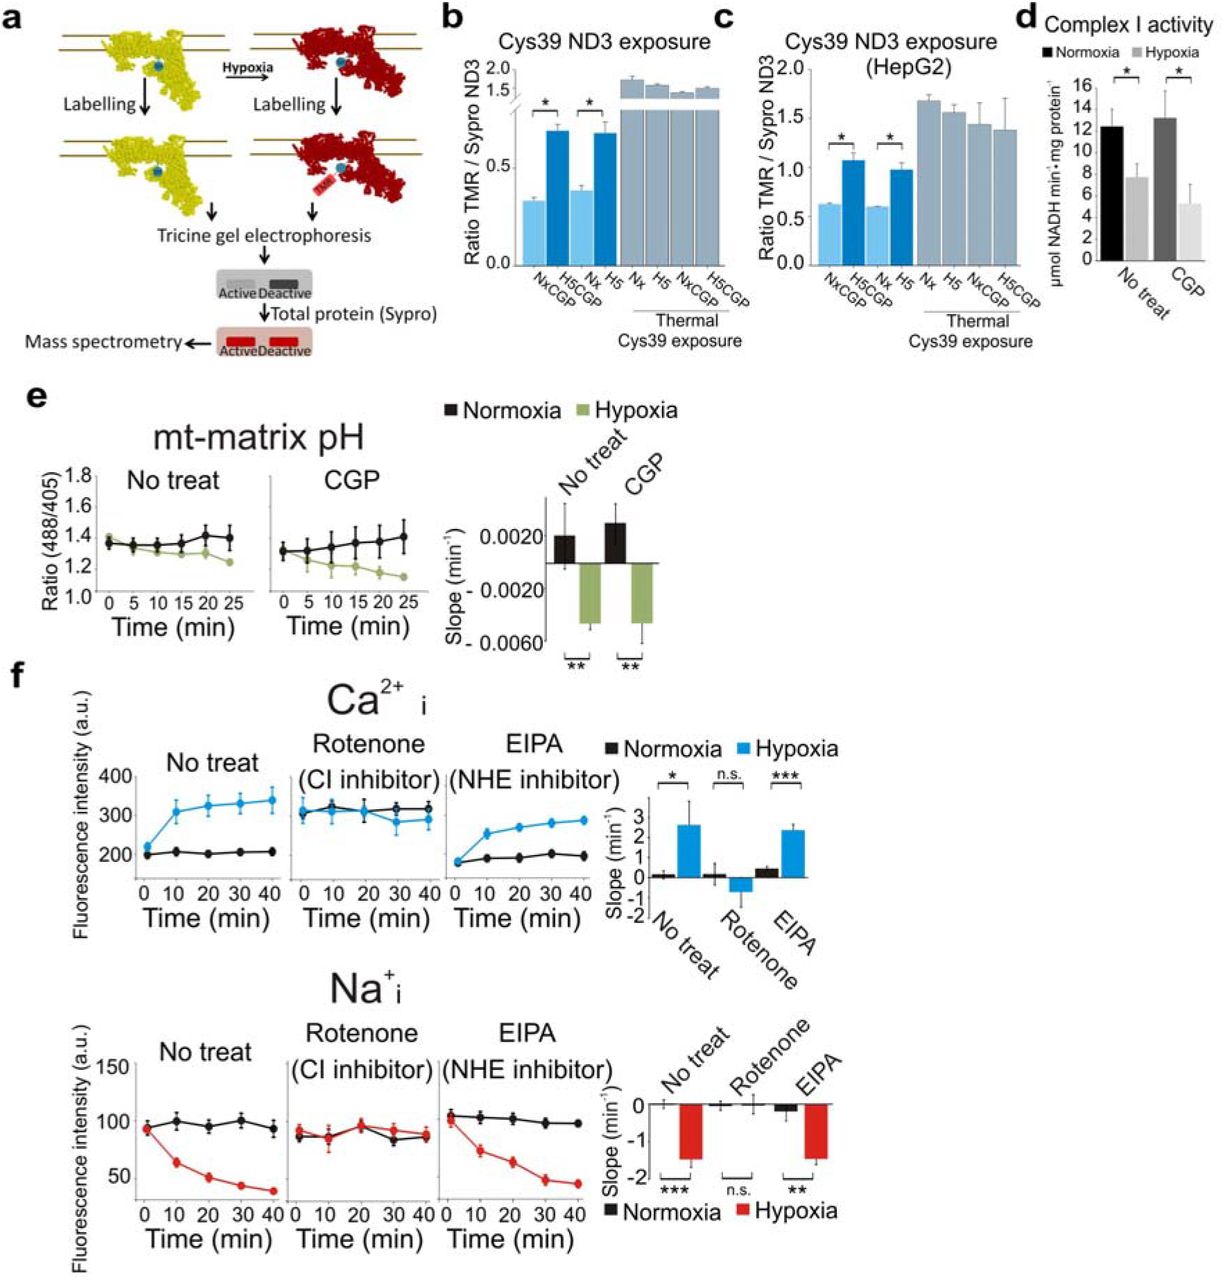
a-c, ND3·Cys39 exposure, which reflects the D state of CI, measured as the ratio between TMR signal (Cys39 labelling) and Sypro Ruby staining (total protein for the ND3 band, identified by mass spectrometry10). Thermal deactivation is used as a positive control of CI D state. BAECs (b, n=6) or HepG2 (c, n=3) exposed to normoxia (Nx), 5 min of hypoxia (1% O2, H5), normoxia with CGP (NxCGP), 5 min of hypoxia with CGP (H5CGP. d, Complex I activity measured in the presence of Mg2+ in isolated mitochondrial membranes from BAECs subjected to normoxia, 10 min of hypoxia (1% O2) and NCLX inhibition with CGP-37157 (n=4). e, Mitochondrial matrix acidification induced by acute hypoxia (1% O2)10 is not affected by NCLX inhibition in BAECs transfected with mitosypHer, n=4. f-g, Effect of CI or mitochondrial NHE inhibitors on cytosolic Ca2+ (f) or cytosolic Na+ (g) measured by live confocal microscopy in BAECs in normoxia or acute hypoxia (1% O2), n=3. Two-tailed Student’s t-test for pairwise comparisons and one-way ANOVA with Tukey’s test for multiple comparisons. n.s. not significant, * p<0.05, **<p0.01, *** p<0.001.

a-d, Effect of NCLX activation by NaCl addition on BAECs. a-b, Cytosolic Ca2+ (a) or Na+ (b) measured by fluorescence microscopy in BAECs after 20 min of treatment, n=6. c, Mitochondrial Na+ measured by SBFI. d, Complete OCR plot of Fig. 3e. e, Effect of NaCl and/or CaCl2 additions on H2O2 production by isolated rat heart mitochondria (500 µg) respiring after addition of glutamate/malate (GM) in KCl-EGTA buffer. Representative trace of five independent experiments. f-g, Effect of NCLX activation on glutamate/malate- (f) or TMPD-based (g) OCR in isolated coupled mitochondria from BAECs, n=5. h-k, Effect or CaCl2 or NaCl addition in isolated mitochondrial membranes from BAECs. h-i, Succinate-cytochrome c activity after addition of 100 µM CaCl2, (h, n=5) or of increasing NaCl concentrations (i, n=6). j, Succinate dehydrogenase activity after addition of 10 mM NaCl, n=4. k, Ubiquinone 2-cytochrome c activity after addition of 10 mM NaCl, n=4. l, FRAP of BAECs expressing MitoDsRed targeted to the mitochondrial inner membrane. Left panel, slopes of cells treated with extra 100 mM NaCl, n=3. Right panels, traces of the left panel and of Fig 3m. m, Acridine orange signal quench traces of Fig. 3n, n=5. n, Acridine orange signal quench traces of Fig. 3o, n=4. Two-tailed Student’s t-test for pairwise comparisons and one-way ANOVA with Tukey’s test for multiple comparisons. n.s. not significant, * p<0.05, **<p0.01, *** p<0.001.

a-d, Effect of NCLX silencing or inhibition on hypoxic pulmonary vasoconstriction (HPV). a, Effectiveness of NCLX silencing in mice pulmonary artery smooth muscle cells (PASMCs), n=3. b, Superoxide detection by fluorescence microscopy in PASMCs after incubation with DHE in 10-min time windows in normoxia (Nx) or hypoxia (1% O2), n=4. c–d, Representative traces (c) and average values (d) of HPV measured in rat pulmonary arteries. Each artery was exposed twice to hypoxia, and the second hypoxic challenge was performed in the absence or the presence of 30 M CGP-37157, n=7−9. e-g, Effect of NCLX silencing or inhibition on induction of the HIF pathway in endothelial cells. e-f, HIF-1α stabilization measured by Western blotting in endothelial cells exposed for 4 h to normoxia (Nx), hypoxia (1% O2, Hp) or 1 mM DMOG, n=4. g, Quantitative RT-PCR analysis of Glut1, BNIP3, PDK1, HIF-1α and HIF-2α mRNAs in HUVECs exposed to 6 hours of normoxia (Nx), hypoxia (1% O2, Hp) or 1 mM DMOG, n=4; mean SEM of the β-actin ratio relative to normoxia). Two-tailed Student’s t-test for pairwise comparisons and one-way ANOVA with Tukey’s test for multiple comparisons n.s. not significant, * p<0.05, **<p0.01, *** p<0.001.
Sequence of primers for PCR analysis.
Acknowledgments
We thank Alejandra Alfuzzi for collaboration in microscopy analysis, Prof. Michael P. Murphy (MRC Mitochondrial Biology Unit, Cambridge, UK) for suggesting experiments and critical discussion, Dr. Mariusz Kowalewski (Institute of Veterinary Anatomy, UZH) for allowing us the use of the microscope for live cell imaging, Dr. María Cano and Prof. Antonio G. García (IIS-IP and UAM), Dr. Carlos Rueda and Prof. Jorgina Satrústegui (CMBSO, UAM-CSIC), Dr. Ilka Wittig (Goethe Universität), Dr. José Miguel Mancheño (IQFR, CSIC) and Dr. Alberto Pascual and Prof. José López-Barneo (IBIS, US-CSIC) for helpful discussions, and Dr. Luis del Peso (UAM) and Prof. Francisco Sánchez-Madrid (IIS-IP and UAM) for their support. This research has been financed by Spanish Government grants (partially funded by the European Union FEDER/ERDF) CSD2007-00020 (RosasNet, Consolider-Ingenio 2010 programme to A.M.-R. and J.A.E.), CP07/00143, PS09/00101, PI12/00875 and PI15/00107 (to A.M.-R), CP12/03304 and PI15/01100 (to L.M.), SAF2014-55399 (to A.C.), SAF2015-65633-R (to J.A.E), and SAF2013-32223 (to M.G.L.), by the European Union (ITN GA317433 to J.A.E. and MC-CIG GA304217 to R.A.P.), by a grant from the Fundación Domingo Martínez (to M.G.L. and A.M.R.), by a grant from the Fundación BBVA (to R.A.P.), by Swiss National Science Foundation (SNF) grant 310030_124970/1 to A.B, by a travel grant from the Instituto de Investigación Sanitaria Princesa (to P.H.-A.) and by the COST actions TD0901 (HypoxiaNet) and BM1203 (EU-ROS). CNIC sis supported by the Pro-CNIC Foundation and is a Severo Ochoa Center of Excellence (Ministerio de Economía y Competitividad award SEV-2015-0505). P.H.- A. and I.B. were recipients of predoctoral FPU fellowships from the Spanish Government, E.N. is recipient of a predoctoral FPI fellowship from the Universidad Autónoma de Madrid (UAM), and A.M.-R., L.M. and J.E. are supported by the I3SNS or “Miguel Servet” programmes (ISCIII, Spanish Government; partially funded by FEDER/ERDF).
References
Methods references


