

Abstract
The open-source de-novo Protein-Level ASSembler Plass (https://plass.mmseqs.org) assembles six-frame-translated sequencing reads into protein sequences. It recovers 2 to 10 times more protein sequences from complex metagenomes and can assemble huge datasets. We assembled two redundancy-filtered reference protein catalogs, 2 billion sequences from 640 soil samples (SRC) and 292 million sequences from 775 marine eukaryotic metatranscriptomes (MERC), the largest free collections of protein sequences.
A major limitation of metagenomic studies is that often a large fraction of short reads (80% – 90% in soil [1]) cannot be assembled into contiguous sequences (contigs) long enough to allow for the prediction of gene and protein sequences. Because low-abundance genomes are difficult to assemble, the unassembled reads contain a disproportionately large part of the genetic diversity and probably an even greater share of biological novelty, which is mostly lost for subsequent analyses.
To decrease this loss and be less dependent on reference genomes, gene-centric approaches have been developed. Assemblies of hundreds of samples from one environment are pooled, genes in the contigs are predicted and clustered at ~95% identity into gene catalogs [2-5]. Gene abundances in each sample are found by mapping reads to the reference gene clusters. In this way, the functional and taxonomic composition of metagenomic samples and their dependence on environmental parameters can be studied. Also, genome-based analyses are enabled by abundance binning, which finds sets of catalog genes with correlated abundances across many samples and hence likely to belong to the same genome [6, 7].
State-of-the-art assemblers for metagenomic short reads 10] find contigs as paths through a de-Bruijn graph. This graph has a node for each k-mer word in the reads and edges between k-mers occurring consecutively in a read. On metagenomic data, de-Bruijn assemblers suffer from a limited sensitivity-selectivity trade-off: k-mers have to be long and specific to avoid the graph exploding with false edges. But long k-mers lack sensitivity when intra-population diversities are high and overlapping reads often contain mismatches due to single nucleotide polymorphisms (SNPs). Whatever k is chosen, k-mers will be too short to be specific enough in genomic regions conserved between species and too long to be sensitive enough in regions of high intra-population diversity. This dilemma leads to short, fragmented assemblies.
Most SNPs in microbial populations lead to no change or conservative substitutions in the encoded protein sequences (Supplementary Fig. 1). ORFome [11] and SFA-SPA [12] therefore proposed to assemble protein instead of nucleotide sequences. But they are too slow to run on large metagenomes and as de-Bruijn assemblers they suffer from the same limited specificity-sensitivity trade-off.
In addition to avoiding mismatches, assembling protein sequences also circumvents the major issue in genome assembly, sequence repeats, because proteins have much fewer and shorter repeats. Furthermore, chimeric assemblies between very similar protein sequences (say ≥ 97% sequence identity) are unproblematic as they do not lead to false conclusions about which genes occur together in a genome. (This has to be solved separately, for example using abundance binning [6, 7].) Therefore, protein-level assembly also increases coverage by assembling sequences that cannot be assembled on the nucleotide level due to the risk of chimeric assemblies.
Plass exploits these advantages to greatly simplify the assembly process. It uses a novel graph-free, greedy iterative assembly strategy (Fig. 1) that, together with its linear-time all-versus-all overlap computation (steps 2-4) [13], scales linearly in runtime and memory. This makes the overlap-based assembly of huge read sets on a single server possible. Most importantly, by computing full alignment overlaps instead of relying only on short k-mers, Plass overcomes the limitation in specificity-sensitivity trade-off of de-Bruijn assemblers, allowing it to recover several times more proteins sequences from complex metagenomic samples.
Plass needs to keep the protein sequences in main memory to avoid random disk access (step 4). It therefore needs 1 byte of main memory for every amino acid translated from the input reads, or ~500 GB RAM to assemble 2-3 billion 2 × 150 bp reads. In comparison, memory requirements and runtimes of overlap graph assemblers scale superlinearly with the number of reads. Plass therefore combines the high specificity-sensitivity of overlap graph assemblers with the linear runtime and memory scaling of de-Bruijn graph assemblers.
Due to our greedy assembly approach, the most critical aspect to analyze is what fraction of the sequences are wrongly assembled (precision). To challenge Plass, we sought a dataset containing many related genomes, as this increases the risk of chimeric assemblies [14]. We downloaded 96 genomes sequenced from single cells of Prochlorococcus [15] taken from a single sample of seawater. These cyanobacteria are known for their high intra-species genetic diversity. As ground truth reference we predicted protein sequences on the genomes using Prodigal [16]. We simulated 2 × 150 bp paired-end reads with an expected coverage of 1 for each genome, resulting in 392 790 paired-end reads.

(1) Merge overlapping read pairs and translate all potential ORFs with ≥ 45 codons into protein sequences. (2) For each of these N sequences, select the m Aimers with the lowest hash values (default: m = 60, k = 14, reduced alphabet size = 13) and write them into an array together with sequence identifiers. (3) Sort the mN array records by k-mers to find for each k-mer the sequences containing it. For each of these sets, assign the longest sequence as its center. (4) Resort the array by center sequence into groups and gaplessly align the center sequence to each group member (< mN alignments). Remove sequences with insufficient E-value (default: > 10−5) from the group. (5) Iteratively extend each center sequence by the remaining group members with highest sequence identity (default: ≥ 90%) until all group members have been processed. (6) Iterate steps 2 to 5 (default: 12 times). (7) Remove sequences translated in the wrong frame using a neural network.
We assembled protein sequences from these nucleotide reads using Plass and SFA-SPA [12]. We assembled nucleotide contigs with three widely used nucleotide assemblers, Megahit [9], metaSPAdes [10], and Velvet [8], the first two of which had performed strongly in recent benchmark evaluations [14, 17]. We predicted protein sequences in their contigs using Prodigal and removed protein sequences with less than 100 residues.
The assembly precision is the fraction of assembled amino acids that have at least X% sequence identity with an assembled sequence. It is similar up to X% = 97% for all assemblers except SFA-SPA (Fig. 2a, top). This demonstrates that the greedy extension approach produces assemblies with sequence identities to the reference protein sequences much higher than the 90% identity required by Plass to extend overlapping sequences.

(a) Precision and sensitivity of protein sequences assembled from synthetic reads sampled from 96 single-cell genomes of Prochlorococcus. For the three nucleotide assemblers we predicted protein sequences on their assembled contigs with Prodigal [16]. Top: Precision is the fraction of assembled amino acids that is matched to a reference protein at the minimum sequence identity on the x-axis. Bottom: Sensitivity is the fraction of reference sequence amino acids that is matched to an assembled protein sequence at the minimum sequence identity on the x-axis. (b-e) Total number of amino acids in redundancy-filtered sets of protein sequences assembled by Plass (red traces) compared to the total number of amino acids of redundancy-filtered protein sequences predicted by Prodigal on contigs assembled by Megahit (b,d,e: blue) or on contigs in the eukaryotic metatranscriptomes reference assembly (c: green) [18]. Top half: dependence on the minimum protein sequence length for a redundancy-filtering with maximum pairwise sequence identity of 80%. Bottom half: dependence on the strength of redundancy filtering for a minimum sequence length of 200 amino acids. Black traces: fold increase in total assembly length by Plass versus the state of the art.
The 2% of missing precision at X% = 90% are mainly caused by mispredicting open reading frames (ORFs) on the read or the single-cell genomes. The nucleotide assemblers are at an advantage here, since the reference proteins are predicted with Prodigal, the same tool with which proteins are predicted on their contigs, whereas Plass uses a very different approach (Online Methods).
Sensitivity is the fraction of amino acids in the reference proteins that have at least X% sequence identity with an assembled sequence. To avoid giving too much weight to highly conserved proteins, we redundancy-filtered the reference proteins using Linclust [13] with 95% sequence identity. The sensitivity is similar for the three nucleotide assemblers, whereas Plass assembles 13% to 56% more residues correctly than the next best tool, metaSPAdes (Fig. 2a, bottom).
On real metagenomic datasets, no ground-truth set of reference sequences exists. Therefore precision can not be measured, but sensitivity in terms of the total number of assembled amino acids can be compared. We used four representative test sets: a single 11.3 Gbp sample from the human gut [19], 775 samples with 15Tbp of eukaryotic metatranscrip-tome reads from TARA [18], a 31 Gbp sample from Hopland grass soil (Brodie et al., unpublished) and 538 Gbp of reads in 12 samples from the same project to test the benefits of cross-assembly (Fig. 2b-e). All datasets contain 2 × 150 bp overlapping paired-end sequences, except the metatranscriptomics sample, which has 2 × 10² bp reads.
We compared the Marine Eukaryotic Reference Catalog (MERC) assembled by Plass to the Marine Atlas of Tara Oceans Unigenes (MATOU) [18] assembled by Velvet. The gut and soil datasets could not be assembled with Velvet and metaSPAdes due to insufficient memory (Online Methods). We could therefore only compare Plass to Megahit. However, Megahit achieved better results than metaSPAdes in a recent benchmark study [17] and was the best assembler tested in CAMI [14]. The twelve Hopland soil datasets with 1.5 billion reads could be cross-assembled in one go by Plass. Megahit raised an out of memory exception, therefore we assembled each sample separately and pooled the contigs. For human gut, Hopland soil, and the soil cross assembly, Plass took 4h 20min, 6h 20min and 360h respectively. Megahit took similar times, 3h, 21h 30min and 200h respectively.
On the gut sample, Plass assembled 32% more amino acids than Megahit/Prodigal at a length cut-off of 200 amino acids (Fig. 2b-e, top). The marine eukaryotic reference catalog (MERC) assembled by Plass is 2.8-fold larger than MATOU assembled by Velvet, and on the Hopland soil data Plass assembled 2.7 times more than Megahit. In the soil cross assembly, Plass cross-assembled 10 times more amino acids than the pooled assembly of Megahit. The increase of the ratio with sequence length in the top of Fig. 2d,e indicates that the sequences assembled by Plass are significantly longer than those of Megahit/Prodigal. These gains in recovered protein sequences are similar at all levels of redundancy up to 80% sequence identity (bottom half of Fig. 2b-e).
We wanted to know how strongly the improved sensitivity of Plass affects the apparent taxonomic composition. We therefore implemented the 2bLCA protocol (Supplementary Fig. 2) [20] to map each read via its translated ORF to an assembled protein sequence and each protein sequence to a node in the taxonomic tree. By transitivity this maps reads to taxonomic nodes. The absolute number of reads mapped to various taxonomic nodes (Supplementary Fig. 3a) is around twice higher for Plass than for Megahit/Prodigal. Remarkably, the distribution over taxa can deviate quite substantially between the assembly methods (Supplementary Fig. 3b), which could be caused be a systematic dependence of the assembly sensitivity on genomic coverage (Supplementary Fig. 3c).
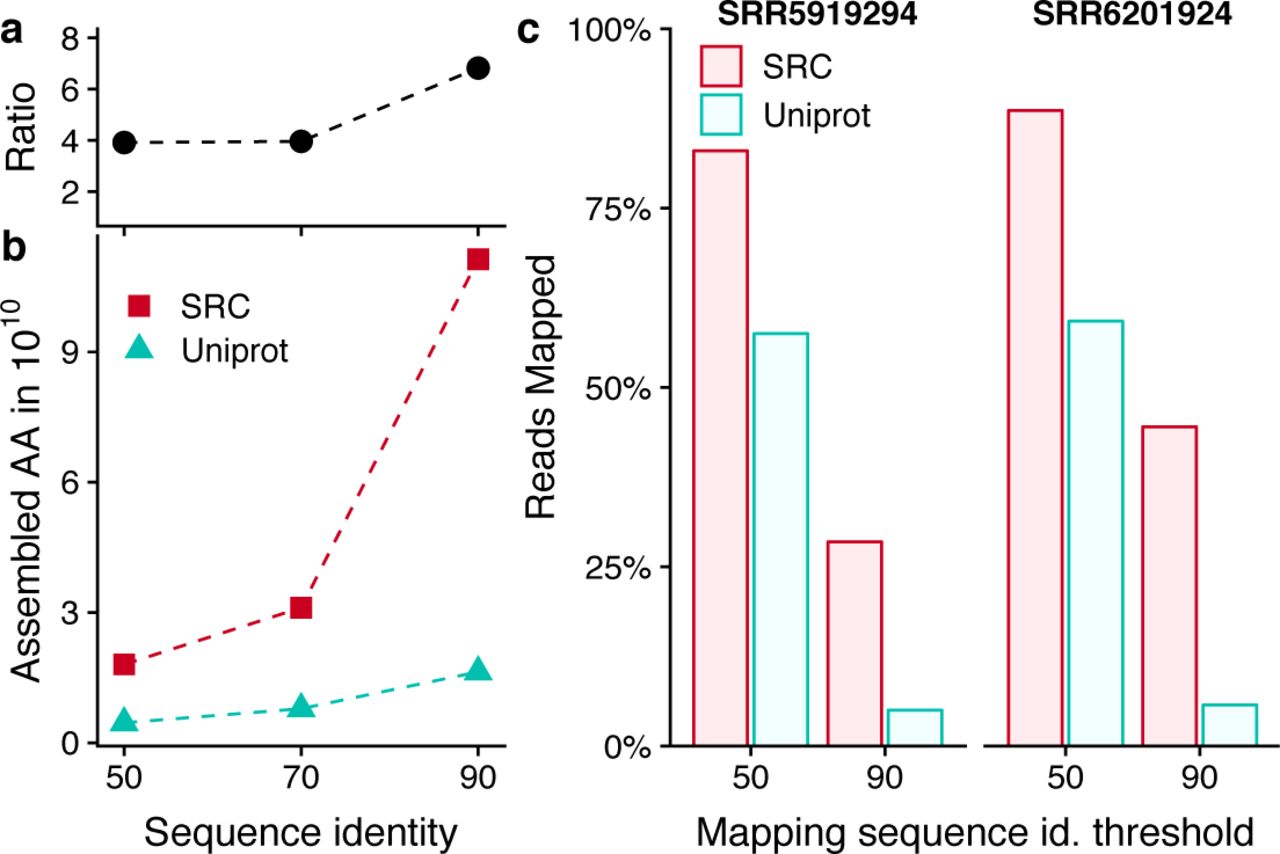
(a,b) Numbers of amino acids in SRC (red) and Uniprot (turquoise) and their ratio (black) after redundancy-filtering with a maximum pairwise protein sequence identity of 50%, 70% and 90%. (c) Fractions of 100 000 reads sampled from two soil metagenomes (not included in the SRC) that could be mapped with 90% and 50% minimum sequence identity to a sequence in the SRC or in Uniprot.
Plass is well suited to large-scale applications. We assembled a Soil Reference protein Catalog (SRC) from 18 Tbp of reads from all 640 soil samples from the EBI short read archive that were sequenced between 01/2016 and 02/2018 using Illumina HiSeq or NovaSeq sequencers with 2 × 150 bp paired-end reads. Each sample was assembled on a server with 2 × 8 cores and 128 GB memory, resulting in 12 billion protein sequences after a total runtime of about six weeks on 25 servers. We clustered the sequences to 90% sequence identity at 90% minimum coverage using Linclust [13], resulting in 2 billion sequences with an average length of 163 amino acid residues. Among those, at least 52.3 million sequences are complete, meaning that Plass found the earliest possible start codon and the stop codon (Online Methods). This dataset contains 6.8, 4.0 and 3.9 times more amino acids than the Uniprot database after redundancy-filtering both at 90%, 70% and 50%, respectively (Fig. 3a).
To assess the degree to which the SRC represents the diversity of soil metagenomes, we selected two soil samples not used for building the SRC, randomly sampled and merged 10000 overlapping 2 × 150 bp read pairs, predicted protein sequences with Prodigal, and searched these using the map workflow of MMseqs2 [21] through the 90%-redundancy-filtered versions of the SRC and the Uniprot. Fig. 3b,c shows the fraction of reads that obtained matches with at least 50% and 90% sequence identity. At 50% threshold, 82.5% and 89.5% of the soil reads matched to the SRC in the two samples, while only 62% and 64% matched to the Uniprot.
We are currently extending Plass to a hybrid assembly approach for viral genomes that generates nucleotide gene assemblies guided by Plass protein assembly and that assembles the resulting nucleotide contigs using long-read assemblers.
In conclusion, Plass is well-suited for very large-scale metagenomic applications, for example to generate reference protein sequence catalogs for every major type of environment. In addition to facilitating soil metagenomics, these catalogs can be mined for proteins of interest to biotechnology or pharmacology. They will also improve homology detection, protein function annotation and protein structure prediction [22] by enriching multiple sequence alignments with diverse homologs.
Methods
Methods, including statements of data availability and references, are available in the online version of the paper.
Author Contributions
MS & JS designed research, MS & MM developed code and performed analyses, MS, MM & JS wrote the manuscript.
Competing Financial Interest
The authors declare no competing financial interests.
Online Methods
Plass proceeds in seven steps summarized in Fig. 1.
Merging paired-end reads and ORF calling. Longer reads increase the precision and sensitivity of the assembly due to longer overlaps obtaining higher statistical significance. In step 1, Plass therefore merges overlapping paired-end reads into longer sequences using code from the open-source FLASH tool [23], which we integrated into Plass (step 1a).
Furthermore, in step 1, Plass extracts all open reading frames (ORFs) with at least 45 codons and translates them into protein sequences. To determine the correct start codon later on, it also extract and translates all ORFs with at least 20 codons starting with a putative ATG start codon that is the first ATG codon after a stop codon in the same frame. Because the coding sequence cannot start before such an ATG, these sequences help Plass to predict start codons later on (see “Predicting start codons” and Supplementary Fig. 4).
Finding overlaps in linear time. The identification of all overlapping alignments (Fig. 1, steps 2-4) is critical for the performance of overlap assemblers. Previously proposed protein-level assemblers have a runtime complexity that scales quadratically with the input set size [24, 25]. A typical metagenomic read set with 100 million reads requires 1016 comparisons with a quadratic method. To speed up the computation, we adapted our linear-time clustering algorithm Linclust [26] for assembly.
In step 2, Plass transforms each protein sequence into a reduced amino acid alphabet, whose 13 letters represent the following groups of amino acids: (L, M), (I, V), (K, R), (E, Q), (A, S, T), (N, D), and (F, Y). From each reduced sequence it selects m (default: m - 60) k-mers (or l – k + 1 if the sequence of length l contains only l – k + 1 < m k-mers). The selected k-mers are those with lowest hash values. Our rolling hash function [26] maps each k-mer onto a range of [0,216] such that even single residue changes result in quasirandom, unrelated hash values. For each of the ~ mN selected k-mers, Plass stores in an array the k-mer index (8 bytes), the sequence identifier (4 bytes), the k-mer position in the sequence (2 bytes) and the length of the sequence (2 bytes).
In step 3, Plass sorts the array by k-mer index and sequence length to find the sets of sequences containing the same k-mer. For each set, it picks the longest sequence as the center sequence. For each member of the k-mer set, it overwrites the k-mer index with the center sequence identifier and computes the diagonal i – j on which the shared k-mer match occurs, where i is the k-mer position in the center sequence and j is the position in the member sequence. The array now contains the center sequence identifier, the member sequence identifier, the k-mer match diagonal, and the length of the member sequence. It sorts the array again, this time by center sequence identifiers, and removes duplicate center-member pairs. If more than one diagonal match between a center and member sequence is found only the match with lowest diagonal is kept.
In step 4, Plass computes an ungapped local alignment between each center sequence and each group member, using one-dimensional dynamic programming on the diagonal i – j of the k-mer match. It computes E-values using ALP [27] and, by default, the Blosum62 substitution matrix. Alignments with an E-value > 10−5 (default) and a sequence identity < 90% (default) are rejected.
Extending protein reads. In step 5, Plass extends the center sequence by concatenating the non-overlapping residues of the member sequence with highest similarity in the overlap. More precisely, it processes the list of alignments with the member sequences in order of descending overlap sequence identity, until one side of the center sequence has been extended and the other side has either been extended as well or has no extending alignments left in the list. Then it realigns the extended center sequence with all yet unprocessed member sequences and iterates the extension until the entire list of alignments has been processed.
Iterative assembly. Plass iterates through steps 2 to 5 twelve times (default), each time updating the original version of the center sequences with their extended versions and keeping all other sequences unchanged (step 6).
Removing proteins translated in wrong frames. In step 7, Plass removes sequences translated from wrong ORFs or assembled from such wrongly translated sequences. ORFs translated in the wrong frame contain a stop-codon approximately every 64/3 ≈ 21 residues, and therefore only a fraction ~ exp(−45/21.3) ≈ 12% of them will contain at least 45 codons.
Plass filters out sequences translated from wrong ORFs based on their amino acid and dipeptide composition, which differs from correctly translated, real protein sequences. We trained a neural network using as features the 20 length-normalized amino acid frequencies of the sequence and the 62 length-normalized dipeptide frequencies in a reduced alphabet of size 6. Our fully connected network has 56 input nodes, a hidden layer of 96 nodes, and a single output node. We trained the network using the Keras deep-learning framework using the Adam optimizer with a 10% drop-out probability and the binary cross-entropy loss function. We leave 10% of the data out for cross validation. The network is integrated into Plass using Kerasify.
To train the network we created a positive set of known coding sequences and a negative set of sequences translated in a wrong reading frame. The positive set contained 2.4 million coding proteins sampled from the prokaryotic subset of the Uniclust30 representative sequences [28]. For the negative set, we extract all ORFs from 757 prokaryotic genomes contained in the KEGG database [29]. We clustered these sequences using MMseqs2 [30] with a maximum sequence identity of 30% and a minimum coverage of 80%. Clusters with no members having coding sequence annotations in KEGG or homology to entries in the Uniclust30 database (requiring an E-value of < 10−3) were extracted. From these, we sampled 2.4 million sequences.
Predicting start codons. To determine the correct start codon and minimize overextension at the N-terminus in the ORF translation step 1, Plass marks with a prepended asterisk * those methionine residues that represent the first ATG after a stop codon in the same frame, as this implies that the coding sequence can at the earliest start there (Supplementary Fig. 4).
After the alignment and extension step 4 in the first iteration, Plass reconstructs the multiple sequence alignment of all merged sequences. Wherever at least 20% of all methionines in one column are marked by a prepended asterisk, it removes the preceding residues from all other sequences and prepends an asterisk to all sequences to mark the start. If multiple columns fulfill the 20% criterion, it trims the sequences at the most downstream of these columns. The start codon prediction is only done in the first iteration to save time and disk space.
Suppressing repetitive sequences. Protein repeats can lead to unwanted extensions during assembly. We therefore detect sequences with repeat regions during step 2 as those containing at least 8 (default) identical k-mers (in the 13-letter alphabet). These sequences are ignored during all steps.
Memory-efficient processing of huge input sets. Plass needs 1 byte per residue of translated protein sequence generated in step 1 to keep these sequences in memory and avoid random disk accesses in the alignment step 4. But as we saw, the k-mer array in steps 2 and 3 occupies m × 16 bytes = 720 bytes of memory per sequence, which is around 16 times more than 1 byte per residue. We removed this bottleneck, for systems with insufficient main memory, by splitting the k-mer array into a number of chunks and processing them sequentially, with little loss in speed.
We compute the maximum number of chunks S that still allows one chunk to fit into the available system memory M as S = ┌mN × 16 byte/M┐. For each chunk c out of S, we proceed with steps 2 and 3 exactly as described before except that we only extract k-mers whose index R satisfies (R mod S) = c and that we store the chunks of k-mer arrays on hard disk. After all splits have been computed, we merge them into a single k-mer array.
Assembly quality benchmark. We could not use the standard benchmark developed by the Critical Assessment of Metagenomic Interpretation (CAMI) [31], because their mutation model does not take selective pressure on the amino acid level into account but rather distributes point mutations randomly in the genome. The synthetic reads generated with such a model are certainly realistic enough to test nucleotide assemblers but would turn the asset of protein-level assembly into a liability.
We sought to construct a genomic benchmarking set that would contain a high degree of natural variation, in which the genomic sequences reflect the actual evolutionary pressures on them. We therefore downloaded a set of 96 single-cell Prochlorococcus genomes from the sequence read archive (SRA) at the NCBI/NIH [32]. These cells were taken from the same ocean water sample and represent a population of the cyanobacteria Prochlorococcus, the most abundant marine photosynthetic organism on earth noted for high intra-species diversities. Sequence identities of 16S rRNA ITS sequences in a matched sample are between 50% and 100%. As ground truth reference we predicted protein sequences on the genomes using Prodigal [33] and removed sequences shorter than 100 residues, resulting in a redundant reference set of 109 014 protein sequences. We reduced the redundancy by clustering with Linclust at 95% sequence identity and 99% minimum coverage of the shorter sequence (options --cov-mode 1 -c 0.99 --min-seq-id 0.95), resulting in the non-redundant reference set with 14 943 sequences.
We created a synthetic read data set from the genomes using randomreads.sh from the BBmap software suite with options paired snprate=0.005 adderrors coverage=1 len=150 mininsert=150 maxinsert=350 gaussian=true to simulate sequencing errors.
We then assembled the synthetic paired-end read data set with Megahit, metaSPAdes, Plass, SFA-SPA and Velvet, using the default parameters of each tool. For the nucleotide assemblers, we called proteins from the assembled contigs using Prodigal in metagenomics mode. We ignored all proteins shorter than 100 residues.
We calculated the precision by searching with the assembled proteins through the redundant reference set, using MMseqs2 with options -a -s 5 --max-seqs 5000 --min-seq-id 0.89. We filtered the aligned set by minimum sequence identity thresholds between 90% and 99%. For each search result, we only considered the longest alignment that fulfills the minimum sequence identity criterion. We computed the precision for each sequence identity threshold as the ratio of the total count of aligned residues divided by the total length of the assembled proteins. 100% precision is reached when all assembled protein residues can be aligned to a reference protein sequence.
We calculated the sensitivity by searching with the non-redundant reference set through the assembled proteins, using MMseqs2 with options -a -s 5 --max-seqs 500000 --min-seq-id 0.89. We filtered the aligned set by minimum sequence identity thresholds between 90% and 99%. For each search result, we only considered the longest alignment that fulfills the minimum sequence identity criterion. We computed the sensitivity for each sequence identity threshold as the ratio of the total count of aligned residues divided by the total length of the proteins in the non-redundant set. 100% sensitivity is reached when all reference protein residues can be aligned to an assembled protein sequence.
Protein sequence recovery on metagenomic datasets. For the benchmark test on real metagenomic data (Fig. 2b-e) we used the following datasets: (b) a single human gut sample from SRA (SRR5024285) [34], (c) 775 samples from Tara eukaryotic metatranscriptomes downloaded from the ENA (PRJEB6609) [35], (d) a soil sample from IMG project 1003784 (6398.7.44014), (e) 12 samples from the same project (6679.7.51457 6478.6.45123, 6679.6.51456, 6398.7.44014, 6478.7.45124, 6674.6.51288, 6679.5.51455, 6674.4.51285, 6478.5.45122, 6478.4.45121, 6674.3.51284, 6674.5.51286). All samples used in Fig. 2b,d,e consist of paired-end reads of 2 × 150 bp length, while c consists of reads with 2 × 10² bp length.
We assembled paired-end reads in datasets b,d,e using Megahit and Plass with default parameters. The benchmarks for sets in Fig. 2b-d were carried out on a single server with two Intel Xeon E5-2640v3 8-core CPUs and 128 GB RAM. The cross assembly in Fig. 2e was performed on a server with two 14-core Intel Xeon E5-2680 v4 CPUs with 768 GB RAM. During the cross assembly, Megahit aborted with a segmentation fault on the 768 GB server. We therefore performed twelve separate assemblies and pooled the results.
We could compare Plass only to Megahit on datasets b,d,e, since Velvet terminated with segmentation faults, metaSPAdes terminated with messages specifying a required amount of RAM in excess of the available 128 GB, and SFA-SPA did not finish execution within three days.
For Fig. 2c, we assembled the 775 Tara metatranscriptomes using Plass and compared the results with the Marine Atlas of Tara Oceans Unigene (MATOU) catalog [35], assembled using Velvet. For that purpose, we called protein sequences using Prodigal in metagenomics mode on all MATOU contigs, since these often do not contain full-length protein sequences. Eukaryotic protein sequences contain repeats more frequently than viral or prokayotic ones. We therefore masked low complexity regions of the assemblies created by Plass using tantan [36] and removed all assembled proteins with more than 50% masked residues.
To analyze the diversity of the obtained sets at various redundancy levels, we clustered all assembled protein sequence sets with Linclust using the parameters --kmer-per-seq 80 --cluster-mode 2 --cov-mode 1 -c 0.9 at sequence identity thresholds --min-seq-id from 50% to 90%.
Taxonomic classification and quantification. We wanted to investigate the influence of the assembly method on the taxonomic composition (Supplemental Fig. 3). Instead of matching nucleotide reads to reference genomes, we here perform the taxonomic matching on the protein level because, first, many species sampled with metagenomics do not contain a close homolog in the reference databases, and second, protein-level comparison afford a much higher sensitivity to match to more distantly related sequences.
Our strategy is to (1) map reads - via the translated ORFs they contain - to assembled protein sequences and to (2) map the assembled protein sequences to taxonomic nodes in the NCBI taxonomic tree. We thereby map transitively each read to one taxonomic node.
To map the assembled protein sequences to taxonomic nodes (step 2 above), we implemented the 2bLCA protocol [37] as new MMseqs2 module mmseqs taxonomy (Supplementary Fig. 2) and assigned the assembled protein sequences to the 90% redundancy-filtered Uniprot database (Uniclust90 2017_07) [28], which contains taxonomic assignments to the NCBI tree for each sequence.
Using the two-step transitive mapping, we computed read counts for all taxonomic nodes. We then pooled the counts for each phylum in the tree and in addition recorded counts of reads assigned by 2bLCA to taxa above the phylum level. Only the 8 most abundant taxa were then kept, and counts of all others were pooled into a category “Others”.
In Supplementary Fig. 3a we show the results for the soil sample assemblies from 2d (blue: Megahit, red: Plass) and the assemblies of the 12 soil samples from 2e (light blue: Megahit, light red: Plass), together with the ratios on top. The inset gives the fraction of reads in the single and the 12 soil samples that could be mapped to an assembled protein sequence with a minimum sequence identity of 90% (step 1 above).
In Supplementary Fig. 3b we show the count of assembled amino acids within various coverage ranges. Coverage of an assembled protein sequence is the sum of the number of residues aligned to that sequence during mapping divided by the length of the assembled protein sequence.
Around 5 to 10 times more reads can be mapped to the set of protein sequences assembled by Plass (red) than to the set predicted by Prodigal on the Megahit assembly. The gains are particularly high for high coverages.
Soil Reference Catalog assembly and analysis. For the Soil Reference Catalog (SRC), we downloaded from the sequence read archive (SRA) at the NCBI/NIH all 640 metagenomic datasets that (1) had the “soil metagenome” taxon identifier, (2) had dates between 01/2014 and 02/2018, (3) were sequenced on Illumina HiSeq or NovaSeq machines, and (4) had paired-end reads of at least 2 × 150 bp length. Sample identifiers are contained in a file SRC_sample_ids.txt at https://github.com/martin-steinegger/plass-analysis
Plass assembled the 18 Tbp of raw reads on a small cluster of servers with 2 × 8-core Intel Xeon E5-2640v3 CPUs and 128 GB RAM. We removed protein sequences shorter than 100 residues and redundancy-filtered the protein sequences from each sample using Linclust with options --min-seq-id 0.95 --alignment-mode 3 -c 0.99 --cov-mode 1 --cluster-mode 2). We pooled these 12 billion protein sequences and further reduced their redundancy by clustering with Linclust (--cov-mode 1 -c 0.9 --min-seq-id 0.9). The clustering was done hierarchically, since Linclust can only process 232 − 1 sequences at once. The final set contains 2 022 891 389 sequences.
We chose two metagenomic soil sets (SRR5919294 and SRR6201924) that were not part of the 640 datasets used for building the SRC. We merged overlapping read pairs using FLASH [23], sampled 100 000 merged reads per sample, predicted protein sequence fragments using Prodigal [33], and searched through the 90%-redundancy-filtered versions of SRC and the Uniprot database [28] using the mmseqs map workflow (see below). We computed the fraction of mapped reads out of the total read count while demanding a minimum sequence identity of 50% or 90% using the option --min-seq-id.
Read mapping. In this study, we use the novel mmseqs map workflow from the MMseqs2 package to find very similar protein sequence matches in a protein sequence database. It first calls the mmseqs prefilter module (with a low sensitivity setting of -s 2) to detect high scoring diagonals and then computes an ungapped alignment using the mmseqs rescorediagonal module. In contrast to the mmseqs search workflow, for maximum speed no gapped alignment is computed, query sequences are not masked for low complexity regions (--mask-mode 0), and no compositional bias correction is applied (--comp-bias-corr 0). By default, the mapping workflow requires that 90% of query sequence residues are aligned to a database sequence (--cov-mode 2 -c 0.9).
Software versions used. We used the following version of software in this article, Prodigal V2.6.3, FLASH v1.2.11, Velvet 1.2.10, SFA-SPA 0.2.1, metaSPAdes v3.10.1, Megahit v1.1.1-2-g02102e1.
Assembled protein sequence sets. The assembled protein sequence sets are available as FASTA formatted files at https://plass.mmseqs.org.
Code availability. Plass is GPLv3-licensed open source software. The source code and binaries for Plass can be downloaded at https://github.com/soedinglab/plass.
Data availability. All scripts and benchmark data including command-line parameters necessary to reproduce the benchmark and analysis results presented are available at https://github.com/martin-steinegger/plass-analysis.
Acknowledgements
We are grateful to Cedric Notredame and Chaok Seok for hosting MS at the CRG and SNU for 12 and 30 months, respectively. We thank Shinichi Sunagawa, Folker Meyer and Alex Sczyrba for helpful discussions. This work was supported by the EU’s Horizon 2020 Framework Programme (Virus-X, grant 685778).
References
References


