

Abstract
Background Individual differences in impulsivity and compulsivity is thought to underlie vulnerability to a broad range of disorders and are closely tied to cortical-striatal-thalamic-cortical (CSTC) function. However, whether impulsivity and compulsivity in clinical disorders is continuous with the healthy population and explains CSTC dysfunction across different disorders remains unclear.
Methods We characterized the relationship between CSTC effective connectivity, estimated using dynamic causal modelling of functional magnetic resonance imaging data, and dimensional phenotypes of impulsivity and compulsivity in two symptomatically distinct but phenotypically related disorders, obsessive-compulsive disorder (OCD) and gambling disorder (GD). 487 online participants provided data for modelling of dimensional phenotypes. These data were combined with 34 OCD patients, 22 GD patients, and 39 healthy controls, who underwent functional magnetic resonance imaging.
Results Three core dimensions were identified: disinhibition, impulsivity, and compulsivity. Patients’ scores on these dimensions were continuously distributed with the healthy participants, supporting a continuum model of psychopathology. Across all participants, higher disinhibition correlated with lower bottom-up connectivity in the dorsal circuit and increased bottom-up connectivity in the ventral circuit, and higher compulsivity correlated with reduced bottom-up connectivity in the dorsal circuit. Similar changes in effective connectivity were observed with increasing clinical severity that were not accounted for by phenotypic variation, demonstrating convergence towards behaviourally and clinically relevant changes in brain dynamics. Effective connectivity did not differ as a function of traditional diagnostic labels.
Conclusions CSTC dysfunction across OCD and GD is better characterized by dimensional phenotypes than diagnostic comparisons, supporting investigation of quantitative liability phenotypes.
Acknowledgements
L.P. was supported by an Australian Postgraduate Award. J.T. was supported by National Health and Medical Research Council (ID:1002458, 1046054). A.F. was supported by the Charles and Sylvia Viertel Foundation, the Australian Research Council (ID: FT130100589) and the National Health and Medical Research Council (ID: 3251213, 3251250, 3251392). M.Y. was supported by a National Health and Medical Research Council Fellowship (ID: 1117188), Monash University and the David Winston Turner Endowment Fund.
Introduction
Psychiatric research is gradually shifting away from studying classically diagnosed disorders towards an understanding of the underlying constructs and mechanisms that drive maladaptive behavior (1; 2). In this context, impulsivity and compulsivity feature prominently as putative intermediate phenotypes linked to symptom variation across multiple disorders (3–7), and likely explain a substantial fraction of commonly observed comorbidities (7–9).
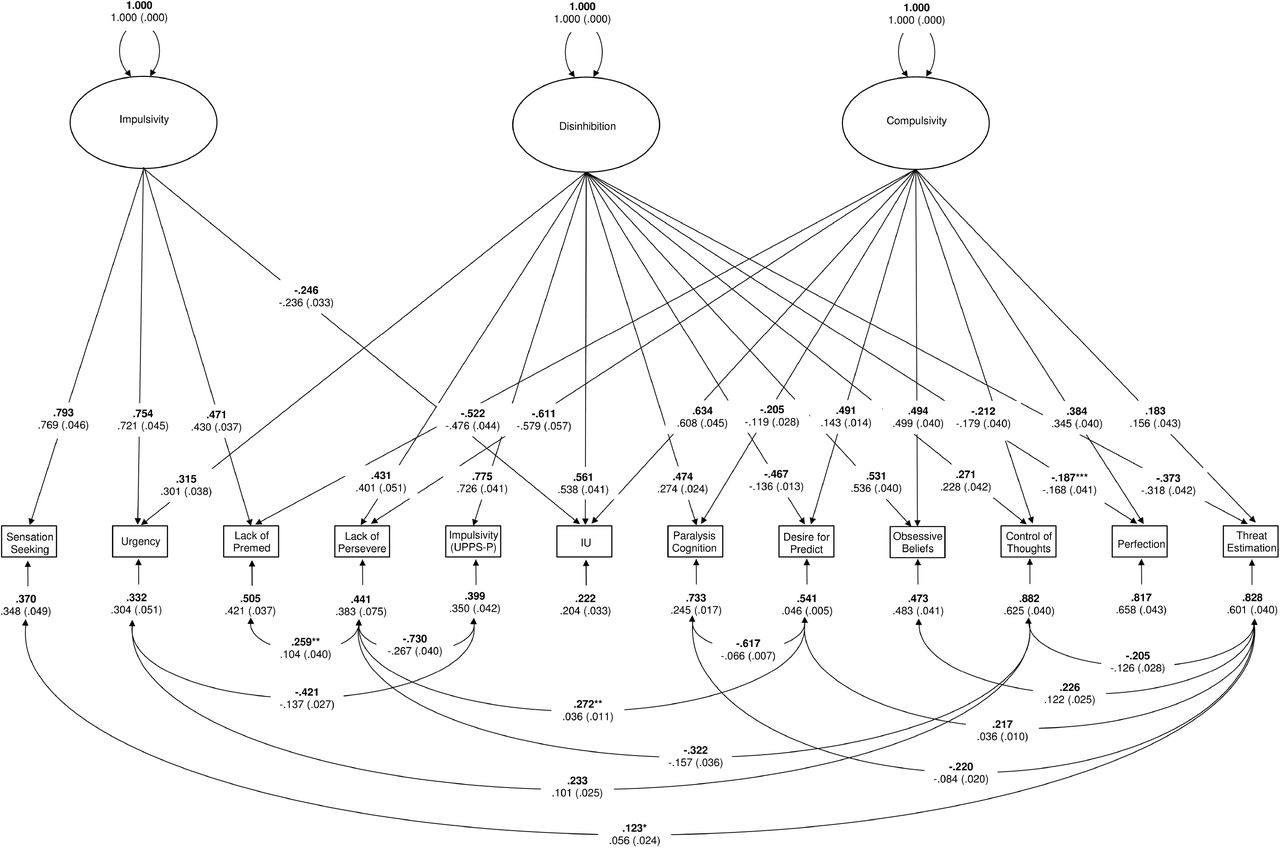
Historically, impulsivity and compulsivity have been quantified using scores on either behavioral tasks (e.g., response inhibition paradigms) or self-report questionnaires (10; 11), and the relation between the two constructs has been unclear (3; 5); some suggest that they are diametrically opposed on a single continuum (12; 13), whereas others propose that they are orthogonal dimensions (4; 6). Recent Confirmatory Factor Analyses (CFA) of multiple measures of impulsivity and compulsivity has shown that the constructs form two distinct but positively correlated traits, which each predict poorer quality of life (7). Using Structural Equation Modelling (SEM) of 12 self-report measures of impulsivity and compulsivity in a large normative sample, we reported evidence for a bifactor model in which a unitary, general ‘disinhibition’ dimension, characterized by high impulsivity, uncertainty intolerance and obsessive beliefs, coupled with low desire for predictability, perfectionism, and threat estimation, was the strongest predictor of the co-occurrence of addictive and obsessive-compulsive symptomatology, with residual, specific dimensions of ‘impulsivity’ and ‘compulsivity’ explaining additional unique variance (9). Thus, our model successfully captures both correlated (disinhibition) and orthogonal variance associated with different measures of impulsivity and compulsivity that are relevant to understanding behavior and psychopathology.
One implication of our model is that clinically diagnosable disorders of impulsivity and compulsivity represent extreme expressions of traits that are distributed continuously with the healthy population (the continuity hypothesis). This postulate, while consistent with the implicit assumption of the Research Domain Criteria (RDoC) initiative (1; 2), has seldom been formally tested in psychiatry. Hence, it remains unclear how subclinical variation in impulsivity and compulsivity relate to case-level psychopathology, either at the level of observable behavior or underlying neurobiology.
Here, we test the continuity hypothesis using impulsivity and compulsivity as intermediate phenotypes and diagnosed gambling disorder (GD) and obsessive-compulsive disorder (OCD) as exemplars of psychopathology at the extreme ends of these phenotypes. GD and OCD are both associated with dysfunctional levels of impulsivity and compulsivity (14–18) and have overlapping pathophysiology centered on cortical-striatal-thalamic-cortical (CSTC) circuits (19–22), which are thought to play a critical role in mediating impulsive and compulsive behaviors (5; 23–26). An advantage of studying a behavioral addiction such as GD is that it allows us to uncover pathophysiological processes without the confounding effects of substance abuse or dependence (27–29).
The CSTC circuitry of the brain comprises a series of parallel yet integrated loops that topographically connect distinct regions of frontal cortex predominantly with ipsilateral striatum and thalamus (30; 31). These circuits are functionally specialized and broadly segregate into ventral limbic, dorsal associative, and caudal sensorimotor systems (30–33). Altered functional coupling (dysconnectivity) of the dorsal and ventral circuits has been similarly implicated in both GD and OCD (19; 21; 22; 34–41), but the two disorders have not been directly compared and the degree to which any neural similarities or differences relate to variations in impulsivity and compulsivity are unclear. Some have suggested that the ventral and dorsal striatum respectively drive impulsive and compulsive behaviors, while top-down cortical projections inhibit these behaviors (5), but these assertions have not been directly tested. Moreover, most work to date has relied on simple (undirected) models of network interactions, based on correlational measures of functional coupling between regions (i.e., functional connectivity), which cannot disentangle causal top-down or bottom-up influences in CSTC circuitry.
In this study, we addressed two primary aims. First, we extended our prior modelling work (9) by combining our existing normative cohort with a new sample of healthy controls (HCs), individuals with OCD, and individuals with GD to replicate our model and formally test the continuity hypothesis; that is, that GD and OCD participants lie at the extreme ends of our quantitative phenotypes. Second, we investigated how our quantitative and clinical phenotypes relate to CSTC function. We mapped the effective connectivity (i.e., the causal interactions between brain regions) of the CSTC circuitry using Dynamic Causal Modelling (DCM) (42–45) of resting-state functional Magnetic Resonance Imaging (rs-fMRI) data and linked effective connectivity parameters to our quantitative impulsivity and compulsivity phenotypes, as well as to traditional diagnostic groupings, in a Bayesian framework. As opposed to undirected estimates of functional connectivity, our approach allowed us to distinguish top-down from bottom-up influences in CSTC circuitry, and to evaluate whether quantitative trait variation or diagnosis is a stronger correlate of brain function.
Methods and Materials
Participants
Participants included 487 individuals used in our previous work (9), recruited online through the Amazon Mechanical Turk community (online dataset), and 96 participants (39 HCs, 34 OCD, and 23 GD) recruited locally for neuroimaging (imaging dataset). All participants completed a self-report questionnaire battery used to model impulsivity and compulsivity. See supplement for details on recruitment and eligibility.
Impulsivity and compulsivity
We measured diverse aspects of impulsivity and compulsivity using self-report indices that assessed the phenotypes as multidimensional constructs, had good validity and reliability, were not measures of disorder-specific severity, and were sensitive to clinical and subclinical variation. Impulsivity was measured using the 59-item UPPS-P Impulsivity scale (46; 47). Compulsivity was measured with the Obsessive Beliefs Questionnaire 44-item version (OBQ-44) and the 12-item version of the Intolerance of Uncertainty Scale (IUS-12) (48–52).
Structural equation modelling
We modelled the dimensional structure of the self-report measures mentioned above using SEM, as per procedures described in Tiego et al (9). Briefly, item-level data from the OBQ-44, IUS-12, and UPPS-P were combined across the online and imaging datasets. Data were fit to a bifactor model that included a general disinhibition dimension as well as specific dimensions for impulsivity and compulsivity (9). Factor score estimates were obtained for the dimensional phenotypes of disinhibition, impulsivity, and compulsivity for use in subsequent analysis of the imaging dataset. Details of model estimation as well as comparison to competing models are provided in the supplement.
Magnetic Resonance Imaging and Dynamic Causal Modelling
Functional (echoplanar imaging, EPI) and structural (T1-weighted MP-RAGE) data were acquired on a Siemens MAGNETOM Skyra 3T scanner. Scans were processed using Matlab code available online (https://github.com/lindenmp/rs-fMRI). Pre-processing and quality control was performed as per Parkes et al (53) and are detailed in the supplement. Effective connectivity was estimated using spectral DCM (spDCM) (54; 55) implemented in SPM12 r7219 (Wellcome Trust Centre for Neuroimaging, London, UK; code available at: https://github.com/lindenmp/rs-fMRI/tree/master/stats/spDCM). spDCM was developed specifically for modelling rs-fMRI data and provides a computationally efficient way to estimate effective connectivity by fitting cross spectra rather than the time series (54). Owing to projections within CSTC circuitry being predominantly ipsilateral (30; 31), we estimated CSTC effective connectivity separately in each hemisphere.
Generation of DCM nodes
We defined functional regions of interest (ROI) that sampled key regions of the CSTC circuits implicated in impulsivity, compulsivity, GD, and OCD. The dorsal circuit comprised the dorsal striatum, anterior cingulate cortex (aCC), orbitofrontal cortex/ventromedial prefrontal cortex (OFC/vmPFC), and anterior thalamus (5; 36). The ventral circuit comprised the ventral striatum, aCC, OFC/vmPFC, dorsolateral prefrontal cortex (dlPFC), and posterior thalamus (5; 35). Dorsal and ventral striatal subregions were extracted from a striatal parcellation based on structural connectivity (32). All other ROIs were generated using a subject-specific approach based on seed-based functional connectivity from these striatal subregions, details of which can be found in the supplement. In brief, for each CSTC circuit and subject, each anatomical ROI outside the striatum was refined into a spherical DCM ROI with radius 3-mm that satisfied the following criteria: (i) within a 16-mm radius of the second-level main effect of striatal seed for the whole sample (12-mm for the thalamus); (ii) within the boundaries of the corresponding anatomical ROI; (iii) at least 20-mm away from the center-of-mass of the corresponding striatal seed; and (iv) did not overlap with DCM ROIs generated for any of the other anatomical ROIs.
Specification and inversion of DCM at the First Level
For each participant and hemisphere, a sparse parent model (Figure 1) was created that modelled connectivity from the cortical DCM ROIs to the corresponding striatal DCM ROI, from the striatal DCM ROI to the corresponding thalamic DCM ROI, and from the thalamic DCM ROI back to the corresponding cortical DCM ROIs. We excluded connections within the CSTC circuits that were not relevant to our hypotheses. Hence, cortico-cortico connections were not modelled as we were primarily interested in examining the connectivity between cortex and subcortex. This procedure was repeated for each CSTC circuit and both were combined into a single DCM. To link the two circuits, the dorsal and ventral striatal subregions were connected reciprocally. Nested models were generated by systematically turning off each of the connections present in the parent model. The parent model was inverted using spDCM (spm_dcm_fit.m), and the nested models were inverted using Bayesian model reduction (spm_dcm_bmr.m) (56). Because nested models are defined only by the removal of connections included in the parent model, they differ only in terms of their priors, which allows efficient/rapid estimation of nested DCM models by using the posterior of the parent model.

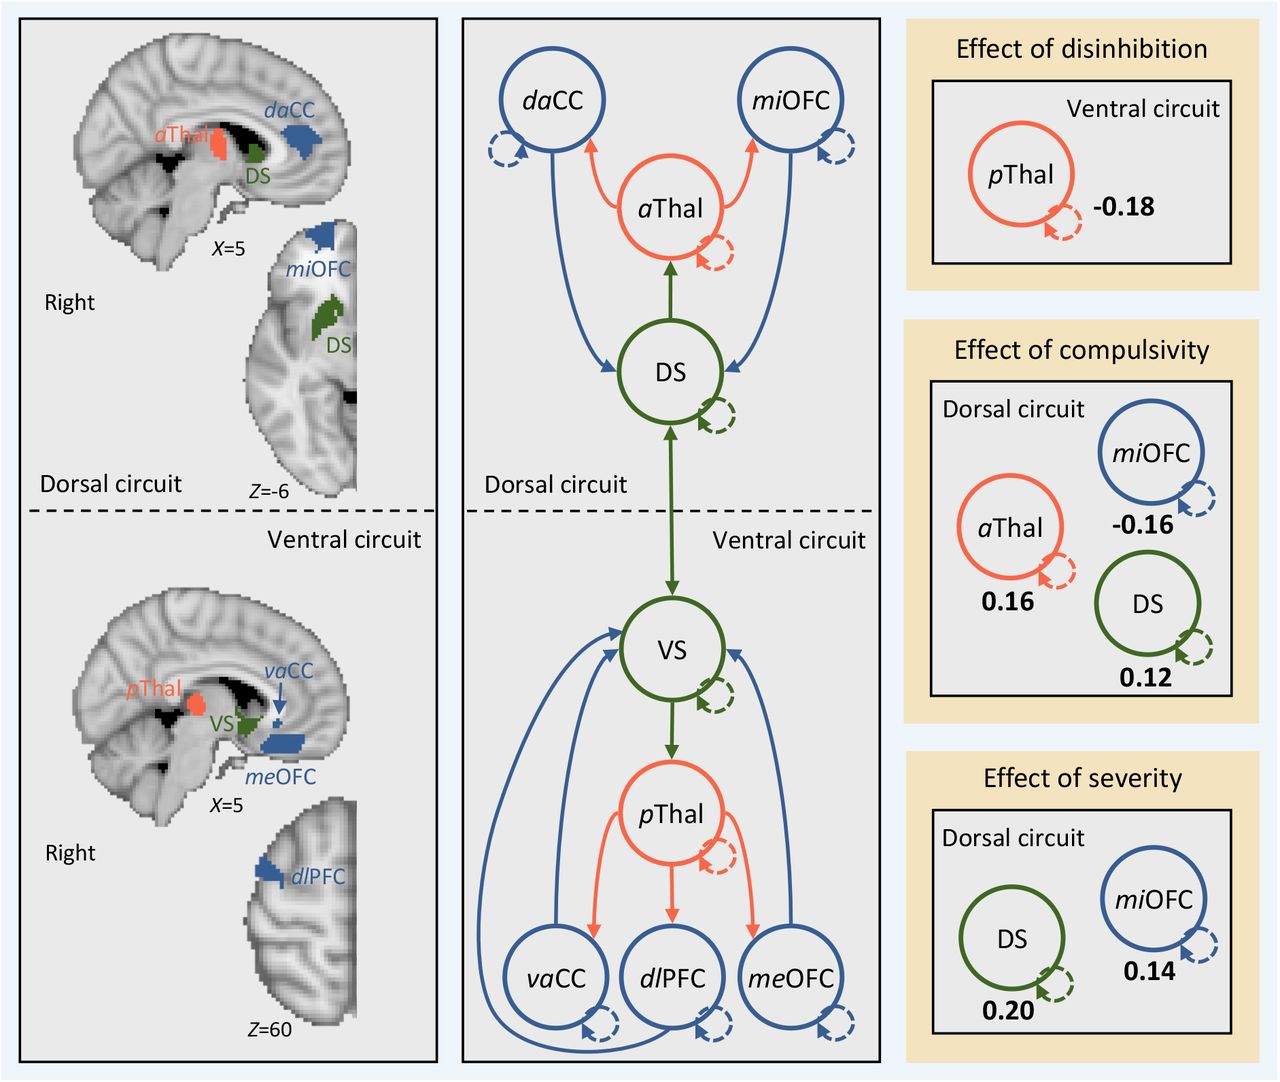
Effective connectivity between regions in cortical-striatal-thalamic-cortical (CSTC) circuits covaries with individual differences in disinhibition, compulsivity, and impulsivity. Left, brain regions in the left hemisphere (i.e., search volumes for subject-specific DCM ROIs) and wiring diagram representing the model that was specified. Solid lines represent connectivity between regions. Arrow heads depict direction of connection. Dashed lines represent inhibitory self-connections. Right, effects of phenotypes and clinical severity on effective connectivity within CSTC circuits in the left hemisphere as assessed using parametric empirical Bayes. Effective connectivity parameters are described in Hz (right panel, bold numbers), where the activity in one node influences the rate of change in the activity in another. Self-connections are (log)scaled. In both cases, the interpretaion is the same, with increasing scores on a given phenotype the effective connectivity between, or the inhibitory activity within, nodes decreases/increases as specified. The DCM ROIs have each been labeled according to which subregions of their respective anatomical ROI they were localized to during DCM ROI generation (see supplementary methods and supplementary results for details). daCC = dorsal anterior cingulate cortex, vaCC = ventral anterior cingulate cortex, miOFC = middle orbitofrontal cortex, meOFC = medial orbitofrontal cortex, aThal = anterior thalamus, pThal = posterior thalamus, dlPFC = dorsolateral prefrontal cortex, DS = dorsal striatum, VS = ventral striatum.
Second level DCM analysis using parametric empirical Bayes
We used the parametric empirical Bayes (PEB) routines to perform second level analysis and Bayesian model averaging (spm_dcm_peb.m & spm_dcm_peb_bmc.m). PEB is a fully Bayesian and hierarchical second-level analysis framework. In hierarchical models, the posterior density over model parameters is constrained by the posterior from the level above. In group studies, this translates to modelling how within-subject effects relate to second-level group effects and differs from classical testing in that it considers the full posterior density over the parameters (i.e., both the expected connection strengths and their covariance from each first-level DCM). We used a pair of second-level PEB routines to examine: (1) the effects of disinhibition, impulsivity, compulsivity, and case-control/case-case comparisons on effective connectivity; and (2) the effects of clinical severity on effective connectivity.
For the first PEB model, a second-level design matrix space was defined using a constant in the first column (modelling the mean across the sample), the three phenotypes of disinhibition, impulsivity, and compulsivity, as well as covariates for age, gender, IQ, medication status (medicated/unmedicated), and mean framewise displacement (mFD), a summary measure of head motion (53). To examine the effect of case-control/case-case comparisons on effective connectivity, we included linear contrasts for all possible combinations of our diagnostic groups (HC, OCD, and GD). We generated the following contrasts: (i) HC>OCD; (ii) HC>GD; (iii) HC<OCD; (iv) HC<GD; (v) OCD>GD; and (vi) OCD<GD. These six contrasts were input as separate columns in the design matrix of our PEB model.
The second PEB model retained only the OCD and GD participants and included an aggregate measure of symptom severity alongside all the same variables and contrasts from the first PEB model. We indexed clinical severity separately for the OCD and GD groups using the Obsessive-Compulsive Inventory-Revised (OCI-R (57)) and the Problem Gambling Severity Index (PGSI (58)), respectively. Then, as a proxy for transdiagnostic symptom severity, we z-scored each measure within each group separately, combined across both groups to produce a single measure of severity, z-scored again, and included severity in the PEB model.
Results
Participants and data
579 participants were included in the phenotype modelling analyses, of which 95 participants (39 HCs, 34 OCD patients, and 22 GD patients) were from the imaging dataset. Demographics are provided in Table 1. Further exclusion was applied to the imaging dataset (see Supplementary Results) that yielded a final imaging dataset of 38 HC participants, 32 OCD participants, and 20 GD participants. See supplementary results for details of participant exclusion, quality control of rs-fMRI data, and co-ordinates for ROIs.
Sample characteristics.
Impulsivity and Compulsivity phenotypes
We first confirmed that the bifactor model from our prior work (9) (Figure S1, Supplement) provided the best fit (χ2(31) = 52.903, p = .057; RMSEA = .035; 90% CI = .018 −.50; CFI = .99; SRMR = .041) to this new, extended dataset, relative to several competing models (Table S1, Supplement). We then generated factor score estimates for each of the three phenotypes for subsequent analyses. The distributions of the factor score estimates were univariate and multivariate normal, providing evidence for a continuous distribution for the disinhibition, impulsivity, and compulsivity phenotypes that spans the non-clinical and clinical spectrum.
Next, we examined whether clinical GD and OCD participants lie at the extreme ends of our phenotypes. A MANOVA revealed significant differences between HC, OCD and GD participants (Pillai’s = .110, F (6,1150) = 11.164, p < .001; ηp2 = .055, on the disinhibition (F (2,576) = 21.197, p < .001, ηp2= .071), impulsivity (F (2,576) = 10.210, p < .001, ηp2 = .034), and compulsivity (F(2,576) = 3.304, p = .037, ηp2 = .011) phenotypes. Pairwise post hoc comparisons corrected using the Benjamini-Hochberg False Discovery Rate (FDR, q = .05) (59) revealed that the OCD (M = .917, SE = .167, 95%CI =.589 – 1.244, p < .001) and GD participants (M =.809, SE = .205, 95%CI =.407 – 1.211, p < .001) were significantly higher on disinhibition than HCs; GD participants were higher on impulsivity than HCs (M =.697, SE = .190, 95%CI =.352 – 1.069, p < .001) and OCD participants (M = 1.073, SE = .238, 95%CI =.605 – 1.541, p < .001); and OCD participants were higher on compulsivity than GD participants (M =.590, SE = .294, 95%CI =.101 – 1.079, p = .023), but not HCs (M = .118, SE = .164, 95%CI =−.204 – .441, p = .585).
Effective connectivity
Having demonstrated support for the continuity hypothesis, we examined associations between scores on the disinhibition, impulsivity, and compulsivity phenotypes and CSTC effective connectivity in the imaging dataset. For all analyses, we thresholded the effective connectivity results using a posterior probability of >95%. We present effects from the left hemisphere in the main text (see Figure S2 for right hemisphere results).
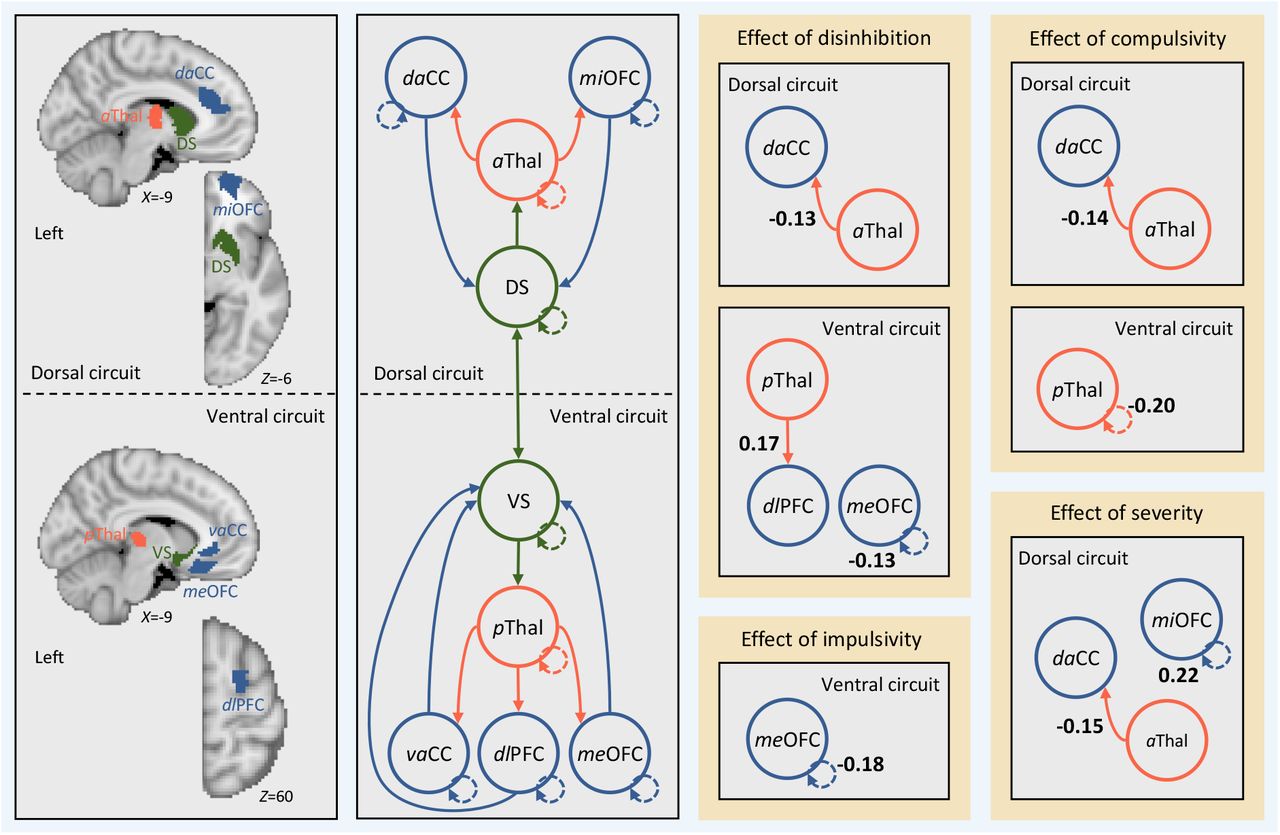
Figure 1 shows the effect of each phenotype on effective connectivity, whilst controlling for the effects of the nuisance covariates, diagnostic contrasts, and the other phenotypes. Figure 1 shows that individuals with higher scores on disinhibition exhibited (i) reduced bottom-up effective connectivity from the left anterior thalamus to the left dorsal aCC (daCC) in the dorsal circuit; (ii) increased bottom-up effective connectivity from the left posterior thalamus to the left dlPFC in the ventral circuit; and (iii) reduced inhibitory activity in the self-connection for the medial OFC (meOFC) in the ventral circuit. Individuals with higher levels of compulsivity exhibited (i) reduced bottom-up effective connectivity from the left anterior thalamus to the left daCC in the dorsal circuit; and (ii) reduced inhibitory activity in the self-connection for the posterior thalamus in the ventral circuit. Individuals with high impulsivity showed no differences in effective connectivity, but rather reduced inhibitory activity in the self-connection for the medial OFC (meOFC) in the ventral circuit. No effects were observed for any case-control or case-case contrasts. A complementary analysis using traditional frequentist analysis applied to estimates of undirected functional connectivity yielded largely null findings, demonstrating the sensitivity of our Bayesian analysis of effective connectivity (Supplementary Results).
Second, we examined the effect of clinical severity on effective connectivity in the OCD and GD patients. Consistent with the effects of disinhibition and compulsivity, symptom severity was associated with reduced bottom-up effective connectivity from the left anterior thalamus to the left daCC in the dorsal circuit. Critically, the effects of disinhibition and compulsivity reported above remained when controlling for the effect of severity, indicating that the effects are independent. Increased severity was also associated with increased inhibitory activity in the self-connection for the middle OFC (miOFC) in the dorsal circuit.
Discussion
The potential benefits of understanding the neurobiology of quantitative traits that underlie risk for mental illness are widely acknowledged, and underpin the RDoC model (1; 2). Here, we first characterized the dimensional structure of impulsivity and compulsivity in a sample of non-clinical individuals and people with clinically diagnosed OCD and GD, and then examined how effective connectivity within CSTC circuitry relates to quantitative variation in these dimensional traits. Complementing our earlier work (9), we find that variance in a broad battery of impulsive and compulsive self-report measures is best explained by a bifactor model, comprising a unitary disinhibition factor with loadings from nearly all scales, coupled with specific constructs capturing residual variance in impulsivity and compulsivity. We further show that OCD and GD patients typically occupied the extreme ends of a distribution that is continuous with non-clinical individuals, providing evidence for a continuum model of psychopathology in OCD and GD. Finally, we report that high levels of disinhibition and compulsivity correlate with altered bottom-up signalling from subcortical to cortical areas in dorsal and ventral CSTC systems, and that variance in effective connectivity was better explained by quantitative, transdiagnostic variation in these constructs than traditional diagnostic categories. Together, our results support the utility of using dimensional constructs that cut across traditional diagnostic boundaries for understanding pathophysiological processes in psychiatry. Our use of DCM to distinguish between top-down and bottom-up influences in CSTC circuitry also suggests that the pathological expression of these dimensional traits may be related to altered subcortical signaling to cortical regions (4; 5).
Disinhibition, impulsivity, compulsivity and the continuum model
We previously validated a model in a large online normative sample and found that various measures of impulsivity and compulsivity were best represented by three empirically-distinct phenotypes of disinhibition, impulsivity, and compulsivity (9). Furthermore, we demonstrated that these phenotypes explained subclinical variation in a broad range of impulsive, addictive, and obsessive-compulsive symptomatology (9). Here, we extended these findings by applying the model to an expanded sample that also included individuals with diagnosed GD and OCD. We show that a bifactor model comprising disinhibition, impulsivity, and compulsivity constructs remains the best fit to the data supporting the robustness of the previously proposed model. Furthermore, OCD and GD groups generally sat on the extreme ends of traits that had univariate and multivariate normal distributions, supporting a continuum model in which disorder represents the extreme expression of traits with a continuous population distribution. Thus, our results are in line with the basic premise of the RDoC initiative, and support characterization of the full range of variation between normal and abnormal functioning as a critical first step to developing individually targeted treatment strategies in psychiatry (2).
Quantitative traits covary with bottom-up signalling in CSTC circuitry
Higher scores on the disinhibition dimension correlated with reduced resting-state bottom-up connectivity in the dorsal circuit and increased bottom-up connectivity in the ventral circuit. These findings demonstrate that concurrent increases in impulsivity, uncertainty intolerance, and obsessive beliefs, in conjunction with reductions in desire for predictability, perfectionism, and threat estimation are associated with divergent changes across distinct CSTC circuits. Our results are the first to demonstrate that dysfunction in these aspects of impulsivity and compulsivity may be associated with a dysfunctional behavioral drive subserved by the ventral and dorsal striatal subregions (4; 5). Previous resting-state work using functional connectivity has shown increased ventral CSTC connectivity in both OCD and GD (19; 22; 35), which is reduced in OCD via deep brain stimulation to the ventral striatum (35) and our results suggest that this effect may arise through the remediation of excessive bottom-up connectivity from the ventral striatum.
We also found that higher scores on the compulsivity-specific dimension correlated with reductions in resting-state bottom-up connectivity in the dorsal CSTC circuit. This result appears counter to previous task-based fMRI studies showing dorsal striatum hyperactivation and increased functional connectivity with the ACC in OCD patients who develop compulsive habits relative to those who do not (36). This apparent discrepancy may be related to the use of task-based versus resting-state fMRI protocols. Gillan et al (36) explain dorsal CSTC dysfunction as a deficit in goal-directed control over behavior, which leads to an over-reliance on habits. Our resting-state design did not overtly engage goal-driven behavioral systems. Hence, dysfunction in the dorsal CSTC circuit may be context-specific, such that connectivity is increased when compulsive behavior is expressed but decreased at rest. Concurrent modelling of effective connectivity during task and rest could be used to test this hypothesis in future.
Finally, effects in the dorsal circuit that overlapped with those found for disinhibition and compulsivity were also observed with increasing clinical severity, demonstrating that the variation in effective connectivity explained by our phenotypes was clinically relevant.
The utility of effective connectivity models
Functional connectivity estimates undirected coupling between measured neurophysiological signals, whereas effective connectivity is based on a model of the causal interactions between neuronal populations that drive the measured signals (42). Previous research has shown effective connectivity is more sensitive to age-related changes than functional connectivity (60). Indeed, effective connectivity should offer a more precise characterization of pathophysiological processes that is less susceptible to various nuisance factors that can contaminate measures of functional connectivity (61). Here, we combined estimates of effective connectivity (54) with a fully Bayesian analysis framework (56). While the application of these methods in psychiatry is growing, so far they have been predominantly applied to schizophrenia (56; 62; 63). Thus, to demonstrate the utility of DCM in psychiatry, we replicated our analyses using functional connectivity and found no associations that survived correction for multiple comparisons. Our results thus support the superior sensitivity of a fully Bayesian analysis of effective connectivity for uncovering brain-behavior relationships in psychiatry.
Limitations
Head motion is a pernicious issue in rs-fMRI data (64–66) that confounds pathophysiological inferences (53). To rigorously address this issue, we adopted state-of-the-art denoising methods (67; 68) and stringent participant exclusion criteria (53; 69) that minimized motion-related confound in our data. Our cross-sectional design is another limitation given that OCD and GD patients may express different levels of impulsivity and compulsivity throughout the course of their illness (6). Longitudinal investigations could clarify how latent phenotypes and their neural substrates change over time. More than half of our OCD patients and four of the GD patients were on SSRI medication. Covarying for medication status had no impact on our findings, but to our knowledge the precise effects of SSRIs on CSTC effective connectivity have not been investigated.
Conclusions
Intermediate phenotypes are viewed as a promising method for understanding behavioral and biological mechanisms of risk for diverse disorders (1; 2; 70). We show that dimensional constructs related to impulsivity and compulsivity more closely track neuronal dynamics within cortico-striatal-thalamic-cortical circuits than the traditional diagnostic categories of OCD and GD. We also show that model-based estimates of effective connectivity successfully differentiate top-down and bottom-up dynamics, whereas estimates of functional connectivity yield largely null results. These findings suggest that Bayesian analysis of effective connectivity may provide a valuable tool for identifying biomarkers that cut across diagnostic boundaries.
Measures
Structural Equation Modelling
Data screening and preliminary analyses were conducted in IBM SPSS Statistics Version 23. Univariate outliers were identified and removed using a sequential fence procedure constructed using the upper and lower quartiles, defined as: fQ = n/4 + (1/4), and a 2.2 multiplicative of the interquartile range (3). All confirmatory factor analysis (CFA) models were estimated in Mplus 7.2 using the covariance matrix (4). A two-step analysis strategy was used as described in Tiego et al (5): (i) item-level data obtained from the UPPS-P, IUS-12, OBQ-44, questionnaires were analyzed using separate first-order CFAs to determine their optimal latent structure; (ii) Factor score estimates representing individual differences on each of these first-order latent dimensions were entered as variables for estimation of the second-order dimensional phenotypes model. First-order CFA models of ordered categorical data were estimated using the Weighted Least Squares Means and Variance adjusted estimator (WLSMV) and Theta parameterization with item loadings and thresholds freely estimated and the error variance of latent response variables fixed at one (4; 6).
Second-order CFA of the factor score estimates generated from the first-order models were estimated using Full Information Maximum Likelihood and the Bollen-Stine Bootstrap procedure with 10,000 posterior draws (4; 7). Latent variable scaling was performed using the fixed factor method (6). Post hoc model fitting was performed using the Benjamini-Hochberg False Discovery Rate (FDR) and freely estimated error covariances were retained if statistically significant with the FDR set at q = .05. Model fit was assessed using a combination of absolute and incremental fit indices, including the chi square test statistic (χ2), Root Mean Square Error of Approximation (RMSEA) (ε < .05 close approximate fit; ε = .05 −.08 close approximate fit; ε = .08 – 1.0 reasonable approximate fit), Comparative Fit Index (CFI) (≥.90 = reasonable fit; ≥.95 = good fit), and Standardized Root Mean Square Residual (SRMR; <.08 = good fit), or Weighted Root Mean Residual (WRMR; ≤.950 = good fit) for categorical variables (8–12). Factor score estimates were generated in Mplus using the regression method and their reliability and validity were calculated using factor score determinacy and H index values (13; 14). The H index varies from 0 – 1, with values greater than .70 indicating adequate replicability of the factors across studies using the same variables . Factor score determinacies (ρ) also vary from 0 – 1, with values of approximately ≥.9 indicating that the factor score estimates provide a valid measure of individual differences on the corresponding latent dimensions (13; 15).
Acquisition, pre-processing, denoising, and quality control of magnetic resonance imaging data
For the imaging dataset, a high-resolution anatomical image was obtained using a T1-weighted MP-RAGE structural scan (TE = 2.55ms, TR = 1.52s, flip angle = 9°, 208 slices with 1 mm isotropic voxels) and an eyes-closed rs-fMRI sequence was obtained using BOLD contrast sensitive gradient echoplanar imaging (EPI) (TE = 30ms, TR = 2.5s, flip angle = 90°, 189 volumes, 44 slices).
T1-weighted data were processed by removing the neck (FSL’s robustfov), segmenting into white matter (WM), cerebrospinal fluid (CSF), and gray matter (GM) probability maps (SPM8’s New Segment), and spatially warping the T1 and associated tissue maps to MNI space using the nonlinear deformation algorithm implemented in the Advanced Normalization Tools (ANTs (16)). In order to yield more specific estimates of WM and CSF signals for subsequent denoising, we applied up to five erosion cycles to the WM mask and up to two erosion cycles to the CSF mask following extraction of the ventricles and before spatial normalization (17; 18).
Prior to denoising, EPI data were processed by removing the first four volumes and applying slice-time correction (SPM8), spatial realignment (SPM8), co-registration to the T1-weighted image and nonlinear warping to MNI space using the warps derived above. The data were then linearly detrended and intensity-normalized to mode 1000 units. Then, EPI data were spatially smoothed with a 6 mm FWHM kernel, denoised using ICA-AROMA (19; 20) and regression of the mean WM/CSF signals, before being bandpass filtered (between 0.008 and 0.08 Hz) (17). Bandpass filtering was done using fast Fourier transform and suppressing frequencies outside the bandpass range.
As per recommendations in Parkes et al (17), participants were excluded from analysis if any of the following were true: (i) mean framewise displacement (mFD) was >0.2mm; (ii) FD contained >20% motion spikes, where spikes were defined as a single FD of >0.25mm; or (iii) any FDs >5mm. Additionally, we report the residual cross-subject correlation between FD and whole brain functional connectivity following denoising, quantified both as a percentage of connections significantly impacted by motion (i.e., QC-FC correlations), as well as the impact that distance between brain regions has on this effect (i.e., QC-FC distance-dependence).
Generation of DCM nodes
The anatomical brain regions for each CSTC circuit defined in the main text cover large parts of the brain and likely contain multiple heterogenous signals, which is not ideal for connectivity analysis. As such, to generate subject-specific DCM ROIs we combined our a priori anatomical constraints with group-level functional neuroanatomy (21).
First, the dorsal and ventral striatal subregions were defined using a parcellation of the striatum based on structural connectivity developed in our previous work (22). Second, we mapped the seed-based functional connectivity of the dorsal and ventral striatal subregions for each subject using a whole-brain general linear model as implemented in SPM12. For each striatal subregion, subject-specific contrast images were included in a 3 x 2 factorial design (group (HC, OCD, PG) by hemisphere (left, right)). To estimate the main effect of striatal subregion at the second level, single-sample t-tests were run for each striatal subregion and each hemisphere separately, collapsing across all three groups. Third, anatomical masks were generated in each hemisphere using the following AAL region (s): (i) thalamus; (ii) aCC; (iii) OFC/vmPFC; and (iv) dlPFC. Fourth, for each striatal subregion, anatomical mask, and hemisphere, we generated a spherical search volume with a 16-mm radius (12-mm was used for the thalamus due to the smaller anatomical size of this region) centered on the maximum t-value from the second level main effect. We multiplied each search volume by the corresponding anatomical mask to ensure voxels outside our anatomical regions of interest were not included. To ensure we were not capturing effects from within the striatal subregions themselves, we also removed voxels from the search volumes that were within 20-mm of the center of mass of the corresponding striatal subregion and subtracted voxels that overlapped with other search volumes (this only occurred for the aCC for the ventral CSTC circuit). This resulted in a set of search volumes for each CSTC circuit that captured the group level functional connectivity between each striatal subregion and the corresponding anatomical masks. Finally, for each subject and search volume, we found the maximal functional connectivity value (using the first-level contrast images) and generated a sphere with radius 3-mm as the DCM ROI. For each DCM ROI, time series were extracted as the principal eigenvariate of all voxel time series.
In summary, the above procedure resulted in subject-specific DCM ROIs with radius 3-mm that satisfied the following criteria: (i) within a 16-mm radius of the second-level main effect of striatal seed for the whole sample (12-mm for the thalamus); (ii) within the boundaries of the corresponding anatomical ROI; (iii) at least 20-mm away from the center-of-mass of the corresponding striatal seed; and (iv) did not overlap with DCM ROIs generated for any of the other anatomical ROIs.
Supplementary Results
Participant exclusion
Of the 487 participants from the online dataset, three were excluded because of outlying scores on the phenotypes from our bifactor model (see below). Of the 96 participants from the imaging dataset, one individual from the GD group was excluded due to outlying scores on phenotypes from our bifactor model (see below). This yielded a final phenotype modelling sample of 579 participants, of which a subset of 39 HC participants, 34 OCD participants, and 22 GD participants underwent imaging. Following phenotype modelling, four more individuals from the imaging dataset were excluded due to excessive motion (one from the HC group, one from OCD, and two from GD) and one individual from the OCD group was excluded due to poor EPI quality. This yielded a final imaging sample of 38 HC participants, 32 OCD participants, and 20 GD participants.
Structural Equation Modelling
Results from the first-order CFA revealed that bifactor models provided a reasonable fit to the data for the UPPS-P (χ2 (1589) = 2854.092, p <.001; RMSEA = .037; 90%CI = .035 −.039; CFI = .976; WRMR = 1.346), IUS-12 (χ2 (31) = 43.464, p = .068; RMSEA = .026; 90%CI = .000 −.043; CFI = .999; WRMR = .314), OBQ-44 (χ2 (355) = 3931.902, p <.001; RMSEA = .079; 90%CI = .076 −.081; CFI = .916; WRMR = 1.727) in the combined sample, replicating previous results reported for the American Mechanical Turk sample (5). Factor score estimates were generated for each of these 12 latent dimensions and screened for univariate outliers (UPPS-P Impulsivity General = 2; OBQ-44 Obsessive Beliefs General = 1; IUS-12 Importance & Control of Thoughts - Specific = 1; IUS-12 Responsibility & Threat Estimation – Specific = 1). The correlations matrix for the factor score estimates used in the second-order CFA models are displayed in Table S1. The Overlapping Dimensional Phenotypes bifactor model (see Figure S1) was replicated from the previous study (5) and provided an acceptable fit to the data (χ2 (31) = 52.903, p = .057; RMSEA = .035; 90%CI = .018 −.050;CFI = .990; SRMR = .041) with 12 error covariances freely estimated (FDR q < .05). Several competing models were also estimated to determine if they provided a better fit, including one-, two-, and three-factor models. Fit statistics for these competing models are provided in Table S2. Similar to results reported in Tiego et al (5), none of these competing models provided an acceptable fit to the data. Furthermore, several variables did not load significantly on their respective factors and had to be dropped from the One Factor (Intolerance of Uncertainty – General), Two-Factor A (RT-, ICT-, & Need for Predictability in the Face of Uncertainty-Specific); Two-Factor B and Three-Factor (IUS-12 & OBQ-44 General) models, suggesting that they did not adequately capture the covariances in the data.
From the bifactor model, construct replicability was acceptable for disinhibition (.779), impulsivity (.771), and compulsivity (.721), suggesting these factors would be reliably estimated across studies using the same variables (14; 23). Factor determinancies were high for disinhibition (ρ = .978), impulsivity (ρ = .903), and compulsivity (p = .930), indicating that the factor scores estmates provided accurate measurements of the underlying latent dimensions (13). Intercorrelations between the factor scores estimates were weak (disinhibition with impulsivity r = .078, p = .058 & compulsivity r = −.100, p = .016; impulsivity with compulsivity r = −.152, p < .001), demonstrating that the factor score estimates for each phenotype were not contaminated by variance from the other two factors (13). Factor score estimates were generated for the disinhibition, impulsivity, and compulsivity dimensions as measured in the final Overlapping Dimensional Phenotypes bifactor model (Figure S1). The distributions of factor score estimates were screened for univariate outliers, with one GD participant exhibiting Impulsivity exceeding 2.2 times the interquartile range, and results of three HC participants from the online dataset exceeding the critical Malhalanobis distance (χ2 (3) >16.266, p < .001) (3; 24). As mentioned above, these participants were excluded from further analyses. The distributions of the factor score estimates were univariate and multivariate normal based on the skewness and kurtosis statistic divided by their standard errors for disinhibition (Z = 1.257, p = .209; Z = −.340, p = .725), impulsivity (Z = 1.794, p = .073; Z = 1.223, p = .220), and compulsivity (Z = 1.554, p = .120; Z = −1.202, p = .230) and as evaluated by Small’s test of multivariate skewness (χ2 (3) = 7.014, p = .072) and kurtosis (χ2 (3) = 3.207, p = .361) (24–26). This suggests that values for these latent variables obtained in the OCD and GD groups were continuous with the non-clinical population, consistent with the assumption of normally distributed dimensional phenotypes.
Intercorrelations Amongst the First-Order Factor Score Estimates Used as Variables for the Second-Order Confirmatory Factor Analysis Models
Summary of Fit Statistics for the Competing Second-Order Confirmatory Factor Analysis Models of Impulsivity and Compulsivity

Overlapping Dimensional Phenotypes (bifactor) model, consisting of a general Disinhibition factor, and two group factors, Impulsivity and Compulsivity.
Quality control of rs-fMRI scans
Adequate control over motion-related artefacts in rs-fMRI is crucial to conducting group analyses (17; 27–29). The mFD averaged over the clinical dataset was 0.07±0.03, indicating the level of motion was low following exclusion. At the group level, mFD was the same across HC (mFD = 0.07±0.03), OCD (mFD = 0.07±0.03), and GD (mFD = 0.07±0.03) groups. Only 3.73% of whole brain functional connections were significantly correlated (p <.05, uncorrected; absolute median QC-FC correlation was 0.10) with motion following denoising with ICA-AROMA and the distance-dependence on this effect was 0.04 (Spearman’s ρ), indicating that motion contamination was low in our data.
DCM ROI generation
As mentioned above, we generated participant-specific DCM ROIs that were within a 16-mm (12-mm for the thalamus) radius of the second-level main effect of seed for each anatomical ROI in our model. We found that the dorsal and ventral striatal subregions functionally connected to distinct subregions of our anatomical ROIs, these foci are listed below in Table S3. Specifically, we found that the dorsal striatum preferentially connected to the dorsal aCC (daCC), the middle OFC (miOFC) and the anterior thalamus, whereas the ventral striatum preferentially connected to the ventral aCC (vaCC), the medial OFC (meOFC), and the posterior thalamus. The second-level functional foci for each of these regions were the center points that constrained the generation of our participant-specific DCM ROIs for the dorsal and ventral CSTC circuits.
MNI co-ordinates of peak group-level connectivity within cortico-striatal-thalamic-cortical circuits. These co-ordinates formed the centre points of search volumes used to define participant-specific ROIs for dynamic causal modelling.
Effective connectivity
In the main text we presented results in the left hemisphere, here we present results for the right hemisphere. Results are shown below in Figure S2. Similar to the left hemisphere, we found that none of our diagnostic group contrasts yielded any supra-threshold effect on effective connectivity between regions in the CSTC circuits. However, unlike the left hemisphere, we found that disinhibition, compulsivity, and impulsivity also had little impact on effective connectivity between CSTC regions, suggesting our results were largely lateralized to the left hemisphere.
Effective connectivity between regions in cortical-striatal-thalamic-cortical (CSTC) circuits in the right hemisphere covaries with individual differences in disinhibition, compulsivity, and impulsivity. Left, brain regions (i.e., search volumes for subject-specific DCM ROIs) and wiring diagram representing the model that was specified. Solid lines represent connectivity between regions. Arrow heads depict direction of connection. Dashed lines represent inhibitory self-connections. Right, effects of phenotypes and clinical severity on effective connectivity within CSTC circuits in the right hemisphere as assessed using parametric empirical Bayes. Effective connectivity parameters are described in Hz (right panel, bold numbers), where the activity in one node influences the rate of change in the activity in another. Self-connections are (log)scaled. In both cases, the interpretaion is the same, with increasing scores on a given phenotype the effective connectivity between, or the inhibitory activity within, nodes decreases/increases as specified. The DCM ROIs have each been labeled according to which subregions of their respective anatomical ROI they were localized to during DCM ROI generation (see supplementary methods and supplementary results for details). daCC = dorsal anterior cingulate cortex, vaCC = ventral anterior cingulate cortex, miOFC = middle orbitofrontal cortex, meOFC = medial orbitofrontal cortex, aThal = anterior thalamus, pThal = posterior thalamus, dlPFC = dorsolateral prefrontal cortex, DS = dorsal striatum, VS = ventral striatum.
Analysis using functional connectivity
In the main text we present results of a fully Bayesian analysis of effective connectivity and show that phenotypes from our bifactor model (5) covary with bottom-up connectivity in CSTC circuits. Here, we contrast this Bayesian analysis of effective connectivity with frequentist analysis of functional connectivity. We estimated functional connectivity as a Pearson correlation between the eigenvariate time series from the DCM ROIs that elicited an effect in our PEB analysis (see main text), not including the self-connections. This resulted in undirected functional connectivity being estimated between the anterior thalamus and daCC from the dorsal CSTC circuit as well as between the posterior thalamus and dlPFC from the ventral CSTC circuit. The relationship between functional connectivity and the phenotypes was assessed using a general linear model that included the same nuisance covariates as in the DCM analysis (i.e., age, gender, IQ, medication status, and mean FD). None of the model coefficients were significant at p<0.05, corrected for multiple comparisons. The negative relationship between compulsivity and anterior thalamus-daCC functional connectivity in the dorsal CSTC circuit was marginally significant at uncorrected levels (r = −0.05, p = 0.049). These results demonstrate that estimates of effective connectivity derived from DCM analyzed using Bayesian methods are more sensitive to relationships with our dimensional phenotypes.
Footnotes
Disclosures: S.R.C consults for Cambridge Cognition, Shire, and Promentis. The remaining authors declare no competing financial interests.
References
References


