

Abstract
Cellular stress induces rapid expression of genes encoding molecular chaperones. In many eukaryotes, stress also triggers transient intracellular acidification which, by unknown mechanisms, is associated with increased survival. Here, using budding yeast as a model, we discover that preventing cells from transiently acidifying during heat shock compromises induction of molecular chaperones and fitness. Prevention of acidification during stress and recovery silences induction of a canonical heat-shock protein altogether. The association between acidification, induction, and growth holds at the population and single-cell levels. Hinting at the molecular basis of these effects, the failure to acidify specifically suppresses induction of genes regulated by the conserved heat shock transcription factor Hsf1. Our results establish a central role for intracellular pH in the eukaryotic transcriptional stress response, and implicate pH-sensitive stress-sensing proteins, rather than misfolded proteins, in the activation of Hsf1 under physiological heat shock conditions.
Introduction
To survive and thrive, organisms must rapidly respond when their environments turn harsh. Cells across the tree of life possess the capacity to adaptively respond to primordial stresses—heat, starvation, hypoxia, exposure to noxious compounds—in a conserved program involving the production of so-called heat shock proteins, many of which act as molecular chaperones.1 Transcription of heat shock proteins surges at the onset of stress, reaching as much as a thousand fold during thermal stress, with more modest induction accompanying nutrient withdrawal and diverse other stresses.1, 2 In eukaryotes, the transcriptional stress response is controlled by multiple factors, with the heat shock transcription factor Hsf1 regulating the induction of a core group of chaperones.3 Induced chaperones, in turn, assist with protein folding, as well as preventing and dispersing stress-induced molecular aggregates.4, 5
The same diverse stresses which stimulate the transcriptional response are also accompanied by intracellular acidification—a drop in cytosolic pH.6–9 Like the transcriptional response, stress-induced acidification is broadly conserved in eukaryotes, including mammals,7, 10–13 insects,14, 15 plants,16 and fungi.6, 9 Although acidification has sometimes been viewed as a toxic consequence of stress, particularly in studies of hypoxia and ischemia-associated acidosis,11, 16 the cytoprotective effects of short-term acidification were identified decades ago.11 Recent work has shown that interfering with energy-depletion-induced acidification in budding yeast and in fission yeast (which diverged from budding yeast more than half a billion years ago17) compromises the fitness of both species,8 indicating a cytoprotective effect of acidification by an unknown mechanism.
We became interested in intracellular pH during studies of the stress-triggered aggregation of specific endogenous proteins and RNA into large clusters, termed stress granules when observed microscopically, which occurs in all eukaryotes.18 During heat stress in budding yeast this aggregation is reversible,19 and stress-induced molecular chaperones facilitate cluster dispersal5 which accompanies resumption of translation and the cell cycle.5, 9 A recent cascade of studies has revealed that protein components of these structures can undergo phase separation, demixing from solution into liquid and hydrogel droplets in a process triggered by temperature and pH.20–24 Importantly, physiological stress-associated temperature and pH conditions suffice to trigger demixing of specific proteins in vitro,22, 23 leading to the proposal that such proteins may act as primary sensors of stress.22
What role does stress-induced cellular acidification play in the stress response? Early work in Drosophila produced mixed results: one study indicated that acidification had little impact on the production of heat shock proteins,14 while later work showed that Hsf1 trimerization, a key activation step, could be induced by acidification in vitro.15 Recent work has revealed that the starvation-stress-responsive transcription factor Snf1 senses and is regulated by pH.25 Despite discovery of cytoprotective effects associated with acidification during stress,8, 26, 27 how pH influences the transcriptional heat shock response, and how intracellular acidification, chaperone production, and cellular growth are related, remain longstanding open questions.
To answer these questions, we developed a single-cell system to both monitor and manipulate cytosolic pH while tracking the induction of the heat shock response in budding yeast. We find that heat stress without acidification leads to suppression of heat shock protein synthesis and a substantial fitness defect, but that intracellular acidification alone does not elicit a response except under extreme conditions. Single-cell data reveals that only cells which restore intracellular pH to pre-stress levels mount a robust heat shock response, with an associated acceleration in growth. Finally, global measurement of transcript levels as a function of intracellular pH during stress reveals specific suppression of core Hsf1 target genes when intracellular acidification is prevented. Building on previous work positing a role for temperature- and pH-dependent phase separation in sensing stress,22 we propose a specific mechanism for induction of the heat-shock transcriptional response in which elevated pH suppresses a stress-sensitive phase separation process. Our results link cytosolic acidification to the regulation of the canonical transcriptional heat shock response and subsequent stress adaptation in single cells, indicating that pH regulation plays a central role in the Hsf1-mediated stress response.
Results
A high-throughput assay allows quantification of pH-dependent, single-cell responses to stress
In yeast, intracellular acidification during stress is thought to be dictated by the cellular exterior: yeast live in acidic environments while maintaining a slightly basic intracellular pH through the activity of membrane-localized proton pumps,28 and protons accumulate in the cell during stress. While the mechanism of proton influx remains somewhat murky, elevated temperature increases membrane permeability29 and other stresses have been shown to reduce proton pump activity.28, 30, 31 We first sought to measure the pH changes associated with heat stress in our system.
To track intracellular pH during stress and recovery, we engineered yeast cells to constitutively express pHluorin, a pH-sensitive green fluorescent protein derivative used to measure intracellular pH,32 in the cytosol. We used this strain to characterize the intracellular pH changes that occur during heat stress and recovery with millisecond resolution. These results, for a 42°C, 10-minute heat stress in acidic media (pH 4), are shown in Figure 1a. In agreement with previous results,6 we find that cells exposed to elevated temperature rapidly acidify from a resting pH of approximately 7.5 down to a range of 6.8 to 7.0, and that this pH change is highly reproducible (Figure S2a). In all of these experiments, we consistently observe two phases of pH change following the onset of heat stress: a short, sharp drop and partial recovery within the first two minutes, followed by slower acidification over the next several minutes. When returned to ambient growth temperature, cells return to the resting pH in approximately 10 minutes. The minimum pH reached and the dynamics of recovery are similar for cells stressed at the same temperature for 20 minutes (Figure S2b).

a) Intracellular pH changes during stress measured with continuous flow cytometry; each point is an individual cell, and the gray rectangle is the period during which cells were exposed to elevated temperature. A solid line shows a sliding-window average over all data; for visual clarity, only 2% of points are shown. Dashed lines represent the range we subsequently use as representative of the physiological pH drop. b) Production of molecular chaperones in response to temperature stress. Each plot is a timepoint during recovery from 42°C, 20-minute heat stress showing forward scatter pulse area, which correlates roughly with size, versus red fluorescence. Gray points are wild-type/unlabeled cells. Red points are cells expressing Ssa4-mCherry from the native locus. c) Induction curves showing the fold change in median ratio of fluorescence to size (forward scatter pulse area) as a function of time. Fold change is relative to unstressed cells and is common to all timepoints. Thin gray lines are individual experiments, thick red curve is the smoothed conditional mean.
The hallmark of the heat shock response is the production of molecular chaperones.1, 4, 33 To assess the effects of intracellular pH on this response, we needed to track chaperone induction and intracellular pH simultaneously. We further engineered a pHluorin-labeled yeast strain to express Ssa4, a strongly stress-responsive Hsp70 heat shock protein,33, 34 from its endogenous locus, tagged with the red fluorescent protein mCherry.35 This two-color reporter strain allowed us to simultaneously track intracellular pH and the stress response at the single-cell level.
We stressed cells at 42°C for 20 minutes and then returned them to 30°C to recover. Samples were taken at 15- to 30-minute intervals during recovery and analyzed by flow cytometry to monitor Ssa4-mCherry production. An example of the raw data, showing an increase in fluorescence in the mCherry channel as a function of time, is shown in Figure 1b. Although the maturation time of mCherry prevents conclusions about absolute timing of protein production, because this time is shared across replicates and conditions, we can analyze relative differences in response level and timing. For each independent experiment, we tracked the median relative change in red fluorescence as a function of time, creating induction curves that characterize the response, as in Figure 1c.
Intracellular acidification during stress promotes rapid heat shock protein production
To determine how acidification influences the stress response, we chemically manipulated intracellular pH independently of heat stress using an ionophore, nigericin, modifying a published protocol.36 Ionophores allow ions to penetrate cell membranes, temporarily destroying the electrochemical gradient. Nigericin is a K+ / H+ antiporter37 which has been used in a variety of biological systems to equilibrate intracellular and extracellular pH.38–41 Exposing ionophore-treated cells to heat stress (42°C for 20 minutes; Figure 2a) at a range of buffer-controlled pH levels permitted us to monitor the effect of intracellular pH during stress on the subsequent stress response. We verified that measured intracellular pH during stress matched the buffer pH, and that the efficacy of the ionophore was not affected by temperature (Figure 2b). After stress, we returned cells to ionophore-free media at 30°C and monitored Ssa4 induction by flow cytometry. Treatment with buffer and ionophore delayed the stress response in all samples relative to untreated cells, but did so consistently and did not affect the ultimate induction level (Figure 2c).

a) Schematic of intracellular pH manipulation and stress. Colored stars correspond to the measurements shown in b). b) Measured intracellular pH distribution during pH manipulation before (green), during (red), and after (purple) 42°C heat stress. Dashed lines indicate buffer pH, black distribution shows unmanipulated cells. Intracellular pH is accurately manipulated during stress. c) Induction of Ssa4 during recovery from normal (red) or pH-manipulated (gray, pH 6.8) stress. Thin curves are individual experiments and thick curves are smoothed conditional means (see Methods for details). The red curve is the same data from Figure 1c for comparison. Although pH manipulation causes a delay in Ssa4 production, it does not affect the ultimate level of induction. d) Fold change in Ssa4 expression during recovery following stress at many different intracellular pHs. Points represent the median of individual flow-cytometric measurements, and at least three biological replicates were performed for each condition (see Methods). Lines are sigmoid fits (see Methods for fitting details). Preventing the pH change during stress causes a marked delay in the production of Ssa4. e) Fold change in Ssa4 expression during recovery in media buffered to pH 7.4 after stress with manipulated intracellular pH. f) Median Ssa4 fold change two hours after pH manipulation with (left) and without (right) heat stress.
The range of pH values studied, from 7.5 to 5.0, reflected three main pH regimes. Cells held at or near pH 7.5, their resting pH, experienced little or no acidification during stress. Cells moved to pH 6.8 to 7.0 experienced an approximately physiological level of acidification (cf. Fig. 1a). Cells moved to pH 5.0 experienced a larger-than-expected pH change. All populations mounted the heat shock response. However, in cells prevented from acidifying during stress, we observed a marked delay in the response (Figure 2d, blue traces) of approximately 90 minutes, equivalent to at least the time for a full cell doubling under optimal growth conditions. Intracellular pH values between the physiological post-stress value (7.0) and the physiological resting value (7.5) caused intermediate delays as monitored by Ssa4 expression after two hours (Figure 2f, left). To ensure that this was not an artifact of fluorescent protein tagging, we also tagged Ssa4 with a FLAG tag and confirmed the delay by Western blot (Figure S3a). We also blotted against an untagged native small heat shock protein, Hsp26, under the same conditions and observed the same pH-dependent reduction in protein production, confirming the effect in another heat-shock protein (Figure S3a). Given these results, we adopt the working model that the pH-dependence of heat shock proteins likely generalizes to the full response; genome-scale results presented later further support this extrapolation.
To further determine whether acidification or ionophore treatment alone induced the response, we performed control experiments with pH manipulation at ambient temperature. Cells exposed to a variety of intracellular pH values did not show Ssa4 induction, with the exception of the lowest pH examined, pH 5.0 (Figure 2f, right hand side), which is substantially below the range of physiologically realized pH values during short-term heat shock (cf. Figure 1a). These results indicate that ionophore treatment does not trigger the heat shock response, and suggest that the physiological pH drop in heat-shocked cells is not solely responsible for chaperone induction.
Because intracellular acidification results in large part from the influx of environmental protons, we reasoned that intracellular pH, and its downstream effects on the heat-shock response, might also depend on the pH of the medium during recovery. To fully deprive cells of acidification, we allowed stressed cells to recover in media which was buffered to the resting pH of 7.5 and, as before, free of ionophore. Cells stressed at pH 6.5 or pH 5.0 showed similar chaperone induction to that observed in unbuffered media. In contrast, maintaining cells at pH 7.5 during stress and recovery abolished chaperone production (Figure 2e).
We draw several conclusions from these data. The physiologically observed acidification of the cytosol is required for, but does not cause, rapid heat shock protein production under these conditions—a remarkable result. Depriving cells of the opportunity to acidify silences chaperone production. Cells permitted the chance to acidify after heat shock were still capable of mounting a response albeit with a substantial delay, indicating that heat and acidification do not need to co-occur to elicit a response. This suggested that intracellular pH during recovery played a significant role in the production of heat shock proteins, and we turned our attention to that possibility.
Reversal of stress-induced acidification during recovery promotes heat shock protein production in single cells
How does intracellular pH during recovery influence chaperone production? In the absence of ionophore treatment, stress-associated intracellular pH changes reverse rapidly after stress ends8 (cf. Figure 1a), and, if heat shock is brief enough, precede detectable accumulation of heat shock proteins. Most populations treated with ionophore during heat shock also rapidly returned to the pre-stress pH upon return to ambient growth temperature (Figure 3a). However, cells stressed at pH values above 7.0 took longer on average to recover and, counterintuitively, cells held at the pre-stress (resting) pH during stress acidified during recovery and failed to recover their intracellular pH after two hours at ambient growth temperature (Figure 3a, right hand side, blue trace). At the same time, these cells fail to robustly produce heat shock proteins. Given these observations at the population level, we sought to determine whether intracellular pH during recovery is predictive of chaperone induction at the single-cell level.

a) Intracellular pH during recovery for cells stressed at various pH values show variation induced by pH during stress. Thin gray traces are replicates, thick colored lines are averages over replicates. b) Relationship between intracellular pH and Ssa4 fold change on the single cell level during recovery. Return to the resting pH, bounded by dotted lines, appears to precede Ssa4 induction, and is necessary but not sufficient for high expression levels. Color and label refers to the pH during stress. c) The fraction of the population in the resting pH range predicts Ssa4 expression, summarizing data in b; circles show the population median, and triangles show the median of only the subpopulation of cells within the resting pH range. Data show cells after three hours of recovery. d) During recovery from heat stress at intracellular pH levels between 7 and 7.5 a bimodal distribution of Ssa4 fold change was observed. A two-component mixture model was used to classify cells into two groups: low and high induction level (> 0.95 posterior probability cutoff used for assignment). Cells stressed at pH 7.2 are shown here as an example. e) Intracellular pH as a function of time for the low and high expression groups. Cells stressed at pH 7.2 are shown, see Figure S4 for all conditions. **p << 0.01, Wilcoxon rank sum test.
Examination of the per-cell relationship between intracellular pH variation and production of Ssa4 revealed a clear pattern: virtually all cells which produced high levels of Ssa4 had returned to the resting pH (Figure 3b). Cells further from the observed pre-stress resting pH (middle 80% of the distribution is shown with dashed lines) induce less protein, while cells with a wide range of induction values, including high expression, are found in the resting pH range. These data are summarized in Figure 3c. We conclude that returning to the resting pH is necessary, but not sufficient, for induction of molecular chaperones during recovery from stress.
Having established this connection between intracellular pH and chaperone production during recovery, we further noticed that some populations showed a bimodal distribution of Ssa4 induction values. In particular, we observed this behavior in populations stressed between pH 7.5 and pH 7.0. Figure 3d shows this distribution for cells stressed at pH 7.2; all distributions are shown in Figure S5a. A causal relationship between pH and chaperone production would predict that, even within an identically treated population, cells showing lower Ssa4 expression would have a lower intracellular pH compared to those with higher expression. To test this prediction, we assigned cells to low- and high-expression categories by fitting the data with a mixture of two Gaussian functions42 at each timepoint (Figure 3d). The evolution of the distribution of pH values for each category during recovery is shown in Figure 3e. In line with our prediction, the lower-expressing cells had less robust pH recovery than the high expressing cells. Particularly at 120 minutes of recovery, when we see strong bimodality (Figure S5a), we also see strong separation of the intracellular pH distributions, with the low-expressing cells displaying intracellular pH values that fall below the ordinary unstressed range (Figure 3e and S5b).
These data demonstrate that although cells require acidification during stress to mount a rapid response at the population level, the response further depends on subsequent reversal of acidification. The return to the resting pH dictates the dynamics of chaperone production. Acidification, either simultaneous with or following heat stress, followed by return to the resting pH are required for robust induction of chaperones after heat stress.
Intracellular pH contributes to cellular fitness during stress and recovery
Given the highly conserved nature of the heat shock response, it is reasonable to expect that the response improves cellular fitness after stress. In light of the connections we have established between intracellular pH changes and the deployment of this response, we sought to determine whether these pH changes affected fitness during recovery. In single-celled organisms such as S. cerevisiae, fitness differences may be quantified by measuring the growth rate relative to a wild-type competitor43 (Figure 4a). We stressed pHluorin/Ssa4-mCherry dual-labeled cells in different pH conditions and, just prior to recovery, mixed them with exponentially growing, unlabeled wild-type cells. Samples were taken during recovery and analyzed by flow cytometry; the number of cells belonging to each type was counted, and the log ratio of that value was plotted as a function of time. The fitness loss was quantified by fitting these data to a line and taking the slope (Figure 4a). We performed additional controls to correct for potential strain differences and for the fitness effect of ionophore; see Methods and Figure S6.

a) A schematic of the relative growth rate experiment which measures population fitness. Stressed, labeled cells and exponentially-growing, unlabeled cells are mixed and allowed to grow at 30°C. ‘Labeled’ cells are Ssa4-mCherry/pHluorin diploids. Fitness is measured by fitting the log-ratio of the population sizes as a function of time to a line; the slope of the line is the difference in exponential growth rates (see Methods for full explanation). All values are expected to be ≤ 0 because stressed cells are being compared to exponentially growing cells. b) intracellular pH during stress vs. relative growth rate (each point is an independent experiment); points are the slope of the line illustrated in a). Values between 30 minutes and 2 hours of recovery were fit with a line. See Methods for details.
As expected in comparing stressed populations to an unstressed control, all fitness differences were negative, indicating a reduction of fitness during recovery from stress (Figure 4b). However, post-stress fitness reached a maximum when cells were stressed at a pH close to the physiologically expected level (Figure 4b). Fitness declined when the stress pH was more acidic or more basic. In the range tested, fitness was lowest in cells held near the resting pH. Thus, mimicking physiological intracellular acidification during stress maximizes fitness during recovery.
The parallels between the pH-dependence of heat-shock protein production (Figure 2f) and growth during recovery (Figure 4b), particularly in the physiologically observed range of pH values, prompt the obvious question: to what extent is acidification-induced heat-shock protein production responsible for the acidification-associated increase in fitness? Both of these measures reflect population-level behavior, yet a causal link predicts correlations between pH, induction, and growth in single cells. A priori, these correlations could be in any direction in subpopulations, so long as the population average is preserved. Moreover, the complex web of connections between the variables in question make many outcomes possible. For example, pH influences protein folding and stability,44 heat shock causes protein misfolding,4 and protein misfolding promotes chaperone production and reduces fitness.43 We therefore exploited cell-to-cell variation within populations to assess the empirical relationships between intracellular pH, heat-shock protein production, and cellular growth of individual cells.
In single cells, growth and division reflect progression through the cell cycle. Because emergence of a bud signals that cells have passed through the START checkpoint and exited G1, cell-cycle position can be approximated by cellular morphology.45 Heat stress causes yeast cells to arrest in G1.46 Release from G1 arrest (and thereby re-entering the cell cycle and resuming growth) represents an important stage in recovery, and failure to do so on the population level would appear as reduced population-level fitness. Delayed release from G1 arrest provides a potential explanation for the reduced growth rates we measured in Figure 4b. We tested the resulting prediction that single cells in these populations would show signs of G1 arrest by examining the distribution of cellular morphologies in each population during recovery.
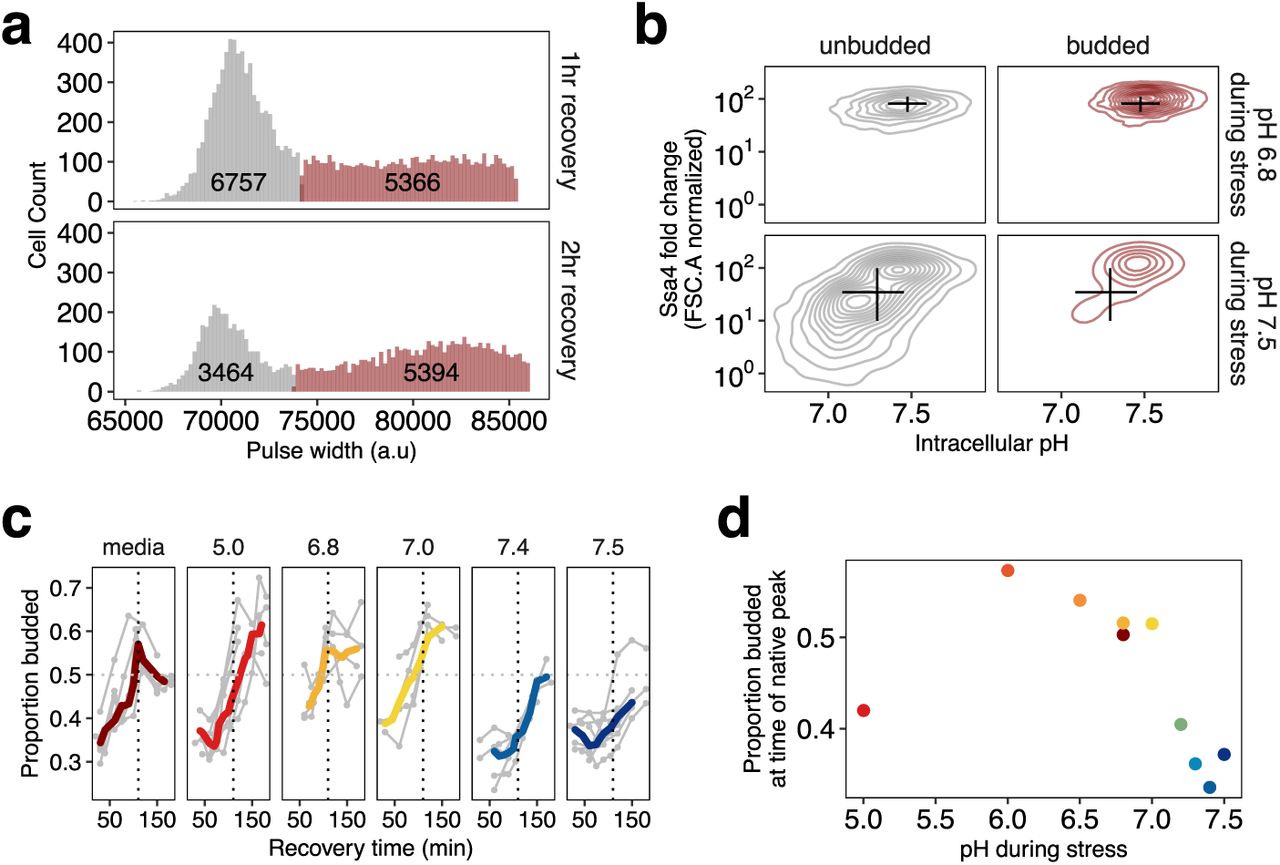
Cells without a bud cannot be confidently assigned to a growth state, as they may be actively growing and in G1, arrested in G1, or in G0. However, the presence of a bud following stress indicates that the cell has re-entered the cell cycle and begun reproducing. By classifying cells as either unbudded or budded and looking for differences between the populations, we could determine whether budding cells that are actively growing during recovery are associated with characteristics such as high chaperone expression. To determine whether cells are unbudded or budded, we use a method analogous to the microscopy-based assay of Rowley et al.46 with flow cytometry, using the pulse width of the forward scatter parameter in our relative growth rate data (classification shown in Figure 5a; 47–49 see Methods and Figure S7 for full details).

a) Classification of cells into large (red) and small (gray) populations. Classification was performed by fitting the forward-scatter pulse width to a two-component Gaussian mixture model and using the point of maximum overlap as a cutoff between the two categories. Classification of cells stressed at pH 6.8 is shown. Black labels are the total number of cells in each category. b) Ssa4 fold-change versus intracellular pH for budded (red) and unbudded (gray) cells during recovery; data for 3 hours post-stress are shown. pH during stress is shown on the right side of the plot. Black lines show summary statistics of the entire population (budded and unbudded) and span the middle 50% of the data, crossing at the median of each dimension. c) Proportion of cells budded as a function of time during recovery. The characteristic shape of the curve is represented in the left-most panel, with data from cells stressed without pH manipulation. There is a peak in the proportion budded at approximately 2 hours recovery after stress (vertical dashed line). Whether and when this peak occurs after stress varies between populations stressed at different pHs; cells stressed close to the normal stress pH are most similar to the native curve. d) Summary of c); the average proportion of cells budded between 90 and 120 minutes after stress.
Examination of the pattern of Ssa4 expression in both budded and unbudded cells revealed that, for populations where stress-associated acidification is prevented and chaperone production is impaired, lower-expressing cells are mostly found in the unbudded population. This subpopulation of small, low-chaperone-expressing cells also has a lower intracellular pH (Figure 5b, lower left panel), reflecting the dysregulation of pH observed at the population level (cf. Figure 3a,b). As before, cells showing reduced pH have lower chaperone levels. We interpret their enrichment in the unbudded category as evidence that these low-expression, low-pH cells remain disproportionately growth-arrested—and thus have reduced fitness—relative to the full population.
We also used the proportion of budded and unbudded cells as a measure of population-level fitness. During recovery, cells are released from heat-induced G1 arrest en masse, leading to a temporary synchronization of the population with a coordinated increase in the proportion of budded cells, which eventually returns to the steady-state value of percent budded for exponentially growing cells46 as seen in Figure 5c (right).
Following 42°C, 20-minute heat shock without pH manipulation, the percentage of budded cells peaks just before 2 hours of recovery (dashed line in Figure 5c). In pH-manipulated cells, if the pH experienced with elevated temperature is close to the native stress-associated pH, this recovery peak occurs at approximately the same time as in unmanipulated cells. However, cells that experience a more acidic or more basic pH during stress show a delay in the occurrence of the budding peak (Figure 5c, summarized in 5d), in agreement with the difference in growth rates shown in Figure 4b.
By measuring growth in multiple ways, we have shown that post-stress resumption of growth is tuned to particular stress-associated cytoplasmic pH values. Moreover, fitness positively correlates both with increased chaperone production and with restoration of the pre-stress pH in populations and in individual cells. Resumption of growth is consistent, at the population and single-cell level, with induced chaperones contributing to release of stress-induced cell-cycle arrest, as others have observed.9 We conclude that acidification during stress is adaptive.
Failure to acidify during stress impairs the core transcriptional stress response regulated by Hsf1
Our results thus far link pH regulation to production of a single heat shock protein, with only limited evidence that other canonically induced stress proteins follow suit (Figure S3a). Since the heat shock response is characterized by highly typical and conserved changes in transcription, we used mRNA-Seq to characterize stressed, pH-manipulated cells to determine whether and how the global transcriptional stress response was affected by intracellular pH. We sequenced the transcriptome50 of cells stressed at pH 6.8 (mimicking physiological stress-triggered acidification), at pH 7.4 (pre-stress resting pH), and without pH manipulation. All populations mounted the transcriptional heat shock response, as evidenced by the induction of heat shock genes (Figure 6a). Ionophore treatment globally reduced the magnitude of the response regardless of the target pH (Figure S8b); this is consistent with our flow-cytometric measurements of Ssa4 protein levels (cf. Figure 2c), where ionophore treatment appears to affect the timing of production rather than ultimate levels of Ssa4 protein.
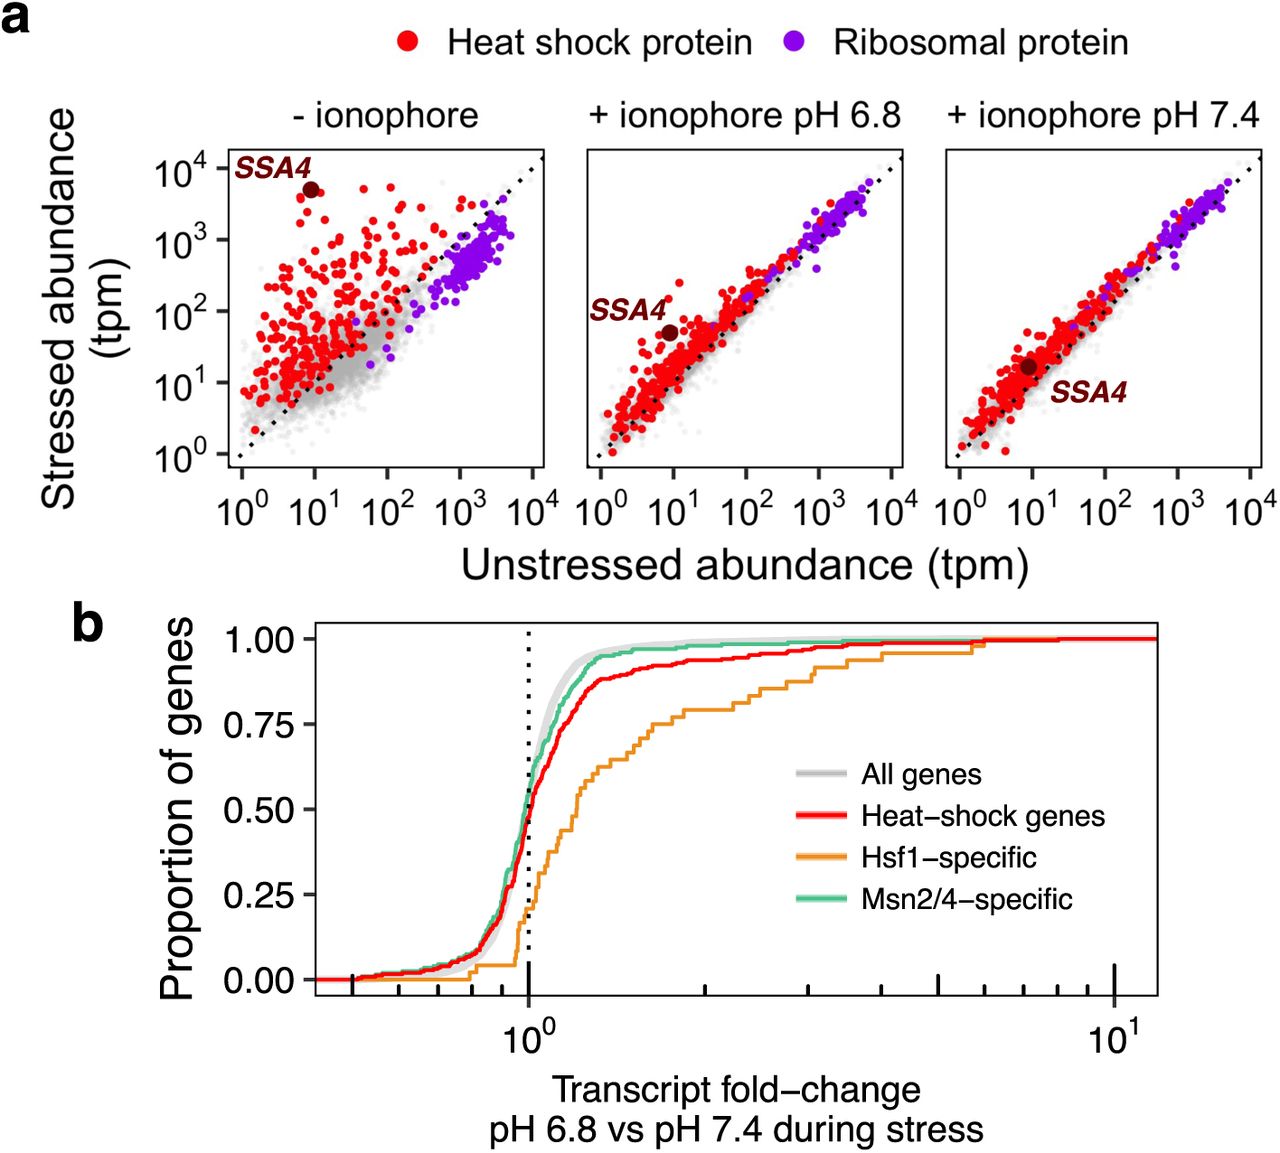
a) Transcript abundance (transcripts per million, tpm) in stressed versus unstressed samples. b) Cumulative distribution function (CDF) of per-gene transcript abundance in cells stressed at pH 6.8 relative to cells stressed at pH 7.4. The red line shows all heat shock proteins; this group is further divided into genes regulated by Msn2/4 (green) which show similar behavior to all detected transcripts (gray, (P = .402, Wilcoxon rank sum test)), and those regulated by Hsf1 (orange), which are significantly higher in acidified cells (P < 0.01).
To isolate the pH-specific effects on transcript levels, we focused on the per-gene transcript abundance ratio in acidified cells versus non-acidified cells, shown in Figure 6b. Heat-shock genes show higher acidification-dependent levels than all genes, a modest but notable difference. Motivated by the observation that not all the heat-shock genes were pH-sensitive, we asked whether transcripts associated with different transcription factors showed systematically different pH sensitivity. The general stress response in fungi is regulated by two main transcription factors: Hsf1, which regulates chaperone-centric stress responses in all eukaryotes,33, 51 and Msn2/4, a pair of paralogous factors limited to fungi.52–54 While many genes are regulated by both factors in budding yeast, recent studies have identified sets of genes specifically regulated by one or the other (see Methods for details).3, 55
Dividing heat-shock gene transcripts into Hsf1 and Msn2/4 targets revealed a striking factor-specific effect: for Hsf1 targets, but not Msn2/4 targets, acidification promotes induction (Figure 6b). These acidification-sensitive, Hsf1-regulated genes include the core molecular chaperones long associated with the canonical heat-shock response: Hsp70s (the cytosolic SSA family and ER-localized KAR2), Hsp90 and co-chaperones (HSC82 and HSP82; CPR6, STI1), Hsp40/J-proteins (SIS1, APJ1), and small heat-shock proteins (HSP42, BTN2, HSP10), among others. With the caveat that we are measuring transcript levels and not transcription rates, we conclude that the effect of pH is specific to Hsf1.
Discussion
Intracellular acidification is crucial for the adaptive transcriptional stress response
What is the physiological significance of the broadly conserved, transient intracellular acidification triggered by stress in eukaryotes? By decoupling changes in intracellular pH from stress, we have discovered that the canonical transcriptional stress response mediated by heat shock factor 1 (Hsf1) depends on this transient intracellular acidification. Acidification promotes molecular chaperone induction by Hsf1, and the resulting chaperone protein expression correlates with cellular growth after stress, a measure of fitness, on both the population and single-cell levels.
The ability to silence Hsf1 activation during a robust heat shock with a modest change in pH is thoroughly unexpected, because heat-induced protein misfolding has long been thought to provide the trigger for Hsf1 activation.33, 56 In the currently accepted model for heat-triggered Hsf1 activation, here referred to as the ‘misfolding’ model, events proceed as follows. Hsf1 is constitutively bound and repressed by the molecular chaperone Hsp70 before stress.57, 58 Heat stress destabilizes proteins, causing them to misfold and expose hydrophobic regions4 for which Hsp70 has high affinity.59 Titration of Hsp70 away from Hsf1 is sufficient for Hsf1 activation.57 How simply maintaining the pre-stress pH would prevent Hsf1 activation is not immediately obvious. We weigh three major possibilities to explain our data: 1) that prevention of acidification prevents heat-induced misfolding; 2) that steps in the activation of Hsf1 other than removal of Hsp70 repression require acidification; or 3) that the stress-induced Hsp70 substrates which cause Hsf1 activation are not misfolded proteins, but rather are stress-responsive proteins that depend upon acidification to become Hsp70 substrates.
First, might maintaining the cellular resting pH broadly prevent heat-induced protein misfolding, depriving Hsf1 of its induction signal? This appears unlikely. Because pH contributes to protein stability in idiosyncratic ways by altering the charge on ionizable groups in folded and unfolded states, no simple physical relationship connects pH and stability, such that preventing a pH drop would be expected to stabilize the proteome. No previous description of the misfolding states that thermal denaturation depends on a coincident drop in pH. In addition, simply preventing a pH drop would need to dramatically stabilize the proteome. For the misfolding model to explain Hsf1 activation, proteins must misfold well below the temperatures in our study; a 15-minute shift from 30°C to 37°C triggers the heat shock transcriptional response in budding yeast,52 far milder than the 42°C, 20-minute shock which we show can be suppressed by preventing acidification. Protein misfolding certainly can trigger Hsf1 activation; misfolding induced at favorable growth temperatures (30°C) by drug treatment or heterologous protein expression induces the Hsf1-mediated heat shock response, as we and others have shown.43, 60 However, these perturbative results are insufficient to show that thermally induced misfolding of endogenous proteins activates Hsf1; indeed, no specific endogenous protein has been shown to misfold in vivo in response to sublethal heat shock. Lack of information about endogenous proteins makes it impossible, at present, to say anything precise about the pH-dependence of their folded states.
Second, what of the possibility that additional steps in Hsf1 activation beyond removal of Hsp70 repression require acidification? A recent important study showed that expression of a synthetic decoy protein bearing Hsp70 binding sites was sufficient to robustly induce an Hsf1 reporter gene at 30°C, a powerful demonstration that titration of Hsp70 alone suffices to activate Hsf1.57 Direct measurement of intracellular pH during a similar experiment is still needed to establish that pH does not change under these synthetic induction conditions (an estradiol-driven synthetic transcription factor). No aspect of the direct Hsp70/Hsf1 interaction has been argued or demonstrated to be dependent on an intracellular pH change, suggesting that physiological pH changes act at a different point in the induction scheme.
Third, might acidification be required for the regulated, stress-triggered production of Hsp70 substrates responsible for titrating Hsp70 off of Hsf1? Strong precedents for such Hsp70 substrates exist. For example, poly(A)-binding protein (Pab1 in budding yeast), an abundant endogenous protein and a core marker of eukaryotic stress granules, demixes from solution into massive assemblies in response to heat shock.5, 19, 22, 61, 62 In vitro, Pab1 demixes by phase separation to form a hydrogel, and this process depends on both temperature and pH: a 42°C heat shock is insufficient to cause Pab1 demixing at pH 7.5, but sufficient at pH 6.6 (22 and Figure 7). Pab1’s stress-triggered demixing has been observed after a range of different stresses, and yeast cells depleted of Hsp70 show slowed dispersal of Pab1 assemblies induced by heat5 and of Pab1 from stress granules,63 suggesting that Hsp70 contributes to this dispersal. In fungi, Hsp70 collaborates with Hsp40/J-proteins (e.g., Sis1 and Ydj1) and the AAA+ ATPase Hsp104 to disaggregate a range of substrates by direct interaction. Consistent with Pab1 being a direct substrate of the Hsp70/40/104 disaggregase system, deletion of Hsp104 also slows Pab1 assembly dispersal,5 and deletion of Sis1 or Ydj1 slows dispersal of Pab1 from stress granules.63 Pab1 is almost certainly not the only such protein, as shown by a recent report of similar pH/temperature/chaperone-dependent behavior in the RNA-binding protein Pub1.24

Hsp70 represses Hsf1 before heat shock. One or more sensor proteins expose Hsp70 binding sites in response to stress, likely achieving high sensitivity by demixing. b) The relationship between the pH/temperature phase diagram of poly(A)-binding protein (solid line, demixing in the shaded area), the observed pH/temperature induction of the Hsp70 Ssa4 reported in the present study (circles show tenfold or greater induction, x’s show less induction), and a shifted phase boundary consistent with a protein capable of serving as the sensor in a. The yeast cell sits at the pre-stress position, and arrows show environmental changes studied here: 1) physiological 42°C heat shock, with resulting acidification; 2) the same heat shock with acidification artificially suppressed; 3) acidification alone without a temperature change, as occurs during other stresses such as starvation. Crossing the hypothetical sensory phase boundary corresponds with empirical observation of robust Hsf1-mediated heat-shock protein expression.
Together, these studies indicate the existence of proteins that undergo stress-triggered, pH-dependent demixing processes and produce assemblies that conditionally recruit Hsp70. If robust Hsf1 activation requires such pH-sensitive protein demixing, then preventing the drop in pH would suppress Hsf1 activation, exactly as we observe. We thus favor this last possibility to explain our results.
Temperature sensing, intracellular pH, and the transcriptional heat shock response
We have previously proposed that stress-triggered protein demixing can take the place of misfolding-induced aggregation in the standard model for Hsf1 activation, with demixing proteins acting as the primary sensors of temperature.22 In the misfolding model of Hsf1 activation, the temperature sensors are the thermally unfolded proteins. Because many thermophilic fungi thrive at temperatures that are lethal for a mesophile such as S. cerevisiae,64 thermal unfolding of most mesophilic proteins is unlikely to reflect a deep physical limitation on protein stability. Rather, the threshold for thermal unfolding is an evolved trait reflecting contributions from selection, drift, and other factors, such that even the misfolding model implies the existence of evolved thermal sensors. However, in the misfolding model, misfolded proteins are both the sensor and the emergency itself: a disastrous accumulation of toxic damaged proteins which triggers the response. Might natural selection have gone one step further to produce sensors capable of triggering a response before a protein-folding emergency occurs? A putative sensor would need to do only what the misfolding model already requires, namely to recruit Hsp70 away from Hsf1 in a temperature-dependent fashion. Formation of toxic species is not required.
What might these sensors be? In previous work we identified dozens of proteins which demix into reversible assemblies in response to heat stress in budding yeast.19 These include multiple cytosolic translation initiation factors long associated with stress granules, as well as several proteins showing extreme heat sensitivity (dubbed “superaggregators”), many of which reside in the nucleus. Nuclear superaggregators are well-positioned to sense temperature changes, demix, and titrate away the population of Hsp70 bound to Hsf1 in the nucleus. Positive identification of one or more sensors would allow testing of various predictions. For example, importing a homologous sensor from a mesophile into a thermophile would be predicted to induce the Hsf1 response at the mesophilic heat shock temperature. Our study opens a new path forward in this search, as we now have identified conditions in which the Hsf1-mediated response is suppressed during an otherwise robust heat shock.
A prediction is that demixing of the sensor(s) should depend on both temperature and pH. We and others have proposed that phase separation of macromolecular components of the cells, some of which have been shown to be pH-dependent in vivo, may act to synthesize or integrate multiple stress signals22, 24—in this case, elevated temperature and reduced pH. When such signals are not coherently received, such as in the experiments presented here where we alter intracellular pH and temperature independently, the response is misregulated and cellular fitness is reduced. We can construct a phase diagram in intracellular pH and temperature space which can predict the phase separation of particular components; at a low enough pH, proteins demix even at ambient temperature. An example of such a phase diagram is shown in Figure 7b. Remarkably, our results from controlling pH and monitoring a chaperone response neatly overlays such a diagram, where extreme acidification (pH 5.0) at ambient temperature (conditions under which Pab1, the stress-sensitive cytoplasmic protein demixes in vitro22) is sufficient to induce the response, albeit to a lesser extent. This finding agrees with a recent study of pH changes during starvation stress; there, the stress-triggered aggregation of a transcription factor, a pH-dependent process, is required for production of glucose-starvation specific genes.25 These demonstrations underscore the contribution of intracellular pH to cellular regulation, as well as the potential utility of integrators which ‘read’ combinations of signals and synthesize this information to initiate an appropriate response.
One notable wrinkle apparent in our data is that the pH and temperature changes need not coincide to elicit a response. This is most clearly demonstrated when heat stress at the resting pH, followed by intracellular acidification at the ambient non-stress temperature, suffices to produce a response, albeit one that is delayed (Figure 2d). The implication is that whatever process is responsible for triggering the downstream signal, which we postulate to be demixing, has at least two steps. Although many possibilities exist, one with some empirical support is a nucleation and growth process in which nucleation is strongly temperature-dependent, while growth depends strongly on pH. Both Pab1 and Pub1 show evidence for this type of behavior.22, 24 Pab1 in vitro, for example, forms large numbers of small, sticky droplets when subjected to elevated temperature, but comparatively fewer and larger separate droplets when subjected to a pH drop at non-stress temperatures. Pub1 shows changes in material properties as temperature increases. A nucleation process dependent on thermally triggered local unfolding, followed by pH- and temperature-dependent demixing (such as phase separation), would explain all of these observations. In this model, heat-triggered formation of nuclei, followed by pH-triggered growth at normal temperatures, would still produce demixing, along with the subsequent response, but with a delay, just as we observe. We note that the timescales of the response are different depending on whether the two signals, pH and temperature, are received coherently or incoherently. Future work is necessary to determine whether a nucleation and growth process can explain these dynamics, or whether other possible explanations, such as activation of two arms of a signaling pathway or even two entirely separate pathways, must be invoked.
Temperature as a physiological signal regulating growth
That extremes of temperature cause protein misfolding which triggers the heat shock response is beyond question: as noted above, misfolded proteins suffice to induce the heat shock response in the absence of heat, and all proteins will thermally denature at some temperature. What is not clear is whether all temperatures trigger the response by causing protein misfolding. Extremes of temperature may not be physiologically relevant to the response, by which we mean reflecting temperatures (and times) encountered by the organism sufficiently often to evolutionarily shape the organism’s response to those conditions.
As an alternative to the misfolding model under many physiological conditions, particularly at the lower end of temperatures which still provoke a response, we favor a model in which heat acts as a signal to initiate a cellular program involving slowed or arrested growth, and in which the induced chaperones mediate exit from this program. This alternative ‘growth-program’ model can incorporate other known aspects of the stress response to explain the role of chaperones: heat and acidification cause certain proteins required for cell-cycle progression to demix into stress granules and other evolved assemblies, slowing or arresting growth; induced chaperones disperse the assemblies, restoring growth and division.
Diverse lines of evidence call basic elements of the misfolding model into question, but can be easily understood in the context of the growth-program model. First, transient heat shock does not trigger the unfolded protein response (UPR) in the ER,33, 65 even though misfolded proteins in the ER trigger the UPR, raising the question of why heat would destabilize protein folding in one cellular compartment but not another. Second, when both stress granules and aggregates of exogenous misfolded proteins are tracked, dispersal of stress granules precedes resumption of the cell cycle while aggregates persist.9 This result indicates that misfolded proteins and endogenous stress-triggered assemblies have distinct biological behaviors, and that growth arrest is not closely tied to the presence of misfolded proteins per se. Third, endogenous stress-triggered assemblies, including stress granules in the cytoplasm and other assemblies in the nucleus and nucleolus, are fully reversible after heat shock, whereas aggregates of misfolded proteins are triaged for degradation.19, 66, 67 Fourth, the Hsf1-mediated program of chaperone induction is triggered under a wide range of conditions such as hypoxia and starvation which, unlike heat shock, do not compromise protein folding in vitro.
By contrast, all of these observations are compatible with the alternative growth-program model. Misfolded proteins are not responsible for stress-dependent cell-cycle regulation, which is instead achieved in part by the demixing states of specific proteins and RNA. Reversibility of assemblies without degradation reflects these assemblies’ roles as regulators rather than damaged byproducts. Because protein misfolding is negligible in this model, there is no expectation that unfolded protein responses in all compartments will be activated. And finally, that the response is deployed during multiple stress conditions, even ones seemingly irrelevant to protein folding, reflects its likely purpose as part of a regulatory strategy to contend with transiently growth-limiting change rather than to contend with protein-destabilizing change.
The natural question then arises: what are the physiological conditions which have shaped the heat shock response of this organism—whatever organism one is studying? What signal is the organism responding to?
The evolutionary importance of temperature as a physiological signal
Temperature acts as a physiological signal in other ascomycete fungi. For example, some dimorphic fungi live and grow in the environment as a mold, and convert into a yeast (a single-celled, reproducing fungus) in response to entering a mammalian host and detecting the resulting increase in temperature, the critical sensory cue.68 The budding yeast and occasional human pathogen Candida albicans similarly requires a temperature increase to trigger the bud-to-hyphae transition critical for infection,69 which also induces chaperones in a classical Hsf1-mediated heat shock response.70 While it is physically possible that these species express proteins which misfold to form toxic aggregates during their pathogenic transitions, such a situation seems unlikely to us, given the existence of many thermophilic species indicating no fundamental barrier to evolving proteins with higher stability.
The foregoing examples are pathogens. What physiological event would prompt the execution of such a heat-shock program in nonpathogenic Saccharomyces cerevisiae? The fact that S. cerevisiae is not airborne and depends upon animal hosts for dispersal,71 along with other facts which we review here, suggests an answer: ingestion and dispersal by birds.
A survey of hundreds of migratory passerine (perching) birds72 isolated yeast species from their cloacae, implying ingestion as the source; 14% of isolates were Saccharomyces cerevisiae. S. cerevisiae survived experimental passage through passerine birds when inoculated in feed.72 Passerine birds, the most numerous on earth, have an internal body temperature averaging 41.6°C (range 39°C to 44 °C) when active, rising to an average of nearly 44°C (43.1 – 47.7) during high activity such as running and flight.73 These temperatures correspond remarkably well to the upper bound of nonlethal temperatures for S. cerevisiae,.74 The acidity of the stomach provides an ample source of protons to drive intracellular acidification.
A prominent ecological niche for Saccharomyces cerevisiae is the surface of fruits such as grapes,71 which birds eat—indeed, vineyard crop damage by passerine birds is a major challenge for the wine industry.75, 76 Yeast proliferate to higher numbers on damaged fruit71 which often results from bird pecking.75, 77 Besides birds, other known dispersing hosts for the Saccharomyces genus include wasps, bees, ants, and fruit flies,71, 78–80 all of which are preyed upon by birds, indicating that yeast may enter an avian carrier by multiple routes. Yeast that survive passage through a bird stand to benefit from broad geographic dispersal, an evolutionary advantage which requires transient survival in a harsh (hypoxic, low-nutrient) acidic environment averaging approximately 42°C. From these lines of evidence, we argue that passage through birds is an evolutionarily advantageous, ecologically established, physiologically relevant heat-shock condition for budding yeast.
Broader considerations
Recognition that a rise in temperature may represent a signal rather than merely a damaging agent alters how one thinks about the purpose of the response to temperature, the response’s mechanistic basis, and the conditions under which the response would be deployed. Here, the suppression of the heat shock response by elevated pH suggests that acidification—and the capacity to acidify, which appears to be determined in large part by extracellular pH—is a key part of the physiological context in which this thermal signal is received. This logic applies broadly. In humans, for example, a key physiological heat shock—fever—triggers the Hsf1-mediated heat shock response.81 Perhaps fever causes new problems for cells, new self-inflicted damage to be cleaned up. Alternatively, however, fever may be acting as a systemic signal which activates a cellular program with key roles in modulating immune and inflammatory responses.81 Indeed, the apoptotic response of human neutrophils to fever temperatures is sharply dependent on intracellular pH, with acidification promoting survival; local acidification is a hallmark of inflammatory conditions and promotes neutrophil activation.13
We began by noting that the biological meaning of the longstanding association of cellular stress with cytosolic acidification, observed from single cells to vertebrate neurons, has remained unclear. Our results speak to a potentially broad effect: that this association in part reflects the dependence of the core Hsf1-mediated transcriptional stress response on pH. The analogous pH-dependence of multiple proteins undergoing thermally triggered demixing, coupled with the known mechanism for regulation of Hsf1, suggests a general mechanism for integrated stress sensing upstream of this universally conserved eukaryotic transcription factor. Moreover, this putative mechanism provides a crucial and potentially general connection between protein demixing and its transduction into adaptive cellular action.
Methods
Yeast strains
Scarless tagging of the Ssa4 protein with mCherry was done in the BY4742 background via serial transformation and fluorophore exchange with the URA3 gene such that no selection cassette remained in the genome. This was done by creating an intermediate strain with URA3 at the C terminus of the SSA4 locus; this sequence was replaced with mCherry and counterselection was done on 5-fluoro-orotic acid (5-FOA). The final strain has the SSA4 gene in the native context with the native stop codon replaced by the mCherry sequence. In the BY4741 background, the coding sequence for pHluorin, under control of the constitutive GPD1 promoter, was incorporated at the LEU2 locus using Leu2 expression as a selectable marker. Strains were purified at least twice by streaking and picking single colonies, before being mated. The resulting strain, yCGT028 with genotype MATa/α ura3Δ0/ura3Δ0 leu2Δ0/pHluorin his3Δ0/his3Δ0 MET15/met15Δ0 lys2Δ0/LYS2 SSA4/SSA4-mCherry, was used for all experiments except those shown in Supplemental Figure S3, which uses strain yCGT032.
Strain yCGT032 was constructed in the same fashion, but with SSA4 fused to a FLAG tag rather than mCherry.
Growth and stress conditions
Yeast cells were grown at 30°C in synthetic complete media with 2% glucose (SC). For all experiments, cultures were started from the same frozen stock, and grown so that the cell density was below optical density (OD) 0.1 for at least 12 hours before stress; a dilution of no more than 20-fold was performed at least 4 hours prior to stress. Cells were grown to between OD 0.05 and OD 0.1 (flow cytometry) or to OD 0.3-0.4 (mRNA-Seq) before being stressed.
All temperature stresses occurred at 42°C for 20 minutes, except for the data in Figure 1d, which was 42°C for 10 minutes.
Flow cytometry
Technical information
Two cytometers were used to collect data: BD Biosciences LSRFortessa and BD Biosciences LSRFortessa-HTS. Both were equipped with 405, 488, 561, and 620 nm lasers. Cells were run on the lowest flowrate possible. Voltage and filter sets used were as follows (two filter sets were used on the HTS instrument):
All individual experiments were performed with the same voltage set, and the fluorescence values reported are normalized to a within-experiment fluorescence baseline (unstressed cells), allowing for direct comparison between experiments taken on different instruments or with different voltage sets.
Unstressed cells were used to determine manual gates on forward and side scatter to isolate cells. Growth conditions (see above section) were such that no significant populations of dead cells were expected. In some experiments a sub-population of cells became highly fluorescent in the BV421 channel. These cells were ambiguously bright in the FITC (488) channel, meaning that they could not be confidently assigned to either strain; although recorded, these cells were excluded from the analysis computationally by threshold gating in the BV421 channel. The percentage of these cells of the total, initially gated population was between 5 and 50%, and varied primarily with handling (no association with pH or treatment).
Dynamic intracellular pH measurements
Cells constitutively expressing pHluorin in the cytoplasm (yCGT028) were grown as described in Growth Conditions above. A 400µL aliquot of cells was loaded onto the flow cytometer at room temperature and the instrument was run continuously for 5 minutes of equilibration. With the instrument still running, the sample tube was briefly removed and 1mL of media at 44°C was added (to account for heat loss in mixing); the tube was rapidly returned to the cytometer and held in a 42°C water bath for 10 minutes, followed by 10 minutes at room temperature.
Sample size and reproducibility
All flow cytometry stress experiments were performed at least in triplicate, with at least 10000 total events (cells) collected at each timepoint. Due to variation among partitioning between populations, the number of events for each sub-category varied, but was never below 1000 cells. All flow cytometry mock experiments were performed at least in duplicate, with the same standard for number of events as stress experiments.
pH manipulation
Calibration curve buffer
50 mM NaCl, 50 mM KCl, 50 mM MES, 50 mM HEPES, 100 mM ammonium acetate, 10 mM 2-deoxyglucose; pH adjusted with HCl or KOH. 10 mM (1000x) nigericin in 95% EtOH was added just before buffer use to a final concentration of 10µM.
pHluorin calibration curve
We used a protocol modified from Valkonen et al 2013.36 Exponentially growing cells (OD 0.05-0.15) were spun out of SC media (3000g for 2–4 minutes) and resuspended in calibration curve buffer at 0.5 pH unit intervals between pH 4.5 and pH 8.5. Cells were equilibrated in buffer at room temperature for 15–30 minutes, and then analyzed by flow cytometry. The calibration curve was generated by taking the median ratio of fluorescence in the 405:525/50 (BV510, pHluorin 405) channel to the 488:525/50 (FITC, pHluorin 488) channel, and fitting the resulting points to a sigmoid:
 where a, b, c, and d are fitting parameters. Ratios were corrected for background by subtracting the autofluorescence of unlabeled (wild type) cells in either media (for samples in media) or buffer (for the calibration curve). A new calibration curve was measured each time an experiment was performed. A representative calibration curve is shown in Figure S1a. A comparison between calibration curves in shown in Figure S1b; although the absolute value of the ratios may vary, the calculated effective pKa of the fluorophore is expected to be consistent across experiments. The effective pKa was calculated using the formula:82

Determining ionophore efficacy at increased temperature
To ensure that the ionophore treatment was effective at elevated temperature, the intracellular pH of cells in calibration curve buffer at 42°C was assessed. Cells were resuspended (at the same ratio of cells:buffer as used in pH manipulation experiments) in calibration curve buffer of varying pH and equilibrated at room temperature for 15 minutes. A small volume was used such that thermal changes rapidly equilibrated. A portion of the cells were analyzed by flow cytometry, and then the remaining samples were placed in a heat block at 42°C. Aliquots were taken at 10 and 20 minutes and analyzed by flow cytometry. The intracellular pH was calculated using a calibration curve generated at 30°C using different buffers. The close correspondence between the measured buffer pH and the calculated intracellular pH from the calibration curve is shown in Figure 2b.
Manipulating intracellular pH during stress
Intracellular pH during stress was manipulated using calibration curve buffer. The concentration of the ionophore was low enough that any anti-microbial effects were negligible, as seen by the small fitness effect on pH-manipulated, unstressed cells (see Figure Supplement S6a and c, ‘RT (mock)’.
1.2mL of cells grown as described in above ‘Growth and stress conditions’ section were spun out of media and resuspended in 60µL freshly prepared calibration curve buffer plus ionophore at the desired pH, equilibrated at room temperature for 15-30 minutes, and then either exposed to 42°C temperature (‘heat shock’) or room temperature (‘mock’) for 20 minutes. After stress, cells were recovered by removing the buffer and resuspending in 1.2 mL of fresh SC media and holding at 30°C with 250 rpm shaking. The fresh SC was either not pH adjusted (with a pH of approximately 4, data shown in Figure 2d, or was buffered to pH 7.4 using 0.1 M Na2HPO4: NaH2PO4 buffer (data in Figure 2e).
Western blotting
yCGT032 was grown in 180mL SC media at 30°C shaking at 250 rpm for 12 hours then harvested at OD 0.026. Three aliquots of 50 mL cells were harvested by spinning at 3000g for 5 minutes. Each aliquot was washed with water and then resuspended in 1mL of a different media: SC, pH 6.8 calibration curve buffer with ionophore, or pH 7.4 calibration curve buffer with ionophore. Cells were equilibrated for 15 minutes at room temperature and then split into two samples, one for heat shock and one for mock treatment. Heat shock was performed by incubating cells in 42°C water bath for 20 minutes. Mock treatment was incubating cells at room temperature for 20 minutes. After treatment, cells were recovered for 60 minutes at 30°C. Protein was extracted by soaking in 0.1M NaOH followed by boiling in Laemmli buffer. Lysates were run on 4-20% SDS-PAGE stain-free gel, and imaged after UV activation to image total protein content. The gel was then transfered to nitrocellulose membrane. Dyed ladder was used as a guide to cut the membrane in half at approximately 50 kilodaltons (kDa). The lower part of the membrane was blotted for Hsp26 using a native antibody, a kind gift from Johannes Buchner. The upper half of the membrane was blotted for FLAG peptide with anti-FLAG (Proteintech 66008-2-ig). Western blots were performed using the 1-hour Western Kit from GeneScript (L00204 and L00205).
mRNA-Seq
Sample preparation
Cells were grown as described in above ‘Growth and stress conditions’ section above, resuspended in 1 mL of freshly prepared calibration curve buffer plus ionophore, and equilibrated for 15 minutes before being heat stressed at 42°C for 20 minutes. Cells were resuspended in SC media and allowed to recover for 5 minutes before being harvested, resuspended and flash frozen in lysis buffer (20 mM Tris pH 8, 140 mM KCl, 1.5 mM MgCl2, 1% Triton-X100). Two biological replicates were collected and averaged to produce data shown in Figure 6. Correlation between the biological replicates is shown in Figure Supplement S8a.
Library preparation
Total cellular RNA was extracted using hot acid-phenol extraction and the resulting RNA was chemically fragmented. Samples were barcoded using a 3’ adaptor with a unique sequence corresponding to each sample, and then pooled for downstream processing, as described in Shishkin et al 2015.50 rRNA was depleted from the pooled samples using the Illumina Ribo-Zero Gold rRNA Removal Kit for Yeast (MRZY1306). Sequencing was performed at the Functional Genomics Core at the University of Chicago. Detailed protocol for library preparation is available; see Shishkin et al. 2015.50
Data processing
Processed data for each sample were generated from raw sequencing reads by identification with the unique sample bar code (allowing at most one mismatch) using custom scripts and then pseudo-aligned, without further processing, using kallisto83 to an in-house generated S288C reference transcriptome including rRNA. The kallisto index was built with standard parameters, quantification was run with the command kallisto quant -i <index file> --single -b 100 -o <output file> -l 380 -s 100 -t 4 <data file>). Output per-gene normalized abundance estimates (transcripts per million, tpm) were used for all downstream analysis.
Heat shock genes
Genes upregulated during heat shock were curated by combining a list of Hsf1 targets from Pincus et al. 201855 and Hsf1 targets and Msn2/4 targets from Solis et al. 2016.3
Stress transcription factor determination
Genes upregulated during stress were assigned to either Hsf1 or Msn2/4 as in Solis et al 2016 and Pincus et al 2018.3, 55 Briefly, the Msn2/4 genes were identified as genes that had a conserved Msn2/4 binding site in the upstream promoter and which were upregulated during heat stress in a strain of yeast where Hsf1 had been acutely deactivated. Hsf1 target genes were determined by differential expression after Hsf1 inactivation using a combination of transcript sequencing (mRNA-Seq), chromatin immunoprecipitation sequencing (ChIP-Seq), and native elongating transcript sequencing (NET-Seq).55
Measuring fitness
Relative growth rate
Competitive growth assays rely on tracking the relative size of two populations of cells as a function of time, and differences in growth rate are inferred from these data. The ratio of two populations, for example pHluorin-expressing (pH) and wild-type (wt) populations, as a function of time is given by the following equation:

Where nx(t) is the number of cells of type x at time t, rx is the instantaneous growth rate (in units of t−1), and  is the initial mixing fraction. This equality is true assuming constant exponential growth, which our data indicate is valid at least for the early stages of recovery (see Figure 4a, right hand side and S6a). We can use this equation to calculate the difference in growth rate, i.e. the fitness loss, for each population of cells having experienced stress at a different intracellular pH.
The reference population (subscript wt in the above equation) is wild-type cells growing exponentially (‘spike’ or ‘spike-in’), which are distinguishable from the pHluorin-expressing strains as they are are not significantly fluorescent in either pHluorin channel. Using a mixture of log-growing unlabeled and stressed labeled cells allows us to compare directly between the different pH and temperature combinations, as all the measured fitness loss values are relative to the same reference. It also implies that the difference rpH - rwt will always be either 0 or negative, since the treatments being compared (pH manipulation either with or without heat shock) can only decrease the growth rate from maximal. To ensure that the pH manipulation itself was minimally stressful, the relative growth of pH-manipulated cells, which experienced 35 min at room temperature in calibration curve buffer with ionophore, was calculated and was found to be extremely close to 0 for all pH values considered (see Figure S6c, ‘RT (mock)’ row).
To control for possible additional, strain-specific differences, we also calculated the relative growth rate when both the wild-type and yCGT028 cells were treated identically (‘mix’ or ‘mix-in’); this value was also found to be nearly zero in every condition examined (see Figure S6c, ‘Mix-in’ column).
Determination of budded fraction
We first computationally isolated the labeled, stressed cells, and then for this population looked at the distribution of values in the Forward Scatter Width channel. It has been shown that values in this channel correspond most closely to cellular volume and size47, 48 because the measurement represents the amount of time spent passing in front of the interrogating laser. We note that there are two populations of cells, which we assign to budded (larger) and unbudded (smaller) cells (Figure S7a). This approach has been previously used to discriminate budded and unbudded cells.49 Tracking the fraction of budded cells as a function of time gives information about cell cycle re-entry in a fashion analogous to the manual counting of budded and unbudded cells as previously performed.46
To verify this labeling, we sorted cells into two populations based on the forward scatter pulse width into 95% ethanol to fix, and then visualized the fixed cells using light microscopy, Figure S7a shows sorting parameters and representative microscopy images. Cells from both populations were scored as either budded (containing an obvious bud that is at least 1/4 the size of the mother cell) or unbudded (having no bud). Full quantification is shown in Figure S7b. Fixed cells were then stained with Sytox to assess cell cycle position following a published protocol,84 and DNA content was analyzed by fluorescence intensity using flow cytometry. The ‘budded’ population contained more cells in the 2x DNA peak, indicating that they were doubling their DNA and were thus actively growing; see Figure S7c.
Code and data analysis
All data analysis was performed with R85 using packages from the tidyverse.86 Plots were made with ggplot2.87 Custom packages can be found on GitHub. Raw data and scripts processing it to produce all figures that appear in this work are available online.
In general, summary lines on plots are moving averages, with the exception of Figure 1c, and Figure 2b (same data) which were fit with local smoothing using the ‘loess’ method in the ggplot287 function geom smooth(). In Figure 2d, the log-transformed data were fit to sigmoids with the form:
 where a, b, c, and d are fitting parameters, and d is constrained to be greater than or equal to 1.
Code for generating all processed data and plots is available in the supplemental information.
Competing Interests
The authors declare no competing interests.
Acknowledgements
Research reported in this publication was supported by the National Institute of Biomedical Imaging And Bioengineering of the National Institutes of Health (NIH) under Award Number T32EB009412, and the National Science Foundation Graduate Research Fellowship under Grant No. DGE-1144082. ARD acknowledges support from the NIH, award number R01 GM109455. DAD acknowledges support from the NIH, award numbers R01 GM126547 and R01GM127406, and from the US Army Research Office, award number W911NF-14-1-0411. The authors thank the University of Chicago Flow Cytometry Core for help with flow cytometry data collection and the Functional Genomics Core at the University of Chicago for assistance with sequencing. The authors also acknowledge members of the Drummond and Dinner labs for helpful comments and discussions.
Footnotes
↵* dadrummond{at}uchicago.edu
References
- [1].↵
- [2].↵
- [3].↵
- [4].↵
- [5].↵
- [6].↵
- [7].↵
- [8].↵
- [9].↵
- [10].↵
- [11].↵
- [12].
- [13].↵
- [14].↵
- [15].↵
- [16].↵
- [17].↵
- [18].↵
- [19].↵
- [20].↵
- [21].
- [22].↵
- [23].↵
- [24].↵
- [25].↵
- [26].↵
- [27].↵
- [28].↵
- [29].↵
- [30].↵
- [31].↵
- [32].↵
- [33].↵
- [34].↵
- [35].↵
- [36].↵
- [37].↵
- [38].↵
- [39].
- [40].
- [41].↵
- [42].↵
- [43].↵
- [44].↵
- [45].↵
- [46].↵
- [47].↵
- [48].↵
- [49].↵
- [50].↵
- [51].↵
- [52].↵
- [53].
- [54].↵
- [55].↵
- [56].↵
- [57].↵
- [58].↵
- [59].↵
- [60].↵
- [61].↵
- [62].↵
- [63].↵
- [64].↵
- [65].↵
- [66].↵
- [67].↵
- [68].↵
- [69].↵
- [70].↵
- [71].↵
- [72].↵
- [73].↵
- [74].↵
- [75].↵
- [76].↵
- [77].↵
- [78].↵
- [79].
- [80].↵
- [81].↵
- [82].↵
- [83].↵
- [84].↵
- [85].↵
- [86].↵
- [87].↵


