

ABSTRACT
We demonstrate that DNA-loops can stochastically propel the site-specifically bound transcription factors towards the promoters. The gradual release of elastic energy stored on the DNA-loops is the source of propulsion. The speed of looping mediated interaction of transcription factors with promoters is several times faster than the sliding mode. Elastic and entropic energy barriers associated with the looping of DNA actually shape up the distribution of distances between transcription factor binding sites and promoters. The commonly observed multiprotein binding in gene regulation is acquired through evolution to overcome the looping energy barrier. Presence of nucleosomes on the genomic DNA of eukaryotes is required to reduce the entropy barriers associated with the looping.
INTRODUCTION
Site-specific binding of transcription factors (TFs) at their cis-regulatory motifs (CRMs) on the genomic DNA in the presence enormous amount of nonspecific binding sites is essential for the activation and regulation of several genes across prokaryotes to eukaryotes (1–3). Binding of TFs with their CRMs was initially thought as a single-step three-dimensional (3D) diffusion-controlled collision process. Kinetic experiments on lac-repressor-Operator system revealed a bimolecular rate in the order of ~109-1010 M−1s−1 that is ~10-102 times faster than the Smolochowski type 3D diffusion-controlled rate limit. Berg et.al. (4, 5) successfully explained this inconsistency using a two-step mechanism by establishing the key concept that TFs first bind with DNA in a nonspecific manner via 3D diffusion and then search for their cognate sites via various one-dimensional (1D) facilitating processes such as sliding, hopping and intersegmental transfers. Here 1D diffusion with unit base-pair step-size of TFs is the sliding, few base-pairs (bp, 1 bp = ld ~ 3.4 × 10⁻¹⁰ m) step-size is called hopping and few hundred to thousand bps step-size is called intersegmental-transfer. Intersegmental transfers occur whenever two distal segments of the same DNA polymer come in nearby over 3D space via ring closure events (6–8).
Specific binding of TFs with DNA is affected by several factors (8) viz. a) conformational state of DNA (8, 9) b) spatial organization of various functionally related combinatorial CRMs along the genomic DNA (10, 11), c) presence of similar or other dynamic roadblock proteins (12) and semi-stationary roadblocks such as nucleosomes in eukaryotes (13–17), d) naturally occurring sequence mediated kinetic traps on DNA (18, 19), e) conformational fluctuations in the DNA binding domains of TFs (20–22) and f) the nonspecific electrostatic attractive forces and the counteracting shielding effects of other solvent ions and water molecules acting at the DNA-protein interface (23). Several theoretical models (7, 8, 18, 21, 24), computational (25–28) and experimental studies have been carried out to understand the effects of factors a-f on the kinetics of site-specific DNA-protein interactions.
In general, the searching efficiency of TFs depends on the relative amount of times spent by them on the 3D and 1D diffusions (10, 21). Clearly, neither pure 1D nor 3D diffusion is an efficient mode of searching (8, 10). Under ideal situation, maximum searching efficiency can be achieved only when TFs spend equal amount of times in both 1D and 3D diffusions (7, 10). This trade off balance between the times spent on different modes of diffusions will be modulated by the factors a-f. For example, presence of nucleosome roadblocks warrants more dissociations and 3D excursions of TFs rather than 1D sliding (29). Sequence specific fast conformational switching of DNA binding domains between stationary and mobile states helps TFs to overcome the sequence traps (29). Relaxed conformational state of DNA enhances more sliding rather than hopping and intersegmental transfers and so on (8). Conformational dynamics of DNA also modulates the speed of gene activation and regulation. In this context, looping of DNA is critical for the activation and expression of various genes across prokaryotes to eukaryotes (3, 30–34). Combinatorial binding of TFs with their specific CRMs on the genomic DNA activates the downstream promoters of genes via looping of the intervening DNA segment to form a synaptosome type complex (1, 35). In most of the molecular biological processes, DNA-loops are warranted for the precise protein-protein interactions which are the prerequisites for transcription and recombination (36).
The statistical mechanics of looping and cyclization of linear DNA has been studied extensively in the literature (33, 37, 38). However, it is still not clear why DNA-loops have evolved as an integral part of the activation and repression of transcription and recombination although such underlying site-specific protein-protein and protein-DNA interactions can also be catered straightforwardly via a combination of 1D and 3D diffusions of TFs (4, 5, 21, 39). That is to say, upon arrival at the CRMs, TFs can directly slide or hop along the DNA polymer to reach the promoters. Schleif (31) had argued that the looping of DNA can simplify the evolution of the genomic architecture of eukaryotes by not imposing strict conditions on the spacing between the TF binding sites and the promoters. This is logical since a given set of TFs need to regulate several different genes across the genome. Therefore, placement of TF binding sites near a specific gene can be a disadvantage for other genes along the genomic evolution. Similarly, placement of TF binding sites near every gene is not an efficient genome design. The DNA loops also play critical roles in the transcription bursting (40) and memory (41). It is not clear how exactly the DNA-loop is formed between the CRMs and promoters via TFs though Rippe et.al., (32) had already taken several snapshots of the looping intermediates. In this paper, we will show that the DNA-looping combined with an asymmetric binding energy profile can stochastically propel TFs towards the promoters along DNA. Using computational tools, we further demonstrate that the looping mediated propulsion or tethered sliding of TFs along DNA can actually help in finding the direction of the promoter region and also shape up the genomic architecture.
THEORETICAL FORMULATION
Let us first list out the basic facts observed on the mechanism of distal action of CRMs-TFs system on the downstream promoters in the process of transcription activation. Firstly, both theoretical investigations (4, 5, 7, 8, 21) and experimental observations (42, 43) suggest that TFs recognize their CRMs via a combination of 1D and 3D diffusions. The key idea here is that TFs scan a random piece of DNA via 1D diffusion after each of the 3D diffusion mediated nonspecific collisions (4, 8, 21). On the contrary, the reacting molecules dissociate immediately upon each of their unfruitful collisions in the standard Smolochowski model. When the dynamics of TFs is confined within the Onsager radius of the DNA-protein interface, then it is categorized as the 1D diffusion. When TFs escape out of the Onsager radius and perform free 3D excursions, then we classify it as the 3D diffusion (8). The Onsager radius connected with the DNA-protein interface is defined (8) as the distance between the positively charged DNA binding domains of TFs and the negatively charged phosphate backbone of DNA at which the overall electrostatic energy is same as that of the background thermal energy (equals to ~1 kBT) (Section 1, Supporting Materials). Secondly, transcription activation is achieved upon the distal communication between the CRMs-TFs complex with the RNAP-promoter complex (1–3). Thirdly, binding of TFs at CRMs locally bends the DNA and the DNA-loops connecting CRMs-TFs with the promoters are observed in most of the transcriptionally active genes of eukaryotes (3, 44).
Clearly, TFs activate transcription via two sequential steps viz. they bind their CRMs in the first step and then distally communicate with the promoter-RNAP complex in the second step to initiate the transcription event. To understand the role of DNA-loops in the transcription activation, we consider two possible scenarios viz. looping mediated versus a hypothetical pure 3D1D diffusion mediated distal communication between the CRMs-TFs and the promoters. In both these scenarios, TFs locate their respective CRMs via a combination of 1D and 3D diffusion in the first step. They differ only in the second step where TFs dissociate from their CRMs and communicate with the promoters via a combination of 1D and 3D diffusions in the second case whereas the distal communication will be through the DNA-loops in the first case. We denote the search time required by TFs to locate their CRMs in the first step of transcription activation as τS. Clearly, those factors a-f listed out in the introduction section significantly modulate this quantity. We will not recalculate this here since enormous amount of literature already exists (see Section 1 of the Supporting Materials) on the derivation of this quantity under various conditions (8, 18, 21, 45). In the following sections, we will compute the mean time required by CRMs-TFs complex to communicate with the promoter via DNA-loops in the second step of the transcription activation.
Preliminary assumptions
Upon observing the open synaptic complexes of transcriptionally active genes of eukaryotes with DNA loops, one can conclude that TFs which activate transcription via DNA-loops have at least two different DNA binding domains (DBDs) viz. one corresponds to the CRM (DBD1) (Fig. 1) and the another corresponds to the binding site that is located proximal to the promoter (DBD2) region. For example, the tetrameric Lac I complex binds two different Operator regions that induces looping of DNA (2, 3). However, in this case the tetramers of repressor molecules bound at these two different binding sites communicate via protein-protein interactions among them. The DNA-loop is stabilized by an octamer form of the Lac I repressor protein. Such mechanisms are common in case of multiprotein mediated DNA-looping and transcription activation. We further assume that TF reaches its specific binding site in the first step via a combination of 3D and 1D diffusions (4, 5, 7, 21, 46) in line with two-step DNA-protein interaction model and subsequently bends the DNA upon site-specifically binding their CRMs (32, 33).

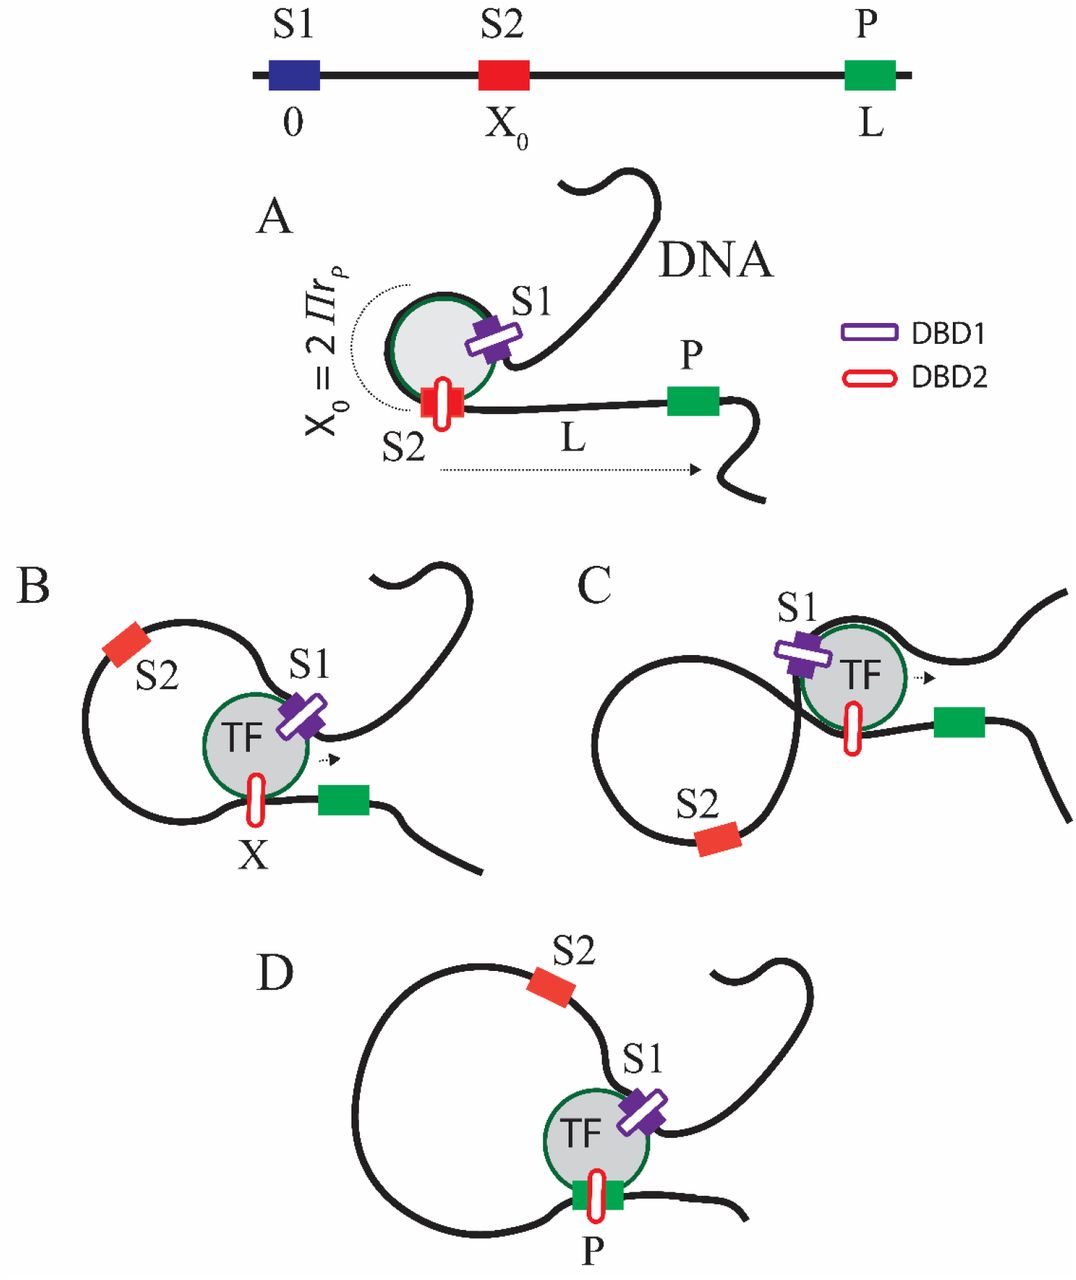
A. Looping mediated stochastic propulsion of TF with radius of gyration of rP along DNA. Here TF has two binding sites corresponding to viz. its cis-regulatory module (DBD1) located between S1 and S2 and the promoter (DBD2). Binding of TF with its specific site (that spans for a length of X0 from S1 (X = 0) to S2 (X=X0)) bends the DNA segment into a loop around it such that X0 = 2πrP. The bending energy stored in the site-specific complex will be incrementally released via bulging of DNA around the TF. B. When the binding energy near S1 is stronger than S2, then the TF can be stochastically propelled towards the promoter (P) that is located at L. Upon reaching there, DBD2 of TF interacts with the promoter to form a specific synaptic complex. C. DNA-loop configuration utilized for gene silencing. D. Synaptosome where TF is bound with both its specific binding site and the promoter via DNA-loop.
Energetics of the site-specific binding of TFs and bending of DNA
Let us assume that the radius of gyration of the TF of interest is rP. Upon binding its cognate stretch of DNA with size of X0 bp located in between S1 to S2, the TF bends the DNA segment into a circle around its spherical solvent shell surface such that X0 = 2πrP as shown in Fig. 1A. We set X = 0 at S1 and X = X0 at S2 where Xis the current location of the DBD2 of TF on DNA. S1 is the specific site for DBD1 and P is the specific site for DBD2 by definition. Here DNA under consideration spans over the range (0, L) as in Fig. 1B and Xis the current loop-length. The total energy required to bend a linear DNA will be the sum Ebend = Eelastic + Eentropy. For the radius of curvature rP, one finds that  (measured in kBT units) where a is the persistence length of DNA (37, 47). Clearly, Eelastic required to bend the DNA segment of length X into a circle will be Eelastic ≃ 2π2a/X. This energy has to be derived either solely from the site-specific binding energy of TFs or via an external energy input in the form of ATP hydrolysis (48). Noting that Eentropy ≃ (3/2) ln (πX/6) (Eq. A1 of Appendix A) one finally arrives at the following expression for the overall bending energy.

Clearly, Ebend attains a minimum value as  at XC = 4π2a/3. In the later sections, we will show that this non-monotonic behavior of the bending energy profile will restrict the possible distances between the CRMs and their corresponding promoters.
Looping mediated communication between CRMs-TFs and promoters
When TFs bind their CRMs in the first step of transcription activation, then the site-specific binding energy (Ebind) released at the DNA-TF interface dissipates partially as the elastic energy required to bend the DNA chain (Eelastic), partially to form specific non-covalent bonds (Ebond, the enthalpic component) and partially as the energy required to compensate the chain entropy loss (Eentropy) at the specific binding site. Clearly, Ebind = Ebond + Ebend where Ebend Eelastic + Eentropy. Therefore, the overall free energy stored by the site-specific CRM-TF complex is given by E ≃ Ebond + Eelastic. This is the overall potential energy barrier which acts on any kind of distortion or dissociation of the site-specific CRMs-TFs complex. Conversely, Ebend is the potential energy barrier that resists the formation of loops out of linear DNA.
The free-energy stored in the site-specific DNA-TF complex (E) can undergo three different modes of dissipation viz. 1) thermal induced physical dissociation of TF from DNA in which both bonding and elastic energies dissipate into the heat bath along with increase in the chain entropy, 2) physical dissociation of only DBD2 from S2 and its re-association somewhere via looping over 3D space (which is resisted by the loop-length dependent potential energy barrier Ebend) while S1-DBD1 is still intact as modelled by Shvets and Kolomeisky (49), 3) stochastic propulsion of TF on DNA via sliding of DBD2 towards the promoter which can be achieved by gradual increase in the value of X from X0 towards L and 4) tethered sliding of DBD2 with intact DNA-loop and DBD1-S1 interactions. In the propulsion mechanism, mainly the elastic energy dissipates that causes bulging of the DNA-loop around TF. The chain entropy does not increase much here since the intervening DNA is still under loop conformation. This is similar to the sliding of nucleosomes via bulge induced reptation dynamics of DNA (29, 50, 51). The probability associated with the spontaneous dissociation will be inversely correlated with Ebond and positively correlated with Eelastic. Generally, dissociation will be an endothermic process since Ebond > Eelastic. Clearly, physical dissociation will not be the most probable route of dissipation of the energy stored in the site-specific DNA-TF complex.
With this background, the DBD2 of TF needs to distally interact with the promoter in the second step and activate the transcription via looping of the intervening DNA segment that connects the CRMs and the promoter. There are two different possibilities viz. tethered sliding of DBD2 of TF with intact DBD1-S1 and a stochastic propulsion of TFs with intact DBD1-S1. Shvets and Kolomeisky (49) have recently studied another interesting model with repeated binding-unbinding of DBD2 with intact DBD1-S1. However, in their model sliding of DBD2 of TF was not allowed. All the symbols used in this paper are listed in Table S1 of the Supporting Material. In the following sections, we will develop our stochastic propulsion and tethered sliding models in detail.
Stochastic propulsion model
When the binding energy profile of TF is such that the bonding energy near S1 is much higher than S2, then the bending energy stored in the site-specific TF-DNA complex can be gradually released via bulging of the DNA-loop around TF which in turn stochastically propels the sliding DBD2 of TF towards the promoter located at L as shown in Fig. 1B. There is no straightforward experimental evidence for this model. However, one can construe this idea indirectly from various other experimental studies. Particularly, Rippe et.al (32) have studied NtrC (Nitrogen regulatory protein C) system using the scanning force microscopy. In this study, they had taken snapshots of various intermediary states along the process of transcription activation from the closed to the open promoter complex. In their model system, binding of NtrC at its specific site (CRM) activates the downstream closed complex of glnA promoter-RNAP-σ54 via looping out of the intervening DNA segment. They have shown that the transition from the inactive-closed form to an active-open promoter complex involved a gradual increase in the bending angle of the intervening DNA. This in turn is positively correlated with an increase in the radius of curvature of the intervening DNA segment which is represented as bulging of the DNA-loop in our propulsion model. Therefore, our assumption that the propulsion of TFs via increase in the radius of curvature of the bent DNA is a logical one. Here the asymmetric binding energy profile is essential to break the symmetry of the stochastic force acting on the sliding TFs (52). This is also a logical assumption since S1-DBD1 is a strong site-specific interaction and S2-DBD2 is approximately nonspecific interaction by definition. Fig. 1C shows another possibility in the formation of DNA-loop which is common in case of silencing mode of TFs. Based on these, the dynamical position X of TF on DNA obeys the following Langevin type stochastic differential equation (53–55).

In Eq. 2, F(X) = −dE/dX = 2π2a/X2 (bp−1) is the force acting on TF that is generated by the bending potential E ~ Eelastic + Ebond upon bulging of the DNA-loop, Γt is the Δ-correlated Gaussian white noise and Dc (bp2/s) is the 1D diffusion coefficient of the sliding of TF. The energy involved in the bonding interactions will be a constant one so that it will not contribute to the force term. Here we ignore the energy dissipation via chain entropy of bulging DNA-loop mainly because binding of TFs at their specific sites attenuates the conformational fluctuations at the DNA-TF interface (7, 20, 21). The Fokker-Planck equation describing the probability of observing a given X at time t with the condition that X = X0 at t = t0 can be written as follows (53, 54).

The form of F(X) suggests that it can propel the DBD2 of TF only for short distances since limX→∞ F(X) = 0 although such limit will be meaningless for X> 2π2a where Eelastic will be close to the background thermal energy. Initial condition for Eq. 3 will be P(X, t0 | X0, t0) = δ(X − X0) where X0 = 2πrP and the boundary conditions are given as follows.

Here X0 acts as a reflecting boundary for a given size of TF and L is the absorbing boundary where the promoter is located. The asymmetric energy profile with respect to S1 and S2 is required for the validity of the reflecting boundary condition at X0. Upon reaching the promoter via loop-expansion of the intervening DNA segment, TFs subsequently activate the transcription. The mean first passage time TB(X) associated with the DBD2 of TF to reach the promoter location L starting from arbitrary X ∈ (X0, L) obeys the following backward type Fokker-Planck equation along with the appropriate boundary conditions (6, 7).

The integral solution of Eqs. 5 can be expressed as follows.

Here  (56) and interestingly limL→∞ TB(X) = TN(X). Here TN(X) is the mean first passage time required by the DBD2 of TF to reach L via pure 1D sliding in the absence of DBD1 which is a solution of the following differential equation (6, 7, 21).

To obtain the target finding time, one needs to set X = X0 in Eqs. 6 and 7. One can define the number of times the target finding rate of TF can be accelerated by the looping mediated propulsion of TF over 1D sliding as ηP = [TN(X0)/TB(X0)] (here the subscript ‘P’ denotes the propulsion model) which is clearly independent of DC of TF and solely depends on (L, a, and X0). Explicitly one can write it as,

Detailed numerical analysis (see Section 2 of the Supporting Material) suggests that there exists a maximum of ηP at which ∂ηP/∂L = 0 with L = Lopt and clearly, we have limL→∞ ηP = 1 (Figs. 2A and B). This is logical since when L > Lopt then ηP → 1 and when L < Lopt then the stored energy is not completely utilized to propel the DBD2 of TF. Further, limL→X0 ηP = 0 since its numerator part goes to zero much faster than the denominator (Fig. S1). The total time required by the TFs to form a synaptosome complex via propulsion mechanism will be τP = τS + TB(X).

A. Relative efficiency of looping mediated stochastic propulsion of TFs versus normal 1D sliding along DNA. TN(X0) is the mean first passage time that is required by TFs to reach the promoter that is located at L, starting from X0 via 1D sliding. TB(X0) is the mean first passage time required by TFs to reach L starting from X0 via looping mediated stochastic propulsion mechanism. X0 was iterated as (25, 50, 75, 100, 125, 150, 200) along the arrow while iterating L from X0 to 1000. The efficiency of looping mediated sliding is strongly dependent on the persistence length of DNA (a), L and X0 and it is a maximum at Lopt ~ 3X0. B. Plot of dηP/dL with respect to L. Here the settings are a ~ 150 bp and X0 ~ 50 bp and L was iterated from 50 to 1000 bp. Upon solving dηP/dL = 0 for L numerically one finds that Lopt ~ 142.2 bp. C. Variation of Lopt with respect to X0. Clearly Lopt ~ 3X0, is slightly dependent on the persistent length a. Here we have iterated X0 from 50 to 100 bp and a = (150, 250) bp. The solution for L was searched within the interval (50, 1000) bp. D. Variation of Lopt with respect to changes in a. Here we have iterated a from 100 to 200 bp and X0 = (125, 150, 200) bp. The solution for L was searched within the interval (50, 1000) bp. The error in the approximation Lopt ~ 3X0 seems to be < 10% over wide range of a values.
Predictions of the propulsion model
The persistence length of DNA under in vitro conditions is a ~ 150 bp and the radius of gyration for most of the eukaryotic TFs will be in the range rP ~ 10-15 bp. Therefore, one can set the initial X = 2πrP ~ 50-100 bp (57, 58). Simulations (Fig. 2A) of the expression for ηP (Eq. 7) at different values of X0 and, L from X0 to 105 suggested that Lopt ~ 3X0 (see Figs. 2C and 2D). When a ~150 bp and X0 ~ 50-100 bp, then Lopt ~ 150-300 bp. Remarkably, this is the most probable range of the distances between the CRMs and promoters of various genes observed across several genomes (59). The efficiency of the stochastic propulsion will be maximum at Lopt. Although Lopt is not much affected by a, the maximum of ηP is positively correlated with a. This is logical since the stored elastic energy is directly proportional to the persistence length of the polymer. Remarkably, at the optimum Lopt the speed of interactions between CRM-TFs complex with the promoters will be ~10-25 times faster than the normal 1D sliding.
Tethered sliding model
In this model, the tethered DBD2 of TF searches for the promoter region with intact site-specific bonding interactions at DBD1-S1. Actually, DBD2-S2 is a nonspecific type binding interaction by definition and the corresponding specific interactions occur whenever DBD2 finds the promoter region (P) and forms the site-specific DBD2-P complex. Here the tethered random walker (DBD2, which is actually tied with the DNA thread at DBD1-S1) wanders over 3D space and randomly forms nonspecific contacts with other segments of same DNA polymer analogous to the ring-closure events of intersegmental transfers. Before dissociation, there is always a possibility for the DBD2 to scan the DNA of random length for the presence of its specific site P. When the length of DNA connecting DBD1 and DBD2 is X for an arbitrary nonspecific contact of DBD2, then the potential energy barrier acting on such random scanning will be E ≃ (2π2a/X) + (3/2) ln(πX/6). Interestingly, this potential energy barrier attains a minimum as Emin = [3/2](1 + ln(2π3a/9)) at XC = 4π2a/3. Forward and reverse movement of such tethered random walker drives X to X + 1 or X − 1. Contrasting from the propulsion model, here we have not ignored the entropy component of the potential E since the interconnecting DNA segment is in free loop form. The force generated by such potential will be F(X) = 2π2a/X2 − 3/2X. Upon inserting this force term in to Eq. 5 one finally obtains the following result.

Here  is the error function integral (56), and TU(X) is the MFPT required by a tethered random walker to find its specific site located at L starting from X (this is the initial loop length) anywhere within (X0, L) where X0 is a reflecting boundary and L is an absorbing boundary. Since the potential function has a minimum at XC, one can consider the following two different limiting regimes.

One can define the number of times the target finding rate of TF can be accelerated by the tethered sliding of TF as ηS = TN(X)/TU(X) (here the subscript ‘S’ denotes the tethered sliding model) which is clearly independent of DC of TF and solely depends on (L, a, and X0). Contrasting from the propulsion model, one finds thatlimL→∞ ηS = 0. In these calculations we have not included the looping mediated nonspecific association time required by the DBD2 of TF. This in fact further increases the overall MFPT of the tethered sliding model. The rate associated with the formation of the initial (nonspecific contact) loop with length X can be written as kNL ≃ kt exp (−E) where kt (s−1) is the maximum achievable rate under zero potential. Clearly, kNL will be a maximum at XC which is the most probable initial landing position of the tethered DBD2 via DNA-looping. The total time required by the CRMs-TFs system to form the synaptosome complex in this model will be τTS = τS + 1/kNL + TU(X) which will attain a local minimum approximately at X = XC. One can also define ηNL = kNL/kt which will attain the maximum value ηNL ~ 6.7 at XC.
Predictions of the tethered sliding model
Tethered sliding model predicts the most probable distance of the CRMs of TFs i.e. S1 from the transcription start sites as XC. At this distance, the rate of looping mediated synaptosome complex formation of TFs will be at maximum. Upon setting X = XC in ηS and numerically iterating L from 3000 to 10000 bp with a ~ 150 bp. When the left reflecting boundary was at X0, then one finds the critical distance LC such that ηS > 1 when L < LC and approximately ηS < 1 when L > LC. Particularly when X0 < 100 bp, one can define the critical distance of TSS from CRM in the tethered sliding model as LC ~ 3XC. This critical distance decreases with increase in X0. These numerical results are demonstrated in Fig. S3 of the Supporting Materials.
COMPUTATIONAL ANALYSIS
The core assumptions of the propulsion model are 1) TFs have two different DNA binding domains (DBD1 and DBD2), 2) correspondingly there should be two different binding sites (S1 and S2) in the upstream region (CRMs) of the transcription start site (TSS), 3) out of which one that is closer to TSS should be weaker in binding strength than the one that is far away from TSS. This in turn creates the required asymmetry in the binding energy profile of TFs with the CRMs. The main prediction of the propulsion model is 4) that Lopt ~ 3X0 where Lopt is the optimum distance between the CRMs and the promoters and X0 is the distance between the two different binding-sites of TFs (S1 and S2) within the cis-regulatory module. 5) Tethered sliding model predicted the most probable distance of the CRMs (S1 corresponding to DBD1) of TFs from the transcription start site as XC = 4π2a/3 ~ 2000 bp for a ~ 150 bp.
Datasets and analysis
To check whether such TF s-CRMs systems with properties 1) to 5) exist, we analyzed the upstream 5000 bp sequences of various genes of human and mouse genome. We used the position weight matrices of various transcription factors of human and mouse available with the JASPAR database and scanned upstream sequences of all the genes in the respective genome. The upstream 5000 bps sequences of various genes of human and mouse genomes were obtained from UCSC genome database (February 2009 assembly, hg19 version for human genome and December 2011 assembly, mm10 version of mouse genome) and position weight matrices (PWMs) (60, 61) of various TFs of mouse and human were obtained from the publicly available JASPAR database (62, 63). There were 21929 sequences from mouse genome and 28824 sequences from the human genome. Using the PWMs of various available TFs we generated the score table for various upstream sequences based on the following equation (60).

In this equation Sv,i is the score value of PWM at ith position upstream of the transcription start site on vth sequence, q is the length of binding stretch of the corresponding TF, fb is the background probability of observing base b in the corresponding genome, and fb, w is the probability of observing base b at position w of the specific binding sites of TFs. Here fb was calculated from the random sequences of the given genome available with the UCSC database. We considered only those TFs showing two different putative binding sites upstream of the promoters of various genes. This will prove our second assumption. The binding site close to TSS is S2 and the one away from TSS is S1 by definition. The distance between these sites is X0. We also constructed the distribution of the distances of S1 and S2 from the transcription start site. There is a strong positive correlation between the score value and the binding energy of TFs (60). Therefore, the sign of the differences in the score values of these two putative binding sites of a given TF will give the information regarding the direction of the asymmetry of the binding energy profile that is required to prove our third assumption. Here the absolute distance between these binding sites will be X0 and the distance between them from the transcription start site will be the L of our model. Checking for the relationship Lopt ~ 3X0 will prove the forth proposition of our model. Computing the distribution of the distances of S1 from the TSS will confirm the validity of the fifth proposition predicted by the tethered sliding model.
In parallel, we also generated score table for random sequences using the same PWM from which we obtained the score distribution and the cutoff score value for the given weight matrix corresponding to a given p-value. In our calculations, we have set the p-value < 10−6 for defining the putative specific binding sites of TFs. We used the random sequences associated with each genome that is available at UCSC database to compute the probability of occurrence of putative binding sites by chance. We considered random sequences of size 5 × 10⁶ bps and fragmented it into 103 number of sequences with length of 5000 bps. Then we scanned each random sequence with the same PWM and obtained the number of putative CRMs (false positives). The probability of observing a CRM site by chance will be calculated as pNF = number of false positives / 1000.
RESULTS AND DISCUSSION
The main limitation of the propulsion model is the requirement of huge energy input involved in the initial bending of DNA around the TF of interest. This needs to be derived either in the form of ATP hydrolysis or in the form of binding energy derived from the combinatorial multiprotein TFs. For example, bending of a linear DNA with size of 50-100 bp into loop requires the hydrolysis of at least 3-5 ATPs (using Ebend = Eelastic + Eentropy, 1 ATP ~ 12 kBT). Investment of such energy input is required by CRM-TF system to actively slide in a directional dependent manner towards the promoter. On the other hand, tethered sliding of TFs does not require such huge energy input since there is no restriction on the initial loop length. As a result, directional dependent movement of TFs is not possible in the tethered sliding model. However, the probability density function associated with the initial loop length will be dictated by the bending energy profile. Actually, Ebend will be a minimum at XC ≃ 4π2a/3 where the average search time required to form the synaptosome complex will be at minimum (49). When X < XC then Ebend ∝ X−1. When X > XC then Ebend ∝ ln(X). When a ~ 150 bp and XC ~ 2000 bp then the minimum of Ebend ~ 13 kBT which requires the hydrolysis of at least 1 ATP. These results are demonstrated in Fig. 3. Including the models presented in this paper, one can consider the following four possible modes.
Propulsion mechanism. This requires huge free energy input in the initial loop formation with a possibility of directional dependent movement of TFs towards the promoter.
Tethered sliding mechanism. This required minimal free energy input in the formation of initial loop. Although the directional dependent movement of TFs is not possible here, the free energy barrier involved in the initial loop formation stage restricts the initial landing position of DBD2 of TFs close to the promoters.
Repeated binding-unbinding mode. This mechanism is similar to tethered sliding mode with restrictions on the sliding dynamics. Here the searching for the promoters is achieved via repeated binding-unbinding of the tethered TFs. Directional dependent movement of TFs along DNA is not possible in this mode.
Parallel searching of two DBDs of TFs. Here two different DBDs of TFs (DBD1 and DBD2) search for their cognate sites on DNA (S1 and P respectively) independently through a combination of 1D and 3D diffusions. When these DBDs binds their cognate sites simultaneously, then the looping of the intervening DNA segment occurs as a result. However, this mechanism works well only for the single TF based transcription activation such as Lac I system and it is almost improbable for the combinatorial binding of TFs in the gene regulation of eukaryotes. However, this mode can be a parallel (but slow) pathway of loop formation for the above said mechanisms.

Variation of the propulsion efficiency ηP and bending energy with respect to changes in the initial loop length X0. Here the settings are a ~ 150 bp, L = 3X0 ~ Lopt. We computed ηP = TN(X0)/TB(X0) with L = 3X0 so that ηP will be close to its maximum. Here the subscript Z = (entropy, bend, elastic, enthalpy). Ebend = Eelastic + Eentropy where Eelastic ≃ 3000/X0 and Eentropy ≃ 3ln(πX0/6)/2 which is ~12 kBT at X0 ~ 2000 bp. Eelastic ≤ 1 kBT when X0 ≥ 3000 bp. Clearly, the bending energy of linear DNA is always ≥ 12 kBT irrespective of the length. Shaded regions are the most probable X0 values observed in the natural systems where the optimum distance between the transcription factor binding sites and promoters Lopt ~ 3X0 ~ 150-300 bp.
The analysis results on the upstream sequences of various genes of human and mouse are shown in Figs. 4A and B. Clearly, there are several TFs with two different putative binding sites (S1, S2) upstream of the transcription start sites. Out of these, S1 is away and S2 is close to the TSS. The distributions of the distances of S1 and S2 from the respective TSS are shown in Fig. 5A1-2, B1-2. The distributions of the distances between S1 and S2 are shown in Figs. A3 and B3. The distributions of the asymmetry in the binding energy profiles of S1 and S2 are shown in Figs. A4 and B4. Although our computational analysis suggested that L ~ 3X0 is not a strict rule applicable to all the genes, several such CRMs-TFs systems follow the prediction of the propulsion model i.e. Lopt ~ 3X0 where X0 is the distance between S1 and S2, and Lopt is the optimum distance of S2 from the transcription start site. Although the most probable location of S2 is close to the promoter region, the most probable location of S1 seems to be around ~2500 bp away from the promoter in both mouse and human genome. This is in line with the tethered sliding model which predicted the critical distance of CRMs from the promoter to be around XC ~ 2000 bp. The asymmetry in the relative binding strengths of these sites seems to be equally probable both towards as well as away from the transcription start site.

Blue dots are the computed distances between the putative cis-regulatory modules and L is the distance of them from the transcription start site. We considered the position weight matrices of human and mouse available with the JASPAR database and scanned the upstream 5000 bp sequences of various human and mouse genes. When there are two such putative CRMs, then the distances between them were computed along with their distances from the transcription start sites. Propulsion model suggested that Lopt ~ 3X0. Although our computational analysis suggested that this is not a strict rule applicable to all the genes, there exist several such CRMs-TFs systems which follow the prediction of the propulsion model. A. Mouse. B. Human.

Computational data analysis results. The tethered sliding model predicted the most probable distance of the CRMs of TFs from the transcription start sites as XC ~ 2000 bp for a persistence length of DNA as a ~ 150 bp. The distribution of the upstream location of CRMs of various TFs shows a maximum around ~2500 bp (A1, B1). Putative binding sites were defined with a p-value < 10−6. This is in line with the tethered sliding model. Though the asymmetry in binding energy profiles of S1 and S2 is observed, there is no preferential directionality which is evident from the symmetry in the sign of the differences of the PWM score values of S1 and S2. The probability of observing a CRM site by chance will be calculated as pNF < 10−3. A1-4. Mouse. B1-4. Human.
Limitations of the models
In multiprotein mediated DNA looping, there is always a possibility for two different TFs interact with S1 and P respectively and the looping is mediated via protein-protein interactions among these TFs. In both propulsion and tethered sliding models, we have assumed that the nonspecifically bound DBD2 of TF does not dissociate until reaching the promoter. Nevertheless, earlier studies suggested that this assumption is valid only for the average sliding length of TF  where kr is the dissociation rate constant (7) that is defined as
  where
where  and μNS is the average nonspecific binding energy associated with DBD2 of the TF of interest. Clearly μNS > 12 kBT is required to attain LS ~ 300 bp which can be achieved via multiprotein binding.
In the absence of energy input, biological systems can overcome the looping energy barrier via three possible ways viz. 1) multiprotein binding (38) which could be the origin of the combinatorial TFs in the process of evolution, 2) placing sequence mediated kinetic traps corresponding to DBD2 in between CRMs and promoters (18) and, 3) placing nucleosomes all over the genomic DNA to decrease the Eentropy component. All these aspects are observed in the natural systems. In multiprotein binding, the free energies associated with the DNA-protein and protein-protein interactions among TFs will be utilized in a cooperative manner for the looping of DNA. Here DBD1 and DBD2 may come from different proteins. Vilar and Saiz (38) had shown that the looping of DNA would be possible even with small concentrations of TFs when the number TFs in a combination is sufficiently large. Multiprotein binding eventually increases X0 values. However, increasing X0 will eventually decreases both the maximum possible acceleration of TF search dynamics and the energy barrier associated with the DNA-looping. As a result, natural systems have optimized X0 between these two-opposing factors for maximum efficiency via manipulating the number of TFs in the combinatorial binding.
CONCLUSIONS
In summary, for the first time we have shown that DNA-loops can stochastically propel the transcription factors along DNA from their specific binding sites towards the promoters. We have shown that the source of propulsion is the elastic energy stored on the specific looped DNA-protein complex. Actually, elastic and entropic energy barriers associated with the looping of DNA shape up the distribution of distances between TF binding sites and promoters in the process of evolution. We argued that the commonly observed multiprotein binding in gene regulation might have been acquired over evolution to overcome the looping energy barrier. Presence of nucleosomes on the genomic DNA of eukaryotes is required to reduce the entropy barrier associated with the looping.
APPENDIX A
The energy component Eentropy that is required to compensate the chain entropy loss for a Gaussian chain can be computed as follows. Let us assume that the looping of DNA occurs when  where
where  is the end-to-end distance vector, ξ is the minimum looping-distance (in m) and Xld is the maximum length of the DNA polymer. The probability density function of the vector
  (64, 65) where X is the number of monomers in the polymer and b is the average distance between the monomers. The entropy loss upon looping of DNA is ΔSloop ≃ ln (Pl/PΩ) (measured in kB units) where
  is the probability of finding the loops and
  is the probability of finding all the configurations including loops. Explicitly one can write down as,

Here Erf  is the error function (56). When ξ ≃ b ≃ ld is very small then
  for large values of X (49). This expression for the entropy is closely linked with the Jacobson-Stockmayer factor, or J-factor associated with polymer looping (37). One finally obtains Ebend ≃ 2π2a/X + (3/2)ln (πX/6).
REFERENCES


