

Summary
Reproductive history and body weight are two important breast cancer risk factors. Prior pregnancy (parity) reduces lifetime risk by up to 50%, and obesity reduces premenopausal risk by up to 45%. Here, we use single-cell RNA sequencing to directly link these risk factors with tumor-protective changes in epithelial cell proportions and hormone signaling in the premenopausal breast. We show that parity reduces the proportion of transformation-susceptible luminal cells and increases the proportion of tumor-suppressive myoepithelial cells in the epithelium. Additionally, we identify two distinct mechanisms by which parity and obesity contribute to reduced hormone signaling. First, parity reduces the per-cell transcriptional response to ovarian hormones in hormone-responsive cells. Second, parity and obesity reduce the overall proportion of hormone-responsive cells. Both mechanisms lead to a decreased paracrine signaling response in myoepithelial cells. Together these findings provide mechanistic insight into how BMI and parity affect the mammary epithelial microenvironment to modify breast cancer susceptibility.
Introduction
Reproductive history and body weight are two major risk factors for breast cancer. Pregnancy has two opposing effects on breast cancer risk: it increases short-term risk by up to 25% (Lambe et al., 1994) but decreases lifetime risk by up to 50%, particularly for women with a first pregnancy early in life (Britt et al., 2007). Likewise, obesity has opposing effects on breast cancer risk before versus after menopause: it increases postmenopausal risk by around 30% (Reeves et al., 2007) but decreases premenopausal risk by up to 45% (Premenopausal Breast Cancer Collaborative Group et al., 2018; van den Brandt et al., 2000). The mechanistic link between pregnancy and the long-term reduction in breast cancer risk remains an open question, but it has been speculated that the effects of pregnancy-induced lobuloalveolar differentiation— such as changes in the epithelial architecture of the mammary gland or a general decrease in the hormone-responsiveness of the epithelium —may contribute to the reduced risk (Figure 1A) (Britt et al., 2007; Russo et al., 1992). While estrogen production by adipose tissue is a major mechanism proposed to contribute to the increased risk of postmenopausal breast cancer in obese women (Cleary and Grossmann, 2009), far less is known about the underlying mechanisms that link obesity and the decreased risk of premenopausal breast cancer.
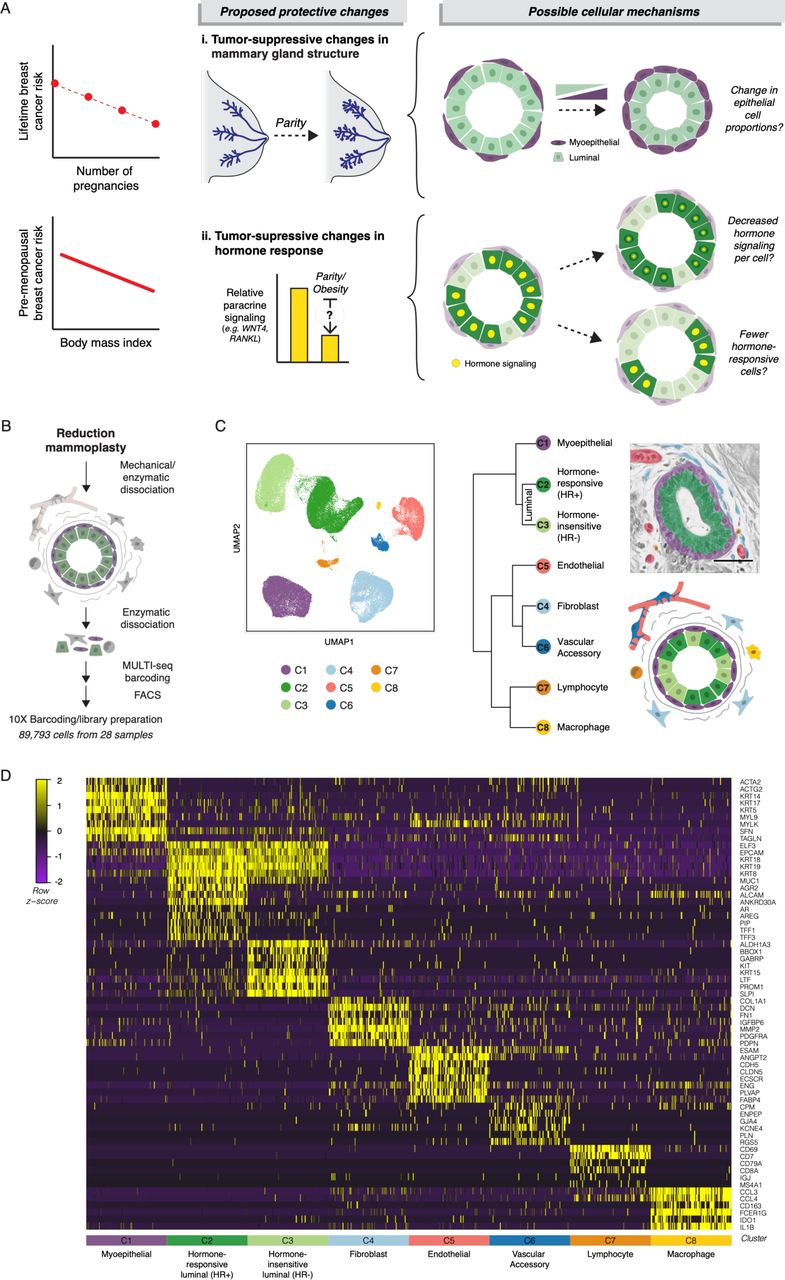
(A) Schematic of proposed tumor-protective changes in the breast with pregnancy or increasing BMI and potential cellular mechanisms. (B) Schematic of scRNAseq workflow: Reduction mammoplasty samples were processed to a single cell suspension, followed by MULTI-seq sample barcoding for batch 3 and batch 4, FACS purification, and library preparation. (C) Left: UMAP dimensionality reduction and KNN clustering of the combined data from all twenty-eight samples. Right: Hierarchical clustering of each cell type based on the log-transformed mean expression profile, along with their putative identities (Spearman’s correlation, Ward linkage). Pseudocolored H&E section and simplified diagram depict the organization of the human mammary gland. (D) Heatmap highlighting marker genes used to identify each cell type. For visualization purposes, we randomly selected 100 cells from each cluster.
One barrier to understanding how prior pregnancy (parity) and body mass index (BMI) influence breast cancer risk is that the mammary epithelium is a heterogeneous tissue comprising multiple cell types with different sensitivities to malignant transformation, properties as tumor suppressors, and roles in the response to ovarian hormones. There are three major epithelial cell lineages in the breast: hormone-responsive (HR+) luminal cells, which can express estrogen and/or progesterone receptors (ER and PR); hormone-insensitive (HR-) luminal cells (also termed luminal progenitors), which become the secretory cells that produce milk during lactation; and myoepithelial cells, which act by contracting to move milk through the ducts (Lim et al., 2010; Nguyen et al., 2018). The majority of breast cancers are thought to arise from a luminal cell population. In both xenograft (Keller et al., 2012; Proia et al., 2011) and genetically engineered mouse models (Koren et al., 2015; Melchor et al., 2014; Molyneux et al., 2010; Van Keymeulen et al., 2015), luminal cells transformed with breast cancer drivers form heterogeneous tumors that recapitulate the major breast cancer subtypes. In contrast, myoepithelial cells are resistant to malignant transformation (Keller et al., 2012; Koren et al., 2015; Proia et al., 2011; Van Keymeulen et al., 2015) and act as a barrier that prevents invasion of transformed luminal cells (Sirka et al., 2018; Sternlicht et al., 1997). Indeed, the ability of myoepithelial cells to block invasion is dose-dependent in organoids, with the suppressive effect scaling with the overall proportion of myoepithelial cells (Sirka et al., 2018). Together, these data suggest that the total proportion of myoepithelial and/or luminal cell types in the epithelium is one tissue-level mechanism that could affect the risk of breast cancer initiation and progression (Figure 1A).
The protective effects of both body mass and parity are strongest for ER+/PR+ breast cancers (Fortner et al., 2019; Premenopausal Breast Cancer Collaborative Group et al., 2018), suggesting that altered hormone signaling may be a second mechanism contributing to the tumor-protective effect of these two factors (Figure 1A). Multiple lines of evidence highlight the importance of hormone signaling in breast cancer development. Progesterone drives proliferation in the mammary epithelium (Beleut et al., 2010), and the progesterone receptor is required for mammary tumor formation in a mouse chemical carcinogenesis model (Lydon et al., 1999). In humans, about 80% of breast tumors express ER and/or PR. These tumors are dependent on hormone signaling for growth, as blocking estrogen production with aromatase inhibitors or estrogen signaling with ER antagonists slow tumor progression. Estrogen and progesterone exposure is also strongly linked to breast cancer risk: each additional year of hormone exposure due to early age of menarche or delayed menopause increases breast cancer risk (Collaborative Group on Hormonal Factors in Breast Cancer, 2012), and progestin-containing oral contraceptives and hormone replacement therapies also increase risk (Beaber et al., 2014; Beral Million Women Study Collaborators, 2003; Mørch et al., 2017).
A second challenge to understanding how parity and BMI influence breast cancer risk is that many of the effects of ovarian hormones within the breast are indirect. The estrogen and progesterone receptors (ER/PR) are expressed in only 10-15% of luminal cells within the epithelium (Clarke et al., 1997), and most of the effects of hormone receptor activation are mediated by a complex cascade of paracrine signaling from HR+ luminal cells to other cell types in the breast. Thus, decreased hormone-responsiveness in the breast could reflect either: 1) a change in the hormone signaling response of HR+ luminal cells—due to either changes in HR+ luminal cells themselves or non-cell autonomous changes in hormone levels or availability— and/or 2) a reduction in the proportion of HR+ luminal cells, leading to dampened paracrine signaling to other cell types downstream of ER/PR activation (Figure 1A). Single-cell RNA sequencing (scRNAseq) is particularly well-suited to investigate this problem, since it enables unbiased classification of the full repertoire of cell types within the human breast together with their transcriptional state.
Here, we use scRNAseq of twenty-eight premenopausal reduction mammoplasty tissue specimens to directly track how epithelial cell proportions and cell signaling state change with parity and BMI. We find that prior history of pregnancy and body mass are each associated with striking changes in epithelial cell proportions—pregnancy is associated with an increase in the proportion of myoepithelial cells relative to luminal cells, and body mass is associated with a decrease in the proportion of hormone-responsive cells in the luminal compartment. Additionally, we find that parity leads to a reduced hormone-signaling response of HR+ luminal cells. Finally, we find that both parity and BMI together predict the proportion of HR+ luminal cells within the mammary epithelium as a whole, and that the reduced proportion of HR+ luminal cells in parous and/or obese women is associated with a dampened paracrine signaling response in myoepithelial cells. Together, these data demonstrate that prior history of pregnancy and body mass are each associated with distinct changes in epithelial cell proportions and cell signaling state in the breast. These changes—which impact the proportion of cells susceptible to malignant transformation, the proportion of tumor-suppressive myoepithelial cells, and the overall magnitude of the signaling response downstream of estrogen and progesterone—are consistent with the well-established protective effects of pregnancy and obesity against lifetime or premenopausal breast cancer risk, respectively.
Results
scRNAseq distinguishes three major epithelial and five major stromal cell types in the human breast
To determine how pregnancy history and BMI affect epithelial cell proportions and cell state in the human breast, we performed scRNAseq analysis and unbiased clustering on 89,793 cells collected from reduction mammoplasties from twenty-eight premenopausal donors under age 40 (Table S1). To obtain an unbiased snapshot of both the epithelium and stroma, we sorted live/singlet cells identified on the basis of forward and side scatter and lack of DAPI staining. We additionally collected purified luminal and myoepithelial cells for four samples and purified epithelial cells from the combined luminal and myoepithelial sort gates for twenty-three samples to provide additional confirmation of downstream clustering results (Figure S1A, Table S2). We used MULTI-seq barcoding and clustering of genetic variants by souporcell for sample multiplexing (Figure S1B, Methods) (Heaton et al., 2019; McGinnis et al., 2019), and the 10X Chromium system to prepare cell-barcoded cDNA libraries (Figure 1B, Table S2).

(A) FACS plots depicting sort gates used for sequencing. (B) TSNE dimensionality reduction of the normalized barcode count matrices and final sample classification for MULTI-seq experiments (Batches 3 and 4). (C) Violin plot depicting the log-normalized expression of the myoepithelial marker KRT14 and luminal marker KRT19 in cells from the indicated sort gates. (D) UMAP dimensionality reduction of the combined data from all twenty-eight samples resolved sorted myoepithelial and luminal cell populations. (E) Left: Bar chart depicting the log normalized average expression of ESR1 and PGR in the indicated clusters. Right: UMAP dimensionality reduction plots depicting cells with expression of ESR1 or PGR in red.
To investigate how the proportion of each cell type changed with parity and BMI, we first identified the major cell types present within the human breast. Sorted myoepithelial and luminal cell populations were enriched for the epithelial keratins KRT14 and KRT19, respectively (Figure S1C), and were well-resolved by uMAP dimensionality reduction (Figure S1D). Unbiased clustering identified three main epithelial populations—one myoepithelial/basal cell type (C1) and two luminal cell types (C2-C3)—and five stromal populations (C4-C8) (Figure 1C). Hierarchical clustering and marker analysis identified the two luminal epithelial populations as HR+ (mature luminal) and HR- (luminal progenitor) cells, and the five stromal populations as fibroblasts, endothelial cells, pericytes/smooth muscle (vascular accessory) cells, lymphocytes, and macrophages (Figures 1C-D). The two luminal epithelial populations described here closely match the luminal cell populations identified by a previous scRNAseq analysis of the human breast (Nguyen et al., 2018). Those authors reported that the transcriptional signatures for these two populations were most similar to microarray expression data for what has been termed EpCAM+/CD49f− “mature luminal cells” and EpCAM+/CD49f+ “luminal progenitors” (Lim et al., 2010; 2009). As recent mouse studies suggest that the HR+ and HR-cell populations may be maintained by independent lineage-restricted progenitors (Van Keymeulen et al., 2017; Wang et al., 2017), here we use the nomenclature “hormone-responsive/HR+ luminal” and “hormone-insensitive/HR- luminal” to describe these two cell types. The HR+ luminal cell cluster (C2) was enriched for the hormone receptors ESR1 and PGR (Figure S1E), as well as other known markers of this population such as amphiregulin and AGR2 (Figure 1D) (Ciarloni et al., 2007; Fridriksdottir et al., 2015; Hrstka et al., 2010). Consistent with previous studies demonstrating variable hormone receptor expression across the menstrual cycle and with hormonal contraceptive use (Battersby et al., 1992), expression of ESR1 and PR transcripts was sporadic and often non-overlapping in the HR+ luminal cell cluster; 22% of the cells in C2 had detectable levels of the ESR1 or PGR transcript (Figure S1E), with only 2% of the cells expressing both transcripts.
Parity increases the proportion of myoepithelial cells in the mammary epithelium
The breast undergoes numerous changes during pregnancy, including a major expansion of the mammary epithelium. Following weaning, the mammary gland regresses back towards the pre-pregnant state in a process called involution. However, the breast epithelium of parous women retains a distinct architecture from that of nulliparous women, consisting of larger lobules containing a greater number of individual alveoli. At the same time, individual alveoli are reduced in size (Russo et al., 1992). We hypothesized that these changes would be a major driver of differences in epithelial cell proportions between samples in our dataset. We focused our initial analysis on the 66,981 cells in the live/singlet and epithelial sort gates to get an unbiased view of how the overall composition of the breast epithelium changes with history of pregnancy. Based on clustering results, we observed a pronounced change in epithelial composition in women with prior history of pregnancy (gravid/parous), characterized by an increase in the proportion of myoepithelial cells relative to luminal cells within the epithelium (Figure 2A). Linear regression analysis suggested that each birth further increased the proportion of myoepithelial cells in the epithelium (R2 = 0.41, p < 0.002) (Figure 2B). The proportion of myoepithelial cells did not vary with other discriminating factors such as BMI, race, or use of hormonal contraceptives (HC), but was weakly associated with age (R2 = 0.27, p < 0.005) (Figure S2A). Therefore, to determine the relative effect of each factor, we performed multiple linear regression analysis and found that the myoepithelial cell fraction positively correlated with the number of full-term pregnancies (p < 0.003), but not with age, race, hormonal contraceptive use or BMI (adjusted R2 = 0.75, p < 0.005) (Table S3).

(A) Quantification of the percentage of myoepithelial cells in the mammary epithelium identified by scRNAseq clustering versus age (n = 28; R2 = 0.27, p < 0.005), body mass index (n = 16; R2 = 0.04, N.S.), race (n = 28, N.S.), or hormonal contraceptive use (n = 28, N.S.). (B) Quantification of the average alveolar diameter in nulliparous versus parous samples (n = 15 samples; p < 0.0001) (C) Linear regression analysis of the width of the luminal layer versus alveolar diameter for individual acini with circularity greater than 0.8 (n = 54 acini; R2 = 0.80, p < 0.0001). (D) Quantification of the average thickness of the luminal layer in nulliparous versus parous samples (n = 15 samples; p < 0.001) (E) Geometric modeling of the relative surface area of the luminal layer as a function of alveolar diameter. Dots represent measurements of individual alveoli from parous (n=61 alveoli from 8 samples) or nulliparous (n=55 alveoli from 7 samples) women as indicated. Individual alveoli were modeled as hollow circles with a fixed shell thickness (Model 1) or with shell thickness proportional to their diameter (Model 2). (F) Receiver operating characteristic (ROC) curve for the classification of alveoli from parous versus nulliparous samples using the relative perimeter of the luminal layer (P/A) (n = 116 alveoli from 15 samples). (G) UMAP plot of sorted live singlet and epithelial cells from nulliparous and parous samples, with the percent of HR+ luminal, HR- luminal, and myoepithelial cells highlighted. (H) Linear regression analysis of the percentage of HR+ luminal cells in the mammary epithelium identified by scRNAseq clustering versus number of prior pregnancies (n = 22 samples; R2 = 0.23, p < 0.03). (I) Linear regression analysis of the percentage of HR- luminal cells in the mammary epithelium identified by scRNAseq clustering versus number of prior pregnancies (n = 22 samples; R2 = 0.004, N.S.).

(A) Left: UMAP plot of sorted live singlet and epithelial cells from nulliparous and parous samples, with the percent of luminal and myoepithelial cells highlighted. Right: Quantification of the percentage of myoepithelial cells (C1) in the epithelium (C1-C3) in women with or without prior history of pregnancy (n = 21 samples, p < 0.05). (B) Linear regression analysis of the percentage of myoepithelial cells (C1) in the mammary epithelium versus number of prior pregnancies (R2 = 0.41, p < 0.002). (C) Representative FACS analysis of the percentage of EpCAM−/CD49f+ myoepithelial cells within the Lin− epithelial population Left: Quantification of the percentage of myoepithelial cells in women with or without prior history of pregnancy (n = 15 samples, p < 0.001). Right: Linear regression analysis of the percentage of myoepithelial cells versus number of prior pregnancies (n = 15 samples; R2 = 0.59, p < 0.001). (D) Microarray differential expression analysis for selected genes from Peri et al. (E) Samples were immunostained with the myoepithelial marker p63 and pan-luminal marker KRT7, and the ratio of p63+ myoepithelial cells to KRT7+ luminal cells was quantified for samples with or without prior history of pregnancy (n = 13 samples, p < 0.004). Scale bars 50 µm. (F) A geometric model accurately predicts the relative surface area of the luminal layer as a function of alveolar diameter. Dots represent measurements of individual alveoli from parous (n=61 alveoli from 8 samples) or nulliparous (n=55 alveoli from 7 samples) women as indicated. Individual alveoli were modeled as hollow circles with a shell thickness proportional to their diameter.
We confirmed these results using three additional methods and an expanded cohort of samples. First, we measured myoepithelial proportions by flow cytometry analysis of EpCAM and CD49f expression in a subset of the sequenced samples plus eight additional samples (n=15). Consistent with previous clustering results, parity was associated with an increase in the average proportion of CD49f+ myoepithelial cells from 18% to 44% of the epithelium, and the proportion of myoepithelial cells further increased with each additional birth (Figure 2C). Finally, as FACS processing steps may affect tissue composition, we performed two further analyses. First, we reanalyzed a previously published microarray dataset of total RNA isolated from breast core needle biopsies from 71 parous and 42 nulliparous women (Peri et al., 2012), and found a significant increase in the myoepithelial markers KRT5, KRT14 and TP63 relative to luminal keratins in parous samples (Figure 2D). Second, we performed immunohistochemistry on matched formalin-fixed, paraffin-embedded tissue sections. Staining for the myoepithelial marker p63 and pan-luminal marker KRT7 confirmed an approximately 2-fold increase in the ratio of p63+ myoepithelial cells to KRT7+ luminal cells in intact tissue sections (Figure 2E).
To determine whether the increased proportion of myoepithelial cells observed in parous women could be explained in part by changes in epithelial architecture, we performed morphometric comparison of lobular tissue between parous and nulliparous samples in our dataset (Methods). These measurements confirmed a marked decrease in the average diameter of lobular alveoli in parous women (Figure S2B), consistent with previous reports (Russo et al., 1992). Additionally, we found that the average thickness of the luminal cell layer was linearly associated with alveolar diameter (Figure S2C) and reduced in parous women (Figure S2D). To determine how these parameters influence the relative surface area of the myoepithelial cell layer, we implemented two simple geometric models. Each alveolus consists of a hollow sphere of luminal cells surrounded by an outer layer of myoepithelial cells. Since myoepithelial cells form a monolayer along the luminal surface, the space available for myoepithelial cells versus luminal cells can be represented as the ratio of the outer surface area of the luminal layer to its volume— or in two dimensions, the ratio of the perimeter of the luminal layer to its area. We first modeled each alveolus in two dimensions as a hollow circle with a fixed shell thickness equal to the mean width of the luminal cell layer observed across all alveoli. While this first model demonstrated that a decrease in alveolar diameter alone could directly lead to an increase in the relative surface area of the luminal layer (P/A), it was a poor fit for the measured values (Figure S2E). Thus, based on our previous measurements, we implemented a second model in which the shell thickness of the luminal layer was linearly dependent on the diameter (Figure 2F, Figures S2E). Notably, this second model explained over 96% of the variance in the relative surface area of individual alveoli. Assuming the thickness of the myoepithelial layer remains relatively constant, the resulting change in surface area—when normalized to luminal area, smaller acini have a larger relative perimeter—would seem to require a comparatively greater proportion of myoepithelial cells to maintain the same degree of coverage in parous tissue. Indeed, the relative surface area of the luminal layer could be used to accurately classify alveoli from nulliparous versus parous samples (AUC = 0.91) (Figure S2F). Thus, we propose that geometric constraints underlie at least part of the differences observed in epithelial cell proportions between parous and nulliparous samples.
Obesity increases the proportion of HR- luminal cells relative to HR+ luminal cells
As decreased hormone signaling is one proposed mechanism for the protective effect of parity against breast cancer, we next asked whether the increased proportion of myoepithelial cells in parous women corresponded to a reduction in the proportions of HR+ and/or HR- luminal cells. While the separation between the HR+ and HR- luminal cell populations was not distinct by flow cytometry (Figure S1A), transcriptome analysis clearly distinguished between these two cell types (Figure 1C). Consistent with previous work (Meier-Abt et al., 2014; Muenst et al., 2017), parity was associated with a reduction in the proportion of HR+ luminal cells in the mammary epithelium (R2 = 0.23, p < 0.03) (Figures S2G-H). However, the proportion of HR- luminal cells was unchanged (Figure S2I). As parity was more strongly associated with the overall proportion of luminal cells (R2 = 0.41, p < 0.002) (Figure 2B) than with the proportion of either luminal cell subtype, this suggests that additional factors influence HR+ and HR- luminal cell proportions in the breast. We therefore performed multiple linear regression analysis to test for the effects of BMI, race, age, and hormonal contraceptive use on the proportions of each luminal cell subtype. Both parity (p < 0.03) and BMI (p < 0.05) were associated with a reduced proportion of HR+ luminal cells in the epithelium (Table S4; adjusted R2 = 0.72, p < 0.007). In contrast, the proportion of HR-cells in the epithelium was correlated with BMI (p < 0.0001) and age (p < .04), but was not significantly associated with parity (Table S5; adjusted R2 = 0.90, p < 0.0002).
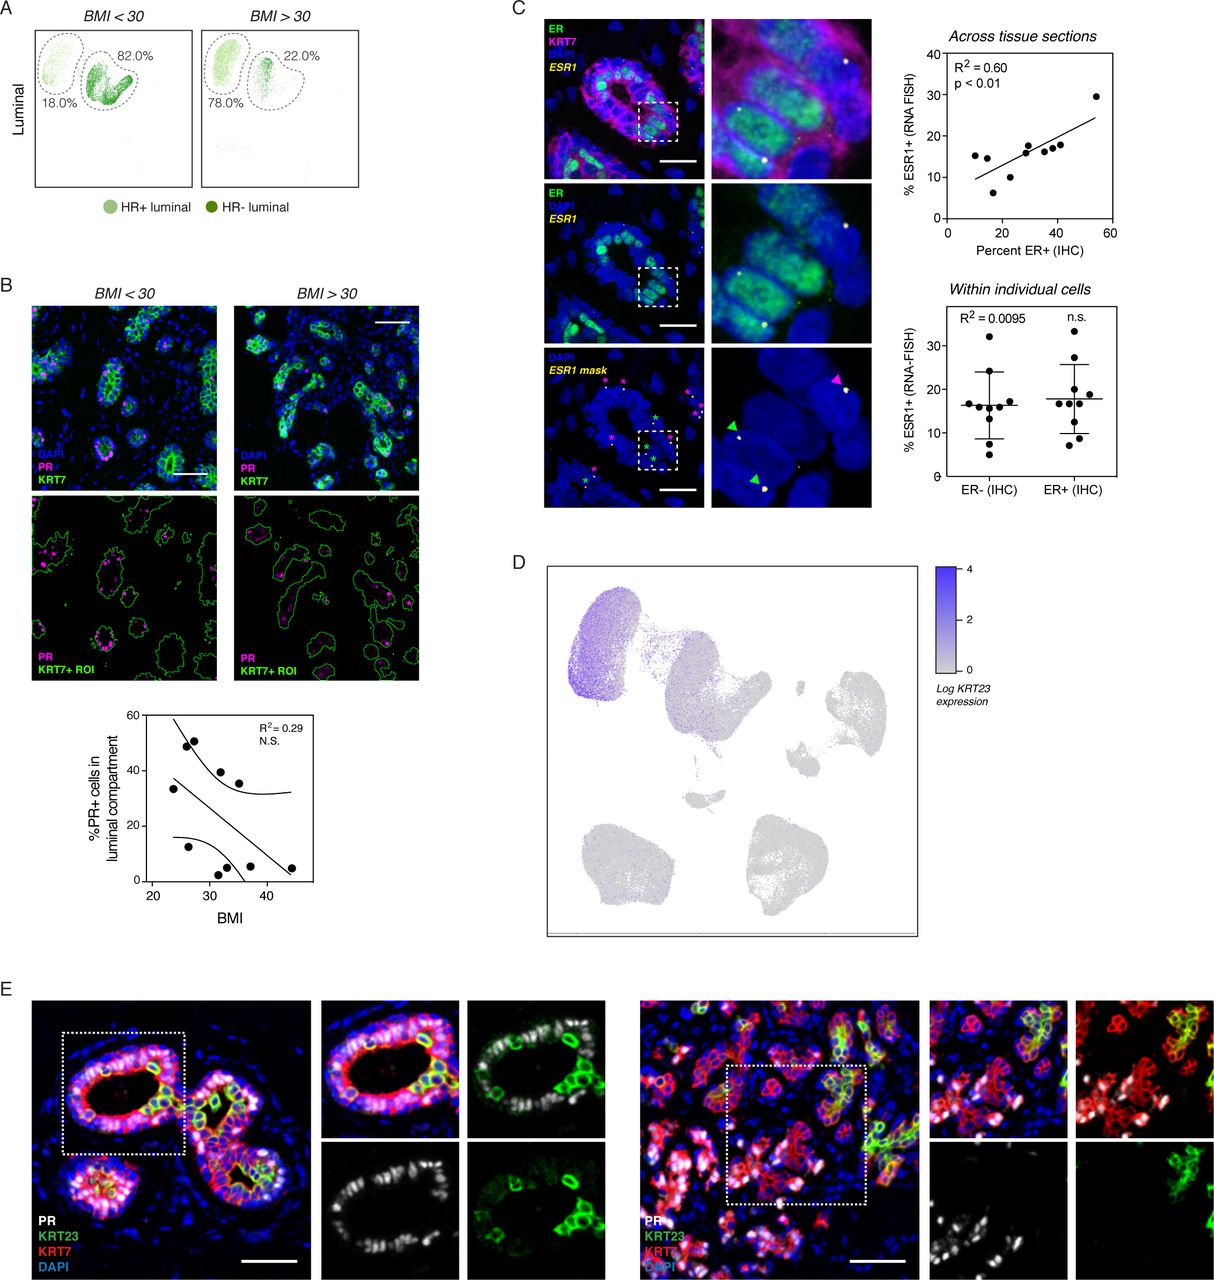
Based on these data, we reasoned that parity affects the ratio of myoepithelial versus luminal cells in the epithelial compartment as a whole, whereas BMI determines the ratio of luminal cell subtypes relative to each other. Confirming this, the average proportion of HR+ cells within the luminal compartment was reduced from 76% to 31% in obese women with BMI > 30 (Figure 3A). We observed similar results using clustering analysis from the 10,941 cells in the luminal sort gate (Figure S3A). On a continuous scale, BMI was inversely correlated with the percentage of HR+ cells in the luminal compartment (Figure 3B; R2 = 0.58, p < 0.001). Multiple linear regression analysis confirmed that this effect depended on BMI (p < 0.002) but not parity, age, race, or hormonal contraceptive use (Table S6; adjusted R2 = 0.80, p < 0.002).

(A) UMAP plot of sorted luminal cells from non-obese (BMI < 30) and obese (BMI > 30) samples, with the percentage of HR+ and HR- luminal cells highlighted. (B) Samples were immunostained with PR and the pan-luminal marker KRT7, and linear regression analysis of the percentage of PR+ cells in the luminal compartment versus body mass index was performed (n = 10 samples; R2 = 0.29, n.s.). (C) Multiplexed in situ hybridization of estrogen receptor transcript (ESR1) and immunostaining for estrogen receptor protein (ER) and KRT7. Right: Plots depicting the correlation between ESR1 and ER across multiple tissue sections (R2 = 0.6, p < 0.01) or within individual cells (R2 = 0.01, n.s.). Scale bars 25 µm. (D) UMAP dimensionality reduction plots depicting the expression of KRT23. (E) Representative images of immunostaining for PR, KRT23, and the pan-luminal marker KRT7. Scale bars 50 µm.

(A) Left: UMAP plot of sorted live singlet and epithelial cells from non-obese (BMI < 30) and obese (BMI > 30) samples, with the percentage of HR+ and HR- luminal cells highlighted. Right: Quantification of the percentage of HR+ cells (C2) in the luminal compartment (C2-C3) in obese versus non-obese women (n = 16 samples, p < 0.001). (B) Linear regression analysis of the percentage of HR+ cells (C2) in the luminal compartment versus body mass index (n = 16 samples; R2 = 0.58, p < 0.001). (C) Violin plot depicting the log-normalized expression KRT23 in cells from the indicated clusters. (D) Samples were immunostained with PR, KRT23, and the pan-luminal marker KRT7, and the percentages of PR+ cells within the KRT7+/KRT23- and KRT7+/KRT23+ luminal cell populations were quantified (n = 16 samples, p < 0.0001). Scale bars 50 µm. (E) Samples were immunostained with KRT23 and KRT7, and the percentage of KRT23+ luminal cells was quantified for non-obese and obese samples (n = 10, p < 0.01). Scale bars 50 µm. (F) Linear regression analysis of the percentage of KRT23+ cells in the luminal compartment identified by immunostaining versus body mass index (n = 10 samples; R2 = 0.58, p < 0.02). (G) Summary of changes in epithelial cell proportions with parity and obesity.
To verify these results in intact tissue sections, we performed immunohistochemistry for ER and PR. There was a trend toward decreased expression of PR with increasing BMI, but this change was not statistically significant (Figure S3B). We hypothesized that this variability was due to changes in ER and PR expression, stability, and nuclear localization that have been observed based on hormone receptor activation status (Battersby et al., 1992; Métivier et al., 2003; Petz and Nardulli, 2000). Thus, we predicted that hormone receptor transcript and protein would co-vary across samples due to menstrual cycle stage or hormonal contraceptive use (i.e. levels of estrogen and/or progesterone), but would be stochastically expressed in individual cells at any one time due to dynamic fluctuations in mRNA and protein expression and stability. Supporting this, we found that although ER transcript and protein levels correlate across tissue sections, they do not correlate on a per-cell basis (Figure S3C). These observations suggest that the actual fraction of cells in the HR+ lineage may be underestimated when using immunostaining for nuclear hormone receptors. Therefore, we sought to identify another marker to more reliably distinguish between HR+ and HR-cell populations by immunofluorescence, and identified keratin 23 (KRT23) as highly enriched in the HR-cell cluster (Figure 3C, S3D), as was also suggested by a previous scRNAseq study (Nguyen et al., 2018). Immunohistochemistry for KRT23 and PR confirmed that these two proteins are expressed in mutually exclusive luminal populations (Figure 3D, S3E). KRT23 thus represents a discriminatory marker between the two luminal populations that is less variable than hormone receptor expression. Staining for KRT23 in intact tissue sections confirmed a significant increase in KRT23+ HR- luminal cells from 7% to 22% in samples from obese women (Figure 3E). This positive association was observed over the entire range of body mass indices represented in our study (Figure 3F). Together, our data demonstrate that there are two independent effects of reproductive history and body weight on cell proportions in the mammary epithelium: parity affects the ratio of myoepithelial to luminal cells whereas BMI affects the ratio of HR+ versus HR- luminal cells (Figure 3G).
HR+ luminal cells have a reduced hormone signaling response in parous women
Previous epidemiologic analyses have demonstrated that the protective effect of parity against breast cancer is specific for ER+/PR+ tumors (Ma et al., 2006). Decreased hormone-responsiveness of the breast following pregnancy is one proposed mechanism for this protective effect (Britt et al., 2007). Supporting this, previous studies in mice and human tissue demonstrated decreased expression of the progesterone effector WNT4 with parity (Meier-Abt et al., 2014; 2013; Muenst et al., 2017). The inverse association between premenopausal breast cancer and BMI is likewise strongest for cancers expressing ER and/or PR (Premenopausal Breast Cancer Collaborative Group et al., 2018), suggesting that a similar protective mechanism might be involved. As most of the effects of estrogen and progesterone in the breast are mediated by paracrine signaling from HR+ luminal cells, decreased hormone-responsiveness could be caused by either: 1) a change in the magnitude of paracrine signals produced by each HR+ luminal cell, and/or 2) a reduced overall proportion of HR+ luminal cells leading to a “dilution” of paracrine signals downstream of ER/PR activation (Figure 1A). It has been difficult to distinguish between these two mechanisms using traditional tissue-level analyses, since both changes could result in a comparable reduction in the absolute tissue concentration of paracrine signals such as WNT4 and TNFSF11 (RANKL). By probing the single-cell transcriptional landscape of each mammary epithelial cell population, scRNAseq provided a means to interrogate whether the cell signaling state in HR+ luminal cells was affected by parity or increasing BMI.
As a measure of HR+ luminal cell state, we performed principal component (PC) analysis on the HR+ luminal cell population and quantified the average PC score for each sample across the first two principal components. Based on this analysis, we found that HR+ luminal cell state across PC1 was significantly different between nulliparous and parous women (Figure 4A). This effect was specific for PC1, and we did not observe any association between PC1 and other factors such as BMI, age, race, or hormonal contraceptive use (Figure S4A). Analysis of ranked gene loadings demonstrated that variation across PC1 was driven by genes involved in the response to hormone receptor activation, including the essential PR target genes TNFSF11 (RANKL) and WNT4 (Rajaram et al., 2015; Tanos et al., 2013). Of the 20 genes with the highest loadings in PC1, 12 have been previously described as associated with either progesterone signaling (DIO2, EFHD1, FASN, MYBPC1, PNMT, SERPINA5, TNFSF11, WNT4), estrogen signaling (AZGP1, SH3BGRL, TFF3), or the luteal phase of the menstrual cycle when progesterone is at its peak (CXCL13) (Figure 4B, Table S7). To identify differentially expressed genes between nulliparous and parous women with high sensitivity, we generated a “pseudo-bulk” dataset of aggregated HR+ luminal cells from each sample (Methods) and confirmed that parous women had decreased expression of the canonical hormone-responsive genes TFF1, PGR, WNT4, TNFSF11, and AREG (Figure 4C, Table S8). Notably, the progesterone receptor itself is a classical ER target gene (Kastner et al., 1990). Staining for the progesterone receptor and K23 confirmed that PR expression was reduced in the HR+ luminal cell subpopulation (K7+/K23-) of parous samples (Figure S4B). Finally, we confirmed that paracrine signaling pathways downstream of PR were specifically reduced in parous samples by assessing the effects of one of these genes, WNT4. As WNT4 from HR+ luminal cells has been shown to signal to myoepithelial cells (Rajaram et al., 2015), we performed co-immunostaining for the WNT effector TCF7 and myoepithelial cell marker p63 and found that TCF7 expression in myoepithelial cells was markedly decreased in parous samples (Figure 4D). Together, these data demonstrate that transcriptional variation among HR+ luminal cells is primarily related to hormone signaling, that transcription along this axis (HR+ PC1) is reduced in women with prior history of pregnancy, and that these transcriptional changes coincide with a reduction in downstream paracrine signaling.

(A) Linear regression analysis of HR+ luminal cell state across PC1 and PC2 versus BMI, parity, age, race, and hormonal contraceptive use. (B) Samples were immunostained with PR, KRT23, and the pan-luminal marker KRT7, and the percentages of PR+ cells within the KRT23-/KRT7+ HR+ luminal cell population was quantified (n = 13 samples, p < 0.03). Scale bar 50 µm.

(A) PC dimensionality reduction depicting either individual HR+ luminal cells from all twenty-eight samples (Left) or density plots of HR+ luminal cells from nulliparous (n=11) or parous (n=10) samples, and quantification of the average cell loading in PC1 for each sample. (B) Heatmap highlighting the 20 genes with the highest loadings in PC1, annotated by their association with estrogen signaling, progesterone signaling, or the luteal phase of the menstrual cycle. HR+ luminal cells are ordered by their cell loadings in PC1. (C) Volcano plot highlighting the differential expression of canonical hormone-responsive genes between parous and nulliparous samples in HR+ luminal cells. (D) Samples were immunostained with TCF7, p63, and the pan-luminal marker KRT7, and the percentages of TCF7+ cells within the p63+ myoepithelial cell population was quantified (n = 14 samples, p < 0.0001). Scale bars 50 µm.
The proportion of HR+ luminal cells predicts myoepithelial cell state
The above results established that parity—but not BMI—was associated with a change in the per-cell hormone signaling response of HR+ luminal cells (Figure S4A). As the effects of ER/PR activation are controlled by paracrine signaling from HR+ luminal cells to other cell types, we reasoned that the overall proportion of HR+ luminal cells in the epithelium was a second mechanism that could affect the hormone-responsiveness of the breast—a reduction in the proportion of HR+ luminal cells could “dilute” paracrine signaling to other cell types following hormone receptor activation (Figure 1A). Notably, BMI and parity together strongly influence the abundance of HR+ luminal cells in the epithelium (Table S4)—parity is associated with the overall proportion of luminal cells, whereas BMI is associated with the relative proportion of HR+ cells within the luminal compartment (Tables S3, S6). We hypothesized that this change in the proportion of HR+ luminal cells would lead to a reduction in downstream paracrine signaling to other cell types in parous and/or obese women.
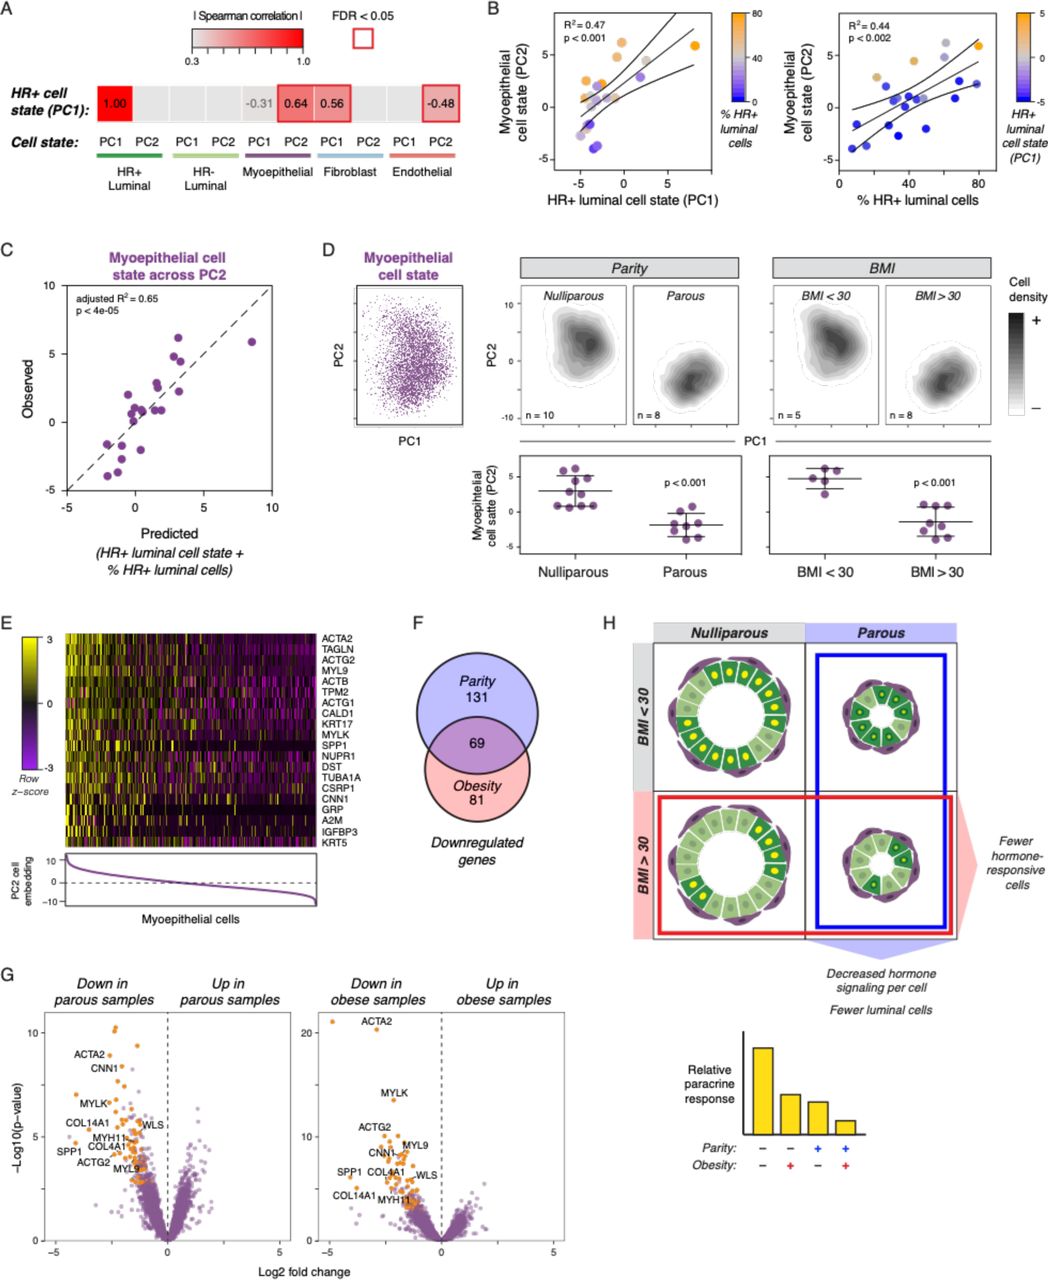
To identify putative transcriptional signatures of paracrine signaling from HR+ luminal cells to other cell types in the breast, we calculated average PC scores for the most abundant epithelial and stromal cell types (HR- luminal, myoepithelial, fibroblast, and endothelial), as described above, and identified PCs that were correlated with the hormone signaling signature we previously identified in HR+ luminal cells (HR+ PC1). The hormone signaling axis in HR+ luminal cells was most strongly correlated with myoepithelial cell state across PC2 (rs = 0.64, FDR < 0.02), although we also observed weaker correlations with fibroblast cell state across PC1 (rs = 0.56, FDR < 0.02), and endothelial cell state across PC2 (rs = −0.48, FDR < 0.04) (Figure 5A, Figure S5A).

(A) PC dimensionality reduction depicting density plots of HR+ luminal cells or myoepithelial cells for each sample with at least 50 cells of that type. (B) Heatmap depicting the results of linear regression analysis of cell state across the first two principal components for the indicated cell types versus HR+ luminal cell state across PC1 or the proportion of the indicated epithelial cell populations in the mammary epithelium. (C) Linear regression analysis of myoepithelial cell state across PC2 versus the proportion of HR+ luminal cells, HR- luminal cells, or myoepithelial cells. (D) Linear regression analysis of myoepithelial cell state across PC2 versus parity or BMI. (E) Heatmap depicting the results of linear regression analysis of cell state across the first two principal components for the indicated cell types versus parity or BMI. (F) PC dimensionality reduction depicting either individual myoepithelial cells from all twenty-eight samples (Left) or density plots of myoepithelial cells from samples based on parity and BMI, and quantification of the average cell loading in PC2 for each sample.

(A) Heatmap depicting Spearman’s rank-order correlation between cell state for the indicated cell types across the first two principal components versus HR+ luminal cell state across PC1. (B) Linear regression analysis of myoepithelial cell state across PC2 versus HR+ luminal cell state across PC1 (R2 = 0.47, p < 0.001) or the proportion of HR+ luminal cells in the mammary epithelium (R2 = 0.44, p < 0.002). Color scales represent the proportion of HR+ luminal cells in the epithelium or HR+ luminal cell state across PC1, as indicated. (C) Plot depicting the observed myoepithelial cell state across PC2 for each sample versus the predicted values based on HR+ luminal cell state (across PC1) and the proportion of HR+ luminal cells in the epithelium. (D) PC dimensionality reduction depicting either individual myoepithelial cells from all twenty-eight samples (Left) or density plots of myoepithelial cells from nulliparous (n=10) versus parous (n=8) or non-obese (n=5) versus obese (n=8) samples, and quantification of the average cell loading in PC2 for each sample. (E) Heatmap highlighting the 20 genes with the highest loadings in PC2. Myoepithelial cells are ordered by their cell loadings in PC2. (F) Venn diagram depicting the number of genes significantly downregulated in myoepithelial cells from either parous samples, obese samples, or both. (G) Volcano plot highlighting genes downregulated in myoepithelial cells in both parous and obese samples. (H) Schematic depicting how parity and obesity lead to decreased hormone signaling in the breast through two mechanisms. Parity directly affects the per-cell hormone response in HR+ luminal cells, and both parity and BMI lead to a reduction in the proportion of HR+ luminal cells in the epithelium.
While the downstream effects of ER/PR activation in HR+ luminal cells on other cell types are controlled by a complex set of signaling networks, previous work has shown that HR+ luminal cells signal directly to myoepithelial cells via WNT (Rajaram et al., 2015). Since WNT proteins generally form short-range signaling gradients restricted to one to two cell diameters in length (Farin et al., 2016), we reasoned that the paracrine signaling response in myoepithelial cells would be particularly sensitive to reductions in the proportion of HR+ luminal cells. Consistent with this, we found that myoepithelial cell state across PC2 was linearly associated with both the hormone signaling state of HR+ luminal cells (R2 = 0.47, p < 0.001) and the total proportion of HR+ luminal cells (R2 = 0.44, p < 0.002) in each sample (Figure 5B). Notably, when we plotted myoepithelial cell state versus HR+ luminal cell state, positive outliers tended to have a greater proportion of HR+ luminal cells and negative outliers tended to have a lower proportion of HR+ luminal cells. This dependence on both HR+ luminal cell proportions and cell state was specific to myoepithelial cells (Figure S5B). Multiple linear regression analysis demonstrated that HR+ luminal cell state and cell proportions together accounted for approximately two-thirds of the sample-to-sample variation across PC2 in myoepithelial cells (Figure 5C and Table 1, adjusted R2 = 0.65, p < 0.0001). Moreover, we did not observe any significant effect of other epithelial cell proportions on myoepithelial cell state (Figure S5C), suggesting that variation across PC2 was specific to paracrine signals from HR+ luminal cells and not a general result of altered epithelial architecture. Together, these results are consistent with a model in which the proportion of HR+ luminal cells in the epithelium influences the magnitude of paracrine signaling to myoepithelial cells downstream of estrogen and progesterone.
Myoepithelial cell state across PC2 depends on the hormone signaling state of HR+ luminal cells and the proportion of HR+ luminal cells in the mammary epithelium.
Based on this, we predicted that BMI and parity would influence paracrine signaling from HR+ luminal cells to myoepithelial cells, since HR+ luminal cells are reduced in parous and/or obese women. Confirming this, we found that both BMI (R2 = 0.63, p < 0.0001) and parity (R2 = 0.66, p < 0.001) were strongly correlated with cell state in myoepithelial cells (Figure 5D, Figure S5D). Moreover, the association between parity or BMI and cell state was strongest for myoepithelial cells versus other cell types, although we also observed a weaker association with cell state in fibroblasts (Figure S5E). Moreover, since the proportion of HR+ luminal cells in the epithelium depends on both parity and BMI (Table S4), we predicted that the combination of these two risk factors should better predict myoepithelial cell state than either independently. Indeed, myoepithelial cell state was significantly different between obese and non-obese nulliparous women, and an additional effect was found between obese nulliparous and obese parous women (Figure S5F). Multiple linear regression analysis demonstrated that parity and BMI together explained 88% of the variation in myoepithelial cell state across PC2 (Table 2), whereas each factor individually accounted for less than two-thirds of the variation across this PC (Figure S5D).
Parity and body mass index are both significant predictors of myoepithelial cell state.
Analysis of ranked gene loadings demonstrated that variation of myoepithelial cells across PC2 was driven by genes involved in actomyosin contractility, including the cytoskeletal components ACTA1, ACTB, ACTG1, ACTG2, MYL9, and TUBA1A and regulatory proteins CALD1, CNN1, MYLK, TAGLN, and TPM2 (Figure 5E). To determine whether these genes were differentially expressed in obese and/or parous women, we generated a “pseudo-bulk” dataset of myoepithelial cells from each sample (Methods). Of the 200 genes significantly downregulated in parous samples and 150 genes significantly downregulated in obese samples, 69 were reduced across both groups (Figure 5F, Table S9). Both parous and obese samples had decreased expression of contractility-related genes including ACTA2, ACTG2, CNN1, MYH11, MYL9, and MYLK, as well as the basement membrane proteins COL4A1 and COL14A1 (Figure 5G, Table S9). Finally, consistent with the idea that PC2 primarily represents the paracrine signaling response of myoepithelial cells to hormone signaling, expression of the WNT target genes SPP1 and WLS was also reduced in both parous and obese women. Overall, these results are consistent with a model in which parity and BMI affect the hormone-responsiveness of the breast through two distinct mechanisms: parity directly alters the hormone signaling response in HR+ luminal cells, and BMI and parity together indirectly affect hormone signaling by reducing the proportion of HR+ luminal cells in the mammary epithelium.
Discussion
Pregnancy has a pronounced protective effect against breast cancer, with up to a 50% reduction in breast cancer risk for women with multiple full-term pregnancies at a young age (Britt et al., 2007). Similarly, obesity has a protective effect against premenopausal breast cancer, decreasing risk by up to 45% (van den Brandt et al., 2000). In this study, we used scRNAseq, flow cytometry, and immunostaining to reveal several changes in the composition and signaling status of the mammary gland that strongly correlate with parity and BMI.
Our analysis revealed that parity is associated with a stark increase in the proportion of myoepithelial cells and concomitant decrease in the proportion of luminal cells within the mammary epithelium (Figure 3G). We propose that these changes in epithelial cell proportions underlie at least part of the protective effect of pregnancy against breast cancer, based on current knowledge of the etiology of the disease. Supporting this idea, we found that the proportion of myoepithelial cells in the epithelium linearly increased and the proportion of luminal cells linearly decreased with the total number of full-term pregnancies, consistent with epidemiological studies demonstrating that each additional birth reduces breast cancer risk by an additional 11% in multiparous women (Ma et al., 2006). A tumor-suppressive function for myoepithelial cells has been reported in numerous studies, and two tumor-protective features of myoepithelial cells are particularly relevant in light of our findings. First, they are resistant to oncogenic transformation (Keller et al., 2012; Koren et al., 2015; Proia et al., 2011; Van Keymeulen et al., 2015). Thus, pregnancy results in a reduced overall fraction of cells susceptible to transformation in the breast. Second, they act as a natural and dynamic barrier that prevents tumor cell invasion (Sirka et al., 2018; Sternlicht et al., 1997). Further, this effect is dose-dependent, with an increased ratio of myoepithelial to luminal cells resulting in a corresponding decrease in luminal cell invasion in tumor organoid models (Sirka et al., 2018).
How pregnancy changes the proportion of cells between the luminal and myoepithelial compartments remains an open question. However, morphometric comparison of lobular tissue between parous and nulliparous women reveals a marked decrease in average acinar diameter (Russo et al., 1992) and a decrease in the average width of the luminal layer (Figure S2B, S2D). Geometric modeling suggests that the resulting change in surface area of the luminal compartment requires a comparatively larger proportion of myoepithelial cells in the lobules of parous women to maintain the same degree of coverage, although how the tissue senses these architectural changes remains unclear. Regardless of mechanism, our data suggest that pregnancy, in part, protects against breast cancer risk both by decreasing the relative frequency of luminal cells—the tumor cell-of-origin for most breast cancers (Keller et al., 2012; Melchor et al., 2014; Molyneux et al., 2010)—and by suppressing progression to invasive carcinoma.
Hormone exposure is another major determinant of breast cancer risk (Beaber et al., 2014; Beral Million Women Study Collaborators, 2003; Collaborative Group on Hormonal Factors in Breast Cancer, 2012; Mørch et al., 2017), and parity is specifically associated with a reduced risk of ER+/PR+ breast cancer (Ma et al., 2006). Similarly, previous epidemiologic analyses have demonstrated that the protective effect of increased BMI against premenopausal breast cancer is strongest for ER+/PR+ tumors (Premenopausal Breast Cancer Collaborative Group et al., 2018). These findings strongly suggest a specific role for hormone signaling in the protective effect of parity and BMI against breast cancer, and our data support the idea that these risk factors lead to reduced paracrine signaling downstream of estrogen and progesterone via two distinct mechanisms.
First, we find that parity leads to a reduced per-cell hormone signaling response in HR+ luminal cells, characterized by decreased expression of canonical estrogen- and progesterone-responsive genes such as PGR, WNT4, TNFSF11/RANKL, and many others (Figure 5H). Notably, since many of these genes are involved in paracrine signaling to the surrounding epithelium, reduced transcription across this signaling axis would be predicted to broadly affect the epithelial microenvironment, having both autonomous effects on HR+ luminal cells themselves and non-autonomous effects on other cell lineages across the epithelium and stroma. Several potential mechanisms could account for the decreased hormone-responsiveness in HR+ luminal cells observed in parous women. Previous studies have identified small reductions in the levels of estrogen metabolites in the urine of parous women, which may be indicative of lower serum levels of estradiol (Barrett et al., 2014). Since progesterone receptor expression is induced downstream of estrogen receptor activation, lower levels of serum estradiol could lead to reduced signaling through both ER and PR. A second possibility is that structural differences in the mammary epithelium of parous women, such as increased lobular density (Russo et al., 1992), could lead to decreased access of hormones to HR+ luminal cells. Finally, changes in the differentiation state of HR+ luminal cells following pregnancy could lead to a direct change in the ability of these cells to respond to hormone. Further studies are required to determine whether the decreased hormone response of HR+ luminal cells in parous women is a result of these or other processes.
Second, clustering analysis and immunohistochemistry identified a marked decrease in the ratio of HR+ luminal cells relative to HR- luminal cells with increasing BMI. Since the overall proportion of luminal cells decreases with parity, the overall proportion of HR+ luminal cells within the mammary epithelium is associated with both BMI and parity. Notably, our data suggest that this decreased proportion of HR+ cells is an additional mechanism contributing to a reduced hormone signaling response in obese and/or parous women (Figure 5H). We find that PC2 in myoepithelial cells is correlated with both BMI and parity, and that variation across this PC can be largely explained by the hormone signaling state of the tissue and the proportion of HR+ luminal cells within the epithelium.
Finally, one open question is why BMI has opposing effects on premenopausal versus postmenopausal breast cancer. In postmenopausal women, the production of estrogen by adipose tissue leads to increased ER signaling in obese women, and this is thought to contribute to the increased risk of HR+ breast cancer (Cleary and Grossmann, 2009). This adipose-derived estrogen may be less functionally relevant in premenopausal women that have monthly cycling levels of ovarian hormones. Consistent with this idea, previous work identified a strong positive correlation between BMI and estrogen receptor expression in postmenopausal women, but a much weaker correlation in premenopausal women; BMI accounted for 84% of the variance in ER staining in postmenopausal women but only 17% in premenopausal women (Chamberlin et al., 2017). Thus, ovarian-derived estrogen likely dominates the hormonal landscape in premenopausal women. Moreover, menopause is characterized by a progressive regression of breast epithelial tissue; lobular involution begins at perimenopause and is still ongoing in approximately half of women older than 70 years. When stratified based on age, women who have undergone greater degrees of lobular involution have a greatly reduced risk of breast cancer (Milanese et al., 2006). We speculate that adipose-derived estrogen in obese women may delay complete lobular involution, however, further studies are required to determine how this broad tissue remodeling influences epithelial cell proportions, and how body mass influences the degree of involution.
In summary, these results provide an unbiased view of the changes in epithelial tissue composition and cell signaling state in premenopausal women that underlie two major breast cancer risk factors—pregnancy history and body weight. This single-cell analysis establishes a link between tumor-protective changes in epithelial cell proportions and hormone-responsiveness with pregnancy and increased body mass. An understanding of how these two risk factors affect the human breast will aid in identifying women at higher risk for breast cancer and may inform new strategies for cancer prevention.
Methods
Tissue samples and preparation
Reduction mammoplasty tissue samples were obtained from the Cooperative Human Tissue Network (Vanderbilt University, Nashville, TN) and the Kaiser Foundation Research Institute (Oakland, CA). Tissues were obtained as de-identified samples and all subjects provided written informed consent. When possible, medical reports were obtained with personally identifiable information redacted. Use of breast tissue specimens to conduct the studies described above were approved by the UCSF Committee on Human Research under Institutional Review Board protocol No. 16-18865 and No. 10-01532. A portion of each sample was fixed in formalin and paraffin-embedded using standard procedures. The remainder was dissociated mechanically and enzymatically to obtain epithelial-enriched organoids. Tissue was minced, followed by enzymatic dissociation with 200 U/mL collagenase type III (Worthington CLS-3) and 100 U/mL hyaluronidase (Sigma H3506) in RPMI 1640 with HEPES (Corning 10-041-CV) plus 10% (v/v) dialyzed FBS, penicillin, streptomycin, amphotericin B (Lonza 17-836E), and gentamicin (Lonza 17-518) at 37 C for 16h. This cell suspension was centrifuged at 400 x g for 10 min and resuspended in RPMI 1640 plus 10% FBS. Organoids enriched for epithelial cells and associated stroma were collected after serial filtration through 150 µm and 40 µm nylon mesh strainers. The final filtrate contained stromal cells consisting primarily of fibroblasts, endothelial cells, and immune cells. Following centrifugation, epithelial organoids and filtrate were frozen and maintained at −180 °C until use.
Dissociation to single cells
The day of sorting, epithelial organoids from the 150 µm fraction were thawed and digested to single cells by trituration in 0.05% trypsin for 2 min, followed by trituration in 5 U/mL dispase (Stem Cell Technologies 07913) plus 1 mg/mL DNase I (Stem Cell Technologies 07900) for 2 min. Single-cell suspensions were resuspended in HBSS supplemented with 2% FBS, filtered through a 40 µm cell strainer, and pelleted at 400 x g for 5 minutes. The pellets were resuspended in 10 mL of complete mammary epithelial growth medium with 2% v/v FBS without GA-1000 (MEGM; Lonza CC-3150). Cells were incubated in a 37 °C for 1 hour, rotating on a hula mixer, to regenerate surface antigens.
MULTI-seq sample barcoding
Single-cell suspensions were pelleted at 400 x g for 5 minutes and washed once with 10 mL mammary epithelial basal medium (MEBM; Lonza CC-3151). For each sample, one million cells were aliquoted, washed a second time with 200 µL MEBM, and resuspended in 90 µL of a 200 nM solution containing equimolar amounts of anchor lipid-modified oligonucleotides (LMOs) and sample barcode oligonucleotides in phosphate buffered saline (PBS). Following a 5 minute incubation on ice with anchor-LMO/barcode, 10 uL of 2 µM co-anchor LMO in PBS was added to each sample (for a final concentration of 200 nM), and wells were mixed by gentle pipetting and incubated for an additional 5 minutes on ice. Following incubation, cells were washed twice in 200 µL PBS with 1% BSA and pooled together into a single 15 mL conical tube containing 10 mL PBS/1% BSA. All subsequent steps were performed on ice.
Sorting for scRNA-seq
Cells were pelleted at 400 x g for 5 minutes and resuspended in PBS/1% BSA at a concentration of 1 million cells per 100 µL, and incubated with primary antibodies. Cells were stained with Alexa 488-conjugated anti-CD49f to isolate myoepithelial cells, PE-conjugated anti-EpCAM to isolate luminal epithelial cells, and biotinylated antibodies for lineage markers CD2, CD3, CD16, CD64, CD31, and CD45 to remove hematopoietic (CD16/CD64-positive), endothelial (CD31-positive), and leukocytic (CD2/CD3/CD45-positive) lineage cells by negative selection (Lin-). Sequential incubation with primary antibodies was performed for 30 min on ice in PBS/1% BSA, and cells were washed with cold PBS/1% BSA. Biotinylated primary antibodies were detected with a streptavidin-Brilliant Violet 785 conjugate. After incubation, cells were washed once and resuspended in PBS/1% BSA plus 1 ug/mL DAPI for live/dead discrimination. Cell sorting was performed on a FACSAria II cell sorter. Live singlet (DAPI-), luminal (DAPI-/Lin-/CD49f-/EpCAMhigh), myoepithelial (DAPI-/Lin-/CD49f+/EpCAMlow), or total epithelial (pooled luminal and myoepithelial) cells were collected for each sample as specified in Table S2 and resuspended in PBS plus 1% BSA at a concentration of 1000 cells/µL. For Batch 4, an aliquot of MULTI-seq barcoded cells were separately stained with biotinylated-CD45/strepdavidin-Brilliant Violet 785 to enrich for immune cells, and sorted CD45+ cells were pooled with the Live/singlet fraction as specified in Table S2.
Antibodies and dilutions used (µL/million cells): FITC-EpCAM (1.5 µL; BD 550257, clone AD2), APC-CD49f (4 µL; Stem Cell Technologies 10109, clone VU1D9), Biotin-CD2 (8 µL; Biolegend 313636, clone GoH3), Biotin-CD3 (8 µL; BD 55325, clone RPA-2.10), Biotin-CD16 (8 µL; BD 55338, clone HIT3a), Biotin-CD64 (8 µL; BD 555526, clone 10.1), Biotin-CD31 (4 µL; Invitrogen MHCD31154, clone MBC78.2), Biotin-CD45 (1 µL; Biolegend 304004, clone HI30), BV785-Streptavidin (1 µL; Biolegend 405249).
scRNAseq library preparation
cDNA libraries were prepared using the 10X Genomics Single Cell V2 (CG00052 Single Cell 3’ Reagent Kit v2: User Guide Rev B) or Single Cell V3 (CG000183 Single Cell 3’ Reagent Kit v3: User Guide Rev B) standard workflow as specified in Table S2. Library concentrations were quantified using high sensitivity DNA Bioanalyzer chips (Agilent, 5067-4626), the Illumina Library Quantification Kit (Kapa Biosystems KK4824), and Qubit dsDNA HS Assay Kit (Thermo Fisher Q32851). Individual libraries were separately sequenced on a lane of a HiSeq4500 or NovaSeq, as specified in Table S2, for an average of ∼150,000 reads/cell.
Expression library pre-processing
Cell Ranger (10x Genomics) was used to align sequences, filter data and count unique molecular identifiers (UMIs). Data were mapped to the human reference genome GRCh37 (hg19). The resulting sequencing statistics are summarized in Table S2. For each experimental batch, Cell Ranger aggregate was used to normalize read depth across droplet microfluidic lanes.
Cell calling
For V2 experiments, cell-associated barcodes were defined using Cell Ranger. For V3/MULTI-seq experiments, cells were defined as barcodes associated with ≥600 total RNA UMIs and ≤20% of reads mapping to mitochondrial genes. We manually selected 600 RNA UMIs and 20% mitochondrial genes to exclude low-quality cell barcodes.
MULTI0seq barcode library pre-processing
Raw barcode FASTQs were converted to barcode UMI count matrices as described previously (McGinnis et al., 2019). Briefly, FASTQs were parsed to discard reads where: 1) the first 16 bases of read 1 did not match a list of cell barcodes generated as described above, and 2) the first eight bases of read 2 did not align with any reference barcode with less than 1 mismatch. Duplicated UMIs, defined as reads with the same cell barcode where bases 17-26 (V2 chemistry) or bases 17-28 (V3 chemistry) of read 2 exactly matched, were removed to produce a final barcode UMI count matrix.
Sample demultiplexing
MULTI-seq barcode UMI count matrices were used to classify cells using the MULTI-seq classification suite (McGinnis et al., 2019). In Batch 3, sample RM192 was poorly labeled for the lane of cells from the epithelial cell sort gate. Therefore, to reduce spurious doublet calls in this dataset, we manually set UMI counts which were <10 for this barcode to zero. For all experiments, raw barcode reads were log2-transformed and mean-centered, the top and bottom 0.1% of values for each barcode were excluded, and a probability density function (PDF) was constructed for each barcode. Next, all local maxima were computed for each PDF, and the negative and positive maxima were selected. To define a threshold between these two maxima, we iterated across 0.02-quantile increments and chose the quantile maximizing the number of singlet classifications, defined as cells surpassing the threshold for a single barcode. Multiplets were defined as cells surpassing two or more thresholds, and unlabeled cells were defined as cells surpassing zero thresholds. Unclassified cells were removed and the procedure was repeated until all remaining cells were classified. This workflow classified 10,492 singlets from the Batch 3 live singlet gate, 8,182 singlets from the Batch 3 epithelial sort gate, 15,140 singlets from the Batch 4 live singlet/CD45+ sort gate, and 11,388 singlets from the Batch 4 epithelial sort gate.
To classify cells that were identified as unlabeled by MULTI-seq, we used the souporcell pipeline (Heaton et al., 2019) to assign cells to different individuals based on single nucleotide polymorphisms (SNPs). For each dataset, we set the number of clusters (k) to the total number of samples in that experiment. To avoid local minima, the souporcell pipeline restarts clustering multiple times and takes the solution that minimizes the loss function. For Batch 3, we chose the number of restarts that produced less than a 1.5% misclassification rate between MULTI-seq and souporcell singlet sample classifications (Live singlet: 30 restarts/1.2% mismatch rate; Epithelial: 75 restarts/1.5% mismatch rate). Souporcell classification performed more poorly across parameters for Batch 4 (Live singlet plus CD45+: 50 restarts/8.1% mismatch rate, 75 restarts/4.8% mismatch rate; Epithelial: 50 restarts/8.6% mismatch rate, 75 restarts/14.9% mismatch rate, 100 restarts/4.1% mismatch rate). Therefore, for these datasets we used sample classifications that were consistent across two restarts (Pooled live singlet/ CD45+: consistent calls across 50 and 75 restarts/0.4% overall mismatch rate; Epithelial: consistent calls across 50 and 100 restarts/1% overall mismatch rate) to identify high-confidence singlets. This souporcell workflow classified an additional 1,659 singlets from the Batch 3 live singlet gate, 1,221 singlets from the Batch 3 epithelial sort gate, 1,551 singlets from the Batch 4 live singlet/CD45+ sort gate, and 1,407 singlets from the Batch 4 epithelial sort gate. Final sample calls were defined as singlets called by MULTI-seq classification combined with unclassified cells from MULTI-seq that were classified as singlets by souporcell.
Quality control, dataset integration, and cell type identification using Seurat
Cell type identification was performed using the Seurat package (version 3.0.0) in R. Aggregated data for each batch was filtered to remove cells that had fewer than 200 genes and genes that appeared in fewer than 3 cells. Cells with a Z score of 4 or greater for the total number of genes expressed were presumed to be doublets and removed from analysis. Cells with greater than 20% of reads mapping to mitochondrial genes were presumed to be apoptotic and removed from analysis. The remaining cells were log transformed and scaled to a total of 1e4 molecules per cell, and the top 2000 most variable genes based on variance stabilizing transformation were identified for each batch (Hafemeister and Satija, 2019). Data from all four batches was integrated using the standard workflow and default parameters from Seurat v3 (Stuart et al., 2019). This data integration workflow identifies pairwise correspondences between cells across datasets and uses these anchors to transform datasets into a shared expression space. Following dataset integration, the resulting batch-corrected expression matrix was scaled, and principal component (PC) analysis was performed using the identified integration genes. The top 14 statistically significant PCs as determined by visual inspection of elbow plots were used as an input for UMAP visualization and k-nearest neighbor (KNN) modularity optimization-based clustering using Seurat’s FindNeighbors and FindClusters functions.
Cell state analysis within specific cell types/clusters
For each cell type, we repeated the standard workflow from Seurat v3 to identify integration genes specific to each population. The resulting batch-corrected expression matrices were scaled, and PC analysis was performed using the identified integration genes. As a measure of cell state, we calculated the average cell loadings across the first two principal components for each sample with at least 50 cells within that cell type cluster.
Fluorescent Immunohistochemistry
For immunofluorescent staining, formalin-fixed paraffin-embedded tissue sections were deparaffinized and rehydrated using standard methods. Endogenous peroxides were blocked using 3% hydrogen peroxide in PBS, and antigen retrieval was performed in 0.1 M citrate buffer pH 6.0. Sections were blocked for 5 minutes at room temperature using Lab Vision Ultra-V block (Thermo TA-125-UB) and rinsed with TNT wash buffer (1X Tris-buffered saline with 5 mM Tris-HCl and 0.5% TWEEN-20). Primary antibody incubations were performed for 1 hour at room temperature or overnight at 4°C. Sections were washed three times for 5 min each with TNT wash buffer, incubated with Lab Vision UltraVision LP Detection System HRP Polymer (Thermo Fisher TL-060-HL) for 15 minutes at room temperature, washed, and incubated with one of three colors of TSA amplification reagent at a 1:50 dilution. After tyramide signal amplification, antibody complexes were removed by boiling in citrate buffer, followed by blocking and incubation with additional primary antibodies as above. Finally, sections were rinsed with deionized water and mounted using Vectashield HardSet Mounting Media with DAPI (Vector H-1400). Immunofluorescence was analyzed by spinning disk confocal microscopy using a Zeiss Cell Observer Z1 equipped with a Yokagawa spinning disk and running Zeiss Zen Software.
Antibodies, TSA reagents, and dilutions used are as follows: p63 (1:2000; CST 13109, clone D2K8X), KRT7 (1:4000; Abcam AB68459, clone EPR1619Y), KRT23 (1:2000; Abcam AB156569, clone EPR10943), ER (1:4000; Thermo RMM-9101-S, clone SP1), PR (1:3000; CST 8757, clone D8Q2J), TCF7 (1:2000; CST 2203, clone C63D9), FITC-TSA (2 min; Perkin Elmer NEL701A001KT), Cy3-TSA (3 min; Perkin Elmer NEL744001KT), Cy5-TSA (7 min; Perkin Elmer NEL745E001KT).
Morphometric analysis and geometric modeling
Formalin-fixed paraffin-embedded tissue sections were immunostained for the pan-luminal marker KRT7, counterstained with DAPI and imaged as described above. Images containing lobular tissue were acquired randomly, and the area and perimeter of the KRT7-positive luminal layer of each alveolus was analyzed in ImageJ. To reduce noise and remove small gaps in KRT7 fluorescence, we applied a closing filter from the MorphoLibJ plugin with a 2-pixel (1.33 µm) radius disk (Legland et al., 2016). The resulting image was smoothed by applying a Gaussian filter with sigma 5 pixels (3.33 µm), and binarized using the default thresholding algorithm in ImageJ. Finally, individual alveoli with visible lumens were manually selected and the area (A), perimeter (P), and circularity of the KRT7-positive region was measured for each structure (n = 124 structures from 16 samples). To estimate the average diameter (d) and luminal thickness (w) of each alveolus, we used area and perimeter measurements to fit a circle containing a hollow lumen to each structure. Based on these results, we implemented two geometric models in which each alveolus was represented as a hollow circle with either: 1) a fixed shell thickness (w) equal to the mean thickness of the luminal layer across all alveoli, or 2) a shell thickness that was linearly related to diameter (d) (Figure S2H). To estimate the linear relationship between w and d for the second model, we performed linear regression analysis using measurements from all structures with a circularity greater than 0.80 (n = 54 structures from 16 samples).
Pseudo-bulk differential gene expression analysis
To identify genes differentially expressed between parous and nulliparous or obese and non-obese samples in specific cell types, we constructed pseudo-bulk datasets consisting of the summed raw read counts across all single HR+ luminal cells (cluster 2) or myoepithelial cells (cluster 1) for each batch and sample. We restricted our analysis to samples and batches that had at least 100 cells of the cell type of interest. Each dataset was then randomly downsampled to the lowest library size, and differential expression analysis was performed using DESeq2 (version 1.18.1) to test for genes differentially expressed between obese (BMI > 30) and non-obese (BMI < 30) or parous and nulliparous samples, using batch as a covariate (Love et al., 2014). As certain samples were sequenced across more than one batch (Table S2), replicates of the same sample from different batches were added together using the collapseReplicates function. False discovery rate corrected p-values were calculated using the Benjamini-Hochberg procedure.
RNA FISH analysis of ESR1 transcripts
Combined RNA FISH and immunofluorescence analysis of estrogen receptor transcript (RNAscope Probe Hs-ESR1; ACD 310301) and protein (anti-ER; Thermo RMM-9101-S, clone SP1) was performed using the RNAscope in situ hybridization kit (RNAscope Multiplex Fluorescent Reagent Kit V2, ACD 323100) according to the manufacturer’s instructions and fluorescent immunohistochemistry protocol outlined above with the following modifications. Immunostaining for ER was performed prior to in situ hybridization, using the hydrogen peroxide and antigen retrieval solutions supplied with the RNAscope kit and the mildest recommended conditions. After ER immunostaining and tyramide signal amplification, in situ hybridization for ESR1 was performed according to the manufacturer’s instructions, followed by immunostaining for KRT7 as described above. For all RNA FISH experiments, we used positive (PPIB) and negative controls (DAPB) to verify staining conditions and probe specificity.
Flow cytometry analysis of myoepithelial cell populations
Flow cytometry analysis of myoepithelial cell populations was performed as described above (sorting for scRNA-seq).
Author Contributions
Conceptualization, L.M.M., R.J.W., and Z.J.G.; Methodology, L.M.M., R.J.W., M.T., and Z.J.G.; Software L.M.M., R.J.W., and C.S.M.; Investigation, L.M.M., R.J.W., J.C., C.S.M., P.G., and A.D.B.; Resources, M.T., T.T. and Z.J.G.; Writing – Original Draft, L.M.M. and Z.J.G.; Writing – Review & Editing, L.M.M., R.J.W., J.C., C.S.M., P.G., A.D.B., M.T., T.T. and Z.J.G.; Visualization, L.M.M.; Supervision, T.A.D., M.T., T.T., and Z.J.G.
Supplemental Tables
Table S1. Donor information for reduction mammoplasty samples and list of samples used for scRNAseq, FACS, and immunostaining experiments. Related to Figure 1.
Table S2. Summary statistics for sequencing of twenty-eight reduction mammoplasty samples. Related to Figure 1.
Table S3. Multiple linear regression analysis of the percentage of myoepithelial cells in the epithelium as measured by scRNAseq clustering. Related to Figure 2.
Table S4. Multiple linear regression analysis of the percentage of HR+ luminal cells in the epithelium as measured by scRNAseq clustering. Related to Figure 2.
Table S5. Multiple linear regression analysis of the percentage of HR- luminal cells in the epithelium as measured by scRNAseq clustering. Related to Figure 2.
Table S6. Multiple linear regression analysis of the percentage of HR+ cells in the luminal compartment as measured by scRNAseq clustering. Related to Figure 3.
Table S7. Association of the 20 highest-loading genes in PC1 for HR+ luminal cells with estrogen signaling, progesterone signaling, or the luteal phase of the menstrual cycle. Related to Figure 4.
Table S8. Canonical hormone-responsive genes differentially expressed in HR+ luminal cells between parous and nulliparous samples. Related to Figure 4.
Table S9. Genes differentially expressed in myoepithelial cells between parous versus nulliparous samples or obese (BMI >30) versus non-obese (BMI < 30) samples. Related to Figure 5.
Acknowledgments
We thank Drs. Tom Norman and Jonathan Weissman for technical support and for generously providing access to equipment and computing resources. Sequencing was performed in the Center for Advanced Technology at UCSF. This research was supported in part by grants from the Department of Defense Breast Cancer Research Program (W81XWH-10-1-1023 and W81XWH-13-1-0221), NIH (U01CA199315 and DP2 HD080351-01), the NSF (MCB-1330864), and the UCSF Center for Cellular Construction (DBI-1548297), an NSF Science and Technology Center. Z.J.G is a Chan-Zuckerberg BioHub Investigator. L.M.M is a Damon Runyon Fellow supported by the Damon Runyon Cancer Research Foundation (DRG-2239-15).
Footnotes
This version of the manuscript represents our updated findings based on sequencing 19 additional samples, for a total of 28 samples. All figures and text have been substantially revised.
References


