

Abstract
Rewards usually have multiple attributes that are relevant for behavior. For instance, even apparently simple choices between liquid or food rewards involve comparisons of at least two attributes, flavor and amount. Thus, in order to make the best choice, an organism will need to take multiple attributes into account. Theories and models of decision making usually focus on how strongly different attributes are weighted in choice, e.g., as a function of their importance or salience to the decision-maker. However, when different attributes impact on the decision process is a question that has received far less attention. Although one may intuitively assume a systematic relationship between the weighting strength and the timing with which different attributes impact on the final choice, this relationship is untested. Here, we investigate whether attribute timing has a unique influence on decision making using a time-varying sequential sampling model (tSSM) and data from four separate experiments. Contrary to expectations, we find only a modest correlation between how strongly and how quickly reward attributes impact on choice. Experimental manipulations of attention and neural activity demonstrate that we can dissociate at the cognitive and neural levels the processes that determine the relative weighting strength and timing of attribute consideration. Our findings demonstrate that processes determining either the weighting strengths or the timing of attributes in decision making can adapt independently to changes in the environment or goals. Moreover, they show that a tSSM incorporating separable influences of these two sets of processes on choice improves understanding and predictions of individual differences in basic decision behavior and self-control.
Introduction
Decisions regularly involve comparisons of several attributes of the choice options. Consider the example of deciding between foods that differ in two key attributes, tastiness and healthiness. Often these attributes are misaligned, creating a conflict between the goal of eating healthy foods and the desire to experience pleasant tastes. Typically, we assume that choices for the healthier or better tasting food are determined by the values of these attributes, together with a subjective decision weight that the decision maker assigns to healthiness and taste. The assumption that reward attributes are subjectively weighted in the course of decision-making applies not only to food choices, but also to many other types of decisions. In fact, it is a core feature of the standard analysis approaches for intertemporal, social, and risky decisions (Kahneman and Tversky, 1979; Mazur, 1987; Laibson, 1997; Fehr and Schmidt, 1999). Here, we show that this common approach is incomplete because it overlooks the possibility that reward attributes can enter into the decision process at different times (in addition to having different weighting strengths). Across several food choice paradigms, we find that there is considerable asynchrony in when tastiness and healthiness attributes enter into consideration. Furthermore, we demonstrate that the relative weighting strengths (i.e., the degree to which an attribute influences the evidence accumulation rate) and the onset times for tastiness and healthiness attributes in the decision process have separable influences on dietary choices and self-control.
We used an adapted time-varying sequential sampling model (tSSM) to better understand the dynamic decision processes underlying choices between rewards with multiple attributes. This model allows us to draw inferences on latent aspects of the decision process from the observable choice outcomes and response times. It is well established that direct measures and estimates of information acquisition, evaluation, and comparison processes during choice provide a key means of testing predictions from different models of how stimulus and decision values are constructed or used. Uncovering such features of the decision process allows us to discriminate between and evaluate the plausibility of different models that seek to explain choice behavior (Palminteri et al., 2017). For example, choice models utilizing not only decision outcomes but also response times and eye-or mouse-tracking data have provided insights into how and why decision-making is influenced by visual attention, time delays or pressure, additional alternatives, and earlier versus later occurring external evidence (Krajbich et al., 2010; Summerfield and Tsetsos, 2012; Hunt et al., 2014; Carland et al., 2016; Forstmann et al., 2016; Gluth et al., 2017; Kunar et al., 2017; Reeck et al., 2017). Moreover, it has been shown that dynamic accumulation models utilizing response-time data provide a deeper understanding of decisions and make better out-of-sample predictions than reduced form models such as logistic regressions (Clithero, 2018; Webb, 2018). Here, we show that we can also use response-time data to determine when specific attributes enter into the decision process, in addition to how strongly they influence the evidence accumulation rate.
An important implication of the finding that different attributes can enter into the choice process at separate times is that coefficients from traditional regression models (e.g., linear, logit, or probit) will represent a combination of both the true underlying weight or importance placed on each attribute and its relative (dis)advantage in processing time over the decision period. Therefore, any form of static1 or synchronous onset dynamic model will fail to fully capture the true underlying choice generating process. As a consequence, even though such models may explain multi-attribute choice patterns relatively well if the relationship between attribute weighting and timing is fixed or sufficiently stable, they will fail to explain or predict alterations in decision behavior if attribute weights and processing onset times can change independently in response to external environmental features or changes in internal cognitive strategies. The plausibility of this latter scenario is underlined by findings from mouse-tracking experiments (Sullivan et al., 2015; Lim et al., 2018) that different attributes (taste, healthiness) of the same food reward can enter into the decision process at separate times. However, the fundamental question of whether the relationship between attribute weighting strength and timing is stable or instead flexible and context-dependent has not yet been addressed
We addressed this question using an adapted sequential sampling model that quantifies both the weight given to each attribute and its temporal onset during the decision process. This allows us to explicitly measure whether the weighting strength and timing with which different attributes impact on choice are determined by a unitary process (or a set of consistently linked processes), or if, instead, attribute timing and weighting are the results of separable processes. By modeling choices from four separate datasets, which measured decision behavior under different experimental manipulations, we show that attribute timing and weighting are determined by dissociable decision mechanisms. For example, we find that explicitly instructing individuals to consider either tastiness or healthiness during the choice process exerts separate effects on attribute weighting strength and timing. In another experiment, we show that transcranial direct current stimulation (tDCS) over the left dlPFC during self-control has a selective effect on attribute weighting strength but not timing, demonstrating the separability of the underlying neural processes.
Results
We adapted the traditional drift diffusion modeling (DDM) framework (Ratcliff, 1978; Ratcliff et al., 2016) to allow for each attribute in a multi-attribute decision problem to enter into the evidence accumulation process at separate times (Figure 1). Note that we use the DDM as a starting point for our modeling analysis because this flavor of sequential sampling model is relatively simple, well established, and widely used to fit choice and response-time data across cognitive domains. However, a number of different sequential sampling model formulations exist, and in specific cases, these models make different predictions about choice and reaction-time distributions (Busemeyer and Townsend, 1993; Roe et al., 2001; Usher and McClelland, 2001; Stewart et al., 2006; Brown and Heathcote, 2008; Cisek et al., 2009; Hunt et al., 2014). However, in our food choice datasets, most of these sequential sampling models will be nearly indistinguishable (Bogacz et al., 2006; Hawkins et al., 2015; Thura and Cisek, 2016); we therefore refer to our current model as a sequential sampling model to emphasize it as one representative of this larger class of models. We also note that our results from the tSSM are consistent with theoretical and empirical work showing that sequential sampling models can capture changes in perceptual decision processes that result from known changes in externally presented evidence over time (Ratcliff, 1980; Cisek et al., 2009; Diederich and Oswald, 2016; Holmes et al., 2016; Holmes and Trueblood, 2017). However, in contrast to previous work on perception, we tested for asynchronous attribute consideration onsets in value-based choices for which the externally presented evidence is constant. In other words, we examined timing differences resulting from internal cognitive and neural processes instead of changes in the stimuli themselves.
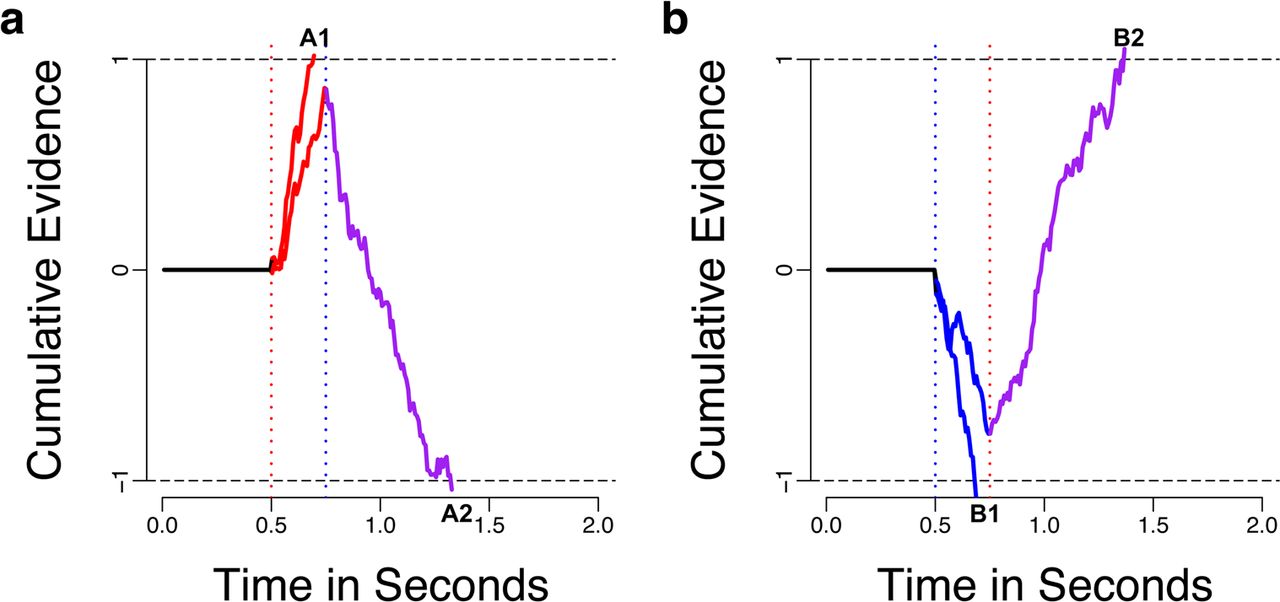
Simulated examples of asynchronous evidence accumulation. Both panels show two example trials in which the choice outcome was determined by a faster but weaker attribute or a slower, stronger attribute. The tastier choice is arbitrarily assigned to the +1 boundary, while the healthier choice is represented by −1. (a) In this example, tastiness is considered before healthiness, as indicated by the red and blue vertical dotted lines, respectively. For the first several milliseconds only taste-related evidence (red solid lines) is accumulated. In the case of trial A1, the cumulative evidence reaches the threshold before healthiness is ever considered and a choice in favor of the tastier item is made. However, in trial A2, the cumulative evidence does not reach the threshold before healthiness begins to be considered and the combination of weighted taste and healthiness attributes (red + blue = purple solid line) drive the choice to be made in favor of the healthier option. Trials A1 and A2 are identical in all respects and the two different outcomes are the result of variability in the sampling noise over time. (b) Simulated trials B1 and B2 are analogous to A1 and A2, with the relative timing and weighting parameters swapped between taste and healthiness such that healthiness (blue solid line) now enters into consideration before tastiness.
The full details of the tSSM are described in the Methods section, but briefly the relevant addition is a free parameter estimating how quickly one attribute begins to influence the rate of evidence accumulation relative to another. In the food choices analyzed here, the parameter always measures the start time for healthiness relative to taste (relative start time). This effectively allows for different amounts of time to pass between stimulus onset and the points at which healthiness versus tastiness attributes begin to influence the rate of evidence accumulation. Based on previous mouse-tracking results (Sullivan et al., 2015), our model formulation makes the simplifying assumption that once an attribute comes into consideration it continues to influence the rate of evidence accumulation until the choice is made. We tested this formulation of the tSSM in four datasets with different experimental conditions (mouse-tracking choices, standard binary choices repeated two weeks apart, choices following attentional cues toward taste or healthiness, and choices under tDCS; see Methods for details) and a total of 272 participants. The tSSM yielded a better fit to choices and reaction time distributions overall than the standard formulation of an SSM with a single, synchronous onset time (tSSM BIC = 280632.3, standard SSM BIC = 281909). Moreover, the improvement in the fit for the tSSM over the standard SSM was proportional to the absolute value of the estimated relative start time for a given participant (Table S1). This relationship is expected because the greater the difference in onset times between taste and healthiness, the more behavior will deviate from the predictions of the standard, synchronous onset SSM.
Parameter recovery tests for attribute weighting and relative-start-times
The fact that the tSSM yields a better fit to the behavioral data indicates that the model captures the choice process better than a standard SSM. However, we also conducted a set of parameter recovery tests to determine how accurately the tSSM could recover known combinations of the weighting and timing parameters, holding all other parameters constant. These tests showed that our implementation of the tSSM accurately recovers various combinations of known attribute weighing and relative start time parameters from simulated choice and response time data. A Bayesian pair-wise test (Kruschke, 2013) showed that the model accurately recovered the generating parameters because we found no significant differences between the true generating and model-estimated parameters (ωtaste mean difference = −0.008, Posterior Probability (PP) (mean difference > 0) = 0.36, 95% highest density interval (HDI) = [−0.05; 0.04]; ωhealth mean difference = 0.03, PP(mean difference > 0) = 0.92, 95% HDI = [−0.01; 0.08]; RST mean difference = 0.004, PP(mean difference > 0) = 0.65, 95% HDI = [−0.02; 0.02]).
Evaluating tSSM performance on human choice data
As an initial test of our model estimation procedures on real choice data, we reanalyzed the data from Sullivan et al. (2015), henceforth SHHR, using our tSSM. SHHR used an analysis based on computer-mouse response trajectories in food choices to determine the relative times at which health and taste attributes enter into the decision. We compared the estimates they obtained from this analysis of response trajectories with those we computed using the tSSM for the same data (Table 1). There was a high correspondence in timing estimates across the two analysis strategies: Using a Bayesian correlation analysis, we found that SHHR’s estimates of healthiness onset times (i.e., the earliest time at which the healthiness attribute became significantly correlated with response trajectories, see their Figure 4b) were significantly correlated with the times at which the tSSM estimated healthiness attributes to enter into the evidence accumulation process (r = 0.503, PP(r > 0) = 0.991, 95% HDI = [0.157; 0.811]). Together with the parameter recovery tests, these findings indicate that our tSSM procedure can accurately distinguish between the effects of onset timing and attribute weighting (i.e., effects on the rate of evidence accumulation) in multi-attribute, value-based decision problems.
Fitted tSSM parameters for each study and condition
Predicting behavior within and across samples
The tSSM parameters predicted individual differences in decision-making patterns in SHHR’s participants (Table S2; for other studies see Tables S3, S4, and Table 3). The measure of individual differences we focus on is self-control success, defined as the percentage of trials on which a participant chose the healthier over the tastier food when these two attributes conflicted. We took a leave-one-subject-out (LOSO) approach to generate independent self-control predictions for each of the 28 participants in SHHR’s dataset with a linear regression model that used the tSSM parameters to explain self-control in the remaining 27 participants (see Eq. 3). The mean correlation between predicted and observed self-control was r = 0.61 (PP(r > 0) = 0.9998, 95% HDI = [0.37; 0.82]) and the mean absolute error between predicted and observed self-control was 6.3% (95 % HDI = [0.59%; 14.0%]).
In order to address the issues of predictive utility and generalizability, we examined the tSSM’s accuracy in predicting decision outcomes for individual trials as well as participants’ self-control across different samples and experiments. First, we predicted individual trial outcomes using data on binary food choices made by the same individuals on two separate visits to the lab (2 weeks apart; see data set 2 – GFC in Methods section). On each visit, 150 choice pairs were randomly generated and selected for each participant under the constraint that the two items could not be rated equally on the healthiness attribute. We fit the tSSM to each participant’s Session1 responses and used those fitted parameters to predict the choices made by the same individual on every trial in Session2. The mean balanced accuracy (BA, see Eq. 2 in methods) for predicting future choices (left vs right item) was 0.77 (95% HDI = [0.74; 0.79], PP(BA > .50) > 0.99999) over all participants and was better than chance (0.50) for all individuals (min = 0.63, max = 0.87). Reversing the process to predict Session1 choices from fits to Session2 responses yielded similar results (mean BA = 0.77, 95% HDI = [0.75; 0.79], PP(BA > .50) > 0.99999).
Next, we used the tSSM parameters fit to data from each of the four independent studies (Fig. S1) to predict participants’ self-control in the other 3 studies. This procedure yielded 12 sets of cross-study predictions in total and tested the model’s ability to predict self-control across different food choice paradigms, study/participant locations (Pasadena, U.S.A. vs Zurich, Switzerland), and environmental contexts (e.g., supine inside the MRI scanner, sitting in a computer lab, anticipating tDCS). Note that only one out of the four studies (study 4, TDCS) recruited participants based on the criteria that they had an internal desire to maintain a healthy lifestyle and that were explicitly committed to using dietary self-control during the choice task. In the other three studies, references to self-control included: reading a text on the importance of eating healthy before making choices (study 1, SHHR), cues to direct attention toward healthiness on a subset of trials (study 3, HMR), or no mention of self-control whatsoever (study 2, GFC). Nevertheless, there was substantial variability in how often participants used self-control (i.e., chose healthier over tastier outcomes when the two attributes were in conflict) within all four studies.
Despite the differences in experimental design and participant characteristics across studies, the correlations between predicted and observed self-control were significant in 11 out of 12 cross-study prediction tests (Table S5). A direct comparison of the mean absolute error (MAE) between tSSM- and legit-based predictions showed that, on average, tSSM-based out-of-sample predictions of self-control led to an MAE that was 6.7 percentage points smaller (i.e. better) (95 % HDI = [2.38; 10.9], PP(tSSM MAE < logit MAE) > 0.9973). These results indicate that the tSSM can be used to make out-of-sample and cross-context predictions about dietary choice behavior that are superior to those derived from commonly used logistic regression modeling techniques. Thus, rather than being limited by overfitting, we find that the tSSM generalizes better than simpler logistic regression models, in terms of making out-of-sample predictions about decision making.
Using the tSSM to test the links between attribute weighting and timing
Having established the face validity, accuracy, and predictive utility of our modeling approach, we next used the tSSM to test several fundamental questions about how attribute timing and weighting work together, or potentially separately, to influence choice outcomes during self-control challenges.
Are more abstract attributes considered later in the choice process?
One may assume that for dietary choices, the relative start time of the more abstract attribute (healthiness) will lag behind the more concrete and immediately gratifying attribute of taste. However, our results indicate that this is not the case. Pooling the data across all studies, we found that the posterior probability that healthiness entered into consideration later than tastiness was only 0.48 (mean difference in starting times = 0.001 seconds, 95% HDI = [−0.05; 0.06). In total, only 130 out of 272 participants (48 %) had relative-start-times for healthiness attributes that were later than those for tastiness. Figure 2a shows the relative start times for all participants by study. While more abstract or complicated attributes can enter into the decision process later in some cases, our results demonstrate that abstractness is not the main determinant of when an attribute will begin to be considered during a multi-attribute choice (see also supplementary results section 1.1).

Panel (a) shows the relative start times in seconds for healthiness compared to tastiness for all participants in each study. Positive values indicate that tastiness is considered before healthiness and negative values that healthiness is considered before tastiness. In each column every dot is a separate participant. The thick black horizontal bars represent within-study means and the rectangular bands indicate the 95% highest density intervals (HDIs). Dataset abbreviations: SHHR = data from the computer-mouse response trials in Sullivan et al 2015; HMR = data from the natural choice condition in Hare et al 2011; GFC = newly collected data from the first session/day of an experiment combining gambles and food choices; TDCS = newly collected data from the pre-stimulation baseline choices in our tDCS experiment. The scatterplot in (b) plots each participants’ relative timing data against attribute weights, separated by whether the relative weighting of tastiness and healthiness and their relative timing are aligned (gray circles) or whether there is misalignment between weighting and timing (i.e., the highest weighted is not the fastest; black circles). The highest weighted and fastest-to-be-considered attributes were misaligned in 38% of participants.
How are relative start times related to attribute weights and other tSSM parameters?
We addressed this question by computing a linear regression model that estimated the association between relative start times and all other tSSM parameters (see Eq. 1). The relative-start-time parameter was related to both the tastiness and healthiness weights as well as the to the starting point bias parameter (Table S6), but overall the combination of other tSSM parameters explained only 30% of the variability in relative start times across participants. Figure 2b displays the relationship between relative start times and weights for taste and healthiness and shows that while the higher weighted item most often entered into consideration faster (gray dots), this was only true for 62% of the participants (95% HDI = [56%; 68%]). These results suggest that the onset times for choice attributes are not strictly determined by either their relative weights or other aspects of the decision process quantified by the tSSM parameters.
Effects of attention cues on attribute weights and relative-start-times
We also examined whether directing attention toward either healthiness or tastiness could change the time at which those attributes enter the decision process and if changes in timing were linked to changes in weighting strength. This analysis was motivated by previous findings (Hare et al., 2011) that directing attention to the healthiness aspects of a food item resulted in substantial changes in choice patterns (Figure 3a). In that experiment, instructive cues highlighted health (HC), taste (TC), or neither attribute (NC) for explicit consideration during the upcoming block of 10 food choices. The original analysis of these choice data focused on the regression weights for taste and health attributes in each choice condition but did not consider that the cues might change the relative times at which these attributes entered into the choice process. Our goal was to determine how potential alterations in attribute timing and weighting contributed to the observed changes in choice behavior during health cue relative to natural blocks. Therefore, we reanalyzed the choice data from this study, fitting the tSSM to each attention condition separately.

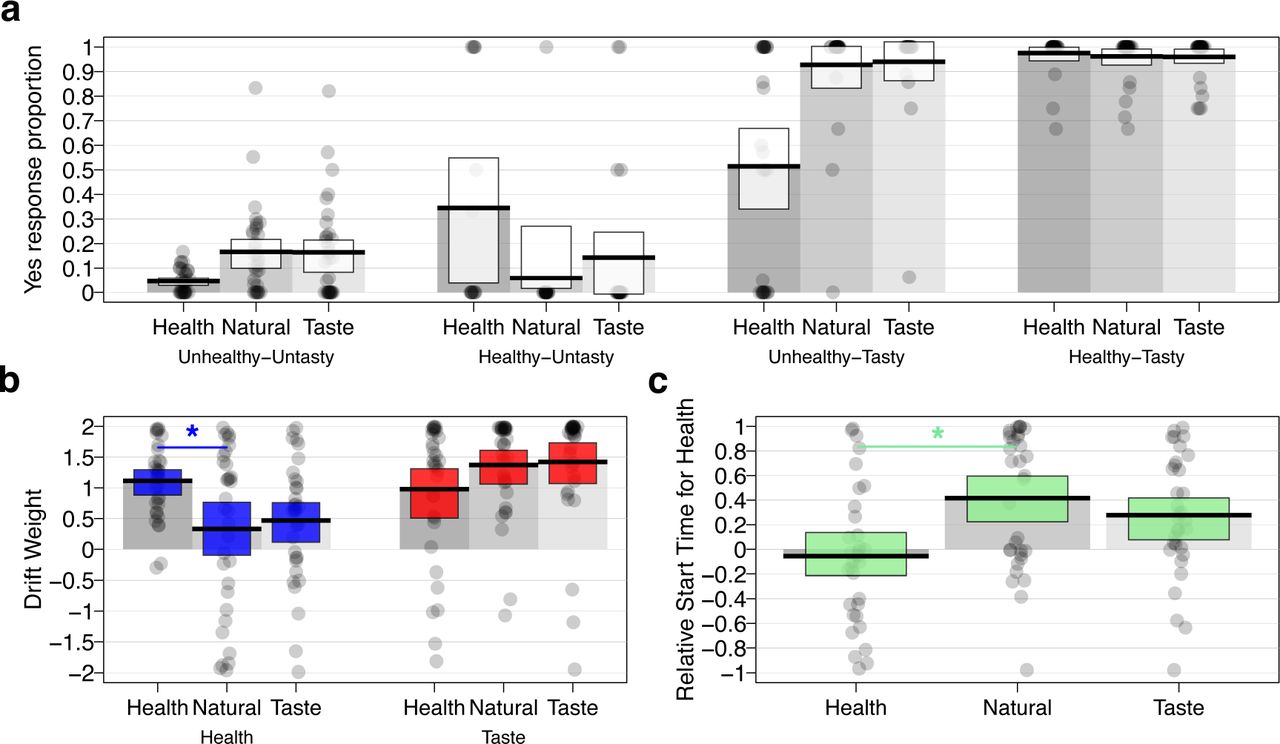
Choice patterns and tSSM parameter estimates for the HMR study by condition. (a) Proportion of times that subjects chose to eat the food (i.e., they responded “yes” or “strong yes”) as a function of attention cue type (Health, Natural, or Taste) and taste-health combination of food under consideration (Tasty or Untasty crossed with Healthy or Unhealthy). In terms of mean choice proportions, directing attention towards healthiness decreased the proportion of choosing healthy-untasty items and decreased the proportion of choosing unhealthy-tasty items compared to the natural condition. The changes in choices during Health blocks were accompanied by higher weights and faster relative-start-times for healthiness. (b) Compared to the natural condition, attention cues to health resulted in a higher drift weight (arbitrary units) for the corresponding attribute health attribute compared to the natural condition (blue shading), whereas no such effect was observed for the drift weights of the tastiness attribute (red shading). (c) Attention cues to health also led to a faster relative start time (seconds) for health compared to taste attributes compared to natural blocks (green shading). For all plots, the dots within each column represent the value for a single participant in the sample. Darker shading indicates that multiple participants share the same value for that parameter. Black horizontal bars indicate condition means and white, blue, red, or green shaded rectangles indicate the 95% HDIs for each measure. The gray shaded bars in each plot serve to visually separate the columns for each condition and demarcate the zero-points on the y-axes.
First, we found that attention cues changed both the relative weighting and timing of taste and healthiness attributes. Compared to the natural choice blocks, 70% of participants reversed their relative weighting of taste and healthiness in taste or health cue blocks (i.e., went from taste > healthiness to taste < healthiness weight or vice versa), and 64% switched whether they considered tastiness or healthiness first. There was no significant difference in the prevalence of weighting versus timing reversals between attribute-cued and natural-choice blocks (PP(weight reversal more prevalent than timing reversal = 0.70))
Focusing on the health cue blocks that showed a significant change in choice outcomes compared to natural choices (Fig. 3a), we found that cuing attention to health attributes both significantly increased the magnitude of participants’ weights for health (ωhealth) and sped up the time at which health entered into the accumulation process (relative to taste, i.e., relative start times) (Figure 3b-c; Table 2). The weight placed on taste attributes did not significantly change, on average, in health-cued relative to natural blocks. Furthermore, the changes in health relative to taste weighting parameters and relative-starting-times were not significantly correlated across participants (r = 0.141, 95% HDI = [−0.197; 0.462], PP(r > 0) = 0.79). These results indicate that individuals responded to attention cues in different ways. Over 90% of participants shifted at least one of three possible parameters (the health or taste attribute weight or the relative-start-time) in favor of healthy choices during the health-cued trials. However, only 64% changed one of the attribute weights and the relative timing, while just 33% changed both attribute weights plus the relative timing. Thus, attribute timing and weighting appeared to explain separate aspects of the individual variation in dietary self-control.
This table shows the effects of attention cues on the tSSM parameters estimated from choice data in HMR’s study. Changes in relative starting times (RST), taste, and healthiness weighting parameters induced by the experimental conditions that are shown in bold were significantly different from zero. Mean differences and their 95% highest density intervals (HDI) were computed based on 100,000 samples drawn from the posterior distributions of each parameter (Kruschke, 2013). The third column displays the posterior probabilities that differences are greater than zero. All comparisons were made so that a priori predicted effects would be positive.
Therefore, we tested the ability of each of the tSSM parameters to explain individual differences in behavior within this dataset. First, we a fit linear regression model to test if attention to different attributes changed the relationship between self-control behavior and tSSM parameters. This regression showed that the relationships between both attribute weighting and relative-start-time parameters and behavior were changed by attention cues (Table 3a). The health weighting parameter was more closely related to self-control in health-cued trials than in natural choices. Moreover, the relative starting time was associated with self-control only in the health-cued decision blocks.
Results from Bayesian linear regression models explaining self-control levels (SCL) by attention cues and parameters of the tSSM in the HMR data. A) shows the results of a hierarchical linear regression that seeks to explain SCL as a function of tSSM parameters and attention conditions. The regression includes random intercepts for each participant. B) shows the results of linear regression testing if the change in SCL between the health and natural cue conditions is associated with baseline (i.e., natural condition) tSSM parameters and/or the change in tSSM parameter values between conditions (i.e. HC – NC). The linear regression reported in part B is also the basis for the predictions shown in Figure 4, but in that case is estimated 33 separate times, leaving one participant out on each iteration.
Second, we tested if and how changes in the tSSM parameters related to changes in behavior between the health-cued and natural conditions. To do so, we fit a linear model (see Eq. 4) using both the baseline (i.e., natural) values and the difference scores between health-cued and natural tSSM parameters to explain the within-subject changes in choice patterns across conditions (Table 3b). This regression showed that changes in behavior were explained by both baseline non-decision times and changes in the relative start times between the health-cued and natural conditions. Specifically, self-control increased more in the health-cued trials for those participants who began to consider healthiness earlier in the health-cued trials. In contrast, individual differences in the degree of self-control improvement between health-cued and natural choices were not systematically related to changes in attribute weighting between the two attention conditions.
Finally, we computed predictions of behavioral change between the two conditions using the same linear regression specification (Eq. 4) in a leave-one-subject-out (LOSO) fashion. In other words, we recomputed the linear regression model multiple times, each time leaving out a single participant in order to generate an out-of-sample prediction of that participant’s behavioral change across conditions using the model fitted to the data of the other participants. The tSSM parameters significantly predicted the change from baseline (i.e., natural choice cues) behavior during the health-cued choices in held-out test participants (Figure 4; r = 0.69, (PP(r > 0) = .99995, 95% HDI = [0.465; 0.837]).

Out-of-sample predicted and observed changes in self-control (SC) choices from the natural choice cue baseline to health cue choices in the HMR study. Each dot represents one participant. The tSSM parameter changes predicted the self-control change from baseline significantly, as indicated by the correlation between the difference of actual self-control levels (y-axis) and the out-of-sample predicted self-control levels based on the tSSM estimates (r = 0.61 (PP(r > 0) = .99995, 95% HDI = [0.383,0.804]). The solid line indicates the best linear fit and the gray shading indicates the 95% confidence interval.
Dissociating attribute weighting strengths and timing at the neural level
We next addressed the question of whether attribute weighting strength and timing are implemented by dissociable neural processes. We did so by analyzing data from an experiment applying cathodal, anodal, or sham transcranial direct current stimulation (tDCS) over left dlPFC during food choices (see Methods section for details). Numerous neuroimaging and electrophysiological studies have reported correlational evidence for a role of the dlPFC in multi-attribute choice (Krawczyk, 2002; Kable and Glimcher, 2007; Rushworth and Behrens, 2008). There is also ample evidence that applying brain stimulation (both transcranial direct current and magnetic) over multiple different sub-regions of the left or right dlPFC is associated with changes in several forms of multi-attribute decision making (Knoch et al., 2008; Camus et al., 2009; Figner et al., 2010; Cho et al., 2012; Essex et al., 2012; Ruff et al., 2013; Shen et al., 2016). Here, we applied tDCS over a region of the left dlPFC that has been shown to correlate with individual differences in dietary self-control and multi-attribute decisions more generally (Zysset et al., 2006; Hare et al., 2009; Hare et al., 2011; Kahnt et al., 2011; Luo et al., 2012; Kool et al., 2013; Hare et al., 2014; Rudorf and Hare, 2014; Enax et al., 2015; Maier et al., 2015) in order to uncover the mechanistic changes in the choice process caused by tDCS over this particular region.
Previous studies suggest that the effects of stimulation over left dlPFC are strongest on trials in which the participant does not strongly favor one outcome over the other (i.e., stimulation effects are greatest in difficult choices) and depend on baseline preferences over the rewards (Figner et al., 2010; Shen et al., 2016). Therefore, we restricted our analysis of dietary self-control to trials in which the predicted probability of choosing the healthier food was between 0.2 and 0.8 and focused on the difference in behavior between baseline and active-stimulation choice sessions (Table S7; see Methods for details). To quantify how active versus baseline tDCS affects individual levels of self-control, we compared the interaction effects measuring changes in each participant’s self-control from the baseline to the stimulation condition for cathodal and anodal versus sham simulation groups. This revealed a greater decrease in self-control under cathodal relative to sham stimulation (regression coef. = −0.36 ± 0.15, 95% HDI = [−0.67; −0.06], PP(cathodal polarity X active stimulation interaction coef. < 0) = 0.99, Figure 5a), but no change in self-control for anodal relative to sham stimulation (regression coef. = −0.03 ± 0.15, 95% HDI = [−0.32; 0.27], PP(anodal polarity X active stimulation interaction coef. > 0) = 0.44). Thus, we find that inhibitory stimulation over left dlPFC leads to decreased dietary self-control.

Changes in self-control (SC) following tDCS over left dlPFC. This plot shows the changes in self-control under stimulation compared to baseline across stimulation groups. Each dot represents the difference between stimulation or sham and baseline in one participant. Left dlPFC-targeted cathodal (but not anodal) stimulation significantly decreased self-control compared to sham stimulation, PP(cathodal polarity × active stimulation interaction coef. < 0) = 0.96. Black horizontal bars indicate group means and rectangular bands depict the 95% HDIs. The gray shaded bars in each plot serve to visually separate the columns for each condition and demarcate the zero-points on the y-axes.
In order to elucidate the changes in choice processes caused by the stimulation, we fit the tSSM to dietary choices made during the pre-stimulation baseline and active or sham tDCS sessions. Before reporting the tDCS-induced changes in choice mechanisms, we note that the tSSM fit choice behavior well in both sessions (see Figure S1). The tSSM fits to both the baseline and stimulation choices predicted a substantial amount of the variation in self-control success across individuals (correlation between LOSO-predicted and observed self-control at baseline: r = 0.83, (PP(r > 0) = 0.99995, 95% HDI = [0.78; 0.87], Figure 6a; and under stimulation: r = 0.90, (PP(r > 0) = 0.99995, 95% HDI = [0.87; 0.92], Figure 6b). Furthermore, the changes in tSSM parameters also predicted changes in self-control between the stimulation and baseline sessions for all participants regardless of the stimulation condition (r = 0.57, (PP(r > 0) = 0.99995, 95% HDI = [0.48; 0.67], Figure 6c). Lastly, we found that tSSM parameters fit to odd stimulation trials predicted even trial outcomes accurately overall (mean balanced accuracy for trial-wise predictions across all participants was 67% (PP(BA > 0.5) > 0.99999, 95% HDI [65%; 69%]), and that the accuracy levels did not differ by stimulation condition (see supplemental results). These results indicate that the tSSM captured the choice process equally well in the anodal, cathodal, and sham tDCS conditions and that it is reasonable to compare the parameters across sessions and groups.

Out-of-sample predicted and observed self-control in the TDCS study across all stimulation conditions. Each dot represents one participant. (a) The tSSM fits to the baseline choices significantly predicted out-of-sample self-control during the baseline, pre-stimulation choice session, r = 0.83 (PP(r > 0) > 0.99995, 95% HDI = [0.78,0.87]). (b) The tSSM fits to the stimulation session choices also predicted out-of-sample self-control, r = 0.90, (PP(r > 0) = 0.99995, 95% HDI = [0.87; 0.92]. (c) Lastly, changes in the tSSM parameters between the baseline and stimulation choice sessions significantly predicted intra-individual changes in self-control between sessions regardless of stimulation condition (r = 0.52, PP (r > 0) = 0.99995, HDI = [0.42,0.63]). The solid lines indicate the best linear fit and the gray shading indicates the 95% confidence intervals.
Having established that the tSSM can explain the patterns of choice behavior, we tested how the tSSM parameters changed between baseline and active stimulation sessions in each group. We found that the cathodal group had increased weighting of taste attributes relative to baseline choices (mean difference = 0.14, HDI = [0.03; 0.25], PP(Cath active > Cath baseline) = 0.99; Figure 7a) and that the change from baseline was greater under cathodal stimulation than sham (mean difference = 0.21, 95% HDI = [0.01; 0.42], PP(Δ Cath > Δ Sham) = 0.98). There were no significant changes in the health weighting parameter. Crucially, the relative-start-time parameters were also unaffected during left dlPFC targeted cathodal tDCS (Table 4, Figure 7b). Moreover, the tDCS-induced changes in taste relative to health weighting parameters and relative start times were not significantly correlated (r = −0.07, 95% HDI = [−0.325; 0.188], PP(r > 0) = 0.30). Consistent with the lack of significant change in choice behavior under anodal tDCS, we found no significant changes in any tSSM parameter under anodal stimulation (Table 4). In summary, we found that cathodal tDCS over left dlPFC selectively influenced the decision weight placed on taste attributes, but not the speed with which taste, relative to healthiness, began to influence the choice process (Table 4).
This table reports changes in the tSSM relative-starting-times (RST), taste, and healthiness weighting parameters as a result of tDCS over the left dlPFC. Rows in bold indicate changes that are significantly different from zero. The Δ symbol always indicates a difference score equal to the value in the stimulation minus the baseline session within a given condition. Rows containing this symbol report differences of differences across conditions. Mean differences (or differences of differences) and their 95% highest density intervals (HDI) were computed based on 100,000 samples drawn from the posterior distributions of each parameter. The third column displays the posterior probabilities that differences are greater than zero. All comparisons were made so that a priori predicted effects would be positive.

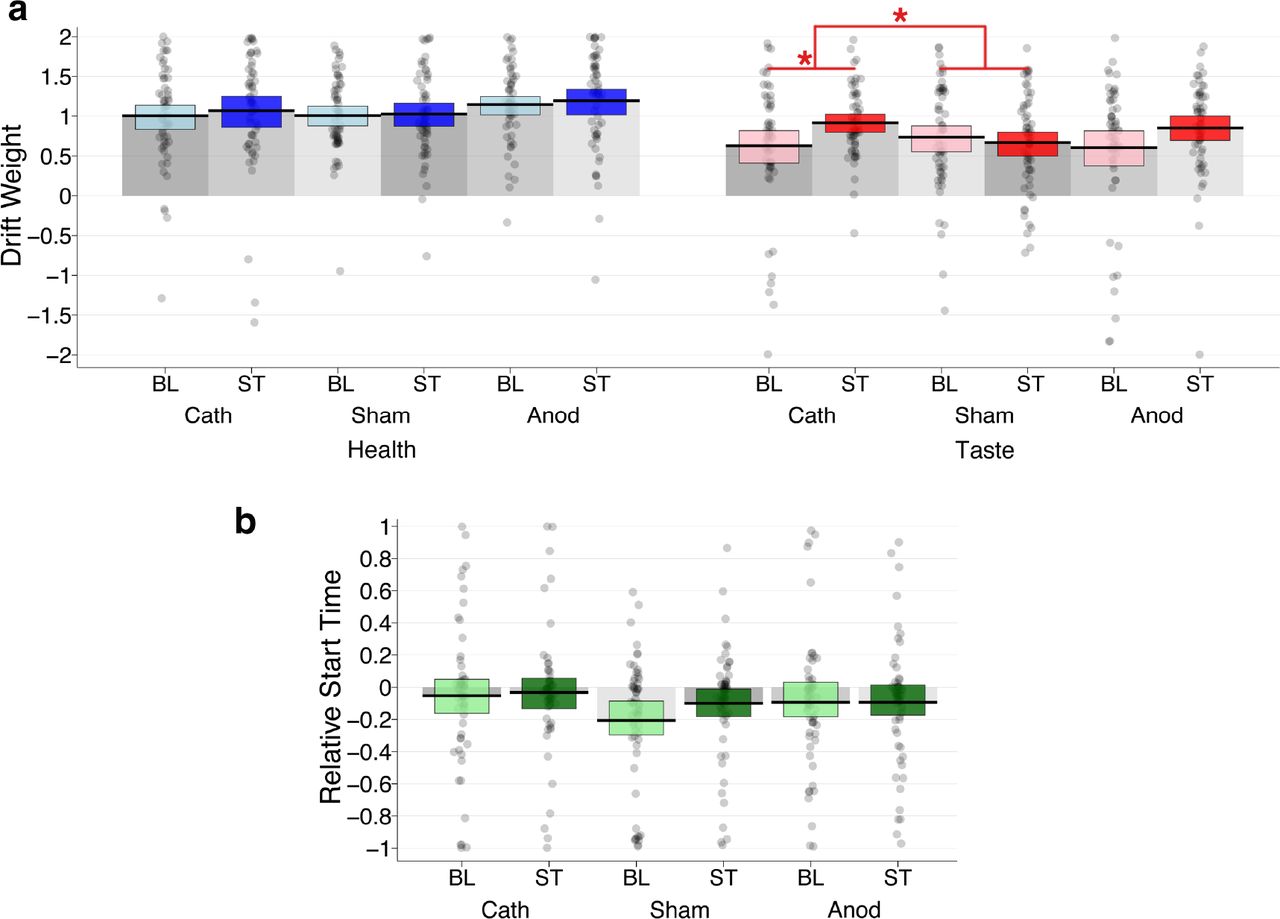
Changes in tSSM parameters during tDCS over left dlPFC. (a) Cathodal stimulation increased the weighting of taste attributes (ωtaste, red shading on right) relative to baseline choices, PP(Cath ST > Cath BL) = 0.99). This change from baseline was greater under cathodal stimulation than sham, PP((Cath ST – Cath BL) > (Sham ST – Sham BL)) = 0.98). The red lines and stars highlight this main effect and interaction. Anodal stimulation did not lead to significant changes in attribute weighting parameters, and neither tDCS protocol affected drifts weights for healthiness (ωhealth, blue shading on left). The weighting strength parameters are plotted in arbitrary units. (b) tDCS had no significant effect on the RST parameters (plotted in seconds, green shading). Black horizontal bars indicate group means and blue, red, or green shaded rectangles indicate the 95% HDIs for each parameter. The gray shaded bars in each plot serve to visually separate the columns for each condition and demarcate the zero-points on the y-axes.
Discussion
We have shown that separable mechanisms determine the degree to which an attribute affects the evidence accumulation rate (weighting strength) and the relative speed with which it begins to do so (timing). Moreover, these weighting and timing parameters each explain substantial unique variation in decision making across individuals and account for distinct aspects of the change in behavior in response to attention cues and brain stimulation. Thus, we conclude that both attribute timing and weighting strength must be examined if we seek to better understand decision making at the mechanistic level.
The clearest evidence that timing and weighting strength are dissociable comes from our tDCS experiment showing that stimulation over the left dlPFC caused a change in the weights placed on the taste factor, but not the timing of taste versus healthiness attributes during dietary choices. Moreover, changes in the relative weighting and the relative timing of each attribute between baseline and cathodal stimulation sessions were not significantly correlated, further indicating that the neural mechanisms altered by our tDCS protocol were specifically related to attribute weighting.
The use of analysis strategies that quantify the separate effects on relative timing and weighting is important for interpreting brain stimulation data on the role of dlPFC and other brain regions in value-based choices. Previous studies have reported that stimulation targeted over various brain regions causes changes in several forms of decision making including choices over tradeoffs between monetary amounts and risk or time, or between rewards for oneself and others (Knoch et al., 2008; Camus et al., 2009; Figner et al., 2010; Cho et al., 2012; Essex et al., 2012; Ruff et al., 2013; Brevet-Aeby et al., 2016; Shen et al., 2016; Marechal et al., 2017). Notably, all of these choices involve multi-attribute stimuli and, frequently, conflict between the different attributes. In light of our modeling results, we can speculate that the mechanistic change caused by stimulation over the dlPFC is in the attribute weighting process in some cases. However, the different studies have targeted a range of dlPFC coordinates across both the left and right hemispheres and have used various forms of brain stimulation with potentially different local and widespread effects. Therefore, we should not assume that altered attribute weighting is the mechanistic result of every dlPFC-targeted stimulation protocol. Fortunately, asynchronous evidence accumulation modeling methods, such as the tSSM used here, could be applied to most of the existing datasets cited above or newly acquired data to gain further insights into how and why brain stimulation causes changes in choice behavior. Moreover, such analyses are by no means limited to brain stimulation and can be applied to any set of response-time and choice data on multi-attribute decisions (e.g. self/other, amount/delay, risk/magnitude) under different biological or experimental conditions, perhaps elucidating other neural regions that are involved in determining the relative timing of attribute consideration.
In our current work, for example, we found that the importance given to a specific attribute, as well as its speed in entering into the choice process, could be altered by instructions that directed attention to a specific attribute. Although a large body of work has established that value construction and comparison processes are malleable and subject to attention, perceptual constraints, and other contextual factors (Krajbich et al., 2010; Bhatia, 2013; Hunt et al., 2014; Caplin, 2016; Reeck et al., 2017), the influence of attribute consideration timing within a given decision is rarely discussed or directly tested. Query theory (Johnson et al., 2007; Weber and Johnson, 2009) is a notable exception in that it explicitly posits that the order in which attribute values are queried from memory or external sources will bias value construction and choice processes because the recall of initial attributes reduces the accessibility of subsequent attributes. Although the current data cannot be used to address the question directly, future experiments may address the important mechanistic question whether or not memory retrieval is a driving factor in the consideration onset asynchronies revealed by the tSSM.
Despite open questions about the relationship between memory and relative starting times, our finding that attribute consideration start times are asynchronous lends strong support to the idea that choices are made based on comparisons of both separate attribute values as well as overall option values. Hunt and colleagues (Hunt et al., 2014) demonstrated that a hierarchical sequential sampling process that operates over both separate attribute and overall option values explains risky choice behavior and brain activity better than models operating only on integrated values. Reeck and colleagues (Reeck et al., 2017) have shown that individual variation in temporal discounting can be explained by patterns of information acquisition that support attribute-wise or option-wise comparisons; moreover, their study shows that choices can be made more patient by an experimental manipulation that promotes attribute-wise comparisons compared to one promoting option-wise comparisons. Together, these results and others (e.g. Roe et al. (2001) and Bhatia (2013)) indicate that attribute-level comparisons play an important role in determining choice outcomes. Hierarchical attribute and option-level comparisons are implicit in our specification of the tSSM because the choice outcome and response time are determined by a weighted sum of the differences in attribute values. However, we show that attribute-level comparisons do not all begin at the same point in time, and that the magnitude of the difference in relative start times across attributes influences both attribute-level and option-level comparisons.
The results from the attention-cuing paradigm also establish that the relative start times for different attributes are not automatic or fixed. This implies that the asynchrony of attribute consideration onset times in food choices is unlikely to be the result of competition between fast automatic processes and slower, more deliberate processing. Although other theoretical and empirical work (Achtziger and Alós-Ferrer, 2013; Caplin and Martin, 2016; Alós-Ferrer, 2018) has shown that, in some cases, sequential sampling processes might be separately employed or influenced by both fast, automatic or heuristic systems and slower deliberative processing, such dual-process competition is inconsistent with our findings. If tastiness (or healthiness) affected the choice process first only because it was processed automatically, then attention cues would not change the order of relative starting times between attributes. However, we found that attribute cuing led to a reversal of which attribute was processed faster for 64% of the sample. Furthermore, the block type changed every 10 trials, indicating that the adjustments to relative start times occurred more flexibly and rapidly than could be accounted for by habitual processing. A heuristic or rule-based strategy (i.e., always choose the healthier food) is also inconsistent with our data because both tastiness and healthiness levels influenced choices and response times, indicating active evaluation of both attributes rather than application of a simple rule. In summary, our data are consistent with asynchronous attribute consideration onset times within a goal-directed processing system rather than competition between goal-directed and other forms of behavior.
Our results raise important questions about how attribute weighting strengths and onset timing jointly influence choice outcomes: How should we interpret choices in which the outcome is determined by the advantage in relative timing as opposed to weighted evidence? Could this be strategic use of cognitive flexibility to align decision making with current goals or should we consider such outcomes to be mistakes? Traditionally, a weighted combination of all attribute values is assumed to yield the “correct” choice (Payne et al., 1993). If the weighting strength on each attribute is appropriate, then any asynchrony in onset timing could produce suboptimal choices (i.e., choices in favor of options with a lower weighted sum over all attribute values than another available alternative). In that sense, it is surprising that we find substantial attribute onset asynchrony in healthy young adults and that, in individuals striving to maintain a healthy lifestyle (i.e., the sample recruited for our tDCS experiment), a higher level of asynchrony is associated with better dietary self-control. However, this view is predicated on the assumption that the attribute weighting strengths are appropriate for the current goal or context. On the other hand, if a decision maker knows (not necessarily explicitly) that her standard attribute weights are inconsistent with her current decision context or goal, and adjusting those weights by the necessary amount is costly or unlikely, then shifting the relative onset timing could be an effective means of reducing effort and improving the chances of making a goal-consistent choice. For example, a decision maker who goes on a diet may find it difficult to convince herself that she does not like the taste of ice cream and/or to constantly trade off this delicious taste against the downsides of excess sugar and fat. An alternative way to bring about self-control in this situation may be to adjust the process(es) that determine relative start times for healthiness and tastiness, to focus on the healthiness of each alternative option alone for a brief period in order to forgo extremely unhealthy options (without putting in time or effort to compare taste benefits to health costs). This would be consistent with the idea that rational inattention strategies (Sims, 2003; Caplin and Dean, 2015; Krajbich and Dean, 2015) can be employed as a means of reducing effort costs. Specifically, if the time advantage for healthiness is large enough, then one could theoretically decide against eating an unhealthy food before even considering its tastiness and thus not experience temptation or conflict. However, we do not yet know if this actually happens or if adjusting the process determining relative onset times is, in fact, less effortful or more likely to succeed than strategies that alter the attribute weighting strengths.
Altering the processes that determine the relative onset times could be a means or a result of delaying and reducing attention. However, although we found that both cueing attention to healthiness and having the goal of maintaining a healthy lifestyle (tDCS sample vs all others) were associated with faster average onset times for healthiness attributes, we do not know yet if relative onset times can be manipulated as part of a deliberate strategy. It is also important to note that the response to healthiness cues was heterogeneous in the sense that, although most participants made healthy choices more often following those cues, many participants changed only attribute weights or only attribute start times in favor of healthy choices, rather than both. We do not yet know why individuals responded to these cues in different ways. Critically, the sources of this heterogeneity in response to attention cues - or any other manipulation or environmental change - can only be identified and further studied if one uses models of decision making that explicitly account for the asynchrony in attribute consideration start times.
The ability to understand or predict how an intervention or policy change will affect choice processes and their outcomes for specific individuals or groups of people is important for any program hoping to promote behavioral change, for example in domains such as health, crime, or financial stability. Greater knowledge of the cognitive and neural mechanisms that drive choices in specific individuals is an important step toward this understanding. Our findings demonstrate that when a specific attribute begins to influence the decision process - a factor that has been generally neglected - is an important determinant of choice outcomes. They also suggest that examining relative differences in attribute start times may prove to be useful in understanding why interventions and policies work in some cases (e.g., for specific individuals or groups) but not in others, and may help to increase their effectiveness. Overall, the work we present here provides both a concrete advancement in our knowledge of multi-attribute choice processes and a functional set of computational modeling tools that can be applied to extract deeper mechanistic insights from data on choice outcomes and response times.
Methods
For all data sets in which we relied on published studies, we included the final reported sample in our analyses. For these studies, we will describe the methodological details relevant for our analyses and refer the reader to the published papers for any further details. All participants provided written informed consent in accordance with the procedures of the Institutional Review Board of the California Institute of Technology, the Institutional Review Board of the Faculty of Business, Economics and Informatics at the University of Zurich, or the Ethics Committee of the Canton of Zurich. All participants received a flat fee to compensate for their time in addition to the food they chose.
Data set 1 - SHHR
We use the choice and response time data from the study of Sullivan et al. (2015) to test the face validity of our time-varying sequential sampling model. All participants in the SHHR sample were healthy adults and had no specific dietary restrictions. Before making any choices, they were reminded of the importance of healthy eating by reading a short excerpt from WebMD․com before starting the choice task.
Participants
The Institutional Review Board of the California Institute of Technology approved the experiment. Twenty-eight (7 female) healthy adult participants completed the study.
Procedure
Participants were asked to fast for 4 hours prior to the study. They first rated 160 foods for taste and health on a 5-point Likert scale with values from −2 (“very little”) to +2 (“very much”). After these ratings, participants were asked to read a short text from http://WebMD.com on the beneficial effect of healthy eating, in order to increase the frequency with which they used self-control in the following dietary choice task. In the choice paradigm, participants made 280 choices between two foods on the screen (see Fig S3a). The selection ensured that food pairs would represent all possible combinations of taste and health ratings equally. After each block of 40 choices, participants could take a short break. In 240 trials, participants used the mouse to answer, while in the remaining 40 trials, they answered with the keyboard. In mouse trials, participants had to click the “Start” box at the bottom of the screen to initiate the trial. The cursor reappeared after a random waiting period of 0.2 to 0.5 seconds. From this point on, participants had to move the mouse continuously towards the food they wanted to select. They were instructed to answer as quickly and accurately as possible. A random fixation time of 0.4 to 0.7 seconds separated the trials. In keyboard trials, participants selected food items by pressing the left or right choice keys. At the end of the study, one randomly selected trial was paid out and participants were asked to stay in the lab for 30 minutes or until they had eaten their obtained food.
Data set 2 - GFC
Data for this behavioral study (gamble plus food choice, GFC) were collected from the same individuals in two testing sessions two weeks apart. The two sessions were run on the same weekday and daytime in a two-hour visit in the afternoon. Participants in this study were healthy and did not have any specific dietary restrictions. During the study, they chose naturally and were neither reminded about eating a healthy diet nor encouraged to use dietary self-control in any way.
Participants
The Study was approved by the Institutional Review Board of the University of Zurich’s Faculty of Business, Economics and Informatics. Thirty-seven participants (17 female, mean age = 22.6 ± 3 years SD) were included in this study. A pre-screening procedure ensured that all participants regularly consumed sweets and other snack foods and were not currently following any specific diet or seeking to lose weight. All participants were healthy and had no current or recent acute illness (e.g., cold or flu) at the time of the study. All participants complied with the following rules to ensure comparability across the study sessions: They got a good night’s sleep and did not consume alcohol the evening before the study. On the study day, they took a photograph of the small meal that they consumed 3 hours before the appointment, and sent this photo to the experimenter. One day before the second study session, participants received a reminder about the rules above and were asked to consume a small meal before their second appointment that was equivalent to their meal before the first test session. Participant received 37.5 CHF (approx. 39 USD) for each session.
Procedure
Participants were asked to eat a small meal of approximately 400 calories 3 hours prior to their appointment and to consume nothing but water in the 2.5 hours before the study started. In the laboratory, participants first rated 180 food items for taste and health. They then made 150 food choices, one of which was randomly selected to be realized at the end of the experiment. On each trial, the screen showed 2 foods next to each other and participants chose the food they wanted to eat using a 4-point scale, picking either “strong left”, “left”, “right”, or “strong right” (Fig. S3b). The pairing order and positions of the foods on the screen (left vs right) were completely randomized, and the allocation algorithm ensured that one of the foods would be rated as healthier than the other. Participants had 3 seconds to make their choice, with a jittered interval of 1-3 seconds fixation between trials. Between blocks of dietary decisions, participants played a game in which they had to guess cards for monetary rewards. We ignore the card guessing choices for the analyses presented here. At the end of the experiment, participants stayed in the laboratory for an additional 30 minutes during which they ate the food they obtained during the study. Note that participants on the second day saw a new set of choice options that was created based on the taste and health ratings they gave on that second day, using the same allocation algorithm as in session 1.
Data set 3 - HMR
In order to determine how attention cues affected attribute timing and weighting, we re-analyzed data from Hare et al. (2011). Participants in this study were not following a specific health or dietary goal in their everyday life, but received a cue to think about the healthiness or tastiness of the foods before deciding on a subset of choices in the study.
Participants
The study was approved by the Institutional Review Board of the California Institute of Technology. Thirty-three participants (23 female, mean age 24.8 ± 5.1 years SD) were included. Screening ensured that they were not currently following any specific diet or seeking to lose weight. All participants were healthy, had no history of psychiatric diagnoses or neurological or metabolic illness, were not taking medication, had normal or corrected-to-normal vision, and were right-handed.
Procedure
Participants were instructed to fast and drink only water in the 3 hours prior to the study. In this experiment, participants made a series of 180 choices within an MRI scanner while BOLD fMRI was acquired. The experiment had three conditions with 60 trials each that were presented in blocks of 10, with the order of blocks and foods shown within blocks fully randomized for each participant. Each food was shown only once (Fig. S3c). In condition one, participants were asked to attend to the tastiness of the food when making their choices, in the second condition, to attend to the healthiness of the food, and in the third condition, to choose naturally. The instructions emphasized that participants should always choose what they preferred to eat regardless of the attention/consideration cues. Before each block, the attention condition cue was displayed for 5 seconds. On each choice trial, participants had 3 seconds to answer and were shown feedback on their choice for 0.5 seconds after responding. Trials were separated by a variable fixation period of 4 to 6 seconds. Most participants responded on a 4-point scale “strong yes”, “yes”, “no” or “strong no” to indicate if they preferred to eat or to not eat the food shown on the current trial. Five out of 33 participants completed a version of the task including a fifth option that allowed them to signal indifference between eating and not eating the food. We followed the original analysis procedures in HMR and analyzed all 33 subjects as one set. After the scan, participants rated the 180 food items for taste (regardless of health) and health (regardless of taste), with the order of rating types randomized across participants. After both the choice task and ratings were complete, one trial from the choice task was randomly chosen to be realized. Participants were required to eat the food if they answered “yes” or “strong yes”. If they answered “no” or “strong no”, they still had to stay in the laboratory for the 30-minute waiting period; however, they were not allowed to eat any other food. Participants were fully informed of these choice incentivization procedures before beginning the study.
Data set 4 - TDCS
All participants in this study were pre-screened during recruitment to ensure that they were actively following a healthy lifestyle. They were specifically asked if they would agree to do their best to choose the healthier option whenever possible on the day of the study. Participants who indicated that they would not do so were still allowed to complete the experiment and were reimbursed for their time, but we did not analyze their data. All participants received a flat fee of 100 CHF (approx. 104 USD).
Participants
The Ethics Committee of the Canton of Zurich approved the study protocol and all participants provided written informed consent. In total, 199 participants were enrolled in the study. No participants reported any history of psychiatric or neurological conditions or had any acute somatic illness. Participants were pre-screened in telephone interviews to ensure they did not suffer from any allergies, food intolerances, or eating disorders. To ensure that the snacks in the food choice task would present a temptation, participants were only eligible if they reported regularly consuming snack foods (at a minimum 2-3 times per week) while at the same time trying to maintain an overall balanced and healthy diet.
Data from 25 participants were excluded because they failed to meet a priori inclusion criteria or data quality checks. Within the study we requested a written statement of compliance with a health goal for the time of the experiment (see below). Seven men and 1 woman indicated they would not comply with the health goal; their data were excluded from all analyses. Note that these participants still completed the experimental procedures and received the same compensation through food and monetary incentives as those who complied, so there was no incentive for the participants to lie about following the health goal. Data from 8 participants had to be excluded because they confused the response keys or forgot the identity of the reference item during the task. Four participants were excluded on site due to safety precautions regarding tDCS. Three participants were excluded on site because a re-check of the inclusion criteria revealed that they did not actually like snacks or only consumed them on 1-2 occasions per month instead of the minimum 2 times per week. One additional participant had to be excluded because the choice set could not be constructed due to the fact that he reported only the most extreme values on all health and taste ratings. Lastly, data from one participant was excluded because she never used self-control in the baseline condition, precluding inference about within-subject changes due to stimulation. This left 87 men and 87 women in the final dataset.
Participants were randomly allocated to stimulation conditions. The anodal (58 participants, 30 female), cathodal (57 participants, 30 female), and sham (59 participants, 27 female) stimulation groups did not differ from each other with regard to age, body mass index (BMI), or self-reported eating patterns (as assessed by the Three Factor Eating Questionnaire, German validated version by Pudel and Westenhöfer (1989)) (see SI Table S9). The groups also did not differ with regard to impulse control (in the stop signal reaction time, SSRT), working memory capacity (digit span test), or time discounting preferences. Finally, the groups did not differ in the level of hunger that they reported before the choice task (see SI Tables S10-17).
tDCS stimulation protocol
The target electrode (5 × 7 cm) was placed on the left dlPFC (see SI Figure S2a). The reference electrode (10 × 10 cm) was placed over the vertex, off-centered to the contralateral side in such a way that a 5 × 7 cm area of the reference electrode was centered over the vertex while the remaining area was placed more to the right side. The target electrode covered the two dlPFC regions depicted in SI Figure S2b (MNI peak coordinates = [−46 18 24] and [−30 42 24]). These targets were selected because they both showed greater activity for self-control success > failure in two previous fMRI studies (Hare et al., 2009; Maier et al., 2015). The coordinates for both dlPFC and vertex were identified in each participant’s individual T1-weighted anatomical MR image using a neuronavigation system (Brainsight, Rogue Research, RRID:SCR_009539, https://www.rogue-researcher.com/; see insert in Figure S2b). We applied anodal, cathodal, or sham tDCS over this dlPFC site using a commercially available multi-channel stimulator (neuroConn GmbH). Between a ramp-up and ramp-down phase of 20 seconds, active stimulation with 1 milliampere (mA) took place for 30 minutes (anodal and cathodal group) or 5 seconds (sham). Sham stimulation was delivered with either the anode or the cathode over the dlPFC, counterbalanced over the whole sham group. Both the participants and the experimenters mounting the tDCS electrodes were blind to the stimulation condition.
Procedure
Participants first rated 180 food items for health and taste. They were instructed to rate taste regardless of the healthiness and vice versa for each of our 180 food items on a continuous scale that showed visual anchor points from −5 (“not at all”) to +5 (“very much”). Before or after these ratings, participants completed a battery of control tasks in randomized order. All control tasks were performed both before and after stimulation: a stop signal reaction time task (SSRT), a self-paced digit span working memory (WM) test, and a self-paced monetary inter-temporal choice task (ITC). In order to test for stimulation effects on taste and health ratings, participants also re-rated a subset of foods after stimulation (see supplemental information section 1).
After all pre-stimulation tasks had been completed, but before any food choices were made, we asked participants to sign a health goal statement in which they indicated whether they would commit to maintaining a health goal during the following food choice task or not (see SI section 1.2 for an English translation of the health goal text). Participants indicated that they would or would not commit to the goal, dated, and signed the document, and then handed it back to the experimenter. Participants could not see which option others in the room had selected and the experimenter randomizing the tDCS conditions was blind to the participants’ responses to the health goal.
Just prior to beginning the food choice task, participants indicated their current hunger levels. They then completed a series of food choices. The first 101 participants made 60 food choices at baseline, however we increased the number of baseline choices to 80 for the final 98 participants in order to have an even number at baseline and under stimulation. All other experimental factors were kept the same for all 199 participants. The baseline choices allowed us to make within-subject comparisons of self-control before and during stimulation. Once participants had finished making the baseline choices, stimulation was applied. Participants did not make any choices for the first 3 minutes of stimulation to allow the current to stabilize. Following the stabilization period, they completed another set of food choices (n = 120 for participants 1:101 and n = 80 for participants 102:199). No choice pairs were repeated between the baseline and stimulation choice sets. However, the difficulty in terms of taste difference was balanced across the two choice sets (see SI).
Participants completed the set of food choices under stimulation (or sham) in a maximum of 16 minutes. In the remaining 8-14 minutes of stimulation (or sham) time, participants completed several control tasks. We randomized the order of the post-stimulation control tasks so that all tasks had an equal chance of being run in the period when current was still being applied versus the 5-10 minute window immediately after stimulation (during which physiological aftereffects of the tDCS were still present, see (Nitsche and Paulus, 2001; Fritsch et al., 2010). Once they had completed all post-stimulation control tasks, participants filled in a questionnaire battery (Three Factor Eating Questionnaire (TFEQ), Cognitive Reflection Test (CRT), “Big Five” personality dimensions (NEO-FFI), socio-economic status). They also indicated whether and to what degree they had tried to comply with the health goal throughout the study, whether they had felt the stimulation and how strongly, and whether they had any problems understanding or following the instructions. Finally, participants received and ate their selected food 30 minutes after they made their final decision in the food choice task.
Food choice paradigm
Participants were asked to eat a small meal of approx. 400 kcal 3 hours prior to the study and consume nothing but water in the meantime. In the dietary self-control paradigm, participants chose which food they wanted to eat at the end of the study. In order to comply with their health goal, they had to choose the healthier item as often as they could. However, the paradigm was engineered such that health and taste of the food options always conflicted based on the participant’s ratings, so they would always have to forgo the tastier food in order to choose healthy. Participants knew that one of their choices would be realized in the end, and they would have to eat whatever they chose on the trial that was randomly selected.
Participants were shown the picture of a reference food for 3 seconds at the beginning of each block. This reference food was either healthier and less tasty than all 10 items shown in the upcoming block or tastier and less healthy than all 10 upcoming items. On each of the 10 trials within a block, participants had to decide if they preferred to eat the food currently shown on the screen or the reference food at the end of the study. The identity of the reference food was written in text on the screen so that participants did not need to remember it (see Figure S3d). During each choice trial, participants had 3 seconds to make their decisions, and each trial was separated by a jittered inter-trial interval of 2-6 seconds. One trial was selected at random to be realized after all experimental procedures were completed. At the end of the study, participants stayed in the lab for 30 minutes to eat the food they obtained in the study.
Statistical Analyses
All analyses presented in this paper were performed with the R (“R Core Team,” 2015), STAN (Carpenter et al., 2016) and JAGS (Hornik et al., 2003) statistical software packages. For all Bayesian modeling analyses, we used the default, uninformative priors specified by the brms package (Bürkner, 2017) or BEST (Kruschke, 2013) R-packages). Throughout the paper, the notation PP() indicates the posterior probability of the comparison given within the parentheses. Whenever we analyzed previously published data, we applied the same subject-and trial-level exclusion criteria described in the original papers.
Time-varying Sequential Sampling Model
We fit a sequential sampling model that allowed for differential onset times for taste and health attributes during evidence accumulation to participants choice outcome and reaction time data. Several of the food choice tasks used a 4-point decision strength scale, and for these data we collapsed choices into a binary yes/no or left/right choice. The following six free parameters were estimated separately for each participant and condition:
Thr: evidence threshold for responding (symmetric around zero)
Bias: starting point bias for the evidence accumulation process
nDT: non-decision time
RST: relative start time for health (positive values mean that health enters the process after taste, negative values mean health enters before taste)
ωtaste: weighting factor determining how much taste contributes to the evidence accumulation rate.
ωhealth: weighting factor determining how much healthiness contributes to the evidence accumulation rate.
The values of these six parameters were used to simulate choices and response times using the sequential sampling model described in the equation below to update the relative evidence level at each subsequent time step t.

Here, the times at which the weighted value differences in tastiness and healthiness attributes (ωtaste*TD and ωhealth*HD, respectively) begin to influence the evidence accumulation rate are determined by the free parameter RST. If RST > 0, then ηt= 0 until t > (RST / dt), and equals 1 for all subsequent time steps. On the other hand, if RST < 0, then τt = 0 until t > (|RST / dt|), and equals 1 for all subsequent time steps. Thus, the resulting binary vectors ηt and τt effectively delay the entrance of one of the attributes (tastiness or healthiness) into the evidence accumulation process by multiplying the weighted difference by zero for a specific period of time whenever RST does not equal zero. In our case, the evidence accumulation process begins with an initial value (E0) that is equal to the value of the Bias parameter, and is updated in discrete time-steps of dt = 0.008 s until |Et| is either greater than the threshold (Thr) parameter value. The noise at each step of the accumulation process is drawn from a Gaussian distribution with mean 0 and SD = 1.4. The differences in taste and healthiness ratings between Food1 and Food2 (or Food1 vs 0 for the single item choices in the HMR dataset) on a given trial are denoted by TD and HD, respectively. Once the threshold is crossed, the response time is computed as t*dt + nDT, where nDT is a free parameter for a non-decision time that accounts for the time required for any initial perceptual or subsequent motor processes that surround the period of active evidence accumulation and comparison.
We estimated the best values for all six free parameters described above separately for each participant and condition using the Differential Evolution algorithm described in Mullen et al. (2011) with a population size of 60 members run over 150 iterations. On every iteration, we simulated 3000 decisions and response times for all unique combinations of taste and healthiness tradeoffs in the participant’s choice set using each population member’s six tSSM parameters. We then computed the likelihood of the observed data given the distribution generated by the 3000 simulated choices for a given set of parameters. On each subsequent iteration, the population evolves toward a set of parameters that maximize the likelihood of the observed data using the procedures described by Mullen and colleagues (Mullen et al., 2011). The upper and lower bounds on the search space for each of the 6 parameters are listed in Table S17. The ratings for taste and healthiness were z-scored across all available ratings of each type for the whole set of participants in each study.
Lastly, we also fit a standard SSM to all datasets using the same procedures as the tSSM, except that the equation omitted the relative-start-time parameter, which meant that both tastiness and healthiness were constrained to enter into the evidence accumulation process at the same time.
We also note that we fit the tSSM using two levels of resolution for the tastiness and healthiness ratings in the GFC and TDCS studies. The tastiness and healthiness ratings from these two studies were collected on a 426-point visual analog scale. We initially fit the tSSM using the 426-point ratings scale. We also estimated the fits after first reducing the resolution to 10 equally-sized bins (i.e., 42.6 points per bin) for both taste and health. Both versions yielded very similar results, but the estimation proceeded considerably faster when using the binned ratings because this reduced the number of unique combinations of attributes and therefore the number of simulations required for the fitting procedure. We report the parameter values and results from the model with binned ratings for these studies.
Tests of parameter recovery
In order to determine the tSSM’s ability to recover known parameter values, we simulated choices and reaction times using various combinations of the ωtaste, ωhealth, and RST parameters. We then fit these simulated data to test the ability of the model to recover the generating parameters. To generate the simulated choices, we took the following 5 parameter values for the attribute weightings and 3 values for RST: ωtaste: [−1, −0.25, 0.25, 1]; ωhealth: [−1, −0.25, 0.25, 1]; RST: [−0.2, 0, 0.2]. The full set of combinations of these parameter values yields 48 possibilities, however, we excluded cases where both ωtaste and ωhealth = 0.25 or −0.25, given these were redundant with combinations where both ωtaste and ωhealth = 1 or −1. This resulted in choice datasets generated from 42 different combinations of weighting and RST parameter values.
We used the median values fitted from the TDCS study data for the other three tSSM parameters in all simulations (threshold = 1.26, nDT = 0.76, bias = −0.08). To simulate taste and health value differences, we combined all 19 possible differences in taste and health ratings (i.e. −5 to +5) from this study, resulting in 361 value difference combinations and then sampled (with replacement) from these combinations to create 60 virtual trials. The median threshold, nDT, and bias parameter values and the 60 value-difference virtual trials were used together with each of the 18 combinations of taste and health parameters to simulate choice data 100 times.
In order to test the accuracy of our DDM in recovering the ωtaste, ωhealth, and RST parameters used for generating the simulated data, we compared the posterior estimates of the mean differences for the simulated and recovered parameters using a Bayesian t-like test (BEST R Package, version 3.1.0 (Kruschke, 2013)), which in turn relies on JAGS (version 3.3.0 (Plummer, 2003).
Specifically, we compared the differences between the generating and recovered taste and health parameters against zero. Finally, we examined whether these estimation errors were correlated across the taste and health parameters using pairwise Pearson’s correlations. For all correlations reported in this paper, rho-values represent the mean of the posterior distribution generated by a Bayesian correlation analysis implemented based on R and JAGS code from the blog, doingbayesiandataanalysis.blogspot.com, that accompanies the “Doing Bayesian Data Analysis” book by Kruschke (2015).
Correspondence of tSSM health delay estimates with SHHR’s estimates
With their mousetracking method, SHHR were able to estimate to within a fraction (1/101) of each response time when health first became and remained significant in each choice (their Figure 4b). In order to compare our estimate (which was given in seconds and represents a mean value across all of a given set of choices) to the one of SHHR, we transformed the mouse-tracking estimates of start times for health into a mean estimate in seconds as well. Specifically, we took the mean of the estimated trial-wise health start time bins for each participant and multiplied it by the participant’s mean RT, then divided by 101. SHHR’s method was only able to estimate health start times for N=18 (out of 28) participants and, therefore, we calculated the Bayesian equivalent of Pearson’s correlation coefficient between tSSM and mouse-tracking estimates of health start times in this subset of participants.
Relationship between relative-start-times and other tSSM parameters
To explain how individual differences in the relative-start-time for healthiness were related to the other tSSM parameters, we estimated the model specified in equation 1 below:

Note that we interacted the Bias parameter from the tSSM with a dummy variable for the Study, because the bias measures different answers across studies given the task designs (e.g. left/right, eat/do not eat).
Out of sample tests for model fit robustness and predictive accuracy
Trial level
To examine the generalizability of the tSSM fits at the trial level, we tested whether we could predict an individual’s decisions in one set of choices (the test set) based on the fits to a separate set of choices (the training set). When dividing the trials into training and test sets, we either trained on one entire session and predicted choices in the other (GFC study) or trained on odd trials and predicted choices for even trials in the same session (TDCS study). We made predictions for each test trial by simulating the binary choice outcome [0,1] 100 times using the tSSM parameters fit to the training data, and then rounding the mean of the 100 simulations to form a binary choice prediction. From these predictions, we then calculated the balanced accuracy according to Equation 2:
 where TP and TN represent the number of correctly predicted (i.e., true) positives and negatives, while FN and FP represent the number of incorrectly predicted (i.e., false) negatives and positives, respectively.
Individual level
We also computed out-of-sample predictions about dietary self-control at the individual level both within and across studies. When predicting individual differences within a single study, we used a leave-one-subject-out procedure. We first fit the linear model specified by Equation (3) using N-1 participants N times (where N is the total number of participants in the study), leaving out a different participant (i.e., the test data) in each iteration. We then predicted self-control for each participant based on the independently estimated set of regression coefficients and calculated the Bayesian equivalent of Pearson’s correlation coefficient and mean squared error (MSE) between the predicted and actual self-control levels across all participants.

We also used Eq. 3 when predicting individuals’ self-control levels across studies. In those tests, we fit Eq. 3 to all participants in a given study and then used those fitted coefficients to predict self-control for all participants in the other three studies.
Changes in self-control between conditions
To examine how well changes in our tSSM parameters captured changes in self-control, we fit the linear model specified by Equation 4 for all participants in the HMR and TDCS studies.

Note that the regressors with the subscript base denote the natural condition in dataset HMR and the baseline condition in TDCS. The delta (Δ) regressors were generated by subtracting the parameters for the stimulation and health condition from the baseline parameter estimates in each study. The same applies to the explanandum, where we also subtracted self-control levels in the baseline/natural condition from the self-control levels under stimulation/health cue for each participant.
Comparing response times during rating sessions to relative start times
We used response times during the rating sessions as an estimate of the participants’ fluency in recalling or constructing taste and healthiness attributes. To test whether the relative start time (RST) depended on the speed of ratings for either health or taste aspects, we estimated the following model for each participant:
 where mRT is the mean reaction time over all taste ratings or health ratings that the participant made at the beginning of the experiment, and nDT is the non-decision time estimated in the tSSM. We conducted this analysis using the data from the baseline session in our tDCS experiment (i.e., our largest set of data from a single choice paradigm/context).
Modeling changes in behavior under tDCS
We first fit the hierarchical regression model specified in Eq. 6 to the odd-numbered baseline trials in our tDCS dataset. Based on those fitted parameters, we generated predictions about the probability of self-control success in even-numbered trials as a function of tDCS polarity (anodal, cathodal, sham), stimulation session (baseline, active), health difference, taste difference, and participant identity. We then estimated Eq. 6 on all even-numbered trials for which the probability of self-control success was predicted to be between 0.2 and 0.8 (Table S7).
To examine whether stimulation over left dlPFC caused changes in dietary self-control, we fit a Bayesian hierarchical logistic regression model to the tDCS dataset. The population-level regressors for this model are given in condensed notation in Equation 6.

Here, TD and HD denote the absolute value of taste and healthiness difference between foods on each trial, stimulationON was a dummy variable taking the value 1 under stimulation and 0 at baseline, and stimulationType was a factor with 3 categories (Anodal, Cathodal, and Sham). The model included the main effects of all regressors as well as the two and three-way interactions between attribute differences and stimulation Type and session (i.e., baseline vs stimulation on). The model also included subject-specific intercepts, stimulation effects, and slopes for HD and TD (see Table S7).
Author contributions
All authors designed one or more aspects of the research; S.U.M. and A.R.B. collected the novel data in studies GFC and TDCS; R.P. and T.A.H. designed the time-varying sequential sampling model; S.U.M., A.R.B., R.P., and T.A.H. analyzed the data; All authors wrote the paper.
Financial interests
The authors declare no competing financial interests.
Acknowledgements
This study has been supported by a Swiss National Science Foundation grant 320030_143443 (CCR and TAH), a Marie Curie International Incoming Fellowship PIIF-GA-2012-327196 (ARB), and EU FP7 grant 607310 (TAH). The authors thank Gaia Lombardi and Jonathan Price for help with data collection and documentation, as well as Aidan Makwana and Ana Cubillo for contributing code for the experimental tasks.
Footnotes
References


