

Abstract
Microbial communities play an important role in driving the dynamics of aquatic ecosys-tems. As difficulties in DNA sequencing faced by microbial ecologists are continuously being reduced, sample collection methods and the choice of DNA extraction protocols are becoming more critical to the outcome of any sequencing study. In the present study, I added a manual bead-beating step in the protocol using a DNeasy® Blood & Tissue kit for DNA extraction from a filter cartridge (Sterivex™ filter cartridge) without breaking the cartridge unit (“Beads” method), and compared its performance with those of two other protocols that used the filter cartridge (“NoBeads” method, which was similar to the Beads method but without the bead-beating step, and “PowerSoil” method, which followed the manual of the PowerSoil DNA extraction kit after breaking apart the filter cartridge). Water samples were collected from lake and river ecosystems in Japan, and DNA was extracted using the three protocols. Then, the V4 region of prokaryotic 16S rRNA genes was amplified. In addition, internal standard DNAs were included in the DNA library preparation process to estimate the number of 16S rRNA gene copies. The DNA library was sequenced using Illumina MiSeq, and sequences were analyzed using the amplicon sequence variant (ASV) approach (DADA2). I found that, 1) the total DNA yields were highest with the Beads method, 2) the number of ASVs (a proxy for species richness) was also highest with the Beads method, 3) overall community compositions were significantly different among the three methods, and 4) the number of method-specific ASVs was highest with the Beads method. In conclusion, the inclusion of a bead-beating step performed inside the filter cartridge increased the DNA yield as well as the number of prokaryotic ASVs detected compared with the other two methods. Performing the bead-beating step inside the filter cartridge causes no dramatic increase in either handling time or processing cost. Therefore, this method has the potential to become one of the major choices when one aims to extract aquatic microbial DNAs.
Introduction
Microbial communities play an important role in driving the dynamics of aquatic ecosystems, including primary production and organic matter decomposition as well as dynamics of macro-organisms (Arrigo 2004, Srivastava et al. 2017). Recent advances in molecular techniques enable the generation of massive amounts of information encoded in microbial environmental DNA at a reasonable cost (e.g., Meyer and Kircher 2010, Jain et al. 2016). For example, Illumina MiSeq/HiSeq enables generation of tens of millions to billions of sequences (up to 600 bp long; e.g., V3 Sequencing Kit 300 × 2 cycles). More recently, Oxford Nanopore Technologies and PacBio provide a way to analyze much longer sequences (e.g., > 10 kb by using MinION/GridION or RS II/Sequel). All these technologies enable researchers to detect and identify microbes in nature more easily and accurately than ever before. As a consequence, a wide range of aquatic microbial community studies have utilized molecular techniques (Sharma et al. 2013, Bryant et al. 2016). These trends are also true for microbial communities in non-aquatic ecosystems (Lauber et al. 2009, Caporaso et al. 2011, 2012, Fierer et al. 2011, Ushio et al. 2015).
Sample collection methods and the choice of DNA extraction protocols are becoming more critical to the outcome of any sequencing study in microbial ecology since difficulties of DNA sequencing faced by microbial ecologists are continuously being reduced. In aquatic microbial studies, water sampling and filtration are a first step for studying microbial communities. Use of a filter cartridge (e.g., Sterivex™ filter cartridge, Merck Millipore) enables on-site filtration in a convenient way, and thus can avoid unnecessary degradation of target microbial DNA during transport (filter cartridges have been used in many studies; e.g., Somerville et al. 1989, Sharma et al. 2013, Bryant et al. 2016, Perrine et al. 2017). In addition, the filter is encapsulated, which reduces the risk of contamination. However, this encapsulated structure makes DNA extraction from the filter cartridge more problematic than that from traditional membrane filters.
There are two major approaches for extracting DNAs from a filter cartridge at present. One of the common approaches is adding lysis buffer directly into a filter cartridge (e.g., Somerville et al. 1989, Sharma et al. 2013, Bryant et al. 2016). In such a protocol, after the addition of lysis buffer into the filter unit, cell lysis is performed inside the filter cartridge. This type of protocol has recently been applied to macrobial environmental DNA studies as well, and showed higher performance than the use of traditional filters (Miya et al. 2016, Spens et al. 2016). In the other approach, the cartridge is broken apart, and then DNA extraction is performed outside the cartridge using a commercial kit (e.g., PowerSoil DNA isolation kit, Qiagen) which usually includes a bead-beating step (e.g., see video in https://bit.ly/2IKprAS) (Urakawa et al. 2010, Perrine et al. 2017). Although this approach seems to improve the efficiency of DNA extraction, it obviously increases the risk of contamination as well as handling time.
Although the bead-beating step is generally recommended in microbial studies (e.g., Albertsen et al. 2015), the risk of contamination should be reduced if possible. In the present study, I included the bead-beating step manually in a DNA extraction protocol using a DNeasy® Blood & Tissue Kit without breaking apart the cartridge (hereafter, “Beads” method), and compared the performance with those of two other protocols that are commonly used in environmental studies: the first one is performing cell lysis inside the filter cartridge using a DNeasy® Blood & Tissue Kit without a bead-beating step (hereafter, “NoBeads” method), and the second one is breaking apart the filter cartridge and then performing DNA extraction using a PowerSoil® DNA Isolation Kit (hereafter, “PowerSoil” method). Specifically, water samples were collected from two different aquatic ecosystems (lake and river ecosystems), and DNAs were extracted using the three protocols. Then, the V4 region of the prokaryotic 16S rRNA gene was amplified using 515F/806R primers (Bates et al. 2011, Caporaso et al. 2011). Internal standard DNAs were included in the library preparation process to estimate the number of 16S rRNA genes (internal standard DNA approach; Ushio et al. 2018). The DNA library was sequenced using Illumina MiSeq, and the sequences obtained were analyzed using the amplicon sequence variant (ASV) approach (DADA2; Callahan et al. 2016) and taxa assignments were done using Claidnet (Tanabe and Toju 2013). I found that, 1) the total DNA yields were highest when using the Beads method, 2) The number of ASVs (a proxy for species richness) was highest when using the Beads method, 3) overall community compositions evaluated using the three methods were significantly different among the three methods, and 4) the number of method-specific ASVs was highest when using the Beads method.
Methods
Preparation of the filter cartridge and beads
For the collection of water samples and on-site filtration, ϕ 0.22-μm Sterivex™filter cartridges (SVGV010RS, Merck Millipore, Darmstadt, Germany) were used (Fig. S1). When performing field sampling, the filter cartridges were capped with inlet and outlet caps (inlet cap = Luer Fitting VRMP6; outlet cap = Luer Fitting VRSP6, AsOne, Osaka, Japan). The use of caps improved sample handling efficiency and reduced the risk of contamination.
For bead-beating, zirconia beads (ϕ 0.5 mm, YTZ-0.5, AsOne, Osaka, Japan) were used. Note that the beads were added into the filter unit before performing water sampling. Preliminary experiments suggested that the addition of 1 g of the beads improved the yield of total DNA extracted from the filter cartridges (Fig. S2). Based on these preliminary experiments, 1 g of zirconia beads were added to the filter cartridge in this study.
Study sites and water sampling
Water samples were collected from two sites on 21 February 2017: Tenjin river (35° 4′ 19″ N, 135° 55′ 59″ E) and Lake Biwa (34° 55′ 45″ N, 135° 56′ 41″ E) in Shiga prefecture, Japan (Table 1). These sites were selected because they represent contrasting freshwater ecosystems: the lake site represents a relatively stable and mesotrophic aquatic environment, while the river site represents a dynamic, relatively clear and oligotrophic aquatic environment. Water samples were collected to test three DNA extraction methods (Fig. 1): 1) a protocol using a filter cartridge with a bead-beating step inside the cartridge, 2) a protocol using a filter cartridge without a bead-beating step and 3) a protocol using a PowerSoil® DNA Isolation Kit after breaking open a filter cartridge, a common method in microbial ecology studies. Protocols 1) and 2) used a DNeasy® Blood & Tissue Kit (Qiagen, Hilden, Germany). Hereafter, Protocols 1, 2 and 3 are referred to as “Beads” (i.e., with bead-beating), “NoBeads” (i.e., without bead-beating), and “PowerSoil” (i.e., PowerSoil DNA Isolation Kit), respectively.
Study site description

Experimental design of this study. Two research sites (a lake and river) and three DNA extraction methods (Beads, NoBeads, PowerSoil) were examined. Five replications and one field negative control were included for each treatment. After sequencing, bcl2f
Six 500-ml water samples were collected from six locations of each sampling site (within a ca. 100 m diameter area), and then the six replicates were combined as a 3-L composite water sample in a large plastic bottle. The composite sample was mixed thoroughly to reduce subsample-level variations. For each DNA extraction protocol, five subsamples each from the lake and river were obtained by filtering 20 and 30 ml of the pooled water sample, respectively, using a sterile 50-mL syringe (TERUMO, Tokyo, Japan) and a ϕ 0.22-μm Sterivex™ filter cartridge with zirconia beads inside. One negative control for each treatment (i.e., a field negative control) was prepared by filtering the same amount of MilliQ water in the field. In total, 36 filter cartridges were collected from the two study sites (i.e., two study sites × three DNA extraction protocols × five replicates + six field negative controls). After filtration, 2 ml of RNAlater® solution (ThermoFisher Scientific, Waltham, Massachusetts, USA) was added into each filter cartridge. Then, the samples were immediately taken back to the laboratory. During the transport (for up to 1 hour), the samples were kept at 4°C.
DNA extraction
DNA extraction was performed using either a DNeasy® Blood & Tissue Kit or PowerSoil® DNA Isolation Kit. First, the 2 ml of RNAlater® solution in each filter cartridge was removed under vacuum using the QIAvac system (Qiagen, Hilden, Germany), followed by a further wash using 1 ml of MilliQ water.
For the Beads and NoBeads methods, DNA was extracted from cartridge filters using a DNeasy® Blood & Tissue Kit following a protocol described in Miya et al. (2016). Briefly, proteinase-K solution (20 μl), PBS (220 μl) and buffer AL (200 μl) were mixed, and 440 μl of the mixture was added to each filter cartridge. The materials on the cartridge filters were subjected to cell-lysis conditions by incubating the filters on a rotary shaker (15 rpm; DNA oven HI380R, KURABO, Osaka, Japan) at 56°C for 10 min. For the Beads method only, filter cartridges were vigorously shaken (with zirconia beads inside the filter cartridges) for 180 sec (3200 rpm; VM-96A, AS ONE, Osaka, Japan). The incubated mixture was transferred into a new 2-ml tube from the inlet of the filter cartridge by centrifugation (3,500 g for 1 min). For the Beads method, zirconia beads were removed by taking the supernatant of the incubated mixture after the centrifugation. The collected DNA was purified using a DNeasy® Blood & Tissue Kit following the manufacturer’s protocol. After the purification, DNA was eluted using 100 μl of the elution buffer provided with the kit. Eluted DNAs were stored at − 20°C until further processing.
For the PowerSoil method, each cartridge was broken open using sterilized pliers, the filter was taken from the cartridge, and it was cut into small sections. Then, DNA was extracted from the sections using a PowerSoil DNA Isolation Kit. Briefly, the small filter sections were put into a PowerBeads tube, and 60 μl of Solution C1 was added. Then, the tube was incubated at 56°C for 10 min followed by 180 sec of bead beating (3200 rpm). For other processes, I followed the manufacturer’s instruction and DNAs were eluted using 100 μl of Solution C6. Eluted DNAs were stored at − 20°C until further processing.
Paired-end library preparation and sequencing
Prior to the library preparation, work-spaces and equipment were sterilized. Filtered pipet tips were used, and separation of pre- and post-PCR samples was carried out to safeguard against cross-contamination. Four PCR-level negative controls (i.e., with and without internal standard DNAs) were employed to monitor contamination during the experiments.
The first-round PCR (first PCR) was carried out with a 12-μl reaction volume containing 6.0 μl of 2 × KAPA HiFi HotStart ReadyMix (KAPA Biosystems, Wilmington, WA, USA), 0.7 μl of 515F primer, 0.7 μl of 806R primer (updated version described in Earth Microbiome Project [http://www.earthmicrobiome.org/protocols-and-standards/16s/]; 5 μM of each primer in the reaction volume; with adaptor and six random bases) (Bates et al. 2011, Caporaso et al. 2011), 2.6 μl of sterilized distilled H2O, 1.0 μl of DNA template and 1.0 μl of prokaryotic internal standard DNA (for internal standard DNA, please see the subsection Internal standard DNA and quantitative MiSeq sequencing). The thermal cycle profile after an initial 3 min denaturation at 95°C was as follows (35 cycles): denaturation at 98μC for 20 s; annealing at 60°C for 15 s; and extension at 72°C for 30 s, with a final extension at the same temperature for 5 min. We performed triplicate first-PCR, and these replicate products were pooled in order to mitigate the PCR dropouts. The pooled first PCR products were purified using AMPure XP (PCR product: AMPure XP beads = 1:0.8; Beckman Coulter, Brea, California, USA). The pooled, purified, and 10-fold diluted first PCR products were used as templates for the second-round PCR.
The second-round PCR (second PCR) was carried out with a 24-μl reaction volume containing 12 μl of 2 × KAPA HiFi HotStart ReadyMix, 1.4 μl of each primer (5 μM of each primer in the reaction volume), 7.2 μl of sterilized distilled H2O and 2.0 μl of template. Different combinations of forward and reverse indices were used for different templates (samples) for massively parallel sequencing with MiSeq (Table S1). The thermal cycle profile after an initial 3 min denaturation at 95°C was as follows (12 cycles): denaturation at 98°C for 20 s; annealing at 68°C for 15 s; and extension at 72°C for 15 s, with a final extension at 72°C for 5 min.
Twenty microliters of the indexed second PCR products were mixed, and the pooled library was again purified using AMPure XP (PCR product: AMPure XP beads = 1:0.8). Target-sized DNA of the purified library (ca. 440 bp) was excised using E-Gel SizeSelect (ThermoFisher Scientific, Waltham, MA, USA). The double-stranded DNA concentration of the library was quantified using a Qubit dsDNA HS assay kit and a Qubit fluorometer (ThermoFisher Scientific, Waltham, MA, USA). The double-stranded DNA concentration of the library was then adjusted to 4 nM using Milli-Q water and the DNA was applied to the MiSeq platform (Illumina, San Diego, CA, USA). The sequencing was performed using a MiSeq Reagent Nano Kit v2 for 2 × 250 bp PE (Illumina, San Diego, CA, USA).
Internal standard DNA and quantitative MiSeq sequencing
Five artificially designed and synthesized internal standard DNAs, which are similar but not identical to the V4 region of any existing prokaryotic 16s rRNA, were included in the library preparation process to estimate the number of prokaryotic DNA copies (i.e., quantitative MiSeq sequencing; see Ushio et al. 2018). They were designed to have the same primer-binding regions as those of existing prokaryotes and conserved regions in the insert region (see Table S2 for sequences of the standard DNAs). Variable regions in the insert region were replaced with random bases so that no known existing prokaryotic sequences had the same sequences as the standard sequences. The numbers of standard DNA copies were adjusted appropriately to obtain a linear regression line between sequence reads and DNA copy numbers from each sample.
Ushio et al. (2018) showed that the use of standard DNAs in MiSeq sequencing provides reasonable estimates of the DNA quantity in environmental samples when analyzing fish environmental DNA. However, it should be noted that it corrects neither for sequence-specific amplification efficiency, nor for species-specific DNA extraction efficiency. In other words, the method assumes similar amplification efficiencies across sequences, and similar DNA extraction efficiencies across microbial species, which is not valid for complex environmental samples, and thus we need careful interpretations of results obtained using that method.
Sequence data processing
All scripts to process raw sequences are available at https://github.com/ong8181/micDNA-beads. The raw MiSeq data were converted into FASTQ files using the bcl2fastq program provided by Illumina (bcl2fastq v2.18). The FASTQ files were then demultiplexed using the command implemented in Claident v0.2.2017.05.22 (http://www.claident.org; Tanabe and Toju 2013). We adopted this process than rather using FASTQ files demultiplexed by the Illumina MiSeq default program in order to remove sequences whose 8-mer index positions included nucleotides with low quality scores (i.e., Q-score < 30).
Demultiplexed FASTQ files were analyzed using the Amplicon Sequence Variant (ASV) method implemented in DADA2 v1.7.7 (Callahan et al. 2016). ASV methods, including DADA2, infer the biological sequences in the sample prior to the introduction of amplification and sequencing errors, and distinguish between sequence variants differing by as little as one nucleotide (Callahan et al. 2017). At the quality filtering process, forward and reverse sequences were trimmed at the length of 215 and 160 based on the visual inspection of Q-score distribution, respectively, using DADA2::filterAndTrim() function. Error rates were learned using DADA2::learnErrors() function (MAX_CONSIST option was set as 20). Then, sequences were dereplicated, error-corrected, and merged to produce an ASV-sample matrix. Chimeric sequences were removed using the DADA2::removeBimeraDenove() function.
Taxonomic identification was performed for ASVs inferred using DADA2 based on the query-centric auto-k-nearest-neighbor (QCauto) method (Tanabe and Toju 2013) and subsequent taxonomic assignment with the lowest common ancestor algorithm (Huson et al. 2007) using Claident v0.2.2017.05.22. Because the QCauto method requires at least two sequences from a single microbial taxon, only internal standard DNAs were separately identified using BLAST (Camacho et al. 2009).
Estimations of DNA copy numbers
For all analyses in this subsection, the free statistical environment R 3.4.3 was used [R Core Team (2017)). Rarefying sequence reads is a common approach to evaluate microbial diversity. I examined rarefaction curves and found that the sequencing captured most of the prokaryotic diversity (Fig. S3). Also, a previous study suggested that simply rarefying microbial sequence data is inadmissible (McMurdie and Holmes 2014). Another important point is that my analyses involve conversion of sequence reads to DNA copy numbers and thus are different from other commonly used analyses in microbiome studies. Considering these conditions and the previous study, sequence reads were subjected to the downstream analysis without performing further corrections using rarefaction or other approaches in the present study.
The procedure to estimate DNA copy numbers consisted of two parts following the previous study (Ushio et al. 2018): (1) linear regression analysis to examine the relationship between sequence reads and the copy numbers of the internal standard DNAs for each sample, and (2) the conversion of sequence reads of non-standard prokaryotic DNAs to estimate the copy numbers using the result of the linear regression for each sample.
Linear regressions were used to examine how many sequence reads were generated from one microbial DNA copy through the library preparation process. Note that a linear regression analysis between sequence reads and standard DNAs was performed for each sample and the intercept was set as zero. The regression equation was: MiSeq sequence reads = regression slope × the number of standard DNA copies [μl]. The number of linear regressions performed was 38 (= the number of microbial DNA samples + PCR negative control with standard DNAs), and thus 38 regression slopes were estimated in total.
The sequence reads of non-standard prokaryotic DNAs were converted to calculated copy numbers using sample-specific regression slopes estimated by the above regression analysis. The number of non-standard prokaryotic DNA copies was estimated by dividing the number of MiSeq sequence reads by a sample-specific regression slope (i.e., the number of DNA copies = MiSeq sequence reads/regression slope). The previous study demonstrated that these procedures provide a reasonable estimation of DNA copy numbers using high-throughput sequencing (Ushio et al. 2018).
Statistical analyses
All scripts in this section are available at https://github.com/ong8181/micDNA-beads. Visualization and basic statistical analyses were performed using the phyloseq v1.23.1 package of R (McMurdie and Holmes 2013). First, sample metadata, ASV-sample matrix (equivalent to classical “OTU table”), and taxa information were imported to a phyloseq object using phyloseq::phyloseq() function. ASVs with sequence length longer than 260 or shorter than 245 were discarded at this point. Visualization and basic statistical analyses consisted of four parts: 1) total DNA copy numbers and the number of ASVs were compared using Tukey-HSD, 2) broad-scale phylogenetic compositions were visualized using a barplot, 3) community compositions were compared using non-metric dimensional scaling (NMDS) and 4) method-specific microbial ASVs (i.e., ASVs frequently detected with a certain method, but rarely detected with the other methods) were identified. During the processes of the statistical analyses and visualizations, functionalities implemented in R packages of “phyloseq” (McMurdie and Holmes 2013), “vegan” (Oksanen et al. 2008), “tidyverse” (Wickham 2017), “ggplot2” (Wickham 2009), “cowplot” (Wilke 2017) and “ggsci” (Xiao 2018) were used.
Sequence data and code availability
DDBJ Accession numbers of the DNA sequences analyzed in the present study are DRA006959 (Submission ID) and SAMD00127558 SAMD00127597 (BioSample ID). Scripts to implement sequence processing, statistical analyses and visualization were available at https://github.com/ong8181/micDNA-beads.
Results
Sequence reads and the copy numbers of standard DNAs
In total, MiSeq run and DADA2 processing generated 299,028 high-quality, merged reads, excluding internal standard DNAs (mean = 7, 476 reads, S.D. = 5, 379; Table S1). For field samples, 13 49% of sequence reads were from non-standard microbial DNAs, whereas for field negative controls, only 0 2% of sequence reads were from non-standard microbial DNAs, suggesting that there was only a small amount of contamination during my library preparation process (Table S1).
The relationships between sequence reads and the copy numbers of standard DNAs were examined by linear regression analysis (Fig. 2). Variations explained by the linear regressions were over 0.975 (Fig. 2a), suggesting that the number of sequence reads was generally proportional to the number of copies of DNA initially added to the first PCR reaction within a single sample. The slopes of the linear regressions ranged from 0.23 to 1.09 (Fig. 2b), suggesting that the amplification efficiency depended on the individual sample. These sample-specific slopes were used to convert sequence reads to the copy numbers of microbial ASVs.

The relationships between sequence reads and the copy numbers of standard DNAs. (a) Distribution of R2 values of the linear regression. (b) Distribution of linear regression slopes.
Total DNA quantity and the number of ASVs
The estimated copy numbers of prokaryotic ASVs were summed to estimate the total numbers of prokaryotic DNAs (Fig. 3a). The DNA copy numbers obtained by the Beads method were significantly higher than those obtained by the NoBeads and PowerSoil methods for the lake samples (Fig. 3a). This was consistent with NanoDrop quantification, which showed that the Beads method yielded higher amounts of DNA than the other two methods for the lake samples (Fig. S4). While there was no significant difference in the total amounts of prokaryotic DNA for the river samples, the mean values of the amount of prokaryotic DNAs obtained by the Beads and NoBeads methods were higher than that obtained by the PowerSoil method, which is also consistent with the NanoDrop results (Figs. 3a and S4). There were no significant differences in the numbers of ASVs (an index of species richness) obtained using the three different extraction methods when all ASVs were taken into account (Fig. 3b).
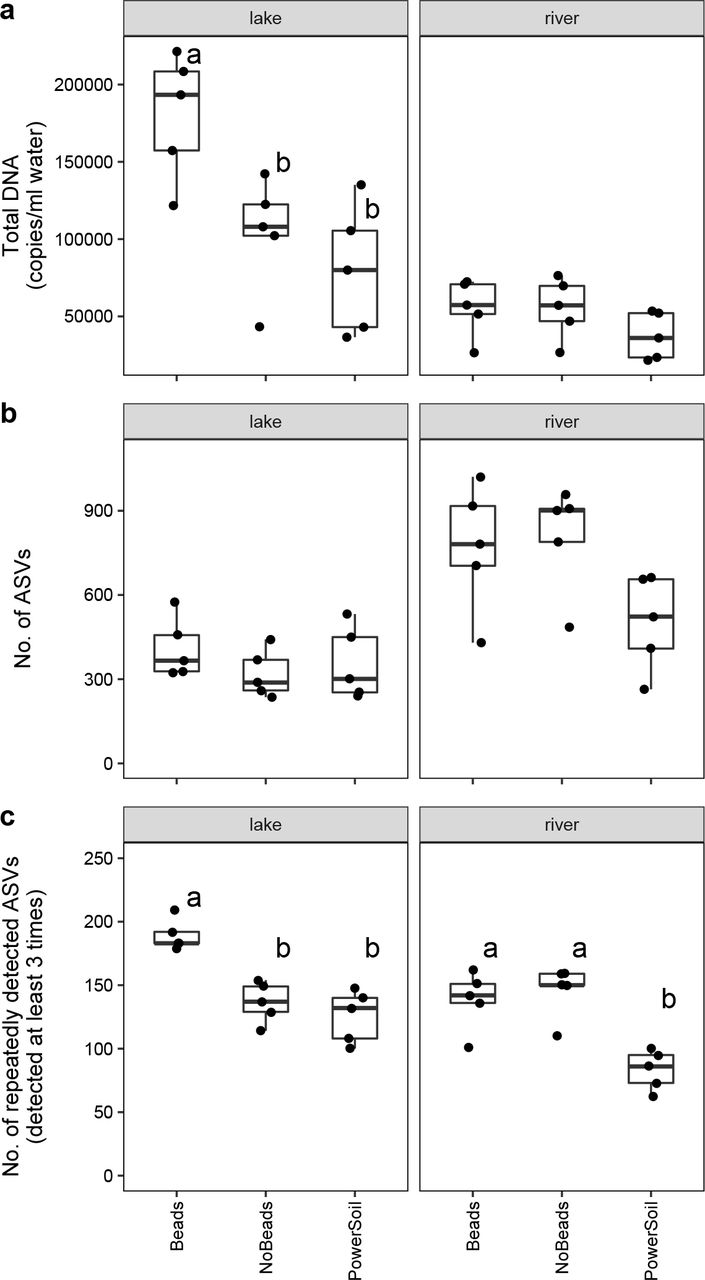
Total DNA yield and the number of ASVs for each treatment. (a) Total DNA yield. (b) The number of all ASVs. (c) The number of repeatedly detected ASVs. Different letters indicate significant differences between treatments (P < 0.0).s
Rare ASVs (e.g., detected only once among the five replicates in each method) were dominant among the detected ASVs. For the lake samples, 841, 702, and 873 ASVs were detected only once among the five replicates in the Beads, NoBeads, and PowerSoil methods, respectively (Table 2). For the river samples, 2,713, 2,791, and 1,851 ASVs were detected only once in the Beads, NoBeads, and PowerSoil methods, respectively (Table 2). The numbers of ASVs that were detected in all of the five replicates were 106, 72, and 66 in the lake samples, respectively, while they were 51, 50, and 24 in the river samples, respectively (Table 2). When only frequently detected ASVs (i.e., ASVs detected at least three times among the five replicates) were considered, the number of ASVs detected in the Beads method was significantly higher than that in the other two methods for the lake samples, and the numbers of ASVs detected in the Beads and NoBeads methods were significantly higher than that in the PowerSoil method for the river samples (Fig. 3c).
The number of ASVs detected in the five replicates in each method. Percentage indicates the proportion of estimated DNA copy numbers of the detected frequency category
Prokaryotic community composition
Broad-scale community compositions are shown in Fig. 4. Actinobacteria, Bacteroidetes, Cyanobacteria, Proteobacteria and Verrucomicrobia were dominant phyla in the lake samples, while Bacteroidetes, Cyanobac-teria and Proteobacteria were dominant phyla in the river samples (Fig. 4). While the dominant phyla detected were similar among the methods, there were significant differences in overall community composition as determined by nonmetric dimensional scaling (NMDS) and PERMANOVA (P < 0.05 for both the lake samples and the river samples; Fig. 5a, b). When only frequently detected ASVs (i.e., ASVs detected at least three times among the five replicates) were considered, the community compositions were more clearly distinct from each other (P > = 0.0057 and < 10×10−4 for the lake and river samples, respectively; Fig. 5c, d).

Barplot of detected prokaryotic phyla. Different colours indicate different prokaryotic phyla.

Nonmetric dimensional scaling (NMDS) of the prokaryotic community composition. All ASVs were used for (a) lake and (b) river samples. Only repeatedly detected ASVs were used for (c) lake and (d) river samples. “P” indicates the significance of the difference among methods on the overall community composition.
Method-specific ASVs
In addition to the basic statistical analyses described above, prokaryotic ASVs that were specific to a certain method were investigated. For this analysis, method-specific ASVs were defined as follows: ASVs that were detected by a specific method at least four times among five replicates, but were detected by the other methods at most two times. In the lake samples, 21, 5, and 3 ASVs were identified as Beads-, NoBeads-, and PowerSoil-specific ASVs, respectively (Fig. 6 and Table S3). Thus, the Beads method detected the highest number of method-specific ASVs. Among the Beads-specific ASVs in the lake samples, Bacteroidetes (Sediminibacterium), Cyanobacteria and Proteobacteria (e.g., Sphingomonadaceae) were dominant (Fig. 6 and Table S3). In the river samples, 16, 17, and 2 ASVs were identified as Beads-, NoBeads-, and PowerSoil-specific ASVs, respectively (Fig. 6 and Table S3). The Beads and NoBeads methods detected higher numbers of method-specific ASVs than the PowerSoil method. Among the method-specific ASVs in the river samples, Bacteroidetes (Sediminibacterium and Flavobacterium), Cyanobacteria, Firmicutes, and Proteobacteria as well as Thaumarchaeota (Nitrososphaera) were detected by the Beads method more efficiently than by the other methods (Fig. 6 and Table S3). The NoBeads method detected ASVs belonging to Proteobacteria, Nitropira and Cyanobacteria more efficiently than the other two methods.

Barplot of method-specific ASVs. Different colours indicate different prokaryotic phyla specific to each DNA extraction method.
Although the above-defined criterion was qualitative (i.e., detection frequency rather than estimated copy numbers was used), a more quantitative criterion also showed a similar pattern (Fig. S5). For the lake samples, the Beads method detected a higher number of method-specific ASVs than the other two methods, while for the river samples, the Beads and NoBeads methods detected higher numbers of method-specific ASVs than the PowerSoil method (see details in Supporting Information).
Discussion
Sequence reads and the copy numbers of standard DNAs
The linear relationships observed between the number of sequence reads and the amount of internal standard DNAs suggested that, within a single sample, the sequence reads were proportional to the copy numbers of DNA. This result suggested that the conversion of sequence reads using a sample-specific regression slope would provide an estimation of DNA copy numbers in the DNA extract (i.e., an estimated DNA copy number = sequence reads/sample-specific regression slope). This is consistent with a previous study that showed that this procedure provides a reasonable estimate of multispecies DNA copy numbers for fish environmental DNA (Ushio et al. 2018).
The variations in the regression slopes suggested that there was variation in the loss of PCR products during the library preparation process (e.g., purification step). Another possible source for the variation is that the degree of PCR inhibition is different among samples even though water samples are often considered to contain lower levels of PCR inhibitors than soil samples. Regression slopes could be an index of PCR inhibition if the concentration of DNA (or PCR product) is adjusted. However, this is not the case in my study because the concentration of DNA (or PCR product) was normalized during the purification step using AMPure XP. Therefore, the sources of the variation in the regression slope could not be distinguished in the present study.
Total DNA quantity and the number of ASVs
Total prokaryotic DNA quantities, estimated by the sum of prokaryotic sequence reads and sample-specific regression slopes, were highest with the Beads method, suggesting that the inclusion of the bead-beating step within the filter cartridge was effective for the extraction of prokaryotic DNAs, a conclusion which was also supported by the NanoDrop quantification results (Fig. S4). This finding is consistent with other studies that showed that a bead-beating step improved DNA yield when using membrane filters (e.g., Albertsen et al. 2015 and references therein). On the other hand, the PowerSoil method did not improve the DNA yield even though it also included a bead-beating step. This may have been due to the stricter purification step of the PowerSoil DNA isolation kit, as it is designed to remove PCR inhibitors (e.g., humic substances) found in soils (see Schrader et al. 2012; Eichmiller et al. 2016). As a result, the DNA yield of the PowerSoil method was relatively low, but the amplification efficiency and/or purity of the extracted DNA could be relatively higher, as shown in other studies (Eichmiller et al. 2016). However, because water samples generally contain smaller amounts of PCR inhibitors than soil samples, the Beads method using a DNeasy® Blood & Tissue kit may be a better choice considering the recovery efficiency of the total DNAs.
In terms of the number of total ASVs, there were no significant differences among the methods for either type of samples. However, the numbers of repeatedly detected ASVs were significantly different, and again suggested that beads-beating is an effective method to increase the number of recovered prokaryotic ASVs (Fig. 3c).
Prokaryotic community composition and method-specific ASVs
Although there were no clear differences in the coarse-scale community composition (Fig. 4), NMDS suggested that overall prokaryotic community compositions were significantly different among the DNA extraction methods for both the lake and river samples. This suggests that the DNA extraction method would have impacts on the characterization of the overall microbial community composition. Interestingly, the variations in community composition revealed by the Beads or NoBeads methods were smaller than those revealed by the PowerSoil method. This would suggest that Beads or NoBeads method provide more reproducible results for microbial DNA extraction. The increase in the handling time and steps during the PowerSoil method may contribute to the larger variation found for the PowerSoil method. The community compositions of repeatedly detected prokaryotic ASVs were also significantly different, and the variations obtained with the Beads or NoBeads method were smaller than those obtained with the PowerSoil method, supporting the above statement. The higher DNA yields and higher numbers of ASVs obtained by the Beads method would contribute to the differences in the community composition.
The results of method-specific ASV analyses were generally consistent with the other results. The number of method-specific ASVs obtained with the Beads method was higher than the number obtained with the PowerSoil method, and the numbers of DNA copies of the method-specific ASVs were higher with the Beads method than with the other two methods, especially for the lake samples (Fig. 6). These results suggested that the inclusion of the beads-beating step was effective, not only for DNA recovery, but also for the detection of prokaryotic species (Albertsen et al. 2015). It should be noted, however, that, for macrobial environmental DNA, the bead-beating step might decrease the detection efficiency as it is likely that macrobial environmental DNA is highly labile and thus a DNA extraction protocol without bead-beating would be more efficient (Miya et al. 2016, Spens et al. 2016).
Conclusion
In the present study, I have shown that the inclusion of a bead-beating step inside the filter cartridge improved the yield of DNA recovered from water samples and also the number of prokaryotic ASVs detected compared with two other common approaches used in microbial ecology studies. Performing the bead-beating step in the filter cartridge causes no dramatic increase in either handling time or processing cost. Therefore, this approach has the potential to become one of the major options when one is interested in collecting aquatic microbial samples from the field.
Acknowledgements
I would like to thank Asako Kawai for assistance in the sampling and experiments, and Hiroki Yamanaka for providing an opportunity to use Illumina MiSeq. This research was supported by PRESTO (JPMJPR16O2) from the Japan Science and Technology Agency (JST).
References


