

Abstract
Major shifts in life history evolution often coincide with other evolutionary phenomena, such as changes in sexual selection, parent-offspring conflict, and speciation. However, we rarely understand the causative links between correlated patterns of diversification or the tipping points that initiate changes with cascading effects. We investigated livebearing fishes with repeated transitions from pre- to post-fertilization maternal provisioning and correlated mating system evolution to identify the order of evolutionary shifts and the ultimate drivers of initial evolutionary transitions. Comparative analyses of temporal dynamics across 94 species revealed that repeated shifts from lecithotrophy (pre-fertilization provisioning) to matrotrophy (post-fertilization provisioning) preceded concomitant changes in sexual selection, establishing a previously missing causal link in the correlated evolution of these traits. In addition, we show that bi-directional evolution along the lecithotrophy-matrotrophy continuum is correlated with ecology, supporting adaptive hypotheses of life history diversification. Consistent with theoretical models, matrotrophy was associated with high resource availability and low competition. Our results indicate that geographic variation in ecological conditions is the underlying force that promotes an evolutionary cascade in life history, sexual selection, and potentially speciation.
Introduction
Evolutionary transitions in maternal provisioning strategies represent a primary axis of reproductive life history variation in viviparous organisms (Wourms 1981; Blackburn 1992). Shifts from an ancestral strategy of females providing all resources for embryonic development prior to fertilization (lecithotrophy) to post-fertilization provisioning (matrotrophy) have been associated with the evolution of complex physiological and morphological adaptations, including placental structures of apposed maternal and embryonic tissues that facilitate nutrient transfer (Wooding & Burton 2008). Matrotrophy and placentas have evolved repeatedly in viviparous animals, including multiple invertebrate (Campiglia & Walker 1995; Hart et al. 1997; Korniushin & Glaubrecht 2003; Korneva 2005; Ostrovsky et al. 2016) and vertebrate lineages (Steward & Blackburn 1988; Wourms et al. 1988; Wake & Dickie 1998; Wildman et al. 2006). Transitions along the lecithotrophy-matrotrophy continuum may have far reaching consequences, shaping the evolution of other traits and patterns of biological diversification (Zeh & Zeh 2000; Coleman et al. 2009; Pollux et al. 2014; Furness et al. 2015). What evolutionary forces shape the evolution of matrotrophy, however, remains unclear (Pollux et al. 2009).
As for other patterns of evolutionary diversification, a pivotal question in understanding transitions from lecithotrophy to matrotrophy is what roles natural and sexual selection play during evolution (Rundle et al. 2009; Salzburger 2009; Maan & Seehausen 2011). Disentangling the effects of natural and sexual selection can be particularly challenging when there are interactive effects, where transitions in naturally selected traits potentiate (or impede) changes in sexual selection or vice versa (Lorch et al. 2003; Candolin & Heuscheke 2008; Chenoweth et al. 2015; Parrett & Knell 2018). Such interactive effects can lead to the correlated evolution of naturally and sexually selected traits, as previously documented for the degree of post-fertilization maternal provisioning and mating systems (Pollux et al. 2014). Interactions between natural and sexual selection in the context of matrotrophy evolution could go either way. On one hand, evolution along a continuum of mating systems ranging from those characterized by male coercion and post-copulatory female choice to those exhibiting male courtship and pre-copulatory female choice may potentiate diversification in life history strategies (Long 2005; Haig 2014). Females of species exhibiting high rates of male coercion should be selected for reduced pre-fertilization provisioning to avoid costs associated with genetically incompatible sires (Long 2005; Haig 2014). On the other hand, evolutionary change in maternal provisioning strategies may affect patterns of sexual selection, because the emergence of matrotrophy can potentiate post-copulatory mate choice by females and weaken the importance of pre-copulatory sexual selection and male courtship (Pollux et al. 2014). These alternative hypotheses not only raise questions about the order of evolutionary transitions, but also about what forces initiate major evolutionary changes that then have cascading effects during diversification.
We used livebearing fishes of the family Poeciliidae to elucidate the causal direction of evolutionary shifts in sexual selection and life histories and to identify potential ecological tipping points for diversification. Livebearing fishes are an iconic model system for testing hypotheses about the evolution of reproductive strategies at micro- and macroevolutionary scales (Evans et al. 2011). Poeciliids have undergone remarkable diversification in levels of post-fertilization maternal provisioning (with independent origins of matrotrophy in different clades; Reznick et al. 2002; Pollux et al. 2009; Pollux et al. 2014), as well as male mating strategies and sexual selection (ranging from mating systems dominated by male coercion to systems dominated by pre-copulatory female mate choice; Bisazza et al. 1997; Pollux et al. 2014; Culumber & Tobler 2017). In addition, species in this family are broadly distributed throughout the Americas, found in a wide variety of ecological contexts, and have a well-resolved phylogeny (Meffe & Snelson 1989; Hrbek et al. 2007; Reznick et al. 2017), facilitating comparative analyses that contrast hypotheses about the evolutionary origins of matrotrophy. Research on poeciliid fishes has been instrumental for the advancement of our theorctical and empirical understanding of matrotrophy (Thibault & Schultz 1978; Pollux et al. 2009; Pires et al. 2011) as well as sexual selection and mate choice (Endler 1983; Meyer et al. 1994; Ryan 1998). In addition, previous analyses have documented correlated evolution between maternal provisioning strategies and sexual selection (Pollux et al. 2014; Figure 1A).

A. Correlation between sexual selection (quantified through a Sexual Selection Index, SSI) and maternal provision strategies (quantified through a Matrotrophy Index, MI; see text for details). Blue dots represent species that are clearly lecithotrophic (MI < 0.75), orange dots species that are clearly matrotrophic (MI > 1), and gray dot species with intermediate strategies (incipient matrotrophy). The gray line represents the best fit line of a Loess regression. B. Alternative hypotheses about the order of evolutionary shifts in sexual selection and life history shifts that could give rise to the observed coevolution of traits. If variation in sexual selection drives matrotrophy evolution, we expect shifts in SSI (red) to precede shifts in MI (green; see top panel). If variation in maternal provision strategies drives shifts in sexual selection, we expect shifts in MI to precede shifts in SSI (middle). Finally, if the same (or correlated) environmental factors exert selection on SSI and MI without pleiotropic interactions among traits, there may be no clear order of trait shifts across the phylogeny (bottom). We also provide confidence intervals (CI) of Akaike weights (ωi for evolutionary time-lag analyses across 250 trees, indicating best support for the model with shifts in MI predating shifts in SSI.
Using phylogenetic comparative analyses of 94 species spanning the family Poeciliidae, we first show that evolutionary shifts in maternal provisioning strategies predate shifts in sexual selection, establishing a previously untested causative relationship (Haig 2014; Pollux et al. 2014). We then characterize the evolutionary dynamics of matrotrophy evolution and show that variation along the lecithotrophy-matrotrophy continuum is correlated with ecological variables associated with resource availability and competition, as predicted by theoretical models (Trexler & DeAngelis 2003).
Methods
Taxon sampling and phylogenetic framework
Our analyses included 94 species (Table S1), encompassing representatives of all major genera in the family Poeciliidae. These species span a geographic range from the eastern United States south to Argentina, including Caribbean islands (Figure S1). The phylogenetic framework used for analyses was established by previous studies with similar taxon sampling (Pollux et al. 2014; Culumber & Tobler 2017). In brief, sequences for six mitochondrial (12S, COI, CytB, ND2, tRNAvalu, and tRNAleu) and 11 nuclear genes (Beta Actin, CCND1, ENC1, GLYT, MYH6, RAG1, Rhodopsin, RPS7, SH3PX3, T36, and XSRC) were obtained from GenBank, aligned, and maximum likelihood phylogenetic analysis was conducted using RAxML-HPC version 8 (Stamatakis 2014) on the CIPRES computer cluster (San Diego State University, San Diego, CA, USA). The resulting best scoring tree was highly consistent with previously published phylogenetic hypotheses for the family Poeciliidae (Hrbek et al. 2007; Pollux et al. 2014; Reznick et al. 2017). Phylogenetic trees were time calibrated with three calibration points spanning the depth of the phylogeny (see Culumber & Tobler 2017 for details), including a primary fossil calibration associated with the split separating the outgroup (Fundulus) from all poeciliids (55-99 Ma; Santini et al. 2009) and a secondary fossil calibration separating Heterandria formosa from the genus Poecilia (9.3-19 Ma; Ho et al. 2016). In addition, the formation of Laguna de Catemaco (Mexico), a crater lake with several endemic species, was used as a constraint on the age of the endemic Poeciliopsis catemaco (0.5-2.0 Ma; Mateos et al. 2002). Even though bootstrap support values of the best scoring tree were generally strong, phylogenetic comparative methods described below were conducted across 250 trees drawn at random from the bootstrap replicates to account for phylogenetic uncertainty.
Quantifying matrotrophy and sexual selection
The extent of post-fertilization maternal provisioning was quantified using the matrotrophy index (MI, ln-transformed for all analyses), which is the ratio of offspring mass at birth to the mass of the egg at fertilization (Reznick et al. 2002; Pollux et al. 2009). Offspring of lecithotrophic species typically lose 25-55% of the initial egg mass during development (MI < 0.75), while continuous nutrient transfer from mother to offspring during gestation in matrotrophic species leads to MI > 1 (Reznick et al. 2002; Pollux et al. 2009). Matrotrophy levels for all species included in the analysis were obtained from previously published studies (Pollux et al. 2014; Olivera-Tlahuel et al. 2015).
Variation in sexual selection within poeciliids was quantified using a morphology-based sexual selection index (SSI), which quantifies the degree of sexual dimorphism in body shape and multiple fin traits that reflect variation in female choice and male mating strategies (Culumber & Tobler 2017). The index describes variation along a previously established continuum of poeciliid mating systems (Bisazza et al. 1997; Greven 2005; Martin et al. 2010), ranging from species characterized by long gonopodia and coercive mating tactics (negative index scores) to species with short gonopodia and courtship (positive index scores; Culumber & Tobler 2017).
Evolutionary time-lag analysis of sexual selection and matrotrophy
A prior study documented correlated evolution of matrotrophy and sexual selection in poeciliid fishes (Pollux et al. 2014; see Figure 1A), but the causal relationship was not resolved. Three hypotheses could explain correlated evolution: (1) Evolution in patterns of sexual selection along a continuum from male coercion with cryptic female choice to male courtship with pre-copulatory female choice may favor different maternal provisioning strategies and impact parent-offspring conflict (Ala-Honkola et al. 2011; Haig 2014); (2) shifts along the lecithotrophy-matrotrophy continuum may drive the evolution of sexual selection (Zeh & Zeh 2000; Pollux et al. 2014); or (3) the same (or correlated) environmental factors may exert selection on multiple traits, causing correlated phenotypic evolution without pleiotropic interactions among trait suites.
We used the MVMORPH package in R (Clavel et al. 2015) to evaluate the causal relationship underlying the previously documented correlated evolution of matrotrophy and sexual selection. MVMORPH implements Ornstein-Uhlenbeck models to test whether one trait follows the optimum of a second trait with a detectable time-lag. We used the matrotrophy index and the sexual selection index as focal traits, contrasting a null model (no detectable lag) to a model that assumes shifts in matrotrophy lag behind shifts in sexual selection (i.e., sexual selection drives matrotrophy evolution) and a model that assumes shifts in sexual selection lag behind shifts in matrotrophy (i.e., matrotrophy drives evolution of sexual selection; see Figure 1B). Analyses assuming a unique adaptive optimum (OU1 model) yielded identical results to assuming multiple optima (OUM model). Models were compared based on their average Akaike weights calculated with a finite sample correction (Johnson & Omland 2004).
Evolutionary dynamics of maternal provisioning strategies
To characterize the evolutionary dynamics of matrotrophy evolution, we conducted ancestral state reconstructions of MI using phytools (Revell 2012). To evaluate the directionality of matrotrophy evolution (increased vs. decreases in MI) between each node and its descendants, we extracted trait reconstructions for each node of the tree and calculated ΔMI as the observed (tip) or inferred (node) matrotrophy values subtracted from the values of its most recent ancestral node.
Identifying ecological correlates of variation in maternal provision strategies
There are two primary ecological hypotheses for the evolution of matrotrophy (Pollux et al. 2009; Pires et al. 2011): (1) Matrotrophy has been hypothesized to reduce locomotor costs associated with pregnancy (locomotor hypothesis; Magnhagen 1991; Shaffer & Formanowicz 1996; Miles et al. 2000). Lecithotrophic females are expected to suffer from impaired locomotion throughout gestation, while matrotrophic females with initially small embryos should avoid such costs at least in early stages of pregnancy (Miller 1975; Thibault & Schultz 1978). Hence, matrotrophy should be associated with environments that favor high locomotor performance, such as habitats with high predation pressure or fast water currents (Reznick et al. 2007; Gorini-Pacheco et al. 2017). (2) Resource availability may shape evolution along the lecithotrophy-matrotrophy continuum. Lecithotrophy is expected to be adaptive in environments with low or fluctuating resource availability (Thibault & Schultz 1978), whereas matrotrophy theoretically maximizes reproductive output when resource availability is high and stable (Trexler & DeAngelis 2003).
To test these alternative hypotheses, we assembled a set of relevant environmental predictor variables. For the locomotor hypotheses, predictor variables included metrics of hydrology (based on the topography of each species’ range) and predation (number of predatory fish species overlapping each species’ range). For the resource availability hypothesis, we quantified climate (temperature and precipitation patterns in each species’ range, which are indicative of temporal variability), average net primary productivity (NPP), and competition (number of poeciliid species overlapping each species’ range). The potential effects of different environmental variables on variation in maternal provisioning strategies was evaluated with phylogenetic path analysis as outlined below.
Quantifying hydrology, climate, and net primary productivity
Assembly of hydrological and climate variables associated with each species’ range was based on georeferenced occurrence points. We obtained 73,398 locality points from multiple sources (http://fishnet2.net/, http://gbif.org/, primary literature), representing the known distributions for all 94 species included in our study. We first removed duplicate points and retained a maximum of 100 randomly sampled localities within the native range of each species, which is sufficient to capture environmental variation even in wide-ranging species (van Proosdij et al. 2015). We further verified that all data points for a given species were at least 1 km apart to match the spatial resolution of environmental data. Any locality that did not meet this criterion was either removed for species with <100 localities or replaced by another randomly drawn locality for species with >100 localities. For all locality records, we then extracted values for three hydrological (elevation, slope and compound topographic index; Hydro1k: https://lta.cr.usgs.gov/HYDRO1K/), 19 climatic variables (Worldclim: http://worldclim.org/), and an estimate of net primary productivity (https://lpdaac.usgs.gov/) at a spatial resolution of ~1 km2 (30 arcsec) in ArcMap version 10.2.2 (ESRI Inc, Redlands, CA, USA). For each species, we calculated the median value for all 23 variables. Climatic and hydrological variables were then subjected to separate phylogenetic principal component analyses (pPCA) using a correlation matrix, as implemented in the phytools package in R (Revell 2012). In addition to the estimate of net primary productivity associated with each species’ range, we retained two pPCA axes accounting for 76% of variation in hydrology (Table S2) and three pPCA axes accounting for 81% of variation in climate (Table S3).
Quantifying competition and predation
Quantifying the actual biotic interactions for a large number of species distributed across the vast geographic scale included in this study is virtually impossible, such that we developed two simple, objectively quantifiable metrics to approximate levels of competition and predation. We assumed that competitive interactions for the focal species primarily occur with other species of the family Poeciliidae (Alberici da Barbiano et al. 2010; Torres-Dowdall et al. 2013) and that the intensity of competition is a function of the number of coexisting species. Hence, we first analyzed overlap of distributional ranges to characterize patterns of sympatry (defined as range overlap values greater than zero; Weber et al. 2016). We created geo-referenced distributional range maps for each species by generating a convex hull around each species’ known occurrence points (see above) using ArcMap. The resulting species-specific distributions were then intersected to determine the total number of competitor species exhibiting a range overlap with a focal species. Similarly, we created a metric estimating the levels of predation by determining the total number of piscivorous fish species exhibiting a range overlap with each focal species. To do so, we obtained 271,148 locality points (http://gbif.org/) of 7,170 species across 1,602 genera and 26 families in the superclass Osteichthyes that coincide with the distribution of poeciliids. Since distributional polygons of some focal species overlapped with marine habitats (particularly in poeciliid species occurring along the Gulf of Mexico and in both island and mainland localities), we first removed species primarily inhabiting marine environments as well as non-native species, retaining 5,019 native freshwater species in 853 genera (Table S4). To identify potential predators, we conducted a genus-level literature search of dietary habits using relevant monographs (Greenfield & Thomerson 1997; Bussing 1998; Boschung et al. 2004; Miller et al. 2005; van der Sleen & Albert 2017), supplemented by the primary literature when necessary. We retained 131 genera that included species with evidence for piscivory (867 species; 73,421 locality points). Values for the number of competitors and predators were square-root-transformed prior to analyses.
Analytical framework
We investigated hypotheses about the hierarchical relationships among abiotic and biotic environmental factors and matrotrophy using phylogenetic path analysis as implemented in the R package PHYLOPATH (van der Bijl 2018). We developed 18 models based on a priori hypotheses about the effects of hydrology, climate, NPP, competition, predation, and interactions between predictor variables relevant in the context of the locomotor cost and resource limitation hypotheses of matrotrophy evolution (Figure S2). As with all other phylogenetic analyses described above, path analyses were run across 250 random trees. phylopath implements model selection with covariance inflation criterion, CICC (Rodriguez 2005). Models with an average ΔCICC < 2 were considered equally supported (Burnham & Anderson 2002). Joint effects of net primary productivity and competition were visualized using non-parametric thin-plate spline regression to create a surface of matrotrophy variation (Arnold 2003). Estimation of matrotrophy surfaces was performed using the fields package in R, with smoothing parameter λ = 0.005 (Nychka et al. 2007).
Results
Shifts in matrotrophy preceded shifts in sexual selection
Analyses of evolutionary time-lags across 250 trees revealed the strongest support for the model in which shifts in matrotrophy preceded shifts in sexual selection (mean Akaike weight: 0.430; 95% CI: 0.411 – 0.450). The null model (no lag between the two traits) received significantly lower support (mean Akaike weight: 0.312; 95% CI: 0.304 – 0.320), and the model assuming that shifts in sexual selection preceded shifts in matrotrophy had the lowest support (mean Akaike weight: 0.258; 95% CI: 0.244 – 0.272). These results support the previously held assumption that evolution in matrotrophy mediates subsequent changes in sexual selection, rejecting the alternative hypothesis that sexual selection was a key driver of life history diversification in poeciliid fishes.
Evolutionary dynamics of matrotrophy evolution during diversification of poeciliid fishes
Ancestral state reconstructions (ASR) were used to compare inferred ancestral states of matrotrophy to variation in matrotrophy observed in extant taxa (Figure 2A). ASRs across 250 trees demonstrated that lecithotrophy is not the ancestral provisioning strategy (Figure 2B), challenging previous assumptions about matrotrophy evolution in poeciliids. The inferred ancestral state was clearly toward the matrotrophic end of the spectrum (with a net weight gain during development) and distinctly above the levels of post-fertilization provisioning observed in most extant taxa (Figure 2B). This does not mean that matrotrophy evolved prior to lecithotrophy, but rather that the common ancestor of extant poeciliids had already evolved some degree of post-fertilization provisioning. Examining the direction of shifts in post-fertilization provisioning strategies between all nodes and their descendants revealed that reductions of post-fertilization provisioning were just as common as increases in matrotrophy (Figure 2C).

A. Best-scoring maximum likelihood tree of 94 species in the family Poeciliidae. The ancestral state reconstruction of matrotrophy is mapped onto the phylogeny, with blue colors depicting lecithotrophy and orange colors matrotrophy (as indicated by the color scale of ln-transformed matrotrophy index values). B. Frequency histogram of the distribution of matrotrophy index values in extant poeciliid species. The solid red line represents the average ancestral state reconstruction for the matrotrophy index across 250 random trees with dotted lines indicating the 95% confidence interval for the estimate. C. Frequency histogram depicting the relative change in matrotrophy index between all nodes and their descendants.
Ecological correlates of matrotrophy evolution
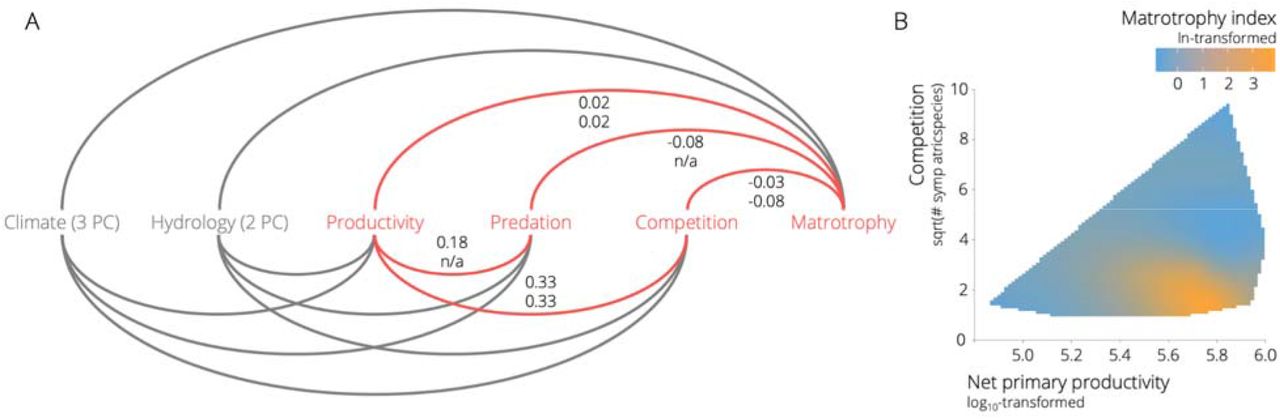
We contrasted a series of hypotheses about the hierarchical relationships among different abiotic and biotic environmental variables and matrotrophy using phylogenetic path analysis. Model selection identified two models with average ΔCICc < 2 across the 250 trees (Figure S3), including NPP, competition, and predation as predictor variables for variation in MI (Figure 3A). Both models indicated that NPP positively correlated with competition (r = 0.325, 95% CI = 0.324 – 0.326 for both supported models), which in turn was negatively correlated with matrotrophy (top model: r = −0.030, 95% CI = −0.034 – −0.025; secondary model: r = −0.077, 95% CI = −0.081 – −0.075). In addition, there was a positive relationship between NPP and matrotrophy (top model: r = 0.024, 95% CI = 0.022 – 0.025; secondary model: r = 0.023, 95% CI = 0.021 – 0.024). Simultaneously visualizing the effects of NPP and competition on matrotrophy indicated that high levels of matrotrophy occurred when NPP was high and competition was low (Figure 3B). This finding is consistent with the predictions of theoretical models that emphasize resource availability in the evolution of matrotrophy (Trexler & DeAngelis 2003). In the best supported model, NPP was also positively correlated with predation (r = 0.184, 95% CI = 0.183 – 0.185), which in turn was negatively correlated with matrotrophy (r = −0.082, 95% CI = −0.087 – −0.078). Notably, however, the directionality of the relationship between predation and matrotrophy was opposite to the predictions of the locomotor cost hypothesis, which posits that matrotrophy should enhance locomotor performance and be favored in high-predation environments (Gorini-Pacheco et al. 2017). Although the effects sizes in the path analyses were relatively small, they were significantly different from zero, indicating that ecology has played a role in matrotrophy evolution.

A. Representation of the full model used for phylogenetic path analysis (see Figure S2 for a comprehensive depiction of alternative models). Highlighted in red are variables and paths associated with the top models exhibiting ΔCICc < 2. Numbers represent correlation coefficients (r) between variables for the top model (top number) and the secondary model (bottom number). Note that the factor predation was absent from the secondary model. B. Landscape of matrotrophy variation as a function of net primary productivity and competition. Colors correspond to variation in matrotrophy, with blue colors depicting maternal provisioning strategies toward the lecithotrophy end of the spectrum and orange colors strategies toward the matrotrophy end (as indicated by the color scale of ln-transformed matrotrophy index values).
Discussion
Shifts from pre- to post-fertilization maternal provisioning represent a major axis of life history evolution in viviparous organisms (Wourms 1981; Blackburn 1992). Using comparative phylogenetic analyses of livebearing fishes, we show that shifts in this life history trait preceded concomitant shifts in sexual selection, establishing a previously untested causative relationship (Haig 2014; Pollux et al. 2014). Moreover, we identified resource availability and competition as ecological tipping points facilitating bi-directional evolution along the lecithotrophy-matrotrophy continuum, in part supporting the predictions of theoretical models (Trexler & DeAngelis 2003) and experimental observations (Pollux & Reznick 2011). Our results indicate that ecology shaped life history diversification of livebearing fishes, with cascading effects for evolutionary change in sexual selection (Pollux et al. 2014) and potentially speciation (Zeh & Zeh 2000; Zeh & Zeh 2008).
Life history evolution is generally assumed to progress from oviparity to lecithotrophic viviparity to matrotrophic viviparity (e.g., Furness et al. 2015). However, our analyses indicated that decreases in levels of matrotrophy were just as common as increases. Such bi-directional evolution along the lecithotrophy-matrotrophy continuum has been documented in other viviparous taxa (e.g., Dulvy & Reynolds 1997; Reznick et al. 2007) and parallels secondary losses of obligate viviparity in fishes and reptiles (Parenti et al. 2010; Recknagel et al. 2018). The standard model of linear life history evolution therefore needs reevaluation to acknowledge that the evolution of these traits is more complex and dynamic than generally appreciated.
Ecological sources of selection appear to be important in driving bi-directional evolution along the lecithotrophy-matrotrophy continuum, as correlations between ecological variables and the degree of matrotrophy support adaptive hypotheses of life history evolution. Phylogenetic path analysis identified three biotic variables that were associated with variation in matrotrophy (resource availability, competition, and predation), all of which are well-documented drivers of life history diversification in animals (Stearns 1976; Martin 1995; Wilson 2014). Even though pregnancy in poeciliids has been experimentally linked to locomotor costs (Plaut 2002; Ghalambor et al. 2004), and there is evidence that matrotrophy increases streamlining (Fleuren et al. 2018) and is favored in high predation environments requiring efficient escape responses (Gorini-Pacheco et al. 2017), our macroevolutionary analyses indicated that the relationship between matrotrophy and predation was opposite to the predictions of the locomotor hypothesis. Rather, our results provided support for the resource availability hypothesis, demonstrating that high levels of matrotrophy coincided with low competition and high resource availability. This finding is consistent with the Trexler-DeAngelis model of matrotrophy evolution (Trexler & DeAngelis 2003), which predicts increases in matrotrophy in environments with abundant and stable resources. In addition, experimental studies have shown that maternal provisioning strategies in poeciliids respond to resource availability (Trexler 1997; Marsh-Matthews & Deaton 2006).
Even though our results largely align with previous theoretical and empirical studies, there are some caveats that warrant additional consideration. Most importantly, it remains to be tested whether metrics of resource availability, competition, and predation used here to facilitate continental-scale analyses accurately reflect selective regimes experienced by different species. The challenges of quantifying complex variation in biotic interactions across the spatial and phylogenetic scales covered in this study highlights the need for microevolutionary analyses and experimental approaches on broader phylogenetic scales that allow for a better understanding of causal relationships (Culumber & Tobler 2018). For example, while there is experimental evidence for the fitness costs of matrotrophy under fluctuating resource conditions (Pollux & Reznick 2011), we still lack any empirical evidence indicating that matrotrophy provides fitness benefits over lecithotrophy under high and stable resource conditions (Pollux et al. 2009). In addition, it remains to be experimentally tested how resource availability and competition potentially interact in determining the success of different maternal provisioning strategies, especially because resource stress and competitive interactions may have non-additive effects (Hart & Marshall 2013; van Egmond et al. 2018).
Conclusions
The role of ecological sources of selection as key drivers in life history evolution is well established at microevolutionary scales (Partridge & Harvey 1988; Reznick et al. 1990). Our study suggests that ecology also correlates with maternal provisioning strategies at macroevolutionary scales, suggesting that adaptation to resource availability and competition may be sufficient to explain life history diversification in livebearing fishes and potentially in other viviparous taxa (Wourms 1981; Blackburn 1992). Ecology consequently provides the critical context for a number of other evolutionary phenomena that have been directly associated with shifts in maternal provisioning strategies, including the incidence of parent-offspring conflict, sexual selection, and speciation (Zeh & Zeh 2000; Crespi & Semeniuk 2004; Zeh & Zeh 2008).
Data Sharing
Data and scripts used to conduct this study will be made public on the authors’ GitHub page (https://github.com/michitobler) upon acceptance of the manuscript. We are also willing to provide these materials to anyone evaluating our manuscript.
Acknowledgments
This research was supported by the National Science Foundation (IOS-1557860 to MT). We thank members of the K-State Evolution Journal Club for constructive feedback on the manuscript.
Footnotes
This is a completely revised version of the manuscript in response to feedback.
References
- 1.↵
- 2.↵
- 3.↵
- 4.↵
- 5.↵
- 6.↵
- 7.↵
- 8.↵
- 9.↵
- 10.↵
- 11.↵
- 12.↵
- 13.↵
- 14.↵
- 15.↵
- 16.↵
- 17.↵
- 18.↵
- 19.↵
- 20.↵
- 21.↵
- 22.↵
- 23.↵
- 24.↵
- 25.↵
- 26.↵
- 27.↵
- 28.↵
- 29.↵
- 30.↵
- 31.↵
- 32.↵
- 33.↵
- 34.↵
- 35.↵
- 36.↵
- 37.↵
- 38.↵
- 39.↵
- 40.↵
- 41.↵
- 42.↵
- 43.↵
- 44.↵
- 45.↵
- 46.↵
- 47.↵
- 48.↵
- 49.↵
- 50.↵
- 51.↵
- 52.↵
- 53.↵
- 54.↵
- 55.↵
- 56.↵
- 57.↵
- 58.↵
- 59.↵
- 60.↵
- 61.↵
- 62.↵
- 63.↵
- 64.↵
- 65.↵
- 66.↵
- 67.↵
- 68.↵
- 69.↵
- 70.↵
- 71.↵
- 72.↵
- 73.↵
- 74.↵
- 75.↵
- 76.↵
- 77.↵
- 78.↵
- 79.↵
- 80.↵
- 81.↵
- 82.↵
- 83.↵
- 84.↵
- 85.↵
- 86.↵
- 87.↵
- 88.↵
- 89.↵


