

Abstract
From microorganism to vertebrates, living things often exhibit social aggregation. One of anuran larvae, dark-bodied toad tadpoles (genus Bufo) are known to aggregate against predators. When individuals share genes from a common ancestor for whom social aggregation was a functional trait, they are also likely to share common recognition cues regarding association preferences, while greater genetic distances make cohesive aggregation difficult. In this study, we conducted quantitative analyses to examine aggregation behavior among three lineages of toad tadpoles: Bufo japonicus japonicus, B. japonicus formosus, and B. gargarizans miyakonis. To determine whether there is a correlation between cohesiveness and genetic similarity among group members, we conducted an aggregation test using 42 cohorts consisting of combinations drawn from a laboratory-reared set belonging to distinct clutches. As genetic indices, we used mitochondrial DNA (mtDNA) and major histocompatibility complex (MHC) class II alleles. The results clearly indicated that aggregation behavior in toad tadpoles is directly influenced by genetic distances based on mtDNA sequences and not on MHC haplotypes. Cohesiveness among heterogeneous tadpoles is negatively correlated with the geographic dispersal of groups. Our findings suggest that social incompatibility among toad tadpoles reflects phylogenetic relationships.
Introduction
Many species exhibit aggregation behavior to avoid predation threat and/or to improve foraging efficiency, indicating that the benefits inherent in group living outweigh the costs. Anuran larvae (tadpoles) commonly aggregate into groups and, similar to fish, their schooling behavior varies between centralized for predator avoidance and non-centralized for foraging (Beiswenger, 1975; Watt et al., 1997; Lardner, 2000). Cohesive aggregation is conducive to higher survival potential (Watt et al., 1997), and individuals stand to benefit from collective foraging (Beiswenger, 1975). Nevertheless, the mechanisms by which genetic polymorphism affects the formation of tadpole social aggregation remain unclear (Wells, 2010). In other words, we do not understand how simple association preference is derived via individual genetic background.
For grouping behavior to initiate, recognition and discrimination of association partners must occur. Several studies have reported kin-biased association of anuran tadpoles across taxa (e.g., Waldman & Adler, 1979; Blaustein & O’Hara, 1981, 1987; Waldman, 1982, 1984). Kin recognition ability is significant in terms of evolution of altruism (Hamilton 1964), which is supported by several reports of kin preference behavior across taxa (Hepper, 2005; Breed, 2014). In Bufo (the common toad), kin-biased high cohesiveness may result in high tadpole survival rates (Watt et al., 1997). Aggregations consisting of dark-bodied tadpoles have also been considered a warning signal of distastefulness to predators (Waldman & Adler, 1979; Glandt, 1984). Although no incontestable evidence for kin preference has been identified (Wells, 2010), the aforementioned studies offer positive evidence in support of a hypothesis of kin selection, as opposed to the selfish herd hypothesis, regarding the social aggregation of toad tadpoles.
A key question is how the mechanisms of association preference among amphibians evolved? The capacity for recognition between kin and non-kin, or between closely and distantly related individuals, carries ecological significance, not only as a device for predator avoidance but also with regard to territoriality, parental care, and mate choice, including inbreeding avoidance and optimal outbreeding (Hepper, 2005; Breed, 2014). Studies have reported that anuran tadpoles discriminate using visual and olfactory cues (e.g., Blaustein & O’Hara, 1987; K Hase & N Kutsukake unpble.data). When the mechanisms that guide association preference are derived from assortative preference, it is likely that the recognition cue will consist of multiple traits and will have evolved via conspecific recognition. This gives rise to the prediction that a negative relationship will be discerned between genetic distance and cohesiveness in the social aggregation of toad tadpoles.
Bufo japonicus (hereafter japonicus), B. japonicus formosus (formosus), and B. gargarizans miyakonis (miyakonis) are native Japanese toads belonging to the true toad family, Bufonidae. Although the distribution of these toads is geographically isolated across Japan’s islands (japonicus and formosus are found in the western and eastern regions of the mainland and miyakonis inhabits the Miyako Islands), their ecological features are relatively common (Matsui, 1984). The genetic differentiations of these Japanese toads are indicative of isolation based on geographic distance (Kawamura et al., 1990). According to classification based on mitochondrial DNA (mtDNA) sequences, they belong to three distinct clades (Igawa et al,. 2006). In contrast to the similarities between japonicus and formosus, adult miyakonis exhibits clear differences in morphology, being smaller in size with fewer bumps. However, the larvae of all three toads have similar morphologies. All tadpoles are herbivores and exhibit aggregation behavior.
In this study, to determine whether there is a relationship between genetic distance and social aggregation in the wild toad tadpole, we conducted a quantitative analysis of aggregation behavior of tadpoles in the three distinct lineages, japonicus, formosus, and miyakonis. We compared the degrees of aggregation behavior among admixture cohorts, assembled by combining laboratory-reared tadpole groups derived from different clutches. As indices of genetic distance in these tadpole groups, we assessed the mtDNA genotypes of the tested tadpoles, which reflects phylogenetic and geographic distances. We also conducted assessment of haplotypes of major histocompatibility complex (MHC) class II. Molecular markers encoded by MHC loci are responsible for generating the individual odors involved in self/non-self-discrimination (Medzhitov & Janeway, 2002; Piertney & Oliver, 2005). MHC gene families encode genes governing immune recognition and function in vertebrates. MHC class I genes express glycoproteins on the nucleated cell surface, whereas class II genes are mainly found on antigen-presenting immune cells. Furthermore, MHC genes not only play a central role in the immune system, but also play a genetic role in kin recognition (e.g., Manning et al. 1992; Yamazaki et al. 2000; Olsson et al. 2003; Villinger and Waldman 2008, 2012).
We report herein the first evaluation of genetic influences on social aggregation behavior in wild tadpoles. We postulate that group formations consisting of heterogeneous tadpoles will be controlled by overall group kinship levels.
Methods
1 Experimental animals
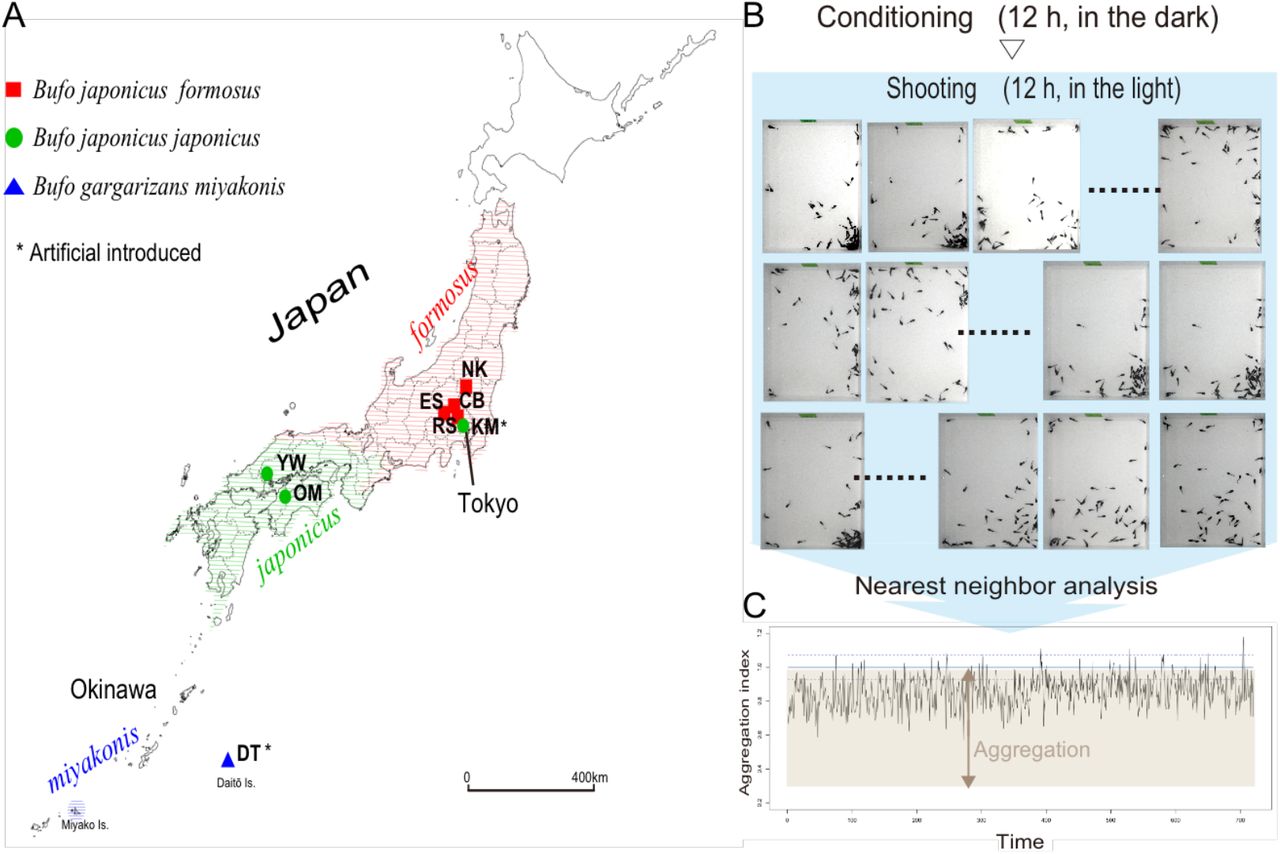
Between February and March 2013, we sampled 18 clutches from eight reproductively isolated sites in Japan (Figure 1A; detailed locality and coordinate data are presented in Table S1). The clutches belonged to three different lineages of Japanese toad: japonicus (n = 7), formosus (n = 8), and miyakonis (n = 3).

Diagrammatic illustration of the experiments: (A) Map of sampling sites. (B) Practical example of the aggregation test. This diagram depicts one trial, which was conducted three times (720 x 3 shots). (C) An example of the analysis of the 720 images.
Clutches spawned by amplectant pairs consisting of a single male, as far as we observed until spawning finished, were specifically chosen to avoid polyandry. After the amplectant pair had left the spawned egg strings, we collected approximately 0.4 m of egg strings containing about 200–400 embryos and transported them to the laboratory. Embryos belonging to the same clutch were divided into two sets before hatching (100–150 individuals per set) and transferred into a container (220 mm width × 310 mm diameter × 40 mm height) in a large incubator at 18°C under a 12:12 h dark:light cycle. All tadpoles were raised with respect to each set with a sufficient supply of fish food pellets containing vegetable stock as the main component (PLECO; Kyorin, Hyogo, Japan). Individuals of each set were colour-marked by immersion in either a 0.00025% solution of neutral red for 24 h or a 0.00025% solution of methylene blue for 12–24 h before the aggregation test, as described previously (Waldman 1984). Thus, sib tadpoles from the same clutch were randomly distributed into different colour sets (red or blue) without harm or the addition of exogenous odour. This treatment was done to simply identification of clutch type in the duplication of the aggregation test and genotyping. After the aggregation test and genotyping, the tested tadpoles were released into their native ponds when possible, excluding miyakonis, which is an artificially introduced alien species.
2 Genotyping
The total DNA content was extracted from the tail-tips of all tadpoles included in the aggregation tests. The samples (tadpole’s tail tip) were left to digest overnight in ethylenediaminetetraacetic acid-sodium dodecyl sulphate (EDTA-SDS) solution (0.3% SDS, 400 mmol/L NaCl, 5 mmol/L EDTA, 20 mmol/L Tris-HCl, pH 8.0) containing 200 µg/mL proteinase K at 55°C. For sequencing and TA cloning, phenol/chloroform extraction and ethanol precipitation were used.
The mtDNA of all clutches was analysed using DNA sequencing were amplified by polymerase chain reaction (PCR) using locus as described in Hase et al. 2013 with specific primers developed previously – cytbF1/Bufo (5′-ATCTGCCGAGATGTAAACAACGG-3‘) and cytb177731R (5’-TCTGYTRAGYTGGGYWAGTTTGTTCTC-3’) –; the sequence was used to build a tree in MEGA 5.2 (Tamura et al. 2011). Mitochondrial cytochrome b sequences, 0.8 kb in length from 18 clutches, were aligned and deposited in the GenBank nucleotide database [Acc. nos. AB597917, AB597928 from ref. 31; AB713512 from ref. 33; LC071519 – LC071529]. The phylogenetic analyses showed that mtDNA sequences of 18 clutches diverged into three lineages with high bootstrap support (Figure 2A). All values were used to estimate the genetic differences among the mtDNA lineages as a genetic index. In these three Bufo species, the differences in the mtDNA cytochrome b sequences reflected their geographic distribution in Japan (Igawa et al., 2006; Hase et al., 2013, Figures 1A and 2A).

(A) Maximum likelihood (ML) trees of the mitochondrial DNA (mtDNA) lineage of 18 clutches based on 831 bp of Cytb sequences. (B) ML tree of major histocompatibility complex (MHC) alleles based on 324 bp of class II exon partial sequences. The width of the colored bar on the right side of each allele ID corresponds to the number of identified clutches. The color represents the attribution of the mtDNA lineage of the identified clutches corresponding to the mtDNA tree, where green, red, and blue indicate the japonicus, formosus, and miyakonis lineages, respectively. From the 18 clutches, 13 MHC alleles presented complex relations with the mtDNA lineages; the BJ1 allele was distributed throughout all lineages. Both trees were estimated using the GTR +Γ model, selected according to the Akaike information criterion value in MEGA 5.0. Support values for the internal nodes were inferred from 1,000 bootstrap replicates. †1and †2 correspond to the haplotypes from Hase et al. (2012) and (2013), respectively. and genetic diversity. (C) Relationship between aggregation behavior (mean of aggregation index) and mtDNA pairwise distances in the tested cohorts (n = 42, r = 0.524; P < 0.001; y = 0.429x + 0.858). Regression lines were calculated for significant Spearman’s rank correlation coefficients and the dashed lines indicate two-sided 95% confidence intervals. (D) Aggregation index and MHC class II allele amino acid differences in non-sib cohorts (n = 31, r = 0.149; P = 0.424). Error bars represent standard errors within each cohort for repeated trials. The plot marks indicate the lineage attributes for each cohort of laboratory-reared sets (see Table 1).
MHC class II antigen (partial exon) allele sequences were amplified by PCR using locus-specific primers developed previously (May et al. 2011) – 2F347 (5‘-GTGACCCTCTGCTCTCCATT-3’) and 2R307b (5’-ATAATTCAGTATATACAGGGTCTCACC-3’) – using KOD FX Neo (Toyobo, Osaka, Japan) in a final reaction volume of 10 µL. The PCR conditions consisted of an initial denaturation step of 2 minutes at 94°C followed by a touchdown program consisting of three cycles of 10 s at 98°C, 30 s at 62°C and 20 s at 74°C, three cycles of 10 s at 98°C, 30 s at 60°C and 20 s at 72°C and 24 cycles of 10 s at 98°C, 30 s at 58°C and 20 s at 70°C. To identify the original alleles within each clutch, 4 –15 individuals per clutch were sequenced.
TA cloning was performed for heterozygous individuals using a pGEM-T vector system (Promega, Madison, WI, USA) and Ligation high (Toyobo) was used for ligation. Transformation was performed using Competent high DH5 (Toyobo). Finally, 13 alleles of the 0.3-kb MHC class II locus were detected in 127 individuals from 18 clutches, which were used to construct a phylogenetic tree using MEGA 5.2 (Tamura et al., 2011). All MHC alleles have been deposited in the GenBank nucleotide database (Accession Nos. LC065649 – LC065661). From these clutches, 13 MHC alleles presented complex relations with the mtDNA lineages; the BJ1 allele was distributed throughout all lineages (Figure 2B). The amino acid alignment of this allele is presented in Figure S1. We then proceeded to genotype all of the tadpoles included in the test except including polyandrous clutch samples (NK1, see below). Hence, Individuals belonging to 42 cohorts were genotyped using restriction fragment length polymorphism analysis (RFLP) of PCR-amplified fragments (PCR-RFLP). For individuals belonging to B. japonicus formosus clutches, we used the reverse primer R_BjMHCII (CCATAGTTG TRTTTACAGWATSTCTCC) during PCR instead of 2R307b, which was developed using already identified alleles. All PCR-amplified MHC sequences were subsequently digested using more than one restriction enzyme, such as BmeT1101, BseRI, BsgI or XhoII, chosen to distinguish haplotypes among all the possible combinations of alleles identified in the clutches (Tables S1 and S2). The MHC haplotypes of all 50 individuals in each cohort could be identified from PCR-RFLP data. However, in cases where the haplotype of more than two individuals could not be identified using this method, the entire cohort was excluded from the genetic diversity analysis. A total of 1,550 individuals (31 of 42 cohorts) were finally included in the analysis.
To check polyandry, we selected four microsatellite loci by PCR: 1) Bbufu23; 2) Bbufu39; 3) Bbufu62 (Brede et al. 2011); and 4) Bjap14 (Hase et al., 2013). Following the method described previously (Hase et al., 2013), the loci were amplified with two multiplex reactions using a Multiplex PCR Kit (QIAGEN, Valencia, CA, USA) according to the manufacturer’s protocol. PCR amplification consisted of an initial denaturation step at 95°C for 15 minutes, followed by 25–35 cycles of 30 s at 94°C for denaturation, primer-specific touchdown annealing for 90 s at 46–61°C (Hase et al. 2013) and an extension step at 72°C for 1 minute. The fragment sizes of the PCR products from each microsatellite locus were analysed using a CEQ8000 Genetic Analysis System (Beckman Coulter, Fullerton, CA, USA) with a Genomelab Size Standard Kit 400 (60 – 420 bp; Beckman Coulter). Overall, we genotyped 1,200 individuals belonging to 18 clutches. A polyandry check performed by GERUD2.0 (Jones, 2005) indicated that 17 of 18 clutches had a single sire. One clutch, NK1, was sired by at least two males; the relative paternity results for NK1 showed that the first male sired 84% of the clutch, and the second male sired the remainder. Hence, we eliminated clutch NK1 from the genotyping of the MHC haplotype.
3 Aggregation behavior test
An aggregation behavior test was conducted on 68 sets generated from 50 randomly chosen tadpoles from the different laboratory-reared sets (25 red- and 25 blue-dyed tadpoles were chosen from two containers, respectively). The tadpoles were transferred into plastic containers (230 mm width × 350 mm depth) containing 1 L dechlorinated tap water (20 mm in height). Pairs of red- and blue-dyed tadpoles were characterized as sib (i.e., derived from the same clutch but raised separately) or non-sib (i.e., intra-/inter-lineages). The aggregation behavior test comprised three trials using the same cohort of 50 tadpoles. The selection process lasted 5 days. The aggregation tests were performed according to the procedure described below (also detailed in Figure 1B). Tadpoles were chosen for a trial cohort according to their developmental stage to ensure that each cohort consisted of tadpoles of a similar age between stages 27 and 37 (Gosner, 1960). All trials began at night in a large closed incubator, and lasted for 24 h. After 50 tadpoles had been individually and evenly distributed throughout the container using a spoon, for pre-conditioning purposes the container was kept in the dark for 12 h. Observation of the aggregation behavior began the following morning. Images of each tadpole’s aggregation behavior were recorded under normal light conditions using a Pentax Optio W80 camera (Ricoh, Tokyo, Japan) in interval shooting mode. Photographs were captured at 1-min intervals, yielding a total of 720 shots per trial. The trial was repeated three times with two intermissions. During the trials, the containers with the tadpoles were maintained in large incubators at 18°C for 24 h. Following completion of the first trial, the tested cohort was divided into two sets based on the color of the dye (25 red tadpoles and 25 blue tadpoles) and fed, then allowed to acclimate for 24 h (intermission process). The tadpoles were subsequently returned to the experimental container for a repeat aggregation trial, as described above. Figure 1B presents an outline of the experimental process. Aggregation tests were conducted in 42 cohorts, each consisting of two laboratory-reared set pairs.
4 Aggregation index
The degree of aggregation was measured using the aggregation index based on nearest-neighbor analysis (Clark & Evans, 1954; Heupel & Simpfendorfer, 2005). We ascertained the positions of 50 individuals in the two-dimensional arena (230 mm × 350 mm), after which we calculated the mean distance r from each individual to its nearest neighbor. For randomly distributed individuals, the mean distance (Er) from the nearest individual was analytically described (Heupel & Simpfendorfer, 2005). However, to incorporate the effects of the arena corners, we conducted stochastic simulations, scattering 50 random points throughout the arena. After 1,000 iterations, we obtained the Er ± standard deviation (SD) = 21.11 ± 1.7 (mm), with a lower 5% confidence limit of 18.28 (mm). Aggregation index may be defined as the ratio of the measured value: R = r / Er. When r was below 18.28 (mm), the distribution of the tadpoles could be ascribed to statistically significant aggregation behavior (R < 1). It should be noted that lower aggregation index values indicate higher degrees of aggregation. Figure 1C shows a sample raw data-obtained image.
5 Genetic indices and data analyses
We used two genetic indices to compare gene diversity among the tested cohorts: mtDNA pairwise distance and MHC (class II antigen) amino acid sequence difference. Having analyzed the phylogenetic relationships (Figure 2AB), we quantified the genetic distances of each marker.
The evolutionary divergence of the mtDNA lineages for each experimental clutch pair was estimated using the number of base substitutions per site. These analyses were conducted based on the maximum composite likelihood model in MEGA 5.2 (Tamura et al., 2011). The MHC genotypes were derived from the MHC class II antigen (partial exon, 0.3 kb) haplotypes for each cohort based on 12 alleles that were identified by genotyping (Tables S1 and S2, Figure S1). We calculated the amino acid sequence differences of the MHC genotypes in each cohort as an additional genetic index using MEGA 5.2 (Tamura et al., 2011).
To verify the effect of genetic influence on aggregation behavior, the data were analyzed using R ver. 3.4.3 software (R Core Team, 2017). We evaluated the relationship between the genetic indices (mtDNA pairwise distances and MHC class II amino acid differences) and the degree of aggregation using Pearson’s correlation test. We also applied generalized linear mixed models (GLMMs) with Gaussian distribution. In the GLMM analyses, each mtDNA and MHC was treated as a fixed variable and the clutch was treated as a random variable. Additionally, to verify whether intra-lineage pair cohorts scored higher in the aggregation test than inter-lineages irrespective of genetic indices, we conducted the GLMMs by treating intra-/ inter-lineage as a fixed variable and clutch as a random variable.
Results
Table 1 presents the results of the aggregation test. We confirmed that tadpoles could aggregate across distinct lineage boundaries. In all tests, the tadpoles exhibited significant levels of aggregation behavior: the mean value of the aggregation index (over 720 shots and three trials) was 0.894 ± 0.049 (n = 42, mean ± SD; range: 0.776–0.959).
Results of the aggregation tests. The trial cohort information provided is as follows: relatedness, cohort ID, clutch affiliation for tested sets (detailed information is presented in Table S1 and Figure S1), lineage of tested clutch pairs (j: japonicus; f: formosus; m: miyakonis) and average developmental stage of the tested tadpoles (Gosner 1960). Genetic diversity and aggregation test scores: mtDNA, pairwise distances; MHC, amino acid differences by cohort. Aggregation index, mean value of aggregation index over 720 shots over three trials.
We detected a distinct negative correlation between phylogenetic distance and tadpole cohesiveness, where genetic distance based on mtDNA was significantly correlated with the degree of aggregation (n = 42, t = 3.888, Pearson’s r = 0.524, P < 0.001; Figure 2C). Conversely, no correlation was discerned between the MHC amino acid differences and cohesiveness (n = 31, t = 0.811, Pearson’s r = 0.149, P = 0.424; Figure 2D). The results of the GLMMs corroborated this. mtDNA pairwise distance exhibited a significant effect on aggregation behavior (t = 3.49, P < 0.001), whereas MHC amino acid difference was not associated with any significant influence (t = 1.13, P = 0.281). This indicates that shorter phylogenetic distances are correlated with higher cohesiveness in the toad tadpole’s aggregation behavior. Moreover, intra-lineage pair cohorts aggregated significantly more than inter-lineage pair cohorts (GLMMs: t = -3.2, P = 0.002; Figure 3). This indicates that the toad tadpoles possessed the ability to perform lineage discrimination, which corresponds with the taxonomic relationship between the three Japanese toads (japonicus, formosus, and miyakonis).

Boxplots of the aggregation index values of the intra-lineage cohorts (median = 0.872, mean ± SD = 0.878 ± 0.050) and inter-lineage cohorts (median = 0.920, mean ± SD = 0.911 ± 0.04). The classification of intra- and inter-lineages correspond to those in Table 1. ** P < 0.001 (GLMMs).
Discussion
Our findings suggest that tadpoles discriminate distantly related individuals and that this has an influence on aggregation behavior (Fig. 2C). Tadpoles can discriminate other lineages (Fig. 3), which suggests that japonicus, formosus, and miyakonis are capable of species recognition in relation to one another. Species recognition has been investigated in the context of mate choice, including its general implications for speciation (e.g., Taylor et al., 2000; Hauber et al., 2001). In the case of mate choice in the toads, in particular miyakonis, species recognition seems not to be significant due to geographically isolation. In addition, male-male competition is a central factor rather than female preference in the reproductive behavior of B. japonicus (Hase & Shimada 2014). An exploration of the ecological function of the species recognition abilities we detected lies beyond the scope of this study. However, the findings suggest that toad tadpoles can not only aggregate across lineages, but can also discriminate one another. We can infer from the data that the genetic background to the social discrimination phenomenon among these species consists of a process rooted in a common ancestor.
The GLMM analysis suggested that all individuals, whether japonicus, formosus, or miyakonis, used similar cues (phenotype- or odor-matching) regardless of lineage type, because the degree of aggregation was influenced by genetic distance but not by cohort type (P < 0.001). These findings are relevant to the mechanisms of kin recognition in these species. It is likely that the recognition cues have evolved via species recognition. That is, the traits that contribute to discrimination may derive from an ancestor of Bufo that developed the properties of distastefulness in the tadpole’s black body; therefore, although there were variations in selective pressure across the breeding sites, the warning signals derived from distastefulness should be common to all three lineages (japonicus, formosus, and miyakonis). Cohesive aggregation increases survival potential for tadpole groups (Watt et al., 1997). Thus, we may hypothesize that our findings partially corroborate previous reports on the social behavior of microorganisms that detected a correlation between genetic variation and social incompatibility (Ostrowski et al., 2008; Mehdiabadi et al., 2009; Chaine et al., 2010). Moreover, it can be suggested that social aggregation in toad tadpoles is also fundamentally controlled by the genetic similarities among group members. However, the evolutionary process of the kin recognition system of toad tadpoles and its adaptive significance lie beyond the scope of this study, and several unanswered questions concerning toads’ capacity for social discrimination remain.
Previous studies have emphasized the importance of MHC genes to social discrimination in the anuran (Villinger & Waldman, 2008, 2012). However, we found no evidence for an MHC-mediated recognition system across the three lineages of tadpoles in the present study, and MHC amino acid differences did not correlate with the aggregation index values (r = 0.149, P = 0.424, Figure 2D). This may be attributed to our genetic index data’s inadequacy in determining the genetic background, and the assessment of the MHC gene offered only a partial explanation, that the identified MHC class II allele was partial (324 bp; details provided in Figure S1). Furthermore, genetic diversity derived from mtDNA yields no information regarding the genetic mechanisms governing group member preference. To ascertain which traits are essential elements for this, genome-wide investigation is required. Further study is now underway to obtain a more detailed appreciation of genetic influence on social discrimination among toad tadpoles. While MHC-mediated social discrimination is likely to work among closely related individuals (Hase et al., unpubl. data), it might not work among distantly related individuals. There follows a discussion regarding the kin recognition system in aggregation behavior and our conclusion regarding the efficacy or influence of MHC in this mechanism.
In anurans, although previous studies have verified the occurrence of kin recognition among wild tadpoles, there is no information regarding related genetics (Wells, 2010). In general, it seems that overall kinship level acts to form the cohesiveness in the social aggregation of the toad tadpoles: as genetic distances decreases, degree of the aggregation decreases. The present study constitutes the first step toward determining the genetic background to social discrimination in these species.
Data accessibility
Sequence data are available from GenBank (accession Nos. LC071519–LC071529, LC065649–LC065661). The raw data for aggregation tests and haplotype data for all tested tadpoles will be available from the Dryad Digital Repository after manuscript acceptance.
Electronic supplemental material file
Supplementary Tables S1 and S2, and Figure S1.
Acknowledgements
We are grateful for the help of Prof. B. Waldman and Dr. A. Bataille of Seoul National University. We sincerely thank Prof. N. Nikoh of the Open University of Japan and Dr. T. Iwasaki for advice regarding the molecular work. Special thanks are also due to K. Okayama, H. Fujita, K. Higashi, and K. Tanaka, the University Tokyo, Nikko Botanical Garden, and the University of Tokyo, Chichibu Forest for their help with the fieldwork, and Miyata-kun for experimental support. The project was supported by funding from the University of Tokyo and a Grant-in-aid for Research Activity Start-up from the Japan Society for the Promotion of Science (No. 15H06149).
Literature Cited


