

Abstract
Reaching movements have previously been observed to have large condition-independent neural activity and cyclic neural dynamics. A new precision center-out task was used to test whether cyclic neural activity in the primary motor cortex (M1) occurred not only during initial reaching movements but also during subsequent corrective movements. Corrective movements were observed to be discrete with a time course and bell-shaped speed profile similar to the initial movements. Cyclic trajectories identified in the condition-independent neural activity were similar for initial and corrective submovements. The phase of the cyclic condition-independent neural activity predicted when peak movement speeds occurred, even when the subject made multiple corrective movements. Rather than being controlled as continuations of the initial reach, a discrete cycle of motor cortex activity encodes each corrective submovement.
Significance Statement During a precision center-out task, initial and subsequent corrective movements occur as discrete submovements with bell-shaped speed profiles. A cycle of condition-independent activity in primary motor cortex neuron populations corresponds to each submovement whether initial or corrective, such that the phase of this cyclic activity predicts the time of peak speed. These submovements accompanied by cyclic neural activity offer important clues into how the we successfully execute precise, corrective reaching movements and may have implications for optimizing control of brain-computer interfaces.
Introduction
Corrective movements with sensorimotor feedback are critical for elegant motor control. While a single, discrete movement like a pointing gesture may be mostly ballistic, more precise aiming movements typically require an error correction phase (Woodworth, 1899; Craik, 1947; Abrams et al., 1990; Sainburg et al., 1999; Elliott et al., 2010). Yet the way neurons in motor areas of the brain encode and generate corrective movements to achieve movement precision is relatively unexplored. Most experimental tasks to study individual neurons in primary motor cortex have used instructed movements with a clear onset and offset of movement. These single movement tasks have identified a variety of movement features being encoded (Evarts, 1968; Thach, 1978; Georgopoulos et al., 1982; Kalaska et al., 1989; Kakei et al., 1999).
In addition to encoded movement features, however, there is also a large condition-independent component in the firing rate of neurons in motor cortex (Kaufman et al., 2016; Rouse and Schieber, 2018). Condition-independent neural activity is the change in a neuron’s firing rate from baseline that happens regardless of the instructed movement for any given trial within a given task. Techniques like demixed principal component analysis partition a neural population’s activity into condition-independent modulation and the more classical neural tuning to task features (Kobak et al., 2016). This condition-independent activity is not a simple increase and decrease in firing rate for each neuron but a more complex neural trajectory (Yu et al., 2007) and has been argued to occur for even discrete movements like point-to-point reaching (Kaufman et al., 2016), in addition to inherently cyclic movements like locomotion (Grillner, 1985). The inherent cyclical structure is hypothesized to be related to intrinsic cortical dynamics (Churchland et al., 2012; Hall et al., 2014). These intrinsic dynamics occur presumably due to the network of synaptic connections leading to consistent relative lags with the firing of some neurons reliably occurring earlier relative to other neurons with the generation of movement.
Condition-independent neural activity presents a challenge in describing how corrective movements might be optimized for precision using the classic models typically ascribed to primary motor cortex (M1). For experimental tasks that have been designed with reaches in different directions but similar distances and speeds, it is straightforward to subtract away condition-independent firing rate and use the remaining firing rate to identify the encoding of movement direction. A linear (“cosine-tuning”) model fits this data well (Georgopoulos et al., 1986; Salinas and Abbott, 1994). Experiments where the speed of instructed movement has been varied has shown larger changes for faster movements suggesting some condition-independent neural activity is speed tuning (Moran and Schwartz, 1999). However, these experiments are all single instructed movements and have not sampled smaller amplitude movements needed for precise correction. It is unclear if these smaller movements follow the same speed tuning with very small changes in global firing rate or if some activity is truly condition-independent with any voluntary movement no matter how small. Additionally, it is unknown how the complex, cyclic neural trajectories observed during reaching might disrupt or enhance precision when subsequent corrective movements of various speeds and directions are made.
In the present analysis, we test whether neural dynamics in cortex are repeatable between initial and corrective movements and examine the condition-independent activity across a wide range of speeds. A precision center-out task that required moving to small targets was used to elicit visuomotor corrections. We ask whether corrective movements in our task appear to have discrete submovements and are similar to initial movements. We then ask whether condition-independent activity is affected by speed or if the neural modulation appears similar for both small and large movements. Finally, we ask whether common neural dynamics across movements improve our predictions for when initial and corrective movements occur.
Materials and Methods
Non-human primates
Two male rhesus monkeys, P and Q (weight 11 and 10 kg, ages 7 and 6 years old, respectively), were subjects in the present study. All procedures for the care and use of these nonhuman primates followed the Guide for the Care and Use of Laboratory Animals and were approved by the University Committee on Animal Resources at the University of Rochester, Rochester, New York.
Experimental Design
A precision center-out task was performed by the monkey using a joystick to control a cursor on a 24” LCD display. The monkey manipulated a custom, 18 cm long, cylindrical rod attached to the joystick housing. The joystick moved freely with minimal resistance as the spring mechanism for providing centering, restorative force was removed. The cursor directly represented measured joystick position and moved within a 1000 x1000 pixel workspace centered on the display. The cursor workspace limits were within the physical limits of the joystick. The cursor on the display was a small cross that represented a single point in the workspace. The custom software for task control sampled the joystick data, updated the scene, and stored the cursor position (equivalent to joystick position) and trial event times at 100 Hz.
The precision center-out task consisted of three sets of eight peripheral targets located equidistance and equally spaced in 45° intervals around a center, home target (Figure 1). The center target had a radius of 75 pixels. Each center-out target—defined in polar coordinates—was one of three different sizes i) large targets spanning 45° of the workspace and covering 250-450 pixels from the center, ii) shallower targets also spanning 45° but covering a width only 325-375 pixels from the center, and iii) narrower targets only spanning 15° covering 250-450 pixels from the center. All 24 targets (3 sizes x 8 locations) were presented pseudorandomly in equal amounts throughout a session.

A) Cursor paths for a subset of example trials to each of the three target sizes: regular (top), narrow (middle), shallow (bottom). Initial submovements from 200ms before to 200ms after speed peaks are plotted in blue with the point when peak speed occurred shown with a blue dot. Corrective movements are similarly identified in red with a red dot. Grey lines connect the rest of a trial before, between, or after submovements with a speed peak. B) Cursor speed plotted versus time for a subset of trials. Initial (blue) and corrective (red) submovements are identified with squares.
For each trial, following the subject acquiring the home target and performing a required initial hold ranging from 300-500 ms, the instruction occurred with the given trial’s correct target changing from black to green. Following instruction, the monkey could move the cursor immediately to contact the correct target. At contact, the outline of all targets changed colors from white to black providing visual feedback when the cursor was within the target boundaries. After contacting the desired target, the cursor was required to remain within the target for a variable hold time of 500-600 ms. If the cursor left the target during a final hold, the monkey was allowed to leave and contact the target again and complete a final hold. Once a successful final hold of 500-600 ms was completed, the animal received a liquid reward. Both the required initial and final hold times for each trial were randomly sampled from a uniform distribution.
A peak finding algorithm to identify local maxima (findpeaks function in Matlab (Mathworks, 2020)) was used for analysis of the timing of cursor speed peaks. Cursor speeds were identified as peaks provided they met the following criteria: i) the peak speed was greater than 250 pixels/s and ii) the peak’s prominence—the height difference between the peak and the larger of the two adjacent troughs (minimum speed before encountering a larger peak)—was at least 50% of the absolute height of the peak.
Neural Recordings
Floating microelectrode arrays (MicroProbes for Life Science) were implanted in the anterior bank of the central sulcus to record from primary motor cortex (M1) in each monkey, using methods described in detail previously (Mollazadeh et al., 2011; Rouse and Schieber, 2016). For monkey P, recordings were collected from six 16-channel arrays implanted in M1. For monkey Q, two 32-channel arrays and one 16-channel array in M1 were used. Channels with spiking activity were thresholded manually on-line and spike-snippets and spike times were collected with the Plexon MAP and Blackrock Cerebus data acquisition systems. The spike snippets were sorted off-line with a custom, semi-automated algorithm. Both single- and multi-unit recordings were used in the present analysis.
Statistal Analyses
The firing rates for individual units were estimated by convolving spike times with a Gaussian filter (σ=30 ms). The firing rates were estimated with 10 ms bin resolution for 100 Hz signals to match the joystick data and events. The firing rates were then square-root transformed to equalize variance between high and low firing rates (Kihlberg et al., 1972; Snedecor and Cochran, 1980; Ashe and Georgopoulos, 1994).
We wished to assess how firing rates changed across a large population of neurons as a function of time for both initial and corrective movements. To aid in visualizing this high-dimensional neural space of all recorded spiking units, we chose to use classical multi-dimensional scaling (also known as Principal Coordinates Analysis) for dimensionality reduction (cmdscale in Matlab). Multidimensional scaling reduces the high-dimensional dataset to a chosen number of dimensions while preserving as well as possible the distance (differences in firing rates) between original datapoints.
Dynamical Systems Model
To analyze whether there were repeatable temporal dynamics of the neural population that correlated with movement, the neural data was modeled as a first-order linear, time-invariant system. This model was built using only the condition-independent activity by averaging the firing rates for individual spiking units across all trials regardless of the movement condition (i.e. target location). The condition-independent activity was submitted to jPCA (Churchland et al., 2012) to identify the two-dimensional neural plane with the most rotational/cyclic activity. Note, this utilization of the jPCA algorithm on only the condition-independent activity is different than the typical application of jPCA to data containing the condition-dependent activity. Once this jPC neural plane was identified, this work introduces a new analysis variable—condition-independent phase (CIφ)—which estimates at each time the instantaneous phase by using the Hilbert transfer of the firing rates within the identified two-dimensional plane. More thorough descriptions of the dynamical systems model, jPCA deminsionality reduction, and CIφ estimation are given in the Mathematics and Equations section.
Firing Rate vs. Speed Model
As a comparison to our dynamic system model and phase analysis, the average firing rate across the neural population was also used to identify when peak firing rates occurred and predict future speed peaks. Since some neurons increase their firing rate and others decrease their firing rate on average with movement, a linear prediction model was used to create a weighted sum of the neural firing rates to predict cursor speed peaks. The average firing rate of each unit from 300 ms before to 100 ms after each peak speed was used in a linear regression to predict the peak cursor speed for each submovement. The regression model thus generated weighting coefficients for each neuron to movement speed. These coefficients were then used to weight the instantaneous firing rates at any time point to generate a speed estimate. While this estimate predicts upcoming movement speed, the estimate from the firing rates is given with no lag added to report the time when peak firing rate occurred, not the peak of actual movement.
Circular Statistics
The CIφ values were tested for a significant relationship to the instantaneous cursor speed as well as the occurrence of speed peaks. All circular statistics—mean, variance, correlation, and Rayleigh test for non-uniformity—were calculated with CircStat, a Circular Statistics Toolbox for Matlab (Berens, 2009).
Results
Motor Behavior
Movement speed was analyzed throughout the trial from instruction until successful completion of the final target hold. The two monkeys successfully completed 10,965 (monkey P) and 8,745 (monkey Q) trials across 12 recording sessions each. All cursor speed peaks that exceeded 250 pixels/s were identified as submovements within a trial. Initial peaks were identified as the first submovement that ended at least 150 pixels from the center (approximately halfway to the peripheral target). Any small movements before the initial speed peak—592 (5.4% of trials) for P and 622 (7.1% of trials) for Q—were discarded from further analysis. Additional speed peaks following the initial speed peak were defined as corrective submovements. To focus analysis on submovements made to successfully acquire the target, corrective submovements were only included if some portion of the acceleration phase—time from preceding speed trough to speed peak—occurred outside the peripheral target. There were 6480 and 3917 corrective submovements identified for monkeys P and Q, respectively. Across all trials, 68.3% (P) and 71.1% (Q) were completed in a single initial movement, 17.5% (P) and 20.3% (Q) of trials were completed with one additional corrective submovement, and 14.2% (P) and 8.6% (Q) of trials required two or more corrective submovements. The location of the identified speed peaks within example trials and the speed profiles are shown in Figure 1. When examining the cursor speed in Figure 1B, the speed peaks tended to be distinctly separated with nearly zero velocity between most peaks.
The speed profiles were time aligned to peak speed to better examine the identified submovements (Figure 2A). Almost all submovements show a clear bell-shaped profile for both the initial and corrective movements. The mean peak speeds for initial submovements were 1528 (P) and 1187 (Q) pixels/s while corrective submovement peaks speeds were 504 (P) and 571 (Q) pixels/s. Thus, the average peaks for corrective submovements were 33.0% and 48.1% of initial submovements. The time points when speed was one-half of the maximum speed were identified and the relationship between peak speed and submovement duration was examined. As shown in Figure 2B, the movement duration to half maximum speed was similar and close to symmetric for both initial and corrective submovements with initial submovements being slightly longer on average. Since the target was always the same distance from the center and the animals’ initial reaches tended to get close to the target, there was an inverse relationship between the time duration of initial reaches and the maximum speed observed (Figure 2C). For corrective submovements, there was no clear relationship between movement duration and speed. Overall, all submovement durations as measure by the full width at half maximum time occurred within a similar range with 96.7%/87.5% (P/Q) of all initial and 96.3%/92.8% (P/Q) corrective submovements between 100-350 ms. The time between speed peaks—either initial to first corrective submovement or between subsequent corrective submovements—is plotted in Figure 2D. The median time between peaks was 570 ms for monkey P and 700 ms for monkey Q with only 3.2% (P) and 0.1% (Q) of speed peaks having a time between peaks less than 200ms.

Time course of submovements. A) The cursor speeds are plotted aligned to speed peaks for initial (blue) and corrective (red) submovements. Squares identify speed peaks while circles are located at half the maximum of the speed peak. N.B. The cursor speeds shown are before the bandpass filter used for identifying peaks displayed in Figure 1B. Thus, the maximum of each trace may not align exactly with the plotted peak speed. B) Histogram of the timing of half-maximum speed of all submovements before and after peak speed. C) Peak cursor speed plotted versus the duration of the submovement as measured by the full time width between half-maximum speed peaks (FWHM). D) The time duration between speed peaks including the times from initial submovement to first corrective submovement as well as between any consecutive pairs of corrective submovements.
Condition-independent Firing Rates
The neural data was analyzed by also time aligning to the movement speed peaks and examining the firing rates from 500 ms before until 300 ms after the peak speed. The average number of spikes (binned in 10 ms time bins) for all analyzed units aligned to the peak speed for initial and corrective submovements are shown in Figure 3A. A clear peak occurs before the peak speed for both initial and corrective submovements in both monkeys. Monkey P’s peak firing rates occurred 190 ms and 110 ms before initial and corrective submovements, respectively, while monkey Q’s occurred 180 and 170 ms before. Thus, firing rates increased globally for corrective submovements in addition to the initial reach. The variance of the condition-independent firing rates from a baseline average for corrective submovements was 25.5% (P) and 34.4% (Q) of the condition-independent variance for initial submovements. Notably, the total variance of the neural activity for corrective submovements was 97.3% (P) and 97.9% (Q) of the total variance for initial submovements. Thus, while the average firing rate changes were smaller for corrective submovements and consistent with the smaller movement speeds, the total amount of firing rate modulation that occurred for all the various submovements was nearly as large for the corrective ones as it was for the initial.

Mean firing rate relative to peak cursor speed. A) The firing rate for all spiking units was averaged for all initial (blue) and corrective (red) submovements. Circles indicate the time of peak firing rate for each condition. B) Average firing rates for 10 example spiking units time aligned for all initial (left) and corrective (right) submovements. Arrows indicate peaks in firing rate for two example units.
A simple speed tuning model with all neurons having the same time lag would show a synchronized increase and decrease of all condition-independent firing rates simultaneously. However, when examining average firing rates from 10 example neurons from one recording session from monkey P aligned to peak speed, we see heterogenous timing of the rise and fall relative to the peak speed (Figure 3B). This relationship tended to be conserved across initial and corrective movements. For example, the peak firing rate of the orange neuron (identified by gold arrows) peaked 210 and 170 ms before initial and corrective peak speeds, respectively, while the gold neuron (gold arrows) peak firing rates were 90 and 40 ms peak movement speed. This suggests that the condition-independent neural activity across the neurons might form a repeatable temporal structure—a neural trajectory—that is more complex than a simultaneous rise and fall in firing rate across the population.
Trajectories in Neural Space
To examine the structure of the condition-independent neural trajectory for initial and corrective submovements, the distances in the neural space—differences in firing rates—between various time points was calculated and visualized using multidimensional scaling. Multidimensional scaling identifies a low-dimensional subspace while preserving the distance between original high-dimensional datapoints as well as possible. If there was global modulation of firing rate, all the change in condition-independent firing rates would occur along a single dimension. However, a more complex or cyclic trajectory would indicate repeatable dynamics within the population of neurons. The time points of −450, −300, −150, 0, and +150ms relative to peak speed were examined. These times were selected because the highest global firing rate occurred at approximately −150 ms before peak speed, −450 and +150 ms were times of low firing rates, and −300 and 0 ms were times of intermediate firing rates as shown in Figure 3. Yet we observe in Figure 4 that the average distance in the neural space (i.e. difference in all spiking units’ firing rates) between the times of intermediate firing rates (−300 and 0 ms), was only slightly less than the distance between 300 ms intervals with low versus high (−450 and −150 ms) or high versus low (−150 and +150 ms) firing rates, for both initial and corrective submovements. This almost circular neural trajectory—a width nearly equal to height—demonstrates that the condition-independent activity does not occur as a single rise and fall in global firing rate, but rather as a neural trajectory with certain neuron’s firing rates modulating earlier relative to movement while others modulate later.

Neural distance between condition-independent firing rates. The differences between average firing rates (in arbitrary units) for initial (blue) and corrective (red) for times before (−) and after (+) peak speed (0ms). Distances are shown for three timepoint pairs: −450ms & −150ms, −300 & 0ms, and −150ms & 150ms. The trajectories and distances are shown as a two-dimensional approximation of the high-dimensional neural space using multidimensional scaling. The dimensions for each panel were derived independently with no relationship across panels.

Neural trajectories shown in 6-dimensions identified with multidimensional scaling. Firing rates for each unit were time-aligned relative to peak speed and averaged across all initial and corrective submovements separately to generate two condition-independent trajectories. The two—initial and corrective—high-dimensional trajectories were concatenated in time and submitted to classical multidimensional scaling to create a common 6-dimensional neural space. Each trajectory starts at the open triangle and ends at the open square. The filled circle signify 150 ms steps of −450, −300, −150, 0, and 150ms relative to peak speed.
To visualize the high-dimensional firing rates for all recorded spiking units, multidimensional scaling was used to plot the average firing rates of initial and corrective movements in a common 6-dimensional subspace. A complex, multidimensional trajectory was indeed observed for both monkeys. With the initial movements, the average neural activity began (blue triangle) in one region of the neural space before curling into a cyclic trajectory. The corrective neural activity tended to start (red triangle) at a point near the end of the initial trajectory (blue square) and formed a smaller but similar shaped cyclic trajectory in the same region of neural activity that occurred during the later portion of the initial reach. The initial and corrective submovements formed cyclic trajectories in a hyperplane with some but not did not overlap completely in their features, i.e. the neural trajectories were neither completely parallel nor completely orthogonal.
Consistent Neural Dynamics
Despite the smaller magnitude of the condition-independent neural activity during corrective movements, it appeared likely that a portion of neural activity was repeatable and common for both initial and corrective submovements. To further test this, we built a simple first-order dynamical system model using the neural firing rates from both initial and corrective submovements to characterize any common temporal dynamics that might be present. The neural firing rates were again averaged across all movement directions to examine only the common condition-independent activity. The plane in the neural space with the most rotational neural activity was identified using jPCA. We labeled the two neural dimensions with the most rotational condition-independent activity as CIx and CIy. To compare consistently across recording sessions as well as monkeys, the pair of dimensions were rotated so CIx aligned most closely with the time course of average increase in firing rate (shown in Fig 3A).
The average firing rate for all initial and corrective submovements in our identified CI plane are shown in Figure 6. The CIx and CIy dimensions are plotted as a function of time in Figure 6B while the neural trajectory in the 2-dimensional CIx/CIy plane are shown in Figure 6A. Considering the initial versus corrective submovements, the peaks and troughs of both CIx and CIy relative to peak speed, while differing in magnitude were similar in their timing. The peak in the CIx dimension—defined as the dimension in the plane that best correlated with the global average firing rate of the population—occurred approximately 150-200 ms before peak speed for both initial and corrective submovements, whereas the peak in the CIy dimension occurred near the time of peak speed for both. The initial and corrective neural trajectories are very similar in their shape and direction of rotation within the plane, with the trajectories for corrective submovements resembling a smaller, scaled version of the larger trajectories for initial submovements.

Average firing rate in CIx/CIy plane. A) The average firing rate for initial and corrective submovements are plotted in the CIx/CIy plane identified with jPCA. The trajectories start at the triangles and end at the squares. Each filled circle is a 150 ms time step. B). Average CIx (solid lines) and CIy (dashed lines) plotted as a function of time relative to average cursor speed (dotted lines).
The instantaneous phases of CIx and CIy activity were calculated using the Hilbert transform. The average phase of this neural activity is shown in Figure 7A. The phase of CIx (solid lines) and that of CIy (dashed lines) each were similar for both initial and corrective submovements, with the zero phase of CIx occurring about 150 ms before the peak speed while CIy lagged by approximate π/2 with the zero crossing around peak speed. Histograms of the phase of CIx and of CIy at peak speed on individual trials is shown in Figure 7B. Mean values of CIx were 0.40π (initial) and 0.43π (corrective) for monkey P and 0.31π (initial) and 0.44π (corrective) for monkey Q. Mean values of CIy were −0.09π (initial) and −0.10π (corrective) for monkey P and −0.11π (initial) and 0.01π (corrective) for monkey Q. Thus, there was a clear relationship between peak speed and the phase of condition-independent activity. CIx leads peak speed by ~ π/2 whereas CIy peaks close to peak speed. Similarly, the time when the phase of CIx = 0 and CIy = - π/2 was observed to occur 150-200 ms before the peak speed for most initial and corrective submovements.
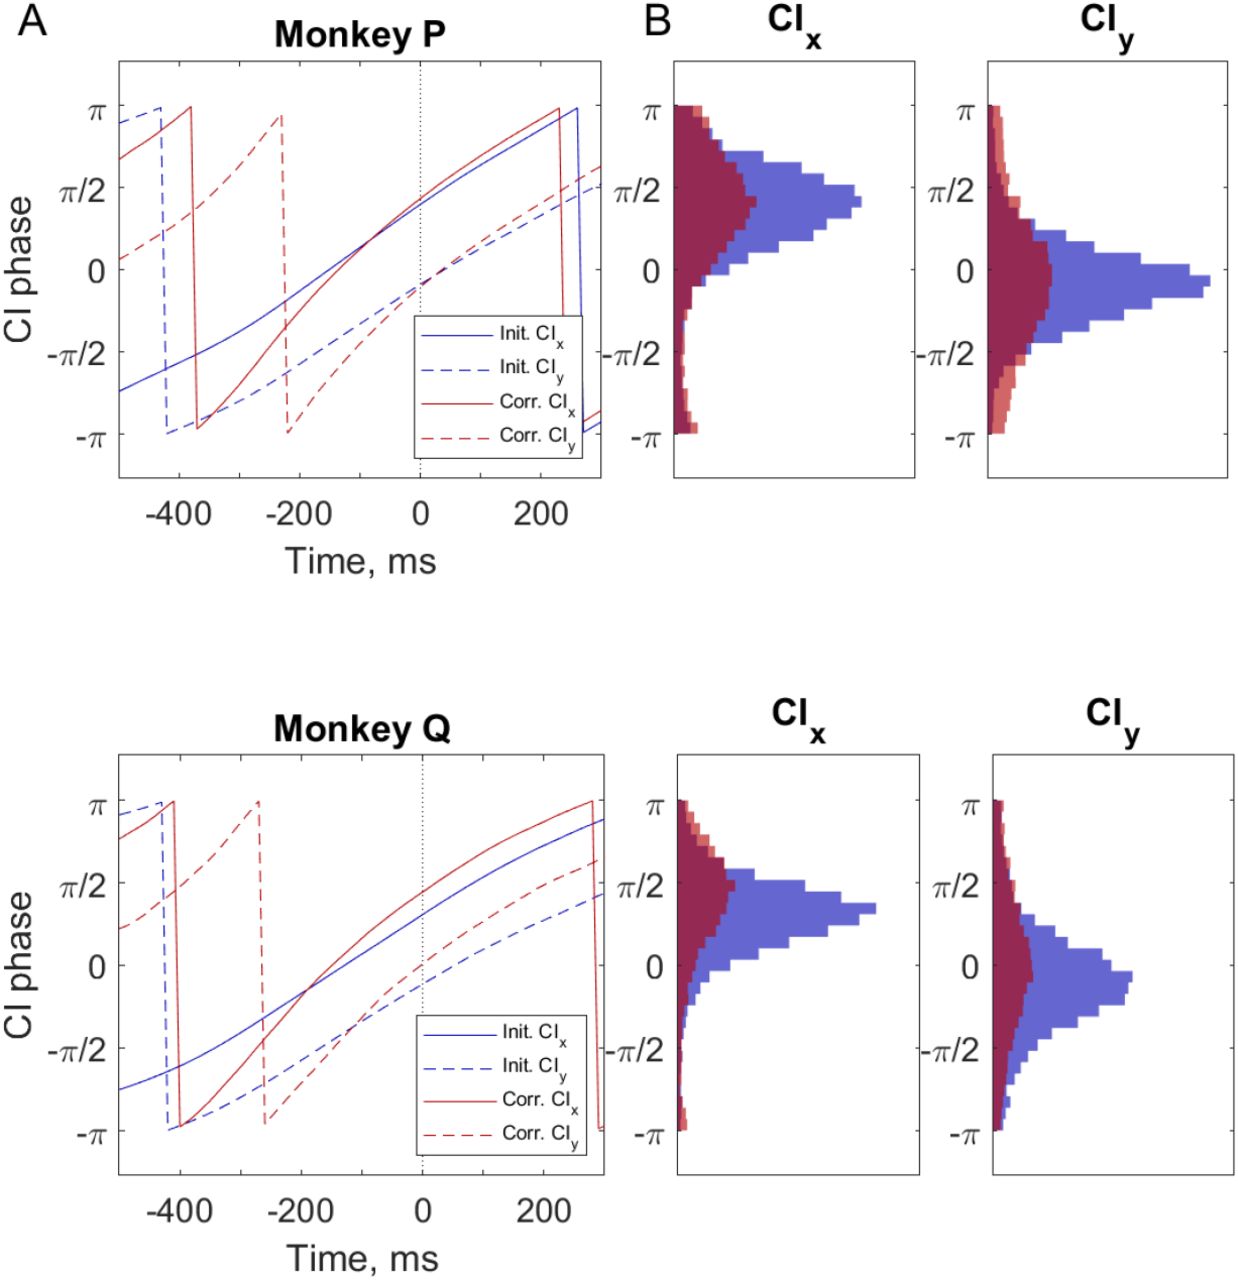
Phase of CIx and CIy relative to peak cursor speed. A) Average phase of CIx (solid lines) and CIy (dashed lines) time-aligned to peak speed (Time = 0) for all initial (blue) and corrective (red) submovements. B) Histogram of the phase of CIx and CIy at the time of peak speed for initial (blue) and corrective (red) submovements. All distibutions of CIx and CIy were non-uniformly distributed at peak speed (Rayleigh test, all p < 0.001).
Since the phase in the CI plane appeared to predict upcoming speed peaks, we next wanted to compare this estimate of the timing of speed peaks to using the global sum of the firing rates across the population. We created a metric we call the condition-independent phase (CIφ) by averaging the phase of CIx and phase of CIy + π/2 to calculate the current phase in the CI plane. Figure 8A illustrates the temporal distribution of CIφ relative to the time of peak speed. These distributions consistently peaked 100-150 ms before the speed peak for both initial and corrective submovements. A relatively consistent relationship between neural activity in this CIx/CIy plane and peak speed thus was present for both initial and corrective submovements across all trials regardless of target size or reach direction.

Relationship between CIφ and cursor speed. Identifying the times of peak speeds with a dynamical systems model (A) or with an instantaneous firing rates (B). The time point when CIφ = 0 (A) or peak firing rate (B) was used as a prediction of the upcoming submovement. Each histogram shows only those submovements for which the neural data aligned with the movement data, i.e. CIφ = 0 (A) or maximum firing rate (B) occurred within the time range examined (−300 to 100 ms relative to submovement peak speed). The percentage of total aligned trials is shown for each distribution as well as the standard deviation (σ) for the aligned trials. In all cases, the dynamical systems model predictions were more precise, with a narrower standard deviation (F-test, all p<0.001 for both initial and corrective submovements for both monkeys) and fewer unaligned trials. C) Cursor speed is plotted as a function of CIφ for all individual trials with at least one corrective submovement. The average speed as a function of CIφ is shown in white, illustrating the oscillation in cursor speed depending on the phase of neural activity. The circular correlations between CIφ and cursor speed for all corrective trials were 0.43 and 0.42 for monkeys P and Q, respectively, p<0.001 in both cases.
For comparison with these results from the dynamical system model, we built a simple linear regression model to estimate peak speed with a weighted sum of the instantaneous firing rate of all spiking units. Using this model, we could calculate when the peak firing rate across the neural population occurred relative to the peak speed. Figure 8B shows the temporal distributions of peak firing rate relative to peak speed for both initial and corrective submovements. Like the distributions using the dynamical model above (Figure 8A), those for the firing rate model peaked 150 to 100 ms before peak speed. The peaks were broader by 15-20 ms, however, as characterized by the corresponding standard deviations (σ) given for each distribution in the figure. Furthermore, for both the dynamical systems and firing rate models, a small fraction of submovements did not have a CIφ=0 or peak in the firing rate, respectively, within the −300 to 100 ms time window illustrated. The percentage of these unaligned trials (given in the figure) was consistently larger for the firing rate model. Thus, using the temporal dynamics of the neural population significantly improved our prediction of the timing of the submovements as compared to using only instantaneous firing rates.
Finally, we examined directly the relationship between cursor speed and the phase of neural activity in the identified rotational CIx/CIy plane. In figure 8C, we plot the cursor speed as a function of CIφ. While the CIφ is an angle that ranges between +/-π radians when calculated, it was useful to use a continuous CIφ to count the number of cycles as it progressed during a trial. Each increase of 2π in CIφ represents one rotation of neural activity in the CIx/CIy plane. The speed of movement clearly oscillates with the cyclic neural activity, with the cursor speeds for most trials rising and falling in 2π cycles of CIφ. The circular correlation between speed and CIφ was 0.43 and 0.42 (p<0.001) with the largest speeds occurring at CIφ = 0.42π and 0.30π (+2kπ) for monkeys P and Q, respectively. Both the cyclic average speed (white) and the non-uniform occurrence of peak speeds in individual trials (black) demonstrate that movement speed was consistently correlated with cyclic, condition-independent brain activity.
Discussion
A consistent relationship with cyclic, condition-independent brain activity preceding both initial and corrective reaching movements was observed. The precision center-out task utilized small targets to elicit many trials that were not completed in an initial reach and required corrective movements. The speed profiles of these corrective movements aligned with cyclic activity in primary motor cortex suggesting a useful neural marker of the encoding of a series of submovements. Discrete submovements defined by multiple speed peaks have previously been described in behavioral studies of reaching (Pratt et al., 1994; Lee et al., 1997; Hatsopoulos et al., 2007; Polyakov et al., 2009), turning a knob (Novak et al., 2000), isometric contractions (Massey et al., 1992; Hall et al., 2014), and object manipulation for tactile discrimination (Pruszynski et al., 2018). The experimental results and analysis presented here provide new evidence of a relationship between neural activity and behaviorally observed submovements.
Distinct movement speed peaks with corrective movements
In the precision center-out task presented here, the monkeys’ movements showed consistent bell-shaped speed profiles. These speed profiles were true for both the larger initial movements from the center toward the target as well as all subsequent corrective movements. A large majority of both initial and corrective submovements had durations of 100-350 ms. For initial movements, the movement duration was longer for slower reach speed, which was likely due to the reach target being the same distance for all trials. For corrective movements, there was no relationship between movement duration and speed with all submovements being approximately the same duration regardless of speed.
Similar but smaller condition-independent activity for corrective movements
The magnitude of the condition-independent neural activity that occurred for corrective submovements was approximately one-third to one-half the magnitude of that for the initial submovements. This decreased change in average firing rate approximately matched the decrease in movement speed for the corrective compared to the initial submovements suggesting speed tuning of the condition-independent activity. This does not imply, however, that each individual trial and each individual neuron have smaller changes of firing rate during smaller amplitude movements. In fact, the overall total variance of firing rates—the combined condition-independent activity, condition-dependent encoding of task variables such as reach direction or target location, and unexplained noise—for corrective submovements was nearly the same magnitude (>95%) of the initial submovement. Only when averaging firing rates—time aligned to the peak movement speed or the decoded condition-independent phase—were the differences in modulation in firing rate between initial and corrective movements apparent. On average, the encoding of movement speed is clearly present in primary motor cortex. By identifying the neural dimensions with condition-independent activity, it is possible to identify this speed dependent encoding. Yet precisely identifying encoded speed on a trial by trial basis within the neural activity remains challenging.
Condition-independent neural activity previously has been observed in motor tasks that are overtrained to be consistent across trials (Kaufman et al., 2016; Kobak et al., 2016; Rouse and Schieber, 2018). Here, in a precision center-out task with considerable trial-to-trial variability, the condition-independent neural dynamics were observed to be similar for both initial as well as corrective movements and were cyclic. The orientation and direction of the cyclic neural modulation was similar with the corrective submovements having a smaller amplitude on average. Large condition-independent activity has been suggested to make brain dynamics more robust to noise by increasing the differences in neural signals even when the muscle activation pattern at certain time points look very similar (Russo et al., 2018). In the context of corrective movements for a precision task, one might speculate cyclic brain dynamics organize movements into distinct submovements to create time-varying neural and musculoskeletal dynamics that are more predictable and robust to noise.
Condition-independent phase predictive of cursor speed
The cyclic CIφ values aligned with cursor speed. This further confirmed the observed cyclic neural dynamics were behaviorally relevant. The cursor speed peaks and troughs corresponded to a particular CIφ values further suggesting the encoding of the corrective movements were cyclic with separate submovements. Rather than continuously moving the hand toward the target at all times, the subjects’ movements appeared as pulsatile bursts of joystick movement and presumably muscle contraction.
It is difficult to determine how much of the cyclic brain activity and behavior observed is caused by intrinsic neural dynamics in M1 compared to sensorimotor feedback control and/or cognitive strategy. Observations of additional submovements defined by second or third speed peaks does not necessarily require a feedback controller with discrete updates. A single, continuous optimal feedback controller with appropriate delays and signal dependent noise can also generate additional submovements with multiple speed peaks (Li et al., 2018). Recent results by Jackson et al. (2018) argue that extrinsic effects of a task interact with the intrinsic dynamics of the brain in a manner consistent with an optimal feedback controller and may provide a framework for assessing these effects across a variety of tasks including our precision center-out task. While difficult to determine in a single task how much the observed behavior is the result of a cognitive strategy for the given task versus intrinsic sensorimotor cortical dynamics control, the observed results highlight the importance of cyclic neural dynamics in M1 in at least some corrective tasks. Further work examining neural activity in various tasks and/or additional sensorimotor brain areas may lead to clearer descriptions of the relationship between sensorimotor control and motor execution of precise, corrective movements.
The cyclic dynamics of corrective movements have important implications for brain-computer interfaces (BCI). To date, most BCI decoders are time-invariant to the timing of any single movement and when multi-part movements or corrective movements occur. The decoders are typically built initially with observed or imagined movements that assume single, straight-line movements. When algorithms for updating BCI decoders consider the change in movement direction for corrective movements, it is assumed the intended path is updated continuously (Gilja et al., 2012; Shanechi et al., 2016). Experiments have suggested that BCI control can be improved with two states: active control and rest (Kim et al., 2011; Williams et al., 2013, 2016; Sachs et al., 2016). The ability to predict the phase of a movement—like CIφ presented here—might further allow for much better prediction of when the subject intends to move, contact the target, and make a corrective movement. The cyclic dynamics of the condition-independent neural activity may also lead to better descriptions of the condition-dependent activity that encode task features, specifically the observation that direction encoding is often not fixed but shifts with different phases of movement (Churchland and Shenoy, 2007; Suminski et al., 2015; Suway et al., 2017), enabling decoders of movement direction that change with time. All leading to a more robust description of the of neural encoding of precise and corrective movements.
Mathematics and Equations
Calculation of jPCA plane and Condition-Independent Phase
Since the trial data contains corrective movements in addition to the large initial movements that were not precisely time aligned to trial events for averaging condition-independent neural activity, we developed a novel algorithm to iteratively average the firing rates, calculate CIφ, then average the firing rates again based on the CIφ. This iterative process involves three steps: i) Each unit’s firing rate is averaged across all trials to determine its condition-independent firing rate. ii) Dimensionality reduction is performed using PCA and jPCA on the condition-independent firing rates to identify the neural plane with the most rotational/cyclic condition-independent activity. iii) The instantaneous phase is calculated using the Hilbert transform on the first two jPC dimensions for all data points. A schematic of the iterative algorithm is shown in Figure A1.
i) Trial averaging to identify condition-independent activity
The condition-independent neural activity is the average firing rate for each recorded spiking unit for all experimental trials regardless of the movement condition (ie target location). For classic neurophysiology experiments, this can be calculated by averaging time-aligned data. However, since trials were of varying durations and many included corrective movements, simple time alignment of trials was difficult. Data was therefore aligned based on each time-point’s calculated CIφ rather than absolute time.
Since CIφ depends on the averaged condition-independent activity and the condition-independent activity was averaged by CIφ alignment, an iterative approach was required. An initial estimate using simple time-alignment averaging of all initial and corrective submovements was used for the first iteration. For each subsequent iteration, the condition-independent firing rates for each unit were calculated by averaging all data points when the CIφ values were similar. The average firing rate was estimated using a sliding window of CIφ values with a step size of π/50 and a window size of π/25 to generate 100 equally spaced samples ranging from −π to π.
ii) PCA and jPCA to identify rotational/cyclic neural activity
Next, the condition-independent firing rates were submitted to PCA and jPCA (Churchland et al., 2012) to identify the neural dimensions with the most cyclic activity. PCA was performed on the high-dimensional neural space to reduce the condition-independent firing rates to the six dimensions with the most variance. jPCA was then performed on this six-dimensional space. jPCA is a dimensionality reduction technique to identify the neural planes with the most rotational activity and is more fully described in Churchland et al (2012). Briefly, jPCA fits a first order dynamical system model to the neural activity:
 to predict change in firing rate
  based on the current firing rate (X). The transform matrix of this model (A) can be separated into a symmetric matrix representing pure scaling and a skew-symmetric matrix representing pure rotational dynamics. By taking the eigendecomposition of the skew-symmetric matrix, we obtain pairs of purely imaginary eigenvalues and corresponding eigenvectors that define planes of rotation in the neural space rank-ordered from greatest to least rotation. In the present analysis, only the first plane with the greatest condition-independent rotation was used and we defined the two dimensions of the plane as CIx and CIy. Additionally, to obtain a consistent CIφ across recording sessions, CIx was defined as the dimension in the CIx/CIy plane with the most variance. The positive CIx direction was defined as having more positive than negative coefficients in the neural space which corresponds to the direction where more units have an increased firing rate. Choosing this convention causes an increase in CIx to generally align with the onset of initial movement, since a majority of units increase firing rates at the onset of movement.
iii) Instantaneous phase estimate
Finally, the instantaneous phase were estimated by i) bidirectional bandpass filtering of the activity in both the CIx and CIy dimensions between 0.5-5 Hz with a 1st order Butterworth filter, ii) performing the Hilbert transform of both filtered signal (sx and sy) to generate a transformed signal  that is a 90° phase shift of every Fourier component in the frequency domain to create an analytic representation of CIx and CIy, and iii) calculating the angle of the resulting analytic signal
  to estimate the instantaneous phase in each dimension, and iv) which we then sum (with a
  phase shift added to ϕy) to obtain a single instantaneous phase estimate for the neural activity within the plane which we call the condition-independent phase (CIφ).

The bandpass filtering reduces the low-frequency drift and high-frequency variability in CIx to generate a more consistent subsequent phase estimate. The condition-independent phase (CIφ) thus represents the instantaneous phase in the dimension of the neural space that has the most cyclic, condition-independent activity.
Matlab code to calculate the CIφ is available at: https://github.com/arouseKUMC/CIphase

Schematic of CIϕ estimation. The cyclic condition-independent neural activity was estimated using an iterative technique. After initial time-alignment and averaging of the firing rates, PCA and jPCA was performed to estimate the dimensions neural activity with the greatest cyclic condition-activity were identified. Using the phase of this first jPC dimension, the firing rates were realigned for averaging. The PCA and jPCA were again performed a total of three times. The final CIϕ was then used for the presented analysis.
Footnotes
Conflict of Interest: The authors declare no competing financial interests.
Significant changes of the analysis have been made. All analysis now time aligns to peak cursor speed as the behavioral marker.
References


